deliverable d7.4: final assessment of the economic, social ...biocore-europe.org/file/d7_4 final...
TRANSCRIPT

1
BIOCORE
BIOCOmmodity refinery
Grant agreement no.: FP7-241566
Collaborative project
Seventh framework programme
BIOREFINERY
Due date: August 31st 2013
Actual submission date:
Project start date: March1st, 2010 Duration: 48 months
Workpackage concerned: WP7
Concerned workpackage leader: IFEU
Names of the responsible authors & organizations: Stephan Piotrowski, Michael Carus,
Fabrizo Sibilla and Janpeter Beckmann (NOVA), Shilpi Kapur, Souvik Bhattacharjya and
Ipsita Kumar (TERI), Rocio Diaz-Chavez (IMPERIAL)
Dissemination level: PU
Deliverable D7.4: Final assessment of the economic,
social/legal/political sustainability of the BIOCORE biorefining system

2
TABLE OF CONTENTS
1 INTRODUCTION ......................................................................................................................................... 4
2 INTEGRATION OF TASK 7.3 AND 7.4 IN THE OVERALL SUSTAINABILITY ASSESSMENT
AND HARMONIZATION OF BIOCORE .................................................................................................. 5 2.1 SYSTEM BOUNDARIES ............................................................................................................................................ 5 2.2 TECHNICAL REFERENCE ........................................................................................................................................ 5 2.3 TIME FRAME ............................................................................................................................................................ 5 2.4 GEOGRAPHICAL COVERAGE ................................................................................................................................... 6 2.5 FUNCTIONAL UNIT .................................................................................................................................................. 7 2.6 INTER-PROJECT HARMONIZATION ....................................................................................................................... 7
3 ECONOMIC SUSTAINABILITY ASSESSMENT (TASK 7.3) .............................................................. 8 3.1 RESEARCH METHODOLOGY AND FRAMEWORK .................................................................................................. 8
3.1.1 Outline of the BIOCORE CAPEX model ..................................................................................................... 8 3.1.2 Outline of the BIOCORE OPEX model ...................................................................................................... 11 3.1.3 Market analysis, product prices and GreenPremium...................................................................... 18
3.1.4 Economic performance measures ............................................................................................................... 22
3.1.5 Strategies for reaching profitability targets........................................................................................... 23
3.2 THE DATASET ....................................................................................................................................................... 24 3.3 ECONOMIC SUSTAINABILITY ASSESSMENT – RESULTS .................................................................................. 27
3.3.1 Results of the market analysis on product prices (incl. GreenPremium) .............................. 27 3.3.2 Results on CAPEX ............................................................................................................................................. 35 3.3.3 Results on OPEX ................................................................................................................................................ 36 3.3.4 Direct comparison of selected scenarios and discussion ............................................................... 47 3.3.5 Results on economic sustainability of assessed BIOCORE value chains ................................. 52
3.4 CONCLUSIONS AND OUTLOOK ............................................................................................................................ 56
4 SOCIAL, POLITICAL AND LEGAL SUSTAINABILITY ASSESSMENT (TASK 7.4) ................... 59 4.1 RESEARCH METHODOLOGY AND FRAMEWORK ............................................................................................... 59
4.1.1 Assessment of social, legal and political sustainability:
Background and state of the art............................................................................................................... 60 4.1.2 Stakeholder Categorization ........................................................................................................................ 61 4.1.3 Analytic Hierarchy Process (AHP) ........................................................................................................... 62 4.1.4 Social Life Cycle Assessment (SLCA) Framework ............................................................................. 64 4.1.5 Questionnaires and Surveys ........................................................................................................................ 66
4.2 BACKGROUND OF THE STUDY SITES .................................................................................................................. 66 4.2.1 India ....................................................................................................................................................................... 67 4.2.2 Hungary ............................................................................................................................................................... 70 4.2.3 France ................................................................................................................................................................... 71 4.2.4 Germany ............................................................................................................................................................... 73
4.3 LEGAL AND POLICY ASSESSMENT – RESULTS ................................................................................................. 74 4.3.1 Case of India ....................................................................................................................................................... 74 4.3.2 Case of Europe ................................................................................................................................................... 80

3
4.4 SOCIAL SUSTAINABILITY ASSESSMENT – RESULTS ....................................................................................... 91 4.4.1 Results of social ‘sustainability assessment’ based on Multi-Criteria Analysis approach
(using AHP) – Case of India ........................................................................................................................ 91 4.4.2 Results of social ‘sustainability assessment’ based on a combined approach of Social
Impact Assessment (SIA) and Social Life Cycle Assessment (SLCA) ......................................... 98 4.4.3 Overall assessment ....................................................................................................................................... 104
4.5 DISCUSSION OF RESULTS, CONCLUSIONS AND OUTLOOK ............................................................................ 110 4.5.1 Legal and policy assessment .................................................................................................................... 110 4.5.2 Social sustainability assessment ............................................................................................................ 110
5 REFERENCES .......................................................................................................................................... 113
4
1 Introduction
All bio-refineries need to be assessed through the entire value chain for environmental,
economic, and social sustainability. Impacts across the three sustainability domains
(economic, social and environmental) govern the potential benefits and risks that may accrue
to society, especially local communities that are closely associated, or indirectly affected, by
adoption of these technological systems. On the other hand, legal and political structures and
norms as they exist at the local, state and national levels at the proposed location of the bio-
refinery will influence the success and failure of the industrial intervention by creating
different levels, nature of impact on economic, social and environmental domains of
sustainability.
This deliverable provides the final assessment of the economic, social/legal/political
sustainability of the BIOCORE biorefining system. These assessments have been conducted
in Tasks 7.3 (Economic assessment and market analysis) and 7.4 (Social, legal, and political
assessment) in the project.
Both tasks ran from M10 (December 2010) to M42 (August 2013). Task 7.3 under the lead of
NOVA assessed the economic implications associated with the BIOCORE systems and the
most promising reference systems. Task 7.4, under the leadership of TERI assessed the
possible social impacts of BIOCORE bio-refinery systems as well as the legal and political
constraints, bottlenecks and driving forces towards a significant increase of bio-based
BIOCORE systems.

5
2 Integration of Task 7.3 and 7.4 in the overall sustainability assessment and
harmonization of BIOCORE
The Interim Report on Sustainability Benchmarking provided by IFEU and IUS (last version
dated 30 June 2011) described a number of common settings for sustainability assessment.
Further specifications and system descriptions have been provided by IFEU for the final
dataset (IFEU 2013 and IFEU 2013a). These are described briefly below and comments are
made as to how these settings have been complied within Tasks 7.3 and 7.4.
2.1 System boundaries
According to the interim report by IFEU and IUS, system boundaries specify which unit
processes are part of the product system and are thus included in the assessment, e.g.
whether the entire - or a partial - life cycle will be analysed.
The proposal for the sustainability assessment in BIOCORE foresees to take into account the
entire value chain (life cycle) from cradle to grave, i.e. from biomass production to the
distribution and usage of final products. The economic data for the product life cycle up to
the biorefinery gate is provided by WP1.
The focus of the techno-economic evaluation in Task 7.3 is on the biorefinery plant itself and
more specifically on a defined set of model biorefinery schemes.
The boundary conditions in Task 7.4 are similar to the environmental LCA characteristics of
defining a system boundary covering: (1) biomass collection/growth, (2) transportation and
storage, (3) biorefinery, (4) transportation and distribution, and (5) use. The biorefinery
products are compared to conventional reference products to find out their relative social
sustainability and understanding the associated legal and political sustainability
implications, but the boundary excludes the use and end phase of the product.
2.2 Technical reference
According to the Interim Report on Sustainability Benchmarking, the technical reference
describes the technology to be assessed in terms of plant capacity and development
status/maturity. The plant capacities have been decided on together with the case study
regions (see below). According to the proposal, two development statuses: “early
implementation industrial plant”, and “mature, full industrial plant” were to be considered
so that each corresponds to a future point in time (see below).
In the final dataset, only the mature technology has been assessed in order to allow for a fair
comparison of biorefineries to existing technology (IFEU 2013a).
2.3 Time frame
According to IFEU 2013a, the reference time for the mature biorefinery was set to 2025. As
IFEU 2013a notes, this time was set because a whole “ecosystem” of biomass provision,

6
conversion technology and adaption of consumer products to new biobased intermediates
and polymers as raw materials will not be established within a few years from now. Besides
the development status of the biomaterials sector, other sectors will also change by 2025,
especially, for example the energy sector. Since these changes imply too many uncertainties
to be handled with, both Task 7.3 and 7.4 do not model this time frame explicitly but only
make isolated projections where possible.
2.4 Geographical coverage
WP1 has proposed five case study regions with combinations of feedstocks and capacities
and these have been agreed upon by the whole consortium (Table 1). The assessment in Task
7.3 implies an implementation of the BIOCORE schemes in any of these locations. However,
the actual calculations are more of a generic nature since the basic assumption of the
sustainability assessment is that a BIOCORE plant could be implemented in any location.
The main scenarios are based on European conditions. The scenarios dealing with rice straw,
which is a promising feedstock in India, are modelled according to Indian conditions.
Furthermore, the assessment only covers domestic biomass production. I.e: imported
biomass from outside Europe and India, respectively, is not considered as a feedstock for the
BIOCORE biorefineries.
Table 1: Regional case studies
Property France Germany Hungary India 1 India 2
Location Beauce Mid-West South-West Barnala
(Sangrur)
Faridkot
Main
feedstock
Wheat straw Hardwood
(diameter > 5
cm)
Straw/SRC
poplar/Hardw
ood
Rice/wheat
straws
Rice/wheat
straws
Additional
feedstock
Niche crops
(miscanthus)
0-20%
Softwood 0-
10%
Ratio changed Ratio changed Ratio changed
Capacity* 150 150 150 150 & 500 150
Study
partner
SOLAGRO NOVA SZIE TERI TERI
* 1,000 t of dry feedstock
For Task 7.4, based on the initial understanding of the situation and scope and timeline of the
project, collection of primary data through scoping studies, site visits surveys, interviews
and focus group discussions with multiple stakeholders was done in the sites in India and
use of available secondary information was made for the European case study sites.

7
2.5 Functional unit
The functional unit determines how results are presented and interpreted. While it will be
usually possible to convert results into other units, it is still helpful to agree on common
functional units. The proposal by IFEU and IUS was to base results on
• 1 tonne of dry biomass (raw material basis) and
• 1 ha of land (area basis).
In the case of Task 7.3, all results can easily be expressed per tonne of dry biomass input
since the input capacities are given. Since yields of the considered feedstocks vary widely
between locations and since both primary feedstocks and residues as well as agricultural and
forestry biomasses are taken into account, a conversion per ha of land has not been made.
The social assessment using the sLCA will be oriented and expressed in functional units as
far as possible, but it is not possible to do the assessment based on the functional units
proposed above for all social indicators.
2.6 Inter-project harmonization
As for the environmental sustainability assessment and as requested by the EC, both Task 7.3
and 7.4 had made an effort to harmonize their methodologies with the two other FP7-
biorefinery projects, Eurobioref and Suprabio (Piotrowski et al. 2012). Boths tasks have had
active exchanges and meetings with both other projects and have agreed on a number of
issues that could or could not be harmonized.

8
3 Economic sustainability assessment (Task 7.3)
The economic evaluation of an investment project for an industrial process includes the
estimation of investment and operating costs, revenues, profits and other performance
indicators.
The level of detail in which Task 7.3 was able to conduct the economic evaluation depended
on data availability for those processes that had been developed in BIOCORE. Main partners
for data exchange were IFEU and NTUA. The final data set provided by IFEU constituted the
basis for the whole sustainability assessment in WP7 (IFEU 2013).
3.1 Research methodology and framework
A techno-economic evaluation typically aims to answer a number of interrelated questions
about an industrial process. These usually are:
1. What is the overall economic performance of the whole project?
2. What contributions do single cost items have on the overall costs?
3. What are the total costs of the main process steps?
4. What is the economic performance of a specific product?
To answer the first question, the biorefinery processes themselves can be regarded as a
“black box” with certain inputs and outputs. Total revenue is calculated by multiplication of
physical outputs and market prices obtained from the market research and balanced against
total costs. These market prices may or may not include a “GreenPremium” (see section
3.1.3) of a certain level. Since it is likely that some of the biorefinery concepts will not be
economically viable without support, this analysis includes the assessment of the necessary
level of subsidies.
The second question is also within the scope of Task 7.3 as will be shown below. The third
and fourth question, however, would require an allocation of mass and energy flows,
revenues and costs to single process steps and products. Each biorefinery scheme is a
multifunctional system, i.e. one that delivers several goods and/or services, or, simplified,
“co-products”. In the case of a multi-output process, the problem of allocation of costs arises
if one wants to make a statement about the production costs of one single output. Since the
biorefinery process streams are interrelated, it is not straightforward how to accomplish this
allocation. Also a substitution approach, which requires that for each multi-product process,
one of the products can be clearly identified as the main product and all others as co-
products is not straightforward for the techno-economic assessment. The techno-economic
assessment therefore focuses on the assessment of each biorefinery scheme as a whole.
3.1.1 Outline of the BIOCORE CAPEX model
The total investment needed for a project, also called Capital Expenditues (CAPEX), can be
roughly divided into the sum of the fixed capital investment (FCI) and working capital
investment (WCI).
9
According to Sinnott 1999 (p. 243), the FCI is the total cost of the plant ready for start-up. It
includes the cost of:
1. Design, and other engineering and construction supervision,
2. All items of equipment and their installation,
3. All piping, instrumentation and control systems,
4. Buildings and structures,
5. Auxiliary facilities, such as utilities, land and civil engineering work.
The FCI is a once-only cost that is not recovered at the end of the project life, other than the
scrap value. The FCI includes the complete construction cost of the plant with all its
processing and handling equipment as well as its ground preparation and non-process
structures and equipment.
FCI would also include the investment for purchasing land to build the plant on. However,
this investment is left out of the analysis of BIOCORE for two reasons: First, the surface area
needed for the plant is unknown. Second, the sustainability assessment should be location
independent and the cost for land varies widely between locations. Land is the only part of
the FCI that is not depreciable so that the remainder constitutes the depreciable FCI.
The WCI includes the initial cost of resources, such as feedstock and catalyst, as well as
money required for labour and services required to start operation of the plant. WCI is the
additional investment needed, over and above the fixed capital, to start up the plant and
operate it to the point when income is earned. It includes the cost of:
1. Start-up.
2. Initial catalyst charges.
3. Raw materials and intermediates in the process.
4. Finished product inventories.
5. Funds to cover outstanding accounts from customers.
A typical figure for the working capital of petrochemical plants is 15% of the fixed capital, i.e.
about 13% of the total investment. According to Peters and Timmerhaus 1991, typical values
for the WCI are between 15-20% of the FCI. However, this estimate has been made for
conventional chemical plants. For biorefineries, the estimate of the WCI may be different. For
example, Humbird et al. 2011 chose an estimate of 5% of the FCI for their lignocellulosic
biomass to ethanol production plant (Humbird et al. 2011, p. 68). In the inter-project
harmonization document for the economic assessment, a value of 4% has been chosen for the
base case (Piotrowski et al. 2012).
Due to the very early design stage of the BIOCORE processes, it is not possible to calculate
CAPEX directly from the plant design. However, there are several methods to rapidly
estimate total investments costs (see e.g. Sinnott 1999, p. 248f.).
Additionally to such methods, Lange 2001 showed that the “power loss” of a process,
defined as the difference between the Lower Heating Values (LHV) of the plant intake
(including feed and fuel streams) and that of the product stream leaving the plant, is a good
indicator for plant investment costs. Therefore, the energy balance, known from the process
flow sheets, can be used as a first approximation of investment costs. However, Lange 2001

10
also showed that this relation is less reliable for small-scale, heat-neutral reactions and in the
case of batch processes used for manufacturing fine and specialty chemicals.
Lange 2001 also presented a second correlation approach for estimating the fixed capital
investment (FCI), based on the sum of energy transfer duties of all process segments,
roughly equivalent to the total rated power of the process equipment (Figure 1).
Figure 1: Correlation between energy transfer duty and investment costs Source: Lange 2001
Note: According to the original source, the figure shows “the investment costs correlation and energy
transfer duty of process segments for syngas manufacture, syngas conversion, fuel and chemical
conversion, and various auxiliaries”.
For the BIOCORE CAPEX estimation, this last approach appears to be most suitable for the
very limited level of process data available. As will be shown below, estimates of the total
rated power can be derived from the dataset provided by IFEU.
The original equation that Lange 2001 found was:
FCI [Mill. USD 1993] = 2.9 * Rated Power [MW]0.55.
The conversion of this formula into Euro in 2010 results in the following formula:
FCI [Mill. EUR 2010] = 3.3 * Rated Power [MW]0.55
This conversion was achieved by first adjusting for inflation (using the CPI inflation
adjustment, 1 USD in 1993 is equivalent to 1.51 USD in 2010) and then converting USD into
EUR (1 USD in 2010 being equivalent to about 0.75 EUR in 2010).
Efforts have been made to validate this model to estimate FCI (and eventually total CAPEX
by accounting for the WCI). For this purpose, data on other bio-based processes have been
searched for. This proved difficult because data on the rated power are typically not
published and also not readily available from other sources. Nevertheless, a few data points
could be added to the graph as shown in Figure 2 below. First, actual business data was
obtained for a starch plant (orange data point). Then, respective data was found for an
investment to convert an ethanol to a butanol plant (Larsson et al. 2008). Finally, data was

11
used by the BIOCORE partner ECN for their ethanol-based organosolv process (van der
Linden 2013).
Figure 2: Validation of the CAPEX model Source: nova 2013
As can be seen from these data entries, the proposed correlation appears to fit rather well.
Although further analyses are not possible with such few data points, it appears that the bio-
based processes tend to lie above the curve, meaning that their CAPEX are higher at the
same rated power compared to petrochemical processes, which confirms our intuition. Note
that this does not say anything about differences in production costs.
Still, there is a further limitation for the application of this model. From the BIOCORE data,
the actual rated power of the equipment is not known but needs to be inferred from their
unintegrated energy demand. However, the unintegrated energy demand of a process will
differ between process configurations, for example depending on the assumed conversion
efficiencies. Since it would be illogical to assume differences in CAPEX simply due to
differences in conversion efficiencies, we will therefore assume a typical configuration of a
process for the CAPEX estimation.
3.1.2 Outline of the BIOCORE OPEX model
According to Turton et al. 2012, the annual operating expenditures (OPEX) can be grouped
into direct or variable manufacturing costs (DMC), fixed manufacturing costs (FMC) and
general expenses (GE). The following Table 2 shows the types of cost items as grouped into
these categories following Turton et al. 2012.
12
Table 2: Cost items included in direct costs, fixed costs and general expenses. DMC FMC GE
Raw materials Depreciation Administration costs
Utilities Local taxes and insurance Distribution and selling costs
Operating labour Plant overhead costs Research and development
Direct supervisory & clerical labour
Maintenance and repairs
Operating supplies
Laboratory charges
Patents and royalities
Source: Turton et al. 2012
Ideally, all cost items listed above would be calculated directly. However, only limited data
is available for the BIOCORE processes and, in particular, no equipment sizing is possible.
Therefore, estimation procedures are necessary.
According to Turton et al. 2012, OPEX can be determined when the following costs are
known or can be estimated:
1. Fixed capital investment (FCI)
2. Cost of operating labour (COL)
3. Cost of utilities (CUT)
4. Cost of raw materials (CRM)
This result follows from the assumption, as described in Turton et al. 2012 (p. 206), that all
other cost items are fixed factors of these four cost components shown above. The procedure
for estimating FCI has been explained in section 3.1.1 above and, as will be detailed below,
the costs of operating labour, utilities and raw materials (feedstock and operating materials)
can be directly calculated from the BIOCORE process data. The model therefore provides a
robust and transparent means of estimating both CAPEX and OPEX from limited data.
Turton et al. 2012 present typical corresponding multiplication factors for each of the OPEX
components shown in Table 2, combined from several literature sources. In the following, we
are disussing each of these multiplication factors.
3.1.2.1 Direct manufacturing costs
Variable or direct manufacturing costs (DMC) represent operating expenses that vary with
production rate. In the following, each position in the total DMC and their calculation are
explained.
Raw materials
This includes the biomass feedstock as well as other operating materials and auxiliaries
needed in the process. Due to the importance of the biomass feedstock for the whole process,
we split total raw material costs into biomass costs (CBM) and other operating material costs
(COM).
Indicative procurement costs for biomass are available from the BIOCORE project since these
have been jointly modelled by Task 1.2 and Task 1.3. Feedstock procurement costs up to

13
farmgate/roadside have been modelled by Task 1.2 while models of Task 1.3 calculated
additional costs up to the factory gate (mainly transport and logistics costs).
The quantities of the other operating materials needed for the processes can be obtained from
the flowsheets and prices of each material from market research.
Utilities
According to Towler and Sinnott 2013, the word “utilities” is used for the ancillary services
needed in the operation of any production process. These typically include (Towler and
Sinnott 2013, p. 104):
1. Electricity
2. Fuel for fired heaters
3. Fluids for process heating
a. Steam
b. Hot oil or specialized heat transfer fluids
4. Fluids for process cooling
a. Cooling water
b. Chilled water
c. Refrigeration systems
5. Process water
a. Water for general use
b. Demineralized water
6. Compressed air
7. Inert-gas supplies (usually nitrogen)
The quantities required can be obtained from the energy balances and the flowsheets and
prices are obtained from market research.
Operating labour
The assessment of operating labour costs (COL) also requires an estimation procedure because
the working time needed for operating is not included in the flowsheet data. One common
way of estimation is based on the number and type of equipment.
In this method, first all major equipment needed for the process is counted. Then,
multiplication factors are applied to relate each equipment to the necessary working units,
i.e. the number of workers needed per unit and shift. Thus, the total number of required
working units is obtained. The necessary multiplication factors were derived from Dimian
2003 (p. 592). There, respective multiplication factors were listed for a number of unit
operations. For those types of unit operations for which no working unit estimation was
available, a typical value of 0.35 has been assumed (Table 3).

14
Table 3: Multiplication factors for equipment types
Equipment Multiplication factor
Reactors: batch/continous 0.75
Distillation columns 0.40
Dryers: spray/rotary 0.75
Filters (vacuum) 0.25
Centrifuge 0.40
Evaporators 0.25
Other equipment 0.35
Source: Dimian 2003 (p. 592); value for other equipment added by nova due to missing information.
The above factors indicate how many operators are needed for one unit at any given time.
Using these factors, the number of operators actually needed in the plant can be calculated as
follows. It is usually assumed that a plant operates 24 hours and 365 days a year. Assuming
8-hour shifts, there are therefore 1,095 shifts per year. Each operator typically works 49
weeks a year and 5 shifts per week, so in total 245 shifts. Therefore, in order to fill all of the
1,095 shifts per year, i.e. to have one operator at the plant at any given time in the year, about
4.5 operators need to be hired. The amount of operators needed at any given time in the year
is calculated by multiplying the number of each equipment with their respective
multiplication factors and this figure is then multiplied with 4.5 to arrive at the total number
of operators that need to be employed by the plant.
This number is then multiplied by the number of hours worked by these operators in a year.
Typically, one operator works 49 weeks in a year, 5 days a week and 8 hours a day, resulting
in 1,960 hours.
This amount of working hours in a year is then multiplied with the average gross employers
labour cost per hour. The three-year average (2008-2010) labour cost in industry (except
construction) in the EU-27 amounted to about 20 EUR/h. This labour cost will be used for the
base scenario.
Direct supervisory and clerical labour
These are costs of administrative, engineering and support personnel. Turton et al. 2012 link
the costs for direct supervisory and clerical labour to the costs of operating labour (COL) with
a factor of 0.10-0.25. For the base case we are therefore using the average factor of 0.18 * COL.
Maintenance and repairs
These are costs of labour and materials associated with maintenance. Turton et al. 2012 are
proposing a factor of 0.02-0.10 linked to FCI. According to Chauvel et al. 2003, it is customary
in the heavy industry sectors (refining, petrochemical, major intermediates, inorganic
chemistry, metalworking etc., to estimate maintenance expenses at an average of 4% of the
cost of the plant, i.e. of the battery limits investments, as well as for general services and
storage (Chauvel et al. 2003, p. 152). However, this percentage is very dependant on the kind
of products that are processed and the type of equipment. Concrete constructions, which are
both static and corrosion-resistant, require only minimal maintenance. Therefore, the
maintenance cost may be lower, e.g. 3%, for general services and storage, while being higher,

15
e.g. 4% for the production units. When the products are very aggressive, and special
equipments may be required, costs may reach as much as 10% per year of the battery limits
investments. Overall, to treat maintenance cost as a fixed percentage of investments is a
simplification because expenses may diminish substantially, if not entirely, if the units are
shut down for a longer time period.
In the inter-project harmonization document for the economic assessment, a value of 2% of
FCI had been decided on for maintenance and repairs, so one at the lower end of the
estimations given above. This value is used for the base case.
Operating supplies
According to Turton et al. 2012, these are “costs of miscellaneous supplies that support daily
operation not considered to be raw materials. Examples include chart paper, lubricants,
miscellaneous chemicals, filters, respirators and protective clothing for operators etc.”
(Turton et al. 2012, p. 204).
For this cost item, Turton et al. 2012 propose to use 10-20% of maintenance and repairs or,
equivalently, on average 0.003 * FCI.
Laboratory charges
The annual cost of the laboratory analyses required for process monitoring and quality
control is a significant item in most modern chemical plants. Sinott 1999 propose as a rough
estimate of laboratory charges 20-30% of operating labour cost or 2-4% of the total
production cost. Turton et al. 2012 use a factor of (0.1-0.2)*COL or on average 0.15 * COL.
Patents and royalities
These are costs of using patented and licenced technology. Turton et al. 2012 use for these a
multiplication factor of (0-0.06)*COM, or on average 0.03 * COM, which will be used for the
base case.
3.1.2.2 Fixed manufacturing costs
Fixed manufacturing costs are independent from the production rate. The main cost items
subsumed under this heading include depreciation, local taxes and insurance and plant
overhead costs. These are shortly explained below.
Depreciation
The investment required for the project is recovered as a charge on the project. Capital is
often recovered as a depreciation charge, which sets aside a given sum each year to repay
the cost of the plant. The plant is not necessarily replaced at the end of the depreciation
period. The depreciation sum is really an internal transfer to the organisation's fund for
future investment.
If the plant is considered to "depreciate" at a fixed rate over its predicted operating life (so-
called straight-line method), the annual sum to be included in the operating cost can be

16
easily calculated. In the inter-project harmonization for the economic assessment, an
investment life of 15 years was assumed for the base case and a straight-line depreciation.
The FCI is therefore depreciated over 15 years so that 1/15 (0.067 * FCI) of the initial FCI
accrue each year of operation.
Local taxes and insurance
A plant usually has to pay various taxes (local and regional taxes, property taxes, licence and
other payments, environmental protection) and insurances against damages to the
production units and also for materials and products tied up in this equipment and also
against damages caused to third parties and the environment. These costs are periodic in
nature and have to be paid at about the same amount every year unless significant changes
have been made to the manufacturing complex being insured.
The inter-project harmonization for the economic assessment had concluded to assume as an
estimate 1% of FCI for insurances but did not account for local taxes. In comparison, Turton
et al. 2012 propose a factor of (0.014-0.05)*FCI or on average 0.032*FCI for both local taxes
and insurances. To take taxes into account, we will assume 2% of FCI as the charges for local
taxes and insurances.
Plant overhead costs
Overhead costs are costs incurred by non-productive components or its ancillary services
and have to be carried by all productive activities. These typically include general
management, plant security, medical, canteen, general clerical staff and safety and plant
technical personnel not directly associated with and charged to a particular operating area.
Alternatively, some of these costs could be attributed to supervision costs (Sinnott 1999, p.
264). Overhead costs can be expected to rise with the scale of the manufacturing facilities.
Here, it is customary to take a fixed percentage of about 1% of the investment costs (Chauvel
et al. 2003) or 50-100% of labour costs (Sinnott 1999, p. 264).
Turton et al. 2012 propose a factor related to both operation labour costs and FCI. Following
their proposal, we are estimating plant overhead costs in the base case as 0.708 * COL + 0.036 *
FCI.
3.1.2.3 General expenses
General expenses account for additional overhead necessary for carrying out business. The
main items subsumed under this heading include administration costs, distribution and
selling costs and research and development costs.
Administration costs
This heading covers the direct operating supervision: the management directly associated
with running the plant. These costs will depend on the size of the plant and the nature of the
process.
Turton et al. 2012 estimate administration costs to be 15% of the sum of operating labour
costs, direct supervisory and clerical labour costs and maintenance and repairs. By making

17
use of the estimates shown above, this equates to 0.177*COL+ 0.003*FCI. This estimate will be
used for the base case.
Distribution and selling costs
On top of actual production costs, there are sales expenses, general overheads and costs for
research and development to consider. These costs are estimated by Turton et al. 2012 as
lying between 2-20% of COM. For the base case we will therefore use the average of
0.11*COM.
Research and development
These are all costs of research activities related to the process and products and include
salaries and funds for research-related equipment and supplies etc. (Turton et al. 2012, p.
205). Turton et al. 2012 estimate these costs as 0.05*COM, i.e. 5% of annual manufacturing
costs.
3.1.2.4 Formula for the estimation of COM
From applying all of the multiplication factors discussed above, the final estimation
procedure for DMC, FMC and GE is as follows:
DMC:
Raw materials: Actual prices
Utilities: Actual prices
Operating labour: See below
Direct supervisory and clerical labour: 0.18*COL
Maintenance and repairs: 0.02*FCI
Operating supplies: 0.003*FCI
Laboratory charges: 0.15*COL
Patents and royalities: 0.03*COM
FMC:
Depreciation: 0.067*FCI
Local taxes and insurance: 0.02*FCI
Plant overhead costs: 0.708*COL+ 0.036*FCI
GE:
Administration costs: 0.177*COL+ 0.003*FCI
Distribution and selling costs: 0.11*COM
Research and development: 0.05*COM
Summing up all of the above and solving for COM leads to the following equation:
COM = 0.184*FCI + 2.735*COL + 1.235*(CUT + CRM)

18
The annual manufacturing costs can therefore be estimated using figures for FCI, COL, CUT
and CRM. As will be shown below, all of the necessary data can be derived from the dataset
provided by IFEU.
3.1.3 Market analysis, product prices and GreenPremium
The aim of the market analysis in Task 7.3 has been to assess product price ranges for the
BIOCORE products that are used as parameters in the techno-economic evaluation. By
conducting a preliminary assessment of market prices for conventional products and rough
estimations for premiums for the bio-based equivalents, Task 5.4 had laid the groundwork
for the thorough market research for the BIOCORE products in Task 7.3. The results of Task
5.4 are written down in Deliverable 5.3 (Kokossis et al. 2011).
Task 7.3 then performed a market analysis for those BIOCORE products and their competing
bio-based products and their conventional equivalents (chemicals and fuels) as references
that had been selected as the outcome of the decision-making process following the Value
Chain Meeting in Paris (19-20 April 2011). The results of this market research have been
compiled in product factsheets and distributed to BIOCORE partners for comments (see
Annex VII). From the list of products that had been selected, only a small subset has actually
been submitted for a detailed sustainability assessment (see section 3.2).
Market potentials and corresponding market prices of BIOCORE products may be very
different depending on the assumed application of these products. For the economic
assessment it is therefore very important to have clearly defined the product uses. One
standard use option for each product in each scenario has therefore been described in the
dataset by IFEU (IFEU 2013).
The market research comprised the analysis of data banks (e.g. ICIS Pricing, Eurostat, UN
Comtrade, WTO, IMF, Worldbank), literature and expert interviews. Where possible, longer-
term historical data on markets and prices were used in order to understand the past and
anticipate future trends. As said above, BIOCORE partners themselves have been be the first
source for expert knowledge.
An important determinant for the market potential for BIOCORE products is the willingness
of customers to pay more for these products compared to conventional substitutes, i.e. the
“GreenPremium”. In order to better understand the logic and market mechanisms behind
GreenPremiums, Task 7.3 has produced an analytical paper on this issue (see Annex VI for
the full paper).
The GreenPremium is basically understood as the extra-price market actors are willing to
pay for a product just for the fact that it is “green” or in our specific case “bio-based” (=
derived from biomass).
In this paper, the nova-Institute has proposed for the first time a comprehensive definition of
GreenPremium (see Figure 3):

19
GreenPremium price is the additional price a market actor is willing to pay for the
additional emotional performance and/or the strategic performance of the intermediate or
end product the buyer expects to get when choosing the bio-based alternative compared to
the price of the conventional counterpart with the same technical performance.
additional performanceemotional performance
+strategic performance
emotional performance+
strategic performance
bio-based product petro-based product
- =Green
Premium
price
technical performance technical performance
Figure 3: Definition of GreenPremium Source: nova 2013
Based on this definition, the results of this paper clearly prove that GreenPremium prices
exist and are paid in value-chains of bio-based chemicals and plastics. A relevant group of
market actors are already paying GreenPremiums throughout examined branches and in
variable levels between 10% and 100%.
The analysis shows that willingness of market actors to pay GreenPremium prices is
dependent on two factors:
The additional emotional performance compared to the conventional counterpart
The additional strategic performance compared to the conventional counterpart
The emotional performance is subjectively valued and mainly caused by the end consumer
preference. The GreenPremium effect is passed on through the value chain as consumer pull.
The value of a product's strategic performance that leads to GreenPremium is depending on
the market position and framework of the company and the branch.
The results indicate that companies pay GreenPremiums primarily for the strategic benefits,
even though image and marketing aspects can be key decision factors. Strong drivers for
strategic performance are (expected) public regulations to be met (e.g. non-degradable plastic
bag bans in Italy or Asian countries), the opportunity to gain market potential or feedstock
supply chain aspects.
This shows that willingness to pay a GreenPremium prices has to be understood as an
investment, on which companies expect a (delayed) return.
In practice, however, companies do not always succeed to enforce a GreenPremium price on
their customers, especially in long-term existing supply chains with established products. On
the other hand, there are new investments for bio-based plastics (e.g. PE, PET, PP), which
only have been developing upon demand, which in turn includes necessarily a confirmed
willingness to pay GreenPremium prices for intermediates over a longer period.
Results indicate that a relevant group of companies are paying a GreenPremium price of
around 10-20% for bio-based intermediates, plastics and polymers. This can be found in a

20
wide range of different applications and branches as the full report (Annex VI) impressively
shows.
Even much higher GreenPremium prices are possible (50-100% and beyond) under very
specific market conditions and in a limited timeframe. This can be due to market scarcity
(e.g. PE, PP) which in turn is compensated by additional image effects (exclusivity). The
main reasons for achieving these high GreenPremium levels are:
Huge image benefit or significant strategic advantages for the producer (e.g. scarcity
and exclusive access to a bio-based material),
material costs account for a small share of overall production costs,
in niche markets which are very sensitive to emotional performance,
when GreenPremium expenses can be fully and directly passed on along the value-
added chain.
Based on the analysis of selected supply chains, empirical data show that in most cases the
GreenPremium level decreases towards the end of the supply chain (end consumer). One
reason is that the material costs share (including the GreenPremium) of the total costs
decreases along the value chain. Another reason is that without a confirmed GreenPremium
price for the intermediates, the whole value-chain would not have been implemented at all.
The following Figure 4 shows the results of all expert interviews and surveys undertaken and
analysed in the context of this study. A table containing detailed information on analysed
cases of bio-based materials, products and companies can be found in Annex VI.

21
Figure 4: Development of GreenPremium prices along the value-added chain of different
bio-based chemicals, plastics and end products. Note: Coloured lines are representing one value-added chain, single dots represent single findings.
Source: nova 2013
The figure shows the identified GreenPremium levels depending on where they are paid in the
value chain - for example, the polymer producer buys a building block from the chemical
company and might pay a GreenPremium for it or the end consumer buys the final product
and might pay a GreenPremium to the distributor.
The range of reported GreenPremium prices in the various branches and applications analysed
lies between 10 and 300% above the conventional petrochemical product with the same
technical performance. Most of the GreenPremium price findings are in the range of 10 to
20% for bio-based intermediates, polymers and compounds, followed by the range 20 to 40%.
Higher GreenPremium prices could only be obtained in specific cases.
For the end consumer, the range of GreenPremium prices for bio-based products goes from
0% (car, cosmetics, bottle) to 25% (wall plug, toy) with, in the middle, a 10% GreenPremium
for organic food with bio-based packaging.
These are huge extra prices compared to biofuels. A recent US survey shows that even
consumers involved in the biofuel sector only accept 1-3% higher prices for biofuels with the
same technical performance as fossil fuels. For more details, please refer to Annex VI.

22
3.1.4 Economic performance measures
Given the calculated production costs and revenues from product selling, economic
performance measures for the whole biorefinery plant can be derived. The aim is to compare
the economic performance of different biorefinery concepts, processes and products.
Therefore indicators of economic performance are needed. These are usually derived from
Discounted Cash Flow models (DCF) and include the Net Present Value (NPV) and Internal
Rate of Return (IRR), the Payback Time and the Return on Investment (ROI) of the project.
An investment is typically characterised by negative cash flows at the beginning of the
project (the investment) and positive cash flows generated by selling the products during the
operating time of the plant (the typical project lifetime lies between 15-25 years and for the
inter-project harmonization, a lifetime of 15 years had been chosen as the common base case).
All information on cash flows along the lifetime of a plant can be summarized in a table that
contains information about forecast sales and selling prices, sale income less operating costs,
net cash flows and the discounted net cash flow at a certain discount rate (for the inter-
project harmonization, a discount rate of 5% had been chosen). The Net Present Value
(NPV) is defined as the sum of discounted net cash flows:
NPV=Net cash flowi
(1+ i)p
æ
è ç
ö
ø ÷
i =0
n
å
The decision criterion for the evaluation of an investment project is that the NPV should be
at least zero or positive. The choice of a higher discount rate implies a higher discount, i.e.
devaluation of future cash flows, which could reflect higher risks of the project.
The Internal Rate of Return (IRR) is defined as the discount rate at which the NPV is just
equal to zero (DeFusco et al. 2011). The higher the IRR, the more favourable the investment
project appears because it implies that future cash flows could be discounted at a higher
discount rate until the NPV would become zero.
When comparing different scenarios, NPV and IRR may lead to different results. This
situation is exemplified in Figure 5. In this example, the project P1 has the highest NPV at
lower discount rates while the project P2 has the highest IRR.
Figure 5: The relation between NPV, discount rate and IRR Source: nova 2011

23
This example highlights the importance of choosing an appropriate discount rate. The
discount rate reflects both the risks of a project and time preference. The higher discount
rates are, the sooner future cash flows loose their weight in calculating the NPV.
Different performance measures may therefore lead to conflicting results. At the coarse level
of detail at which the techno-economic evaluation of BIOCORE is situated, it makes sense to
concentrate on only one performance measure for the overall comparison because the main
aim of the analysis is to produce a ranking of the different processes that can give indications
on which processes to focus further efforts.
For this primary measure we have chosen the IRR. The IRR is a very popular indicator for
the evaluation of an investment project. According to expert and information and secondary
sources, an IRR of 25% is usually considered “as the threshold for securing capital
investment in new processing technology” (Brown et al. 2012, p. 82). This treshhold will
therefore be used as a benchmark which BIOCORE will have to achieve in order to become
attractive for investors.
It should be noted that the benchmark of an IRR of 25% is not equivalent to an annual
interest rate of 25%. To make the difference clear and to put the IRR of 25% into perspective,
a simple comparison can be made. Instead of investing the original capital into a biorefinery,
it could be put into a bank account and earn annual interests. Then, the interest rate can be
determined that would result in the same future value at the end of the project lifetime of 15
years. For the case of an IRR of 25%, this equivalent interest rate lies at about 7% p. a.
Many BIOCORE product portfolios will not be economically viable on their own but will
depend on some kind of support mechanisms. Without such mechanisms, the economic
performance measures are likely to be negative. The gap between calculated performance
and the threshold to economic viability (i.e. when e.g. IRR = 25%) indicates the level of
necessary support. This necessary level of support will be calculated for the situation
without and with (varying) levels of GreenPremium.
3.1.5 Strategies for reaching profitability targets
As stated above, it is likely that only few or none of the BIOCORE processes will reach the
target of an IRR of 25%. We will not stop at this finding but will ask what measures could be
taken for reaching this profitability target.
The first objective could be to increase revenues. Since the physical product outputs are
given, this would have to be achieved through higher product prices. We will therefore look,
first, at the impacts of increased prices for all biorefinery end products through a politically
motivated price support mechanism. Since any such subsidy system would need strong
arguments in order to attain political support, we will compare the level of necessary price
support for BIOCORE products with the current support for biofuels. Second, we look at the
effects of increased market prices for single end products through the GreenPremium
mechanism.
The second objective could be to cut costs. Those production costs could be defined that
would generate the desired profitability, i.e. the so-called target costs. The basic idea of

24
Target Costing (TC) is to begin the costing of new products starting with the achievable
market price derived from the market research to derive the allowable costs by subtracting a
desired profit from this market price. The rationale behind this approach is that in complex
processes, end products tend to be more expensive than the market allows if this is not
prevented early in the design stage.
3.2 The dataset
The dataset on which the economic sustainability assessment has been conducted has been
provided by IFEU. This dataset contains complete mass and energy balances for a selected
number of biorefinery scenarios. In each of these scenarios, it is assumed that 150,000 t dry
matter of biomass feedstock enter the preprocessing stage. It is furthermore assumed that the
plant operates 8,000 hours per year.
The scenarios differ in their feedstock, their product portfolios and their specific types of
production processes (IFEU 2013). Four scenarios have been designated as main scenarios
(see Table 4).
Table 4: Main biorefinery scenarios for the economic sustainability assessment
Scenario short
name Feedstock
Products Subscenarios?
C5 C6 Lignin
Xyl/IA Wheat straw Xylitol (Biotech) Itaconic acid Unmodified lignin Y
Xyl/Eth Wheat straw Xylitol (Biotech) Ethanol Unmodified lignin Y
Eth/IA Wheat straw Ethanol Itaconic acid Unmodified lignin Y
SHF Eth Wheat straw SHF ethanol Unmodified lignin Y
As can be seen from Table 4, the main end products produced from the three biomass
fractions are xylitol (from C5 sugars), itaconic acid (from C6 sugars), ethanol (from C5 and/or
C6 sugars) and unmodified lignin from the lignin fraction. This lignin may be used e.g. for
the production of PF resins.
For each of the four main scenarios, IFEU has defined bandwidths in the form of sub-
scenarios (standard, favourable and less favourable). The favourable sub-scenario for
example depicts an implementation with efficient energy integration, low amounts of
material inputs, high conversion efficiencies and at the same time less by-products for energy
generation.
Additionally to these four main scenarios, further scenarios have been defined by IFEU with
the aim of studying specific impacts of scenario variations (Table 5). As can be seen from
Table 5, sub-scenarios have not been defined for all of these additional scenarios.
To begin with, the first main scenario is modified to allow for catalytic production of xylitol
instead of biotechnological production as in the base case. However, this additional scenario
with catalytic xylitol production should only be regarded as a preliminary sensitivity
analysis, since high uncertainties in the data remain. Second, the main scenario with joint
production of ethanol from both C5 and C6 sugars through separate hydrolysis and
fermentation (SHF) is modified. Instead of joint SHF, ethanol may be converted separately

25
from C5 and C6 sugars (scenario Eth/Eth or ethanol may be produced through simultaneous
saccharification and fermentation (scenario SSF Eth). Furthermore, ethanol may be converted
further into ethylene as a precursor for PVC (scenario PVC).
Another scenario looks into the impacts of high purity production of itaconic acid, incl.
recycling. This sub-scenario (Xyl/IA Rec.) is compared to the first main scenario (Xyl/IA).
So far, all scenarios used wheat straw as feedstock. Now, the other feedstocks assessed in
BIOCORE (hardwood, rice straw, miscanthus and SRC poplar) are looked at, again by
comparison with the first main scenario.
All scenarios require energy in the form of electricity and heat. The electricity demand is
partly covered by purchasing electricity from the grid and partly from an internal Combined
Heat and Power (CHP) plant that is partly fuelled from natural gas and partly from biogas.
The biogas plant is fed with the process water that only contains small amounts of dry
matter. The digestate of this biogas plant contains nitrogen and phosphate, so that these can
be sold as fertiliser. No information is available on other potentially marketable minerals or
nutrients.
Further two scenarios assess how the internal use of lignin as a source for energy impacts on
the process profitability. For comparison, the first (Xyl/IA) and fourth (SHF Eth) main
scenarios are used.
Instead of using the lignin as a source of energy, additional straw may be bought in order to
substitute natural gas. This is analysed in the scenario Xyl/IA straw en., based on the first
main scenario. The assumption of this scenario is that all of the natural gas demand is
replaced by straw.
One final scenario, the so-called “fallback option”, assumes a simplified product portfolio for
the case that the other options are not feasible. In this scenario, the biorefinery markets the
C5 sugars in syrup as an animal feed, the cellulose fraction as paper pulp and the lignin is
again used as an internal energy source.

26
Table 5: Additional biorefinery scenarios for the economic sustainability assessment
Scenario short
name Feedstock
Products Sub-
scenarios?
C5 C6 Lignin
Xylitol production process:
Xyl Cat/IA Straw Xylitol
(Catalytic) Itaconic acid Unmodified lignin N
Ethanol process:
Eth/Eth Straw Ethanol Ethanol Unmodified lignin Y
SSF Eth Straw SSF ethanol Unmodified lignin N
PVC Straw Ethylene Unmodified lignin N
Recycling of itaconic acid:
Xyl/IA Rec. Straw Xylitol
(Biotech)
Itaconic acid
(high purity,
incl. recycling)
Unmodified lignin N
Different feedstock:
Xyl/IA hardw. Hardwood Xylitol
(Biotech) Itaconic acid Unmodified lignin Y
Xyl/IA rice Rice straw Xylitol
(Biotech) Itaconic acid Unmodified lignin Y
Xyl/IA misc. Miscanthus Xylitol
(Biotech) Itaconic acid Unmodified lignin Y
Xyl/IA pop. SRC poplar Xylitol
(Biotech) Itaconic acid Unmodified lignin Y
Use of lignin for energy:
Xyl/IA lig. en. Straw Xylitol
(Biotech) Itaconic acid
Crude lignin
(energy) N
SHF Eth/lig.
en. Straw SHF ethanol
Crude lignin
(energy) N
Use of straw for energy:
Xyl/IA straw
en. Straw
Xylitol
(Biotech) Itaconic acid Unmodified lignin N
Fallback product portfolio:
FB Straw Feed (sugars in
syrup) Paper pulp Crude lignin (fuel) N
The whole sustainability assessment in BIOCORE is done on this dataset as it was the
purpose of the sustainability assessment to evaluate possible implementations of the
BIOCORE biorefinery in 2020.
In this dataset, the biorefinery schemes described above are structured into four conceptual
blocks. These are the pretreatment stage, the fractionation (organosolv process), the
downstream processing (conversion of CIMV fractions into marketable products) and the
production of by-products (Figure 6).

27
Distribution
ProcessingProcessing Processing
Pretreatment
Fractionation (Organosolv)
C5 C6 Lignin
Residues
Heat / power
generation
Use and end of life
Distribution Distribution
Fuel
Material
inputs
BIOCORE
Biorefinery
Further
conversion
in chemical
industry
Processing
Fertiliser
Distribution of products
…
…Ethanol
… …
Itaconic acidXylitol
Ethanol
Lignin powder
Biomass
Power
Water
Figure 6: Conceptual blocks of BIOCORE processes Source: IFEU 2013
3.3 Economic sustainability assessment – Results
In the following, the results of the economic sustainability assessment for the aforementioned
processes are presented. First, the results of the market analysis on product prices are
presented (section 3.3.1). Then, an assessment of the CAPEX (section 3.3.2) and OPEX
(section 3.3.3) for each scenario and a direct comparison of selected scenarios (section 3.3.4)
follow. These estimations lead to conclusions about the economic viability of these scenarios,
evaluated along profitability indicators, followed by a discussion about how to reach
profitability targets (section 3.3.5).
3.3.1 Results of the market analysis on product prices (incl. GreenPremium)
In this section, we discuss the end products considered in the BIOCORE scenarios, i.e. their
nature, markets, applications, prices (including possible GreenPremiums) and trends. This is

28
a slightly extended version of the information contained in the products factsheets that cover
all intermediate and end products considered in the BIOCORE project (see Annex VII).
3.3.1.1 Bio-Xylitol
Xylitol is an organic compound that is found in the fibres of many fruits and vegetables. It
can be extracted from various berries, oats and mushrooms, as well as fibrous material such
as corn husks, sugar cane bagasse and birch. Xylitol is roughly as sweet as sucrose with only
two-thirds the food energy.
The main use of xylitol is as a sweetener, i.e. in chewing gums and pastilles or as an additive
in oral hygiene products and other pharmaceutical products. Apart from these traditional
applications, xylitol has also been tested as a co-monomer with terephthalate or sebacic acid
for polyester production.
Industrially, xylitol is currently produced from sugar. The chemical method of xylitol
production is based on the catalytic hydrogenation of D-xylose or xylose-rich hemicellulose
hydrolysate. This method is energy intensive and probably the biocatalytic production has a
better carbon print, although a detailed LCA should be performed to confirm this
hypothesis.
BIOCORE xylitol is either based on biocatalytic production, using microbial strains
developed by VTT, or biotechnological production. In the former case, C5 sugars are
fermented to bio-xylitol.
Several price estimations for xylitol are available. The export price of xylitol from China
varied between about 2,000 EUR/t in November 2010 and about 2,700 EUR/t in May 2012; ex-
factory prices of 68% xylitol (liquid) in that period were between about 620-680 EUR/t (CCM
International). For crystal xylitol, higher prices are paid of 5,300-6,000 EUR/t, FOB
(Zhengzhou Sigma Chemical Co., China). The BIOCORE processes produce crystal xylitol by
self-crystalliation, so that the price for crystal xylitol should be used as the reference price.
However, the global demand for xylitol amounts to about 160,000 t (with an expected growth
rate per year of about 5%) and one BIOCORE plant would in fact produce about 10% of this
global demand. It can therefore be expected that this will have some effect on the world
market price. While the actual effects are uncertain, a level of 3,500 EUR/t may be in a
realistic range. We will therefore use this price for the base case.
Xylitol is produced mainly by Danisco Sweeteners, Roquette Frères, Zhejiang Huakang
Pharmaceutical, Shandong Futaste Pharmaceutical and Shandong LongLive BioTech. Other
producers are, for example, Lonza, SPI Polyols, Aleron, Hebei Baosuo, Shandong Yucheng
Futian Pharmaceutical, Henan Huixian Hongtai Chemical Industrial. At least in China, there
are more than 50 producers.
No limitation for the technical substitution potential of 1G xylitol by 2G xylitol exists since
both are the same molecule. For xylitol, no GreenPremium is expected due to the fact that
also the reference product is sugar based.

29
3.3.1.2 Feed from C5 syrup
In the fallback option scenario, the C5 syrup may be used as animal feed. The feed value of
the C5 syrup is approximately comparable with that of molasses, which is a sugar-rich by-
product from sugar crop processing. The price for sugar beet molasses in Europe varied
between about 120-160 EUR/t (ISO 2012). The price that CIMV currently fetches for their C5
syrup was reported to be around 360 EUR/t. As a realistic price that may be fetched for this
product in the medium term as feed we will therefore assume about 200 EUR/t.
No GreenPremium can be expected for the use of the C5 syrup as feed.
3.3.1.3 2G Ethanol
Ethanol is usually made by the fermentation of a carbohydrate (starch, sugar or cellulose) to
the alcohol, followed by distillation and other processing to make it suitable for use as a fuel,
solvent, chemical feedstock or for alcoholic beverage consumption. 2G ethanol uses cellulose
as feedstock instead of sugar or starch. 2G ethanol has full substitution potential with
reference to 1G ethanol.
Considerable research is being focused on developing processes that can produce ethanol
from low-cost, non-food feedstocks. The industry is hoping to develop economical cellulosic
ethanol, derived from the fermentation of cheap forms of biomass.
Fuel constitutes the single largest single use of ethanol by far. However, there are many other
applications, ranging from alcoholic beverages to chemical feedstocks, antiseptics, antidotes,
solvents and others. Ethanol is used as a base chemical for other organic compounds. These
include ethyl halides, ethyl esters, diethyl ether, acetic acid, ethyl amines, and, to a lesser
extent, butadiene.
It is used as an antiseptic in medical wipes and in most common antibacterial hand sanitizer
gels at a concentration of about 62% v/v as an antiseptic. Ethanol kills organisms by
denaturing their proteins and dissolving their lipids and is effective against most bacteria
and fungi, and many viruses, but is ineffective against bacterial spores.
Ethanol works as an antidote against poisoning by other more toxic alcohols, in particular
methanol and ethylene glycol, by successfully competing for the alcohol dehydrogenase
enzyme, lessening metabolism into toxic aldehyde and carboxylic acid derivatives.
Ethanol is miscible with water and is a good general purpose solvent. It is found in paints,
tinctures, markers, and personal care products such as perfumes and deodorants. It may also
be used as a solvent or solute in cooking, such as in vodka sauce.
Global production of conventional ethanol was around 86 bln litres in 2010, compared to 74
bln litres in 2009. The United States and Brazil are the world's top producers, accounting
together for 90% of global production.
Most conventional ethanol (approximately 70% of global production) is derived from the
fermentation of sugar crops, including sugarcane, sugar beets or molasses. Brazil and many
tropical countries use sugarcane or molasses, while France, the largest producer in Europe,
uses mainly sugar beets. The United States and eastern Canada use mainly corn kernels; in

30
western Canada, wheat is the main feedstock. In China, corn, cassava and sweet potatoes are
used. In Italy, ethanol is produced from waste from wine manufacture. Any long-term global
forecast is speculative, as actual growth will depend on a number of economic and technical
factors, as well as possible changes in legislative and regulatory policy.
The biggest consumer of ethanol are the United States, accounting for 55% of world
production in 2010, followed by Brazil (20%), China (8%) and Western Europe (7%).
Worldwide capacity of 2G Ethanol was estimated at 120 mln litres in 2010, fragmented into
many demonstration plants, and thereof 100 mln litres based on 26 plants in the United
States due to large public grants. Significant capacity extension is expected over the next
years.
Current production fails to meet expectations: The US Environmental Protection Agency
projected that its regulations would compel fuel suppliers to use 1,900 mln litres of cellulosic
biofuel in 2012. By the end of last year, it had recognised that it would have to cut that
mandated amount to just 33 mln litres.
Price indications significantly differ depending on the region and on grade (fuel grade, food
grade, industrial grade). The following Figure 7 therefore compares domestic ethanol prices
in Germany, Brazil and the US. The average across these three market prices was about 780
EUR/t between 2010-2012, which we use fothe base case. Furthemore, price indications for
2G ethanol may differ, but entrepreneurs confirm nearly competitive production to 1G
ethanol. Lower prices in the future are expected due to larger plants and technical
improvements (higher conversion rates of biomass to ethanol). No GreenPremium is
expected with reference to 1G Ethanol.
Figure 7: Ethanol price (99%) in Germany, Brazil and the US, 2010-2012 Source: ICIS Pricing
Notes: FD = Free delivered, FOB = Free on board
3.3.1.4 Ethylene
Bioethylene can be readily produced through the dehydration of bioethanol (according to
ARKEMA, this is already done in several locations e.g. in Brazil, India and France) or
through the cracking of bionaphtha (according to ARKEMA, this is not existing on industrial
scale). Bionaphtha is produced during the processing of renewable feedstocks in processes
such as Fischer Tropsch fuel production.

31
Petrobased ethylene is produced in the petrochemical industry by steam cracking. In this
process, gaseous or light liquid hydrocarbons are heated to 750–950 °C, inducing numerous
free radical reactions followed by immediate quench to stop these reactions. This process
converts large hydrocarbons into smaller ones and introduces unsaturation. Ethylene is
separated from the resulting complex mixture by repeated compression and distillation.
Petrobased ethylene in naphtha steam crackers is a coproduct of propylene, C4s and
aromatics. In addition, ethane is always a coproduct of natural gas, and has to be used. In
some locations like the Middle East it might even have a negative value for the producer, so
its production is not easy to be substituted.
Refineries are also a source of ethylene. Cheap natural gas (methane) can be turned to
ethylene by oxidative coupling of methane (OCM) technologies. Methanol to olefins
technologies (Licensors: UOP and Lummus) are now being implemented in China.
Ethylene is used as a feedstock in the manufacture of polymer plastics, fibers and other
organic chemicals that are ultimately consumed in the packaging, transportation and
construction industries and in a multitude of industrial and consumer markets. Nondurable
or consumable end uses, in particular packaging, make up more than half of ethylene
derivative consumption worldwide. One plastic resin, polyethylene, accounts for 55–60%
(other sources state 46%) of the total use of ethylene.
Worldwide production of petrobased ethylene in 2011 was 142 mln t (107 mln t in 2005),
European capacity was around 25 mln t. As of 2010, at least 117 companies in 55 countries
were producing ethylene.
Global demand for ethylene is forecast to grow at about world average GDP growth rates
over the next five years, or around 3.4% per year. This growth has been boosted by the hasty
rebuilding of the supply chain inventory of packaged goods, all the way to retail and
business outlets in developed and even developing economies. Major consumption regions
are the United States, Western Europe, Middle East, Africa and China, accounting for
approx. for two-third of global demand.
Because ethylene is one of the largest-volume petrochemicals worldwide, with such a diverse
derivative portfolio, ethylene demand is sensitive to both economic and energy cycles.
Moreover, because of the size and broad use patterns of its markets, ethylene is often used as
a surrogate for the performance of the petrochemical industry at large.
Worldwide production capacity of bio-ethylene was between 0.75-0.80 mln t in 2012.
Significant capacity extension is expected (e.g. by BRASKEM).
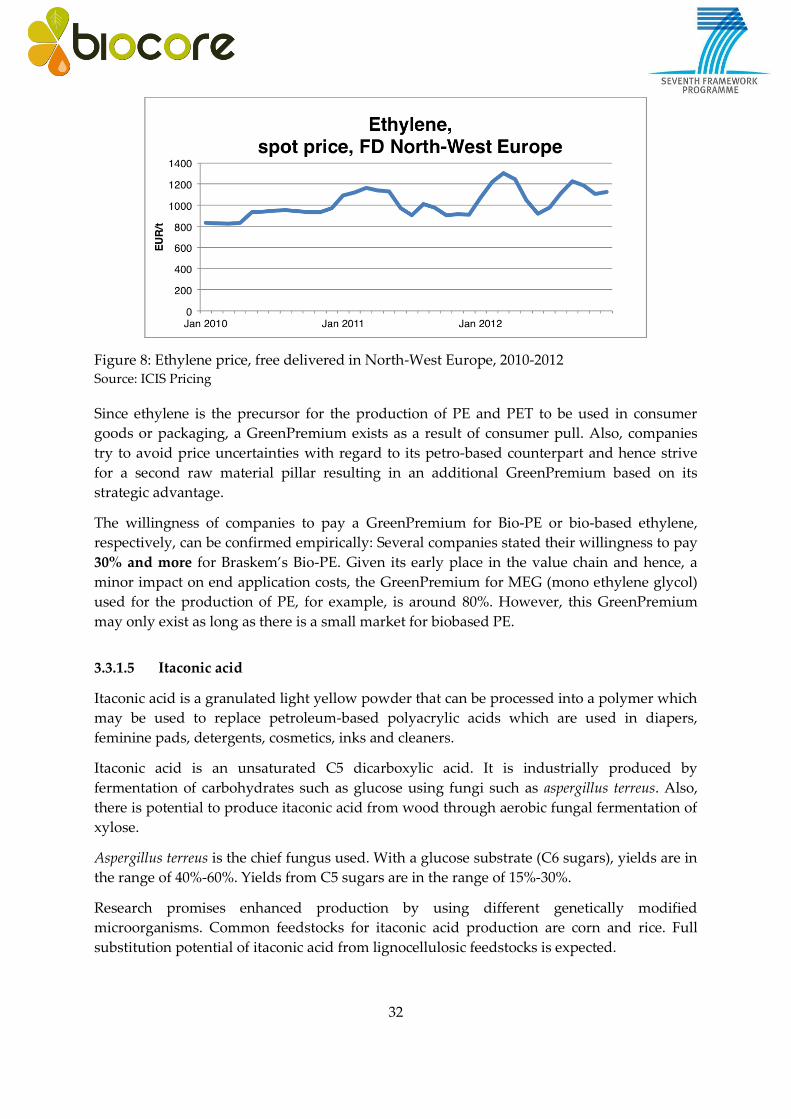
The following Figure 8 shows the spot price for petrobased ethylene in Europe, which
averaged about 1,000 EUR/t between 2010-2012. Price estimations for bio-based ethylene
range between 900-1,500 EUR/t depending on regions and feedstocks. We will therefore use
a price level of 1,000 EUR/t for the base case.
32
Figure 8: Ethylene price, free delivered in North-West Europe, 2010-2012 Source: ICIS Pricing
Since ethylene is the precursor for the production of PE and PET to be used in consumer
goods or packaging, a GreenPremium exists as a result of consumer pull. Also, companies
try to avoid price uncertainties with regard to its petro-based counterpart and hence strive
for a second raw material pillar resulting in an additional GreenPremium based on its
strategic advantage.
The willingness of companies to pay a GreenPremium for Bio-PE or bio-based ethylene,
respectively, can be confirmed empirically: Several companies stated their willingness to pay
30% and more for Braskem’s Bio-PE. Given its early place in the value chain and hence, a
minor impact on end application costs, the GreenPremium for MEG (mono ethylene glycol)
used for the production of PE, for example, is around 80%. However, this GreenPremium
may only exist as long as there is a small market for biobased PE.
3.3.1.5 Itaconic acid
Itaconic acid is a granulated light yellow powder that can be processed into a polymer which
may be used to replace petroleum-based polyacrylic acids which are used in diapers,
feminine pads, detergents, cosmetics, inks and cleaners.
Itaconic acid is an unsaturated C5 dicarboxylic acid. It is industrially produced by
fermentation of carbohydrates such as glucose using fungi such as aspergillus terreus. Also,
there is potential to produce itaconic acid from wood through aerobic fungal fermentation of
xylose.
Aspergillus terreus is the chief fungus used. With a glucose substrate (C6 sugars), yields are in
the range of 40%-60%. Yields from C5 sugars are in the range of 15%-30%.
Research promises enhanced production by using different genetically modified
microorganisms. Common feedstocks for itaconic acid production are corn and rice. Full
substitution potential of itaconic acid from lignocellulosic feedstocks is expected.
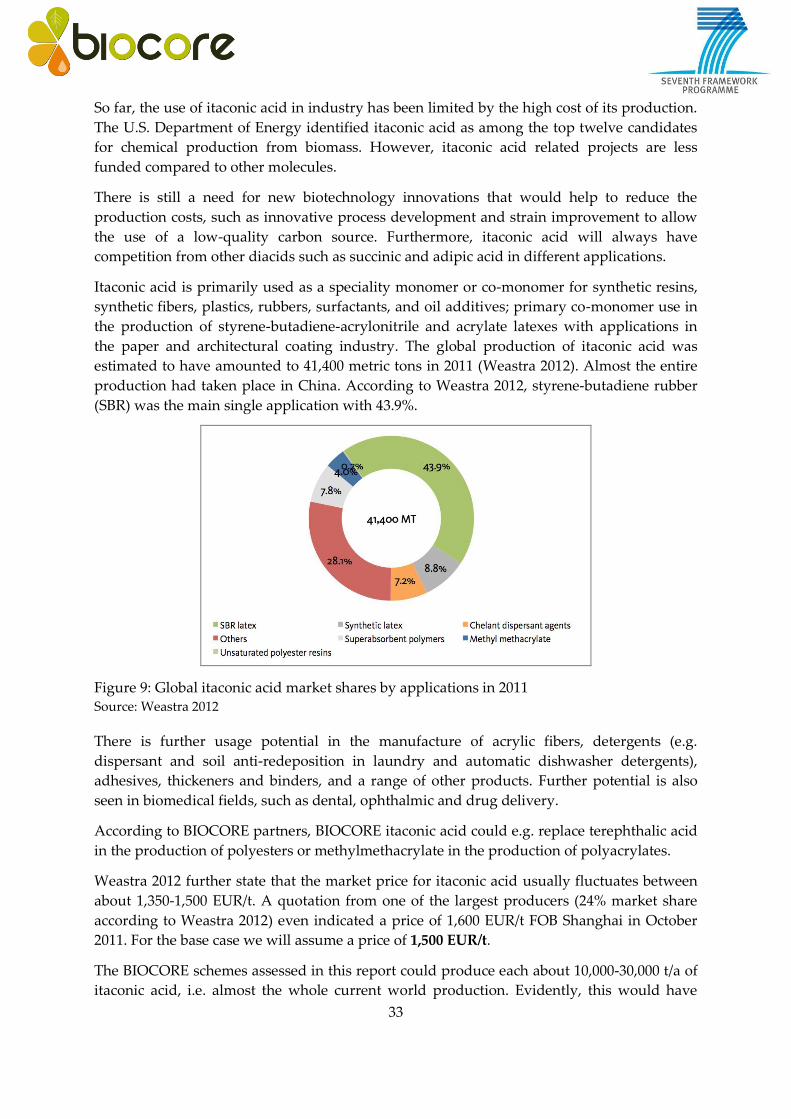
33
So far, the use of itaconic acid in industry has been limited by the high cost of its production.
The U.S. Department of Energy identified itaconic acid as among the top twelve candidates
for chemical production from biomass. However, itaconic acid related projects are less
funded compared to other molecules.
There is still a need for new biotechnology innovations that would help to reduce the
production costs, such as innovative process development and strain improvement to allow
the use of a low-quality carbon source. Furthermore, itaconic acid will always have
competition from other diacids such as succinic and adipic acid in different applications.
Itaconic acid is primarily used as a speciality monomer or co-monomer for synthetic resins,
synthetic fibers, plastics, rubbers, surfactants, and oil additives; primary co-monomer use in
the production of styrene-butadiene-acrylonitrile and acrylate latexes with applications in
the paper and architectural coating industry. The global production of itaconic acid was
estimated to have amounted to 41,400 metric tons in 2011 (Weastra 2012). Almost the entire
production had taken place in China. According to Weastra 2012, styrene-butadiene rubber
(SBR) was the main single application with 43.9%.
Figure 9: Global itaconic acid market shares by applications in 2011 Source: Weastra 2012
There is further usage potential in the manufacture of acrylic fibers, detergents (e.g.
dispersant and soil anti-redeposition in laundry and automatic dishwasher detergents),
adhesives, thickeners and binders, and a range of other products. Further potential is also
seen in biomedical fields, such as dental, ophthalmic and drug delivery.
According to BIOCORE partners, BIOCORE itaconic acid could e.g. replace terephthalic acid
in the production of polyesters or methylmethacrylate in the production of polyacrylates.
Weastra 2012 further state that the market price for itaconic acid usually fluctuates between
about 1,350-1,500 EUR/t. A quotation from one of the largest producers (24% market share
according to Weastra 2012) even indicated a price of 1,600 EUR/t FOB Shanghai in October
2011. For the base case we will assume a price of 1,500 EUR/t.
The BIOCORE schemes assessed in this report could produce each about 10,000-30,000 t/a of
itaconic acid, i.e. almost the whole current world production. Evidently, this would have

34
strong implications on the prices that BIOCORE itaconic acid could achieve. However, the
Weastra 2012 study expected the itaonic acid market to grow rapidly and to reach more than
400,000 metric tons by 2020. We therefore expect that a full industrial-scale BIOCORE plant
in 2020 will only have a moderate impact on world market prices for itaconic acid.
As a precursor for products to be used in consumer goods/design, a GreenPremium can be
expected as a result of consumer pull. Given its early place in the value chain and hence, a
minor impact on end application costs, the GreenPremiums for itaconic acid can be expected
to be high (20% - 100%, in individual cases more).
3.3.1.6 Unmodified lignin
The lignin obtained from the organosolv process could be used for various material uses.
CIMV has established a trademark for their lignin (BioligninTM) and advertises it as a direct
substitute for phenols in most of its industrial applications. These include glues and the
plastics polyurethanes, polyesters, phenolic resins and exoxy resins.
According to CIMV, their contract price for BioligninTM is at 1,450 EUR/t dry matter
(Benjelloun 2011). In order to get a better idea about the feasible price ranges for lignin, the
price for phenol may be used as a reference (Michels et al. 2009, p. 219). According to the
ICIS pricing database, the spot price for phenol in North-West Europe was on average over
the years 2007-2012 about 1,200 EUR/t. The price provided by CIMV is therefore in a realistic
range, although a bit high. In order to account for uncertainties in the technical properties
and substitutability of lignin for phenol, we therefore use a slightly lower price of 1,000
EUR/t.
3.3.1.7 Fertiliser
As said above, the digestate coming out of the biogas plant contains nitrogen and phosphate,
which can be sold as fertiliser. In order to assess the fertiliser value of this digestate, the
volumes of both elements as obtained from the IFEU dataset had been valued with the
average price of nitrogen and phosphorus between 2008 and 2010 in France, where the CIMV
pilot plant is located. This average price was 952 EUR/t for nitrogen and 1,080 EUR/t for
phosphorus (Figure 10).
Figure 10: Prices for nitrogen and phosphorus in France, 2008-2010 Source: Agreste 2013

35
3.3.2 Results on CAPEX
As explained in section 3.1.1, the CAPEX have been estimated by making use of the
correlation between the rated power and the fixed capital investment.
The total rated power of the plant has been calculated as follows. First, the unintegrated heat
demand of the organosolv step and the downstream processing of the C5, C6 and lignin
fraction has been added up and adjusted for the heat losses to the atmosphere (1.25% in the
favourable case, 2.50% in the standard case and 5.00% in the less favourable case). Then, the
unintegrated total power and cooling demand from the pretreatment step to the downstream
processes has been added. The resulting figure has been divided by the annual operating
time of 8,000 h to arrive at the estimate for the rated power in MW, adjusted for a 10%
surcharge to arrive at the connected power. The same has been done for the calculated
connected power of the biogas and CHP plant.
By applying the formula shown in section 3.1.1, the estimate for FCI is derived and, by
adding 4% for working capital, the estimate for the total CAPEX. The results for all scenarios
are shown in Figure 11. One problem in this approach arises due to the fact that the energy
demand differs between the standard, favourable and less favourable sub-scenarios, and
thus would the CAPEX estimate. This, however, is counterintuitive because the same
equipment would need to be bought independent of the process configuration. Therefore the
same CAPEX estimated for the standard sub-scenario has been applied to the other two sub-
scenarios.
Figure 11: Results for CAPEX Source: nova 2013
As can be seen from Figure 11, the CAPEX estimate varies between 123 mln EUR for the
fallback option and 161 mln EUR for the scenario with ethylene production for PVC.

36
3.3.3 Results on OPEX
In this section, the results on OPEX are presented and discussed. The analysis is structured
into biomass feedstock, operating materials, utilities, operating labour, other direct
manufacturing costs, fixed manufacturing costs and general expenses.
3.3.3.1 Feedstock
All scenarios use wheat straw as feedstock except variations of the first main scenario using
hardwood, rice straw, miscanthus or SRC poplar. In all cases it is assumed that the full
demand of the bioefinery (150,000 t or 500,000 t) would be supplied from one single
feedstock source. The problem of finding adequate price levels to be chosen for the economic
assessment lies in the fact that the need to supply such large quantities infers a large radius
from which the feedstock would need to be supplied from. This inevitably drives up logistics
costs per tonne feedstock. These have been modelled in a supply chain model which is
documented in Deliverables 1.4 and 1.5. while the costs up to the farmgate/roadside have
been assessed in Deliverable 1.2.
Without going into detail, the supply chain model assessed the cost-optimal location of a
biorefinery plant within each of the case study regions and allowed for mixed feedstocks in
those case studies where multiple feedstocks were assumed. However, since the dataset for
the economic assessment does not provide for mixed feedstocks, the theoretical procurement
costs are needed for the situation in which the full demand of the plant would have to be
provided by either wheat straw, rice straw, hardwood, miscanthus or poplar. The results of
this calculation are shown in Figure 12. At first glance, the very high costs for barley straw in
the French case study are striking. This result is due to the fact that barley growing areas are
fragmented around the periphery of the region so that the straw needs to be transported over
long distances in order to collect 150,000 t. In reality, barley would therefore hardly be the
feedstock of choice for this region. By contrast, basically zero transportation costs were
assumed for SRC poplar in Hungary since it was concluded in the supply chain model that
the poplar plantations could be located just around the biorefinery plant.
Figure 12: Comparison of feedstock prices Source: nova 2013

37
Since the techno-economic assessment is not performed for a specifically defined location,
the need arises to derive quasi-average procurement costs from the case study results. In
order to take the results of the supply chain model into account, we have therefore taken the
averages between the calculated costs at farm gate and the procurement costs including
transportation and storage from each case study and each feedstock. For wheat straw, we
choose again the average of this calculated cost from the French and Hungarian case study
which results in about 110 EUR/t DM. For rice straw, we take the 80 EUR/t DM as obtained
from the Indian case study (the rounded average between the cost at farm gate and the cost
including transportation and storage). For hardwood, the procurement of forest wood is
assumed which resulted in both Hungary and Germany in the same price level of about 70
EUR/t DM. For miscanthus, we only have the results from the French case study which we
round to 100 EUR/t DM. Finally, for SRC poplar, the assumption of near-zero transportation
costs appears to be less realistic in most cases. We therefore assume a surcharge of 15 EUR/t
for storage and transportation (as in the case of the hardwood case study in Germany) and
arrive at a price of 80 EUR/t DM.
3.3.3.2 Operating materials
Apart from the biomass feedstock, the assessed biorefinery concepts consume some or all the
following operating materials and auxiliaries:
Organic acids (acetic and formic acid)
Hydrogen peroxide
Cellulase
Sodium hydroxide
Ammonia
Monopotassium phosphate
Ammonium sulfate
Saccharomyces cerevisiae yeast
Nickel
Hydrogen (catalytic process only)
The results for each of these operating materials are presented and discussed below.
Organic acids
The organic acids acetic acid and formic acid are used during the organosolv process to
separte the biomass in its three main components (cellulose, lignin and C5 syrup).
Both acids are colourless liquids. Acetic acid is the main component of vinegar (apart from
water; vinegar is roughly 8% acetic acid by volume), and has a distinctively sour taste and
pungent smell. Formic acid has a highly pungent, penetrating odor at room temperature. It
is miscible with water and most polar organic solvents. It has many uses spanning from
preservative to tanning agent and intermediate for synthesis.
For the base case, 460 EUR/t are assumed for acetic acid and 750 EUR/t for formic acid. Both
prices are average figures for the EU-27 for 2010 derived from the Eurostat database

38
(Eurostat 2013). The average spot price of acetic acid in Europe in 2010 was 464 EUR/t
according to the ICIS Pricing database, so very much in line with the Eurostat data.
Hydrogen peroxide
Hydrogen peroxide (H2O2) is a strong oxidizer. It is a clear liquid, slightly more viscous than
water. In dilute solution, it appears colorless. Due to its oxidizing properties, hydrogen
peroxide is often used as a bleach or cleaning agent. It is used in the BIOCORE process in the
delignification step of the cellulose obtained from the organosolv process.
According to expert information from project partner ARKEMA, the price for hydrogen
peroxide fluctuates between 500-550 EUR/t. For the base case, a price of 525 EUR/t has been
assumed.
Cellulase
Cellulase is a mixture of enzymes able to convert cellulose to a pool of fermentable sugars. In
the BIOCORE project these are used to obtain fermentable C6 sugars from the cellulose
produced in the organosolv process. Usually they are obtained from the fungus Trichoderma
reesei. They can either be produced on site using a sidestream of nutrients for the fungus
fermentation or they can be delivered as "ready to use" to the biorefinery.
There is great uncertainty regarding the price for cellulase because enzymes are sold by
activity, not by tonne. The needed enzyme activity, however, is not exactly known for the
BIOCORE processes. Furthermore, current prices from enzyme producers are confidential
and could note be used for the analysis. The estimation of enzyme costs therefore relies on a
literature review. Hong et al. 2013 studied cellulase costs for lignocellulosic ethanol
production from on-site and off-site production and found costs of about 4-7 USD/kg of
protein (about 3,000-5,000 EUR/t) for on-site production (similar costs are also reported by
Humbird et al. 2011) and 4-9 USD/kg for off-site production (about 3,000-7,000 EUR/t). Due
to the high uncertainty of actual costs in the case of the BIOCORE processes, we take a more
conservative estimate of 8,000 EUR/t of protein for the base case.
Sodium hydroxide
Sodium hydroxide (NaOH) is the principal strong base used in the chemical industry. It is a
white solid, and is a highly caustic metallic base and alkali salt. In the BIOCORE process,
NaOH is used in the deacidification of the pulp, as pH controlling agent in the fermentations
and in the PF resin manufacture.
As the base case price we are assuming 370 EUR/t. This is the price derived from the Eurostat
Prodcom database for 2010 for the EU-27.
Ammonia
Ammonia (NH3) is a colourless gas with a characteristic pungent smell. It contributes
significantly to the nutritional needs of terrestrial organisms by serving as a precursor to
food and fertilizers. In the BIOCORE process ammonia is used as nutrient in fermentations
often in the form of salts.

39
As the base case price we are using 310 EUR/t of NH3. This is the average spot price of
ammonia in Europe in 2010 according to the ICIS Pricing database (ICIS 2013).
Monopotassium phosphate
Monopotassium phosphate (KH2PO4) is a soluble salt which is used as a fertilizer, food
additive and fungicide. It is a source of phosphorus and potassium. It is also a buffering
agent. In the BIOCORE process, it is used in the fermentations as buffering agent and
phosphorus and potassium supply.
As the base price, we are using 870 EUR/t which is the average price for phosphates in the
EU-27 in 2010 according to the Eurostat Prodcom database.
Ammonium sulphate
Ammonium sulphate, (NH4)2SO4, is an inorganic salt with a number of commercial uses. Its
most common use is as a soil fertilizer. In the BIOCORE process it is used as nutrients source
for fermentations.
The base price for ammonium sulphate of 110 EUR/t is the average price in the EU-27 in 2010
according to the Eurostat Prodcom database. This price is in line with other international
sources (Fertilizerworks 2013).
Saccharomyces cerevisiae
Saccharomyces cerevisiae is the well-known baker’s yeast. It is used to convert glucose to
ethanol. In the BIOCORE process it is possible not only to convert C6 sugars (glucose) but
also C5 sugars (xylose) to ethanol due to a genetically modified strain of saccharomyces
cerevisiae.
The base price of 970 EUR/t is the average price for baker’s yeast in the EU-27 for 2010. The
genetically optimized yeast may however be more expensive so that we use 1,000 EUR/t as
the base price.
Nickel catalyst
Catalysts are needed to increase the rate of a chemical reation and improve the overall
energy balance of a process, because they lower the activation energy during the transition
from substrate to product. In the BIOCORE process a catalyst is needed for the catalytic
production of xylitol from xylose.
The so-called Raney Nickel, derived from a nickel-aluminum alloy, is used as catalyst. Raney
Nickel is a fine-grained solid containing about 90% nickel usually added with molybdenum
to increase reactivity and selectivity (BIOCORE D5.5, p. 124). The activity of the Raney
Nickel decreases during the process but can be regenerated by washing with an alcohol
(mainly ethanol) solution (BIOCORE D5.5, p. 141).
According to the Eurostat Prodcom database, the price for nickel alloy plates and sheets was
about 15,000 EUR/t in the EU-27 in 2010, that of nickel alloy bars and rods about 19,000
EUR/t and that of Nickel powders and flaces about 23,000 EUR/t. These price indications are

40
in line with quotes for Raney Nickel found on business platforms. As the price for the base
case we will therefore apply 19,000 EUR/t for the nickel catalyst.
However, new catalyst typically does not have to be bought every year but may be reused
for a limited number of cycles. Since there is uncertainty about the number of cycles that
would be feasible, the cost analysis assumes for the base case that new nickel catalyst would
only have to be bought every other year, so that the annual costs amount to 9,500 EUR/t.
H2 (catalytic process only)
Hydrogen (H2) is a colorless, odorless, tasteless gas. Its industrial production is mainly from
the steam reforming of natural gas and less often from more energy-intensive hydrogen
production methods like the electrolysis of water. In the BIOCORE process it is used to
reduce xylose to xylitol with the nickel catalyst.
For the base case, we are using a hydrogen price of 3,000 EUR/t. According to the Eurostat
Prodcom database, the average price of hydrogen was about 16 EUR/m3 in the EU-27 in 2010.
The following Table 6 summarises the unit costs in EUR/t that are applied for all operating
materials in the base case.
Table 6: Prices for operating materials for the base case scenarios
Operating material Price in EUR/t
Acetic acid 460
Formic acid 750
Hydrogen peroxide 525
Cellulase 8,000
NaOH 370
NH3 310
KH2PO4 870
Ammonium sulfate 110
S. cerevisiae 970
Nickel 9,500
H2 (catalytic process only) 3,000
Source: nova 2013
The following Figure 13 shows an overall comparsion of the estimates of annual costs for
operating materials for the standard scenarios. As can be seen, the costs for the organic acids
and hydrogen peroxide are very similar between the different scenarios. Together, these
account for about 40% of operating material costs in most scenarios. Costs for cellulase alone
account for another 40% and even 50% in the scenarios based on SHF and SSF ethanol.
Another large cost contributor is NaOH with about 15%. The remaining operating materials
are of minor importance, with the exception of the nickel catalyst. However, the costs for the
catalyst, accounting for about 30% of operating material costs in the Xyl Cat/IA scenario may
be further reduced if more extensive recycling turned out to be feasible.

41
Figure 13: Annual costs of operating materials for the standard scenarios Source: nova 2013
3.3.3.3 Utilities
The concept of utilities has been explained in section 3.1.2.1. From the list of conceivable
utilities, the evaluated biorefinery concepts all use water, electricity and steam. Electricity is
either obtained from the grid or from conversion of by-products into electricity in a biogas
plant. Steam is generated either with natural gas or with lignin or straw as a source of
energy.
Water (Tap water and process water)
Water is used in many steps of the BIOCORE process, as fermentation medium, as solvent
and as transport medium. Usually, a distinction is made between tap water and process
water. The cooling demand is statisfied by discharging heated water to a river for which no
costs are assumed.
Tap water is the water that is directly extracted from the public supply sytem to the
biorefinery while process water is the water that has already been used in the process. It can
be reused in the same step or in other steps. Process water may need to be treated to remove
wastestreams that are in it.
For the base case, the price for tap water is valued at 1.3 EUR/m3, which was the average
industrial water price in several European countries in the late 1990s (EEA 2003).
Electricity
Most of the electricity demand is covered by purchasing power from the public grid. For this,
the inter-project harmonization document (Piotrowski et al. 2012) stipulated to use a price of
0.0923 EUR/kwh, which was the average electricity price for industrial users in the EU-27 in

42
2010. The remaining electricity demand is covered from an internal CHP plant that is partly
fuelled from natural gas and partly from biogas.
Steam
As stated above, the total heat demand is satisfied through a CHP plant that uses natural gas
and biogas. Also the natural gas price has been harmonized between SupraBio, Eurobioref
and BIOCORE and determined at 7.802 EUR/GJ (0.0281 EUR/kwh), which was the average
natural gas price for industrial users in the EU-27 in 2010.
In three of the scenarios (see Table 5), the lignin is used to fuel the CHP plant instead of
selling it as a product. Thus, costs for natural gas are saved but revenues from selling the
lignin are foregone. Furthermore, in the “straw powered” scenario, additional cereal straw is
bought in order to fully replace the natural gas demand by straw.
The following Figure 14 shows the overall comparison of the estimates for annual utility
costs for the standard scenarios as well as the favourable and less favourable sub-scenarios.
Overall, utilities make up a cost share of about 10-30 mln EUR, from which tap water
contributes about 5%, electricity from the grid about 20% and natural gas about 75%.
Figure 14: Utility costs for the standard scenarios Source: nova 2013
Utilities are saved by process integration. However, the degree to which integration is
feasible differs between processes. This is captured in the IFEU dataset by assuming different
percentages of overall heat and cooling savings by integration (between 40-80%), depending
on the type of process as well as the sub-scenarios (favourable, standard, less favourable).
An allocation problem arises now in the quantification of utility demand up to the
organosolv process: The percentage of savings by integration is only given for the whole
process, but when applying these savings to the organosolv process, the utility demand of
the integrated organolv step appears to vary between processes. This is counterintuitive
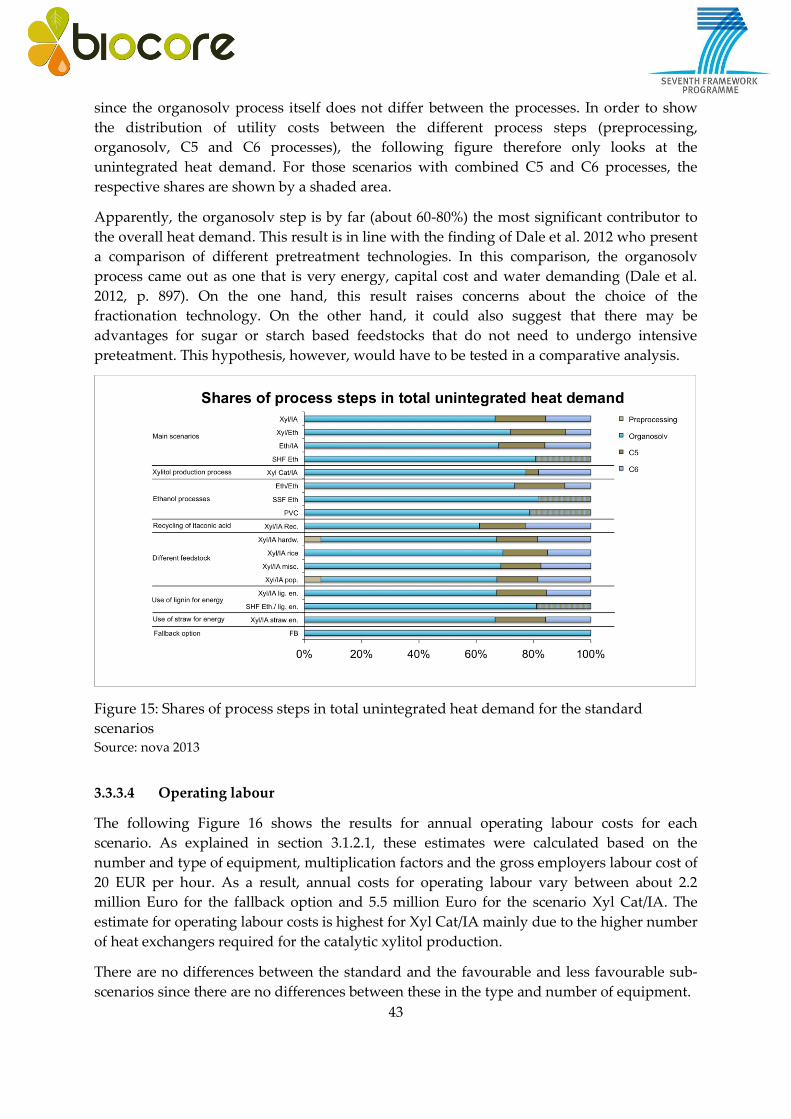
43
since the organosolv process itself does not differ between the processes. In order to show
the distribution of utility costs between the different process steps (preprocessing,
organosolv, C5 and C6 processes), the following figure therefore only looks at the
unintegrated heat demand. For those scenarios with combined C5 and C6 processes, the
respective shares are shown by a shaded area.
Apparently, the organosolv step is by far (about 60-80%) the most significant contributor to
the overall heat demand. This result is in line with the finding of Dale et al. 2012 who present
a comparison of different pretreatment technologies. In this comparison, the organosolv
process came out as one that is very energy, capital cost and water demanding (Dale et al.
2012, p. 897). On the one hand, this result raises concerns about the choice of the
fractionation technology. On the other hand, it could also suggest that there may be
advantages for sugar or starch based feedstocks that do not need to undergo intensive
preteatment. This hypothesis, however, would have to be tested in a comparative analysis.
Figure 15: Shares of process steps in total unintegrated heat demand for the standard
scenarios Source: nova 2013
3.3.3.4 Operating labour
The following Figure 16 shows the results for annual operating labour costs for each
scenario. As explained in section 3.1.2.1, these estimates were calculated based on the
number and type of equipment, multiplication factors and the gross employers labour cost of
20 EUR per hour. As a result, annual costs for operating labour vary between about 2.2
million Euro for the fallback option and 5.5 million Euro for the scenario Xyl Cat/IA. The
estimate for operating labour costs is highest for Xyl Cat/IA mainly due to the higher number
of heat exchangers required for the catalytic xylitol production.
There are no differences between the standard and the favourable and less favourable sub-
scenarios since there are no differences between these in the type and number of equipment.
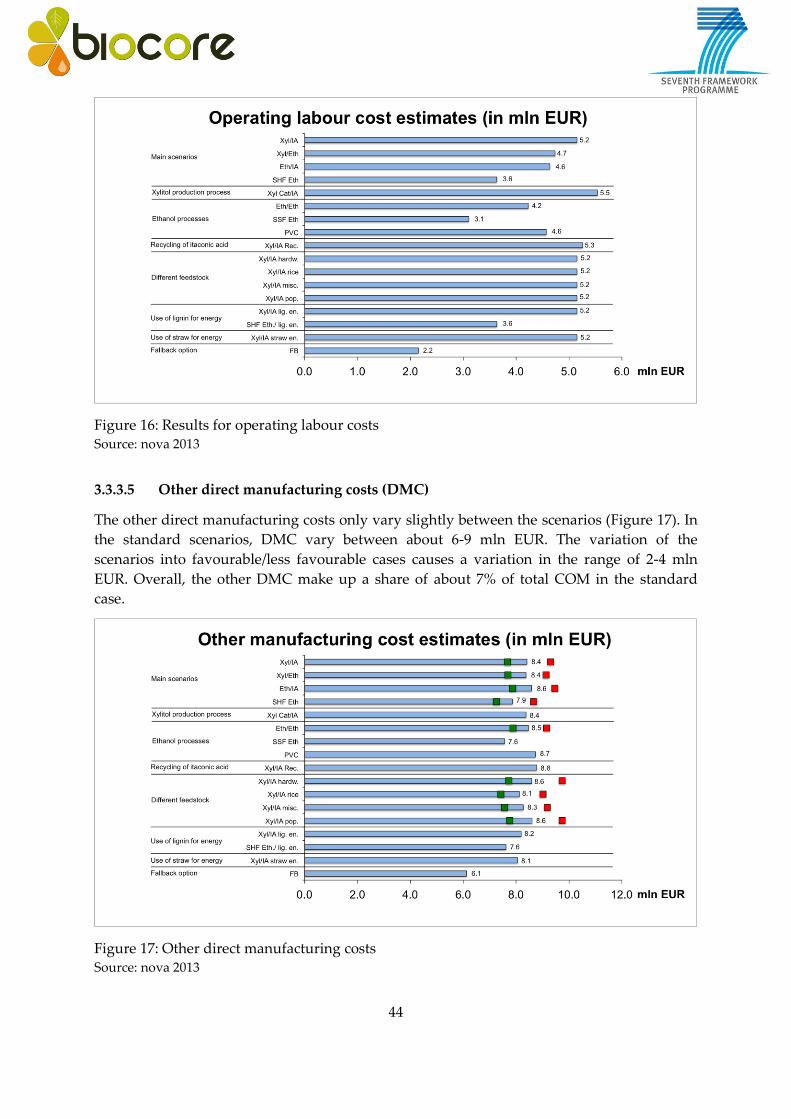
44
Figure 16: Results for operating labour costs Source: nova 2013
3.3.3.5 Other direct manufacturing costs (DMC)
The other direct manufacturing costs only vary slightly between the scenarios (Figure 17). In
the standard scenarios, DMC vary between about 6-9 mln EUR. The variation of the
scenarios into favourable/less favourable cases causes a variation in the range of 2-4 mln
EUR. Overall, the other DMC make up a share of about 7% of total COM in the standard
case.
Figure 17: Other direct manufacturing costs Source: nova 2013

45
3.3.3.6 Fixed manufacturing costs (FMC)
Fixed manufacturing costs (depreciation, taxes and insurance, plant overheads) make up
about 15-20 mln EUR per year or 18% of total COM. Since it was assumed that FMC only
depend on FCI and COL, there is no variation between the standard and the favourable and
less favourable sub-scenarios.
Figure 18: Fixed manufacturing costs Source: nova 2013
3.3.3.7 General expenses (GE)
Different to the FMC, general expenses (GE) differ between the standard cases and the
favourable/less favourable sub-scenarios since the model proposes these to depend not only
on the FCI and COL, but also on the annual manufacturing costs (COM). The results in Figure
19 show that estimates are in the range of about 15-20 mln EUR.

46
Figure 19: General expenses Source: nova 2013
3.3.3.8 Overall comparison of OPEX
The following Figure 20 shows the overall comparison of annual manufacturing costs
(OPEX). For the standard cases, OPEX tend to lie at around 100-115 mln EUR, in the less
favourable sub-scenarios increasing up to about 150 mln EUR, in the favourable ones some
fall below 80 mln EUR.
Figure 20: Annual manufacturing costs Source: nova 2013
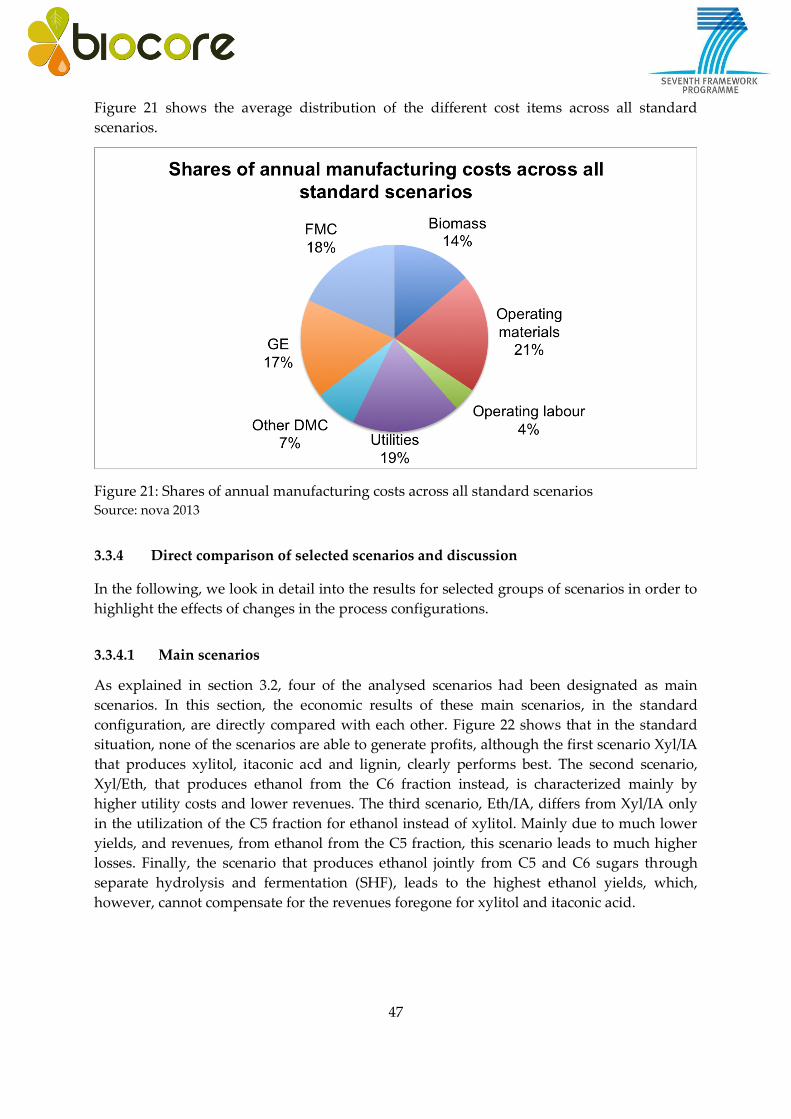
47
Figure 21 shows the average distribution of the different cost items across all standard
scenarios.
Figure 21: Shares of annual manufacturing costs across all standard scenarios Source: nova 2013
3.3.4 Direct comparison of selected scenarios and discussion
In the following, we look in detail into the results for selected groups of scenarios in order to
highlight the effects of changes in the process configurations.
3.3.4.1 Main scenarios
As explained in section 3.2, four of the analysed scenarios had been designated as main
scenarios. In this section, the economic results of these main scenarios, in the standard
configuration, are directly compared with each other. Figure 22 shows that in the standard
situation, none of the scenarios are able to generate profits, although the first scenario Xyl/IA
that produces xylitol, itaconic acd and lignin, clearly performs best. The second scenario,
Xyl/Eth, that produces ethanol from the C6 fraction instead, is characterized mainly by
higher utility costs and lower revenues. The third scenario, Eth/IA, differs from Xyl/IA only
in the utilization of the C5 fraction for ethanol instead of xylitol. Mainly due to much lower
yields, and revenues, from ethanol from the C5 fraction, this scenario leads to much higher
losses. Finally, the scenario that produces ethanol jointly from C5 and C6 sugars through
separate hydrolysis and fermentation (SHF), leads to the highest ethanol yields, which,
however, cannot compensate for the revenues foregone for xylitol and itaconic acid.
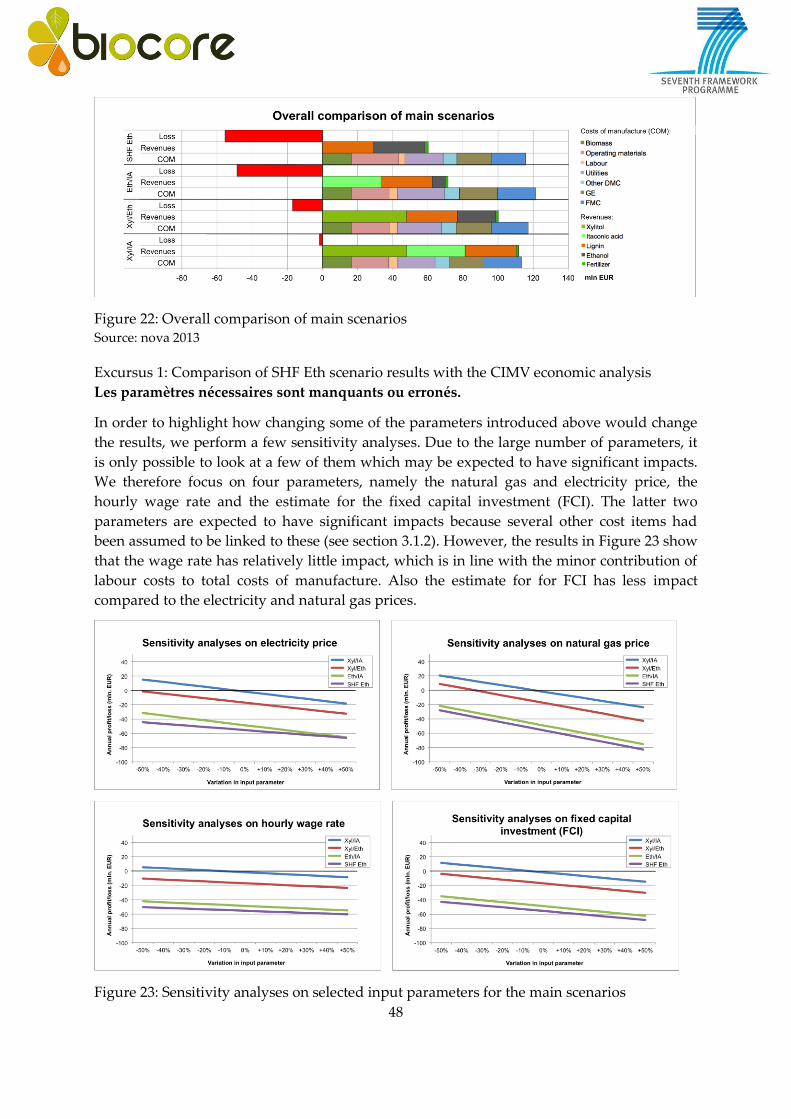
48
Figure 22: Overall comparison of main scenarios Source: nova 2013
Excursus 1: Comparison of SHF Eth scenario results with the CIMV economic analysis
Les paramètres nécessaires sont manquants ou erronés.
In order to highlight how changing some of the parameters introduced above would change
the results, we perform a few sensitivity analyses. Due to the large number of parameters, it
is only possible to look at a few of them which may be expected to have significant impacts.
We therefore focus on four parameters, namely the natural gas and electricity price, the
hourly wage rate and the estimate for the fixed capital investment (FCI). The latter two
parameters are expected to have significant impacts because several other cost items had
been assumed to be linked to these (see section 3.1.2). However, the results in Figure 23 show
that the wage rate has relatively little impact, which is in line with the minor contribution of
labour costs to total costs of manufacture. Also the estimate for for FCI has less impact
compared to the electricity and natural gas prices.
Figure 23: Sensitivity analyses on selected input parameters for the main scenarios

49
Source: nova 2013
3.3.4.2 SHF Eth: Comparison with other ethanol-based processes
For four of the assessed biorefinery schemes, ethanol (or, in a further step, ethylene) is the
main product and as a by-product, lignin is produced for material use. The overall
comparison of all scenarios has already shown that these scenarios fare poorly compared to
those with the production of xylitol and itaconic acid. On the one hand, this is due to the
high energy demand of the distillation step (see Figure 14), and on the other hand due to low
revenues from selling ethanol.
Figure 24 shows that the scenario with separate hydrolysis and fermentation (SHF Eth) still
performs better compared to the simultaneous saccharification and fermentation (scenario
SSF Eth) and the separate conversion from C5 and C6 sugars (scenario Eth/Eth). Regarding
the scenario that converts ethanol further into ethylene for PVC production, it was therefore
assumed that this conversion process would be an add-on onto the SHF scenario. As Figure
24 shows, this process leads to higher costs and lower revenues compared to the scenario
SHF Eth.
Figure 24: Overall comparison of biorefinery schemes with ethanol or ethylene as main
products Source: nova 2013
3.3.4.3 Xyl/IA and SHF Eth: Comparison of lignin utilizaion
Apart from using lignin as a material, it may also be used for energy for partly replacing
natural gas. The effects of such a use of lignin for energy has been studied for two of the
main scenarios – Xyl/IA and SHF Eth. As Figure 25 shows, in both scenarios, the savings in
natural gas fail to compensate for the forgone revenues from selling the lignin. This result
may even be more in favour of the material use of lignin if it can be marketed for higher
value applications such as lignin-based PF resins.
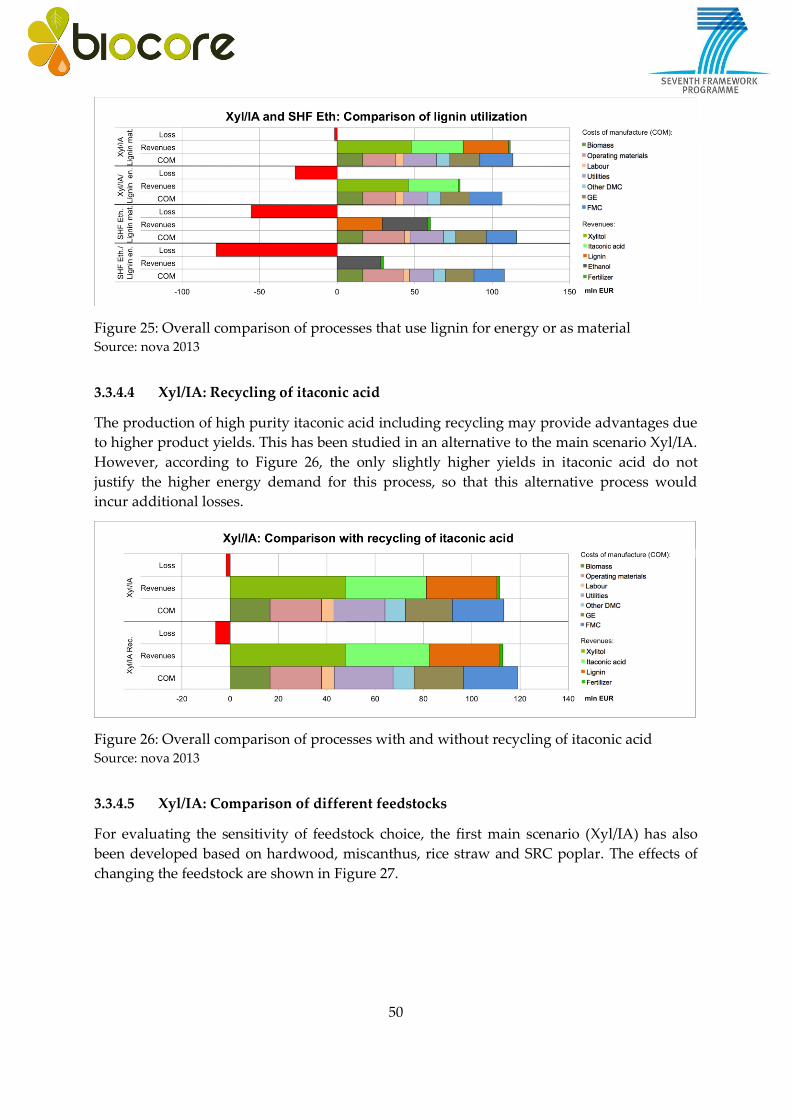
50
Figure 25: Overall comparison of processes that use lignin for energy or as material Source: nova 2013
3.3.4.4 Xyl/IA: Recycling of itaconic acid
The production of high purity itaconic acid including recycling may provide advantages due
to higher product yields. This has been studied in an alternative to the main scenario Xyl/IA.
However, according to Figure 26, the only slightly higher yields in itaconic acid do not
justify the higher energy demand for this process, so that this alternative process would
incur additional losses.
Figure 26: Overall comparison of processes with and without recycling of itaconic acid Source: nova 2013
3.3.4.5 Xyl/IA: Comparison of different feedstocks
For evaluating the sensitivity of feedstock choice, the first main scenario (Xyl/IA) has also
been developed based on hardwood, miscanthus, rice straw and SRC poplar. The effects of
changing the feedstock are shown in Figure 27.

51
Figure 27: Overall comparison of processes with variation of feedstocks Source: nova 2013
Both the Xyl/IA scenario with the feedstocks hardwood and SRC poplar generate by far the
best result with annual profits in the range of 15-20 mln EUR. While the annual costs of
manufacture are very similar to the scenario based on wheat straw, the difference mainly
stems from the higher products yields, owing to the higher shares of usable components in
hardwood and SRC poplar compared to wheat and rice straw and miscanthus (Table 7).
Table 7: Composition of assessed feedstocks
Component Wheat
straw
Rice
straw
Hardwood SRC poplar Miscanthus
Hemicellulose / xylose 21% 21% 29% 21% 19%
Cellulose / glucose 36% 36% 46% 48% 42%
Lignin 20% 15% 23% 24% 23%
Sum of usable components 77% 72% 98% 93% 84%
Ash 6% 15% 0.5% 2% 2%
Others 17% 13% 1.5% 5% 14%
Source: IFEU 2013a
3.3.4.6 Xyl/IA: Effects of scale
All scenarios have been developed for a capacity of 150,000 t dry matter, expect for the case
of rice straw. In this case, the work of WP1 has revealed that also a capacity of 500,000 t could
be feasible in the selected case study region in India. The effects of upscaling the plant’s
capacity are therefore explored only by taking the example of rice straw in India.

52
Figure 28 shows the results from changing the capacity in the Xyl/IA standard scenario from
150,000 t to 500,000 t of rice straw. Since the function for the estimation of the fixed capital
costs (FCI) is non-linear (see section 3.1.1), costs do not increase at the same rate as the
revenues do. The model therefore accounts for returns-to-scale. Due to these assumed
returns-to-scale, when moving to a capacity of 500,000 t of rice straw, this may in fact lead to
high annual profits as Figure 28 shows.
Figure 28: Comparison of capacities in the rice straw scenario Source: nova 2013
In the inter-project harmonization document (Piotrowski et al. 2012), it had been decided to
apply the following scale relationship for capital costs: Cost B = Cost A (Scale B / Scale A)0.7.
The default value of the scale factor (0.7) had been chosen in line with literature and
engineering convention (Peters et al. 2003). When applying this formula to the FCI as
estimated for a capacity of 150,000 t, the results indicate annual profits in the range of 30 mln
EUR for the larger capacity of 500,000 t, compared to about 40 mln EUR as obtained from the
current model. Apparently, the current model implies greater returns-to-scale. Evidently, the
actual effects of upscaling the capacity could only be proven by empirical evidence.
3.3.5 Results on economic sustainability of assessed BIOCORE value chains
In the following, we present the results on the overall economic viability of the assessed
biorefinery concepts.
3.3.5.1 Calculation of necessary product price support
As said above, the Internal Rate of Return (IRR) is the main profitability indicator for the
overall comparison of all scenarios. The benchmark, at or above which an investment will be
considered to be favourable, is set to an IRR of 25%.
As shown above, in the standard configuration, almost all of the biorefinery schemes would
currently make annual losses. Only a few (Xyl Cat/IA and Xyl/IA based on poplar and
hardwood) would make profits, but these would not be sufficient to achieve an IRR of 25%.
With the given set of parameter values, we therefore conclude that they would need some
kind of support mechanism in order to reach the target of 25% IRR which would render an
investment interesting.

53
One possible support mechanism would be the direct price support on the sold production
of the biorefinery. In a first instance we assume that all sold products would be supported by
a certain percentage on top of the market prices assessed in section 3.3.1 without
GreenPremium. The results in Figure 29 clearly show that the first main scenario (Xyl/IA)
and all of its variations would need the lowest overall price support in order to reach the
target of 25% IRR (indicated by green colour). Only in the favourable sub-scenarios, the
Xyl/IA scenarios based wheat straw, hardwood, poplar, miscanthus and rice would even be
able to achieve an IRR above 25% without support.
The dotted vertical lines in Figure 29 indicate actual current price support levels for biodiesel
and bioethanol in Europe. These lie between about 45% in the case of average European
support levels for biodiesel (Jung et al. 2010, p. 66) and 70% in the case of bioethanol support
in Germany (nova 2012). The support resulting from the biofuel mandate can be illustrated
by taking the example of Germany. According to the German biofuel quota act
(Biokraftstoffquotengesetz), distributors of Otto and Diesel fuels have to pay a fine if they do
not comply with the requirement to add fixed amounts of biodiesel and bioethanol. The
existence of these fines leads to the situation that the distributors’ purchasing price of
biodiesel and bioethanol could rise exactly by the amount of these fines (60 ct/l of biodiesel
and 90 ct/l of bioethanol) before a mineral oil company would rather accept the fine than
complying with the quota. For a treatment of biofuel support mechanisms in other European
countries, see e.g. Jung et al. 2010.
Figure 29: Necessary price support to reach the target of IRR = 25%, without GreenPremium Sources: nova 2013, Jung et al. 2010
* Price support levels for biodiesel (black dotted lines; on average about 45% in the EU in 2010 and
50% in Germany in 2012) and bioethanol (blue dotted lines; on average about 60% in the EU in 2010
and 70% in Germany in 2012).

54
This example shows that the necessary price support for some of the selected biorefinery
schemes could be quite moderate compared to the actually existing current support for
biofuels. In the standard sub-scenarios, all biorefinery schemes based on the main scenario
Xyl/IA, except the one with use of lignin for energy, could become profitable with a price
support level well below 50%.
The results from section 3.3.1 indicate that itaconic acid could fetch GreenPremiums of 20-
100%. For an assessment of the impact of this price premium we assume a GreenPremium of
50%. Furthermore, ethylene could fetch a GreenPremium of at least 30%. As Figure 30 shows,
the GreenPremium for itaconic acid could cut the remaining necessary price support down
further so that even the standard sub-scenarios of Xyl/IA based on hardwood and poplar
could become very close to profitability without any further support. The GreenPremium for
ethylene, however, could not bring the PVC scenario anywhere near profitability.
Figure 30: Necessary price support to reach the target of IRR = 25%, with GreenPremium * Price support levels for biodiesel (black dotted lines; on average about 45% in the EU in 2010 and
50% in Germany in 2012) and bioethanol (blue dotted lines; on average about 60% in the EU in 2010
and 70% in Germany in 2012).
3.3.5.2 Calculation of the impacts of capital investment support
In then new framework of the European Bioeconomy by DG Research & Innovation and the
Public Private Partnership Bio-based Industries Consortium (BIC) it will be possible to get
financial support for demonstration plants (40% average) and for flagship plants (average
15%). In combination with other programmes, e.g. regional development or member states
support, the capital investment could be in total reduced by 50% in some cases.
We therefore calculate in addition the impacts of a reduction of CAPEX to 50% on
profitability. The following Figure 31 shows the impacts of such a support mechanism on the
remaining necessary price support (with GreenPremium). With such CAPEX reduction, the
standard sub-scenarios of the first main scenario Xyl/IA based on hardwood, miscanthus and

55
poplar as well as the scenario with catalytic xylitol production could now reach the target of
an IRR of 25% without any further subsidies.
Figure 31: Necessary price support to reach the target of IRR = 25%, with GreenPremium and
a CAPEX cut of 50% * Price support levels for biodiesel (black dotted lines; on average about 45% in the EU in 2010 and
50% in Germany in 2012) and bioethanol (blue dotted lines; on average about 60% in the EU in 2010
and 70% in Germany in 2012).
3.3.5.3 Calculation of necessary cost savings
Apart from increasing revenues, the profitability target could also be reached by cutting
costs in order to achieve the target or allowable costs that would provide an IRR of 25%.
Figure 32 basically mirrors Figure 29 and shows the allowable costs as a percentage of actual
costs.
As an example, in the standard configuration of the Xyl/IA scenario based on hardwood,
costs of manufacture would have to be cut by 21% or to about 90 mln EUR in order to
achieve the target costs. This could of course be achieved in many different ways and
feedback from technical partners would be needed in order to identify those cost drivers that
are too expensive for the value there are contributing to the process. In the case of the Xyl/IA
scenario based on hardwood, the target costs could for example be achieved by cutting the
other direct manufacturing costs, general expenses and fixed manufacturing costs to 55% of
their orginal amount. Alternatively, the target costs could be achieved by cutting the costs for
operating materials and utilities to 50%

56
Figure 32: Allowable costs to reach IRR target (25%) as a percentage of actual costs Source: nova 2013
3.4 Conclusions and outlook
This report has first presented a newly developed model for a techno-economic evaluation
(TEE) of biorefinery processes in a situation of limited data availability (for example no data
for sizing of the equipment). The starting point of the analysis was the estimation of the
capital expenditures (CAPEX) based on the calculated rated power of all equipments of the
whole plant. Applied to the dataset that formed the basis for the sustainability assessment in
the BIOCORE project, this model has proved to achieve reasonably good and coherent
results. The analysis covered four main scenarios and thirteen variations of these, including
sub-scenarios that simulated standard, favourable and less favourable process conditions.
The four main scenarios produce as their main products itaconic acid, xylitol and lignin
(scenario Xyl/IA), xylitol, ethanol and lignin (scenario Xyl/Eth), ethanol, itaconic acid and
lignin (scenario Eth/IA) and ethanol through separate hydrolysis and fermentation and
lignin (scenario SHF Eth). The last one of these main scenarios is also currently developed by
the French company CIMV, so that it was possible to compare the modelling results with the
economics as projected by CIMV. The modelling results were reasonably close the
calculations by CIMV and where deviations were found it was possible to find good reasons
to explain these. The newly developed, coarse model provides therefore, given the limited
available data, satisfactory results.
According to the results of our analysis, in the standard scenarios (which were defined based
on experts' input regarding the most plausible technological performance in 2025), only a
few of the biorefinery schemes based on straw are able to generate profits. Moving from
straw to woody feedstock improves the picture (see below). However, none of these
scenarios are able to achieve the target of an internal rate of return of 25%, which is the
57
standard threshold usually considered necessary to attract capital investment in the
Chemical Industry.
However, a few of theses biorefinery schemes could pass over this treshhold either under
more favourable process conditions or with moderate subsidy levels. Also if customers turn
out to be willing to pay GreenPremiums on selected products, the profitability target could
be achieved for some of the schemes.
For those scenarios with moderate subsidy levels needed, these lie below 20% output price
support in selected cases, which is well below the current support for biofuels (e.g. for
biodiesel on average about 45% in the EU and 50% in Germany and for bioethanol about 60%
in the EU and 70% in Germany). Given the strong political will to develop biorefineries in
Europe and the higher value-added of biorefineries compared to just producing biofuels
from biomass, this result provides a strong support for biorefineries.
An alternative support instrument which results in a CAPEX cut has also been assessed. This
support instrument has been developed within the new framework of the European
Bioeconomy by DG Research & Innovation and the Public Private Partnership Bio-based
Industries Consortium (BIC). According to this programme, it will be possible to get
financial support for demonstration plants (40% average) and for flagship plants (average
15%). In combination with other programmes, e.g. regional development or member states
support, the capital investment could be in total reduced by 50% in some cases. With such an
instrument in place, profitability for many scenarios would be significantly increased.
Furthermore, the analysis has also shown that the biorefinery product portfolio determines
profitability to a large extend. All BIOCORE processes that are focused on ethanol are
expensive and provide only low revenues. Policies targeted at bioethanol production
therefore apparently set wrong incentives. Rather, policies should be directed towards value-
adding chemicals and polymers.
The impact of returns to scale have been assessed for one of the scenarios, which was based
on rice straw in India. In this scenario, the effect from moving from 150,000 t to 500,000 t was
very significant and lead to annual profits in the range of 40 mln EUR compared to losses of
about 10 mln EUR. This result provides a strong case for higher biorefinery capacities.
Also the choice of the feedstock has been shown to be an important determinant for
profitability. The chemical composition, especially the shares of usable components, i.e.
cellulose, hemicellulose and lignin, determines products output and thus revenues. This
effect can make a difference in the range of 20 mln EUR when moving from wheat straw as
feedstock to hardwood (according to the assumptions, the share of usable components in
hardwood was 98% compared to 77% for wheat straw).
The scenarios presented above all assumed one single feedstock. In reality, however, a multi-
feedstock supply is much more realistic and also more sustainable in the long-run: Short
supply or price spikes of one feedstock could be better buffered in a multiple feedstock
scenario.
As another finding of the techno-economic evaluation of the selected biorefinery processes, it
has been shown that the organosolv process itself is the largest contributor to utility costs

58
(about 60-80%). This is an interesting finding and it raises questions about the choice of the
fractionation technology as well as the focus on lignocellulosic feedstocks that need to
undergo intensive pretreatment such as organosolv in our case – in contrast to sugar and
starch, which can be directly used.
Lessons learned:
The economic analysis shows clearly that a biorefinery can and will be much more
profitable compared to a pure biofuel plant.
This is due to higher value added from high-value chemical building blocks and
chances to receive GreenPremium prices for some of the bio-based chemicals or
polymers (in contrast to fuels).
A biorefinery should produce as little as possible low-value chemicals like ethanol
and try to valorize lignin-derived chemicals on the highest level.
The existing political framework is only in favor of biofuels. A new policy in favor of
biorefineries could bring new investments, value added and employment to Europe -
and in addition would even show more CO2 reduction. The recent PPP activities with
support for demonstration plants and flagship investment are the first visible steps in
the right direction.
The analysis supports high capacity biorefinery concepts.

59
4 Social, political and legal sustainability assessment (Task 7.4)
Social, legal and political considerations play a key role with regard to acceptability and
market diffusion of new technologies. Social sustainability in the context of Bio-Commodity
Refinery (BIOCORE) implies that the systems, structures and the relationships formed by the
biorefinery actively support the capacity of current and future generations to evolve within a
sustainable livelihood framework. Evaluating social sustainability of BIOCORE first needs an
appropriate identification of linkages between the bio-refinery supply chain and possible
social structures followed by identification of suitable indicators to make such linkages
measurable and finally their measurement and assessment. Critical social structure would
typically include job creation, human rights, displacement, conflict with other forms of
livelihoods, possible impact on local, national and global dynamics, ability to meet end-users
and consumer needs compared to reference products, etc. Measurement of these issues
through suitable indicators can either be undertaken based on stakeholder discussion and
learning their perception, or through detailed review of literatures. Because of the complex
nature of undertaking such social assessments, a combination of both approaches is more
helpful in presenting robust comprehensive results.
The potential and existing conflicts between the different stakeholders also need to be looked
at. In this context, the legal and political aspects of sustainability explore efforts to address
pressing sustainability concerns through policies, legislation, conventions, directives,
treaties, and protocols. Many countries have implemented policies to foster production and
use of biofuels. Economic instruments including tax exemptions or reliefs, feeding tariffs or
quotas, or strong policies such as the European Renewable Energy Directive (RED) have
been put in place. Legal framework has also been strengthened to promote the use of
biofuels in the countries through various policies and legislations. One good example is the
national biofuel policy of India where the focus of the programme has been on the use of
non-edible feedstocks and molasses (produced as a byproduct of sugarcane based processes)
for biodiesel and bioethanol production. It is also important to understand the various laws
that have direct and indirect effects on the overall sustainability of current and future
operations of biorefineries. At the same time corrective measures could be put forward that
may help in managing possible negative impacts.
4.1 Research methodology and framework
The social, legal and political aspects of sustainability of the BIOCORE project will be carried
out using a broad and established social sustainability appraisal framework. The
methodology involves identification of the stakeholders along the BIOCORE supply chain
and possible sustainability issues arising from BIOCORE operations, identification of
suitable indicators for sustainability measurement and analysis of results. The social
assessment is divided into a general assessment (independent of location for the 3 sites in
Europe) of social impacts using a combination of social impact assessment (SIA) and social
life cycle assessment (sLCA) and a more detailed, as well as site-specific assessment for the
case studies in India using the Multi-criteria analysis.
60
As part of the legal and political assessment, identification and evaluation of country/ region
specific policies related to aspects of the different legal and political issues for the different
parts of the supply chain will be looked at.
4.1.1 Assessment of social, legal and political sustainability: Background and state of
the art
This section presents the background and existing state of art in context of social, legal and
political sustainability assessment.
4.1.1.1 Social Sustainability
The term “social” relates to human society and its members (Wordreference.com, 2008).
Hence social sustainability implies reducing poverty, fair distribution of benefits arsing from
developmental projects, and that dignity for human life is ensured, among others. This is
more than meeting the basic human needs such as the right to health care, education and
housing (Dömling, 2002). Additional issues to be covered are aspects such as employment
rates, equal opportunities, equal treatment of gender and political participation. However,
the social dimension is only one of the three dimensions/pillars of sustainability and needs to
be combined with the assessment across the other pillars to arrive at any comprehensive
sustainability assessment.
A number of sustainability indicator frameworks have been developed. The United Nations
Commission on Sustainable Development has developed indicators for countries to assess
their progress towards sustainable development (UN, 2007). These indicators provide
information on social, economic, environmental and institutional aspects of sustainable
development. These indicators are prepared from a macro perspective and are relevant at
national levels rather than for business purposes and at a project level. The Global Reporting
Initiative (GRI) framework has over 100 environmental, economic and social indicators
divided in the following categories: economic, environment, human rights, product
responsibility, product and service, and society (GRI 2011). While the framework considers
certain parts of supply chains, it is not following the life cycle approach, thus missing on
some life cycle stages, such as transport, use and final disposal of products. A number of
authors have applied the GRI framework to different industries including the mining and
minerals sector (Azapagic 2004), water industry (Christen et al. 2006) and the pharmacy
industry (Veleva et al. 2003). The IChemE sustainability metrics (IChemE 2002) also
considers all three dimensions of sustainability. The environmental indicators include
emissions, waste and effluents as well as resource use; economic indicators include
investments, value, profit and tax; and the social indicators include society and workplace.
However, the IChemE sustainability metrics are suitable for companies rather than for
sectors, products or technologies; besides, it is specific to companies operating in the process
sector. Labuschagne et al. (2005) have also developed criteria for assessing sustainability of
the process industry.
Thus previous authors have outlined the sustainability framework for bio-energy systems
(Elghali et al. 2007; Mikkilä et al. 2009; Krotscheck et al. 2000). However, to date, there are no

61
sustainability indicator frameworks for integrated bio-refineries. This work attempts to
contribute towards the development of such a sustainability assessment framework for the
bio-refinery sector by considering social, legal and political dimensions. The main challenge
of incorporating the social dimension in any assessment is the inherent complexity, since it is
determined by a number of factors such as personal behaviors and perceptions, moral
values, interactions and relations in different social groups. The social dimension may also
have a strong regional character, could be different from case to case and contain a certain
level of subjectivity in terms of importance. Identifying specific social issues for the case of
biorefinery is difficult, as this sector is not established yet. However, some of the general
social issues that apply to other industrial systems are also applicable to this supply chain.
These include employment provision, health and safety, impacts on local communities and
energy security which are some of the social indicators used in this work. Additionally,
certain social impacts (especially those that relate to the impacts on the local community)
could be perceived very differently from region to region and even if they could be
quantified, their results could not be placed against and compared to those of another
biorefinery that belongs to a different production chain somewhere else (even if the products
are the same).
4.1.1.2 Legal and Political sustainability
In addition to the social factors, the legal and political framework has an important role in
the sustainability of bio-refineries. They can create potential barriers for the development of
biorefineries. For example, the established regulations may not fit with the technical
standards. The legal and political aspects of sustainability explore efforts to address pressing
sustainability concerns through policies, legislation, conventions, directives, treaties, and
protocols. It looks into the effectiveness of international law versus national law in protecting
the environment, and about the effect of current laws on future generations. They analyze
the efficacy and shortcomings of present legal instruments, private and public policies, social
movements, and conceptual strategies - offering readers a prelude of steps we must take to
develop laws and policies that will promote sustainability. Absence of proper legal and
political framework can create potential barriers for the development of biorefineries. For
example, the established regulations may not fit with the technical standards. Upscaling
biorefineries from research to industrical application phase calls for consistent and stable
policies over a significant period of time, backed up by efficient legal framework,
opportunity to access funds, environmnent that supports continuous R&D with adequate
pool of trained scientists, priority on the use of agricultural and forestry residues as
feedstock in biorefineries, and realisation of some pilot project plants in different
geographical areas etc.
4.1.2 Stakeholder Categorization
Identifying the relevant stakeholders in the context of a bio-refinery and categorizing them is
an important part of the methodological framework. Owing to the complexity of the supply
chain, which involves various feedstocks, processing routes and products, the industry has a
diverse range of stakeholders with different sustainability interests. The stakeholders include
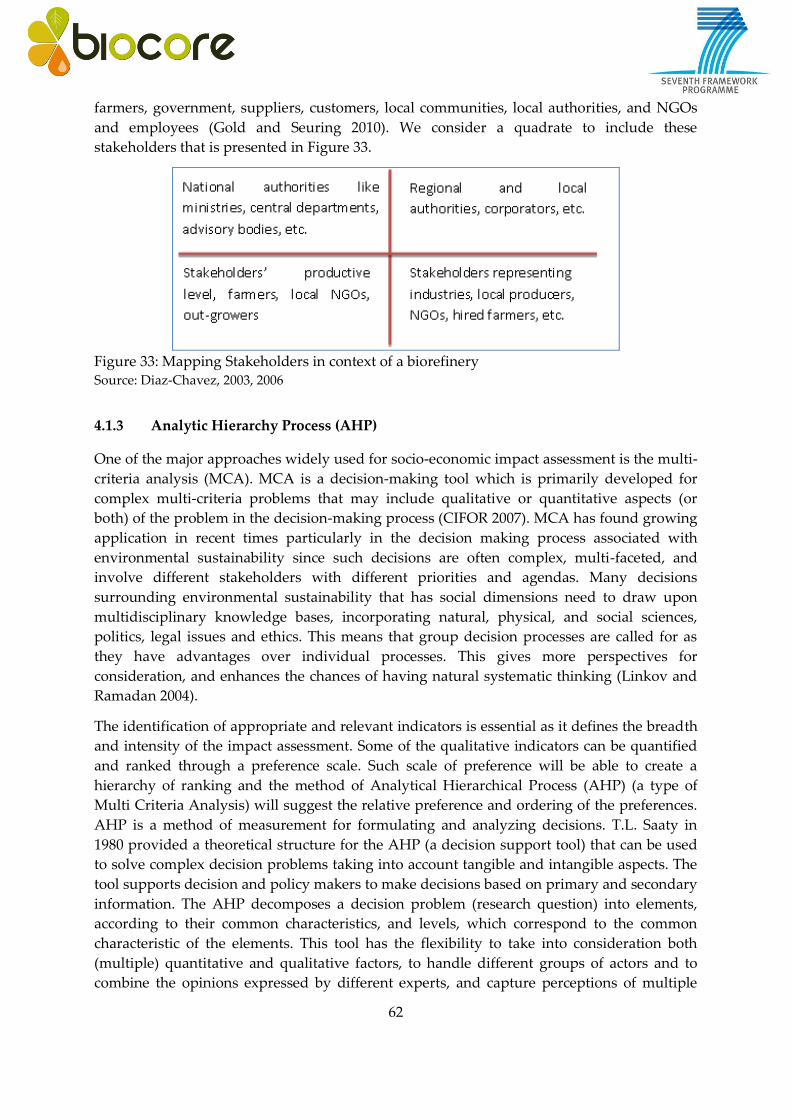
62
farmers, government, suppliers, customers, local communities, local authorities, and NGOs
and employees (Gold and Seuring 2010). We consider a quadrate to include these
stakeholders that is presented in Figure 33.
Figure 33: Mapping Stakeholders in context of a biorefinery Source: Diaz-Chavez, 2003, 2006
4.1.3 Analytic Hierarchy Process (AHP)
One of the major approaches widely used for socio-economic impact assessment is the multi-
criteria analysis (MCA). MCA is a decision-making tool which is primarily developed for
complex multi-criteria problems that may include qualitative or quantitative aspects (or
both) of the problem in the decision-making process (CIFOR 2007). MCA has found growing
application in recent times particularly in the decision making process associated with
environmental sustainability since such decisions are often complex, multi-faceted, and
involve different stakeholders with different priorities and agendas. Many decisions
surrounding environmental sustainability that has social dimensions need to draw upon
multidisciplinary knowledge bases, incorporating natural, physical, and social sciences,
politics, legal issues and ethics. This means that group decision processes are called for as
they have advantages over individual processes. This gives more perspectives for
consideration, and enhances the chances of having natural systematic thinking (Linkov and
Ramadan 2004).
The identification of appropriate and relevant indicators is essential as it defines the breadth
and intensity of the impact assessment. Some of the qualitative indicators can be quantified
and ranked through a preference scale. Such scale of preference will be able to create a
hierarchy of ranking and the method of Analytical Hierarchical Process (AHP) (a type of
Multi Criteria Analysis) will suggest the relative preference and ordering of the preferences.
AHP is a method of measurement for formulating and analyzing decisions. T.L. Saaty in
1980 provided a theoretical structure for the AHP (a decision support tool) that can be used
to solve complex decision problems taking into account tangible and intangible aspects. The
tool supports decision and policy makers to make decisions based on primary and secondary
information. The AHP decomposes a decision problem (research question) into elements,
according to their common characteristics, and levels, which correspond to the common
characteristic of the elements. This tool has the flexibility to take into consideration both
(multiple) quantitative and qualitative factors, to handle different groups of actors and to
combine the opinions expressed by different experts, and capture perceptions of multiple
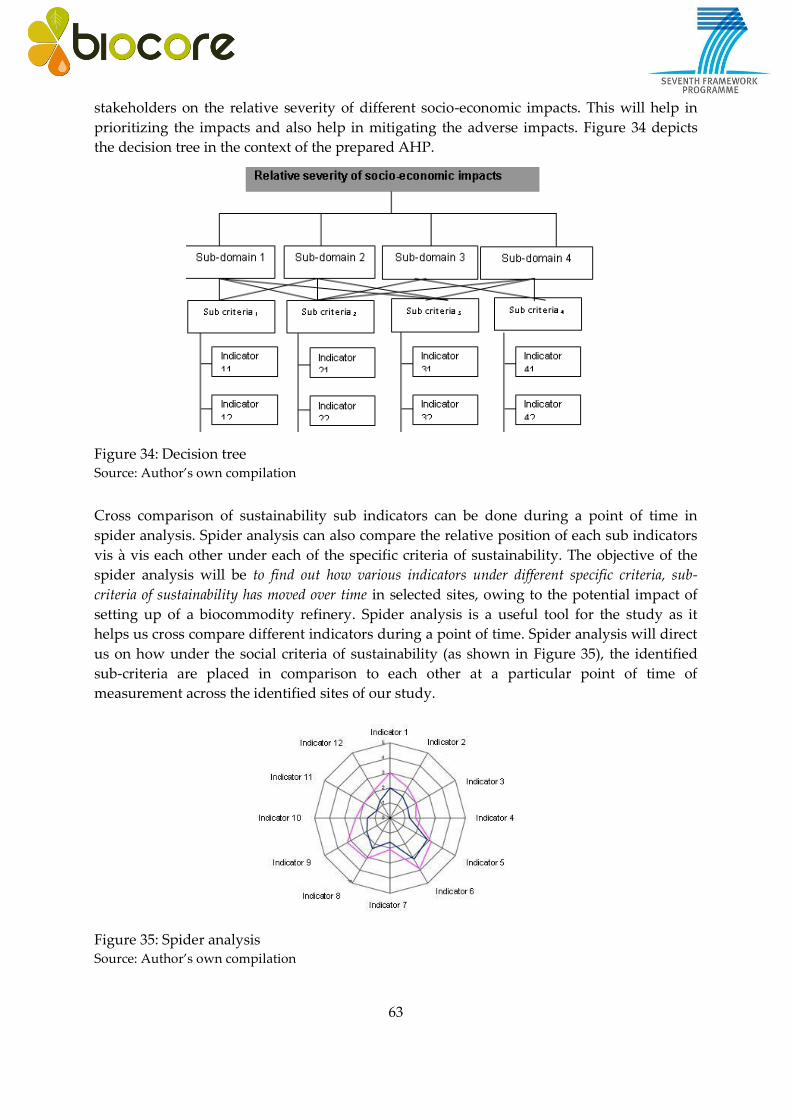
63
stakeholders on the relative severity of different socio-economic impacts. This will help in
prioritizing the impacts and also help in mitigating the adverse impacts. Figure 34 depicts
the decision tree in the context of the prepared AHP.
Figure 34: Decision tree Source: Author’s own compilation
Cross comparison of sustainability sub indicators can be done during a point of time in
spider analysis. Spider analysis can also compare the relative position of each sub indicators
vis à vis each other under each of the specific criteria of sustainability. The objective of the
spider analysis will be to find out how various indicators under different specific criteria, sub-
criteria of sustainability has moved over time in selected sites, owing to the potential impact of
setting up of a biocommodity refinery. Spider analysis is a useful tool for the study as it
helps us cross compare different indicators during a point of time. Spider analysis will direct
us on how under the social criteria of sustainability (as shown in Figure 35), the identified
sub-criteria are placed in comparison to each other at a particular point of time of
measurement across the identified sites of our study.
Figure 35: Spider analysis Source: Author’s own compilation

64
4.1.4 Social Life Cycle Assessment (SLCA) Framework
For the general assessment of social impacts a combination of social impact assessment
(SIA) and social life cycle assessment (sLCA) was used (Diaz-Chavez, 2012). The following
figure shows the overall methodology and where the tools and techniques can be applied in
BIOCORE. From the steps shown in the Figure 36, social life cycle assessment (sLCA) shows
a direct link with three of the techniques: identifying stakeholders, creating a baseline
(inventory) using indicators and identifying the chain of impacts.
Les paramètres nécessaires sont manquants ou erronés.
Figure 36: Adapted social impact assessment to BIOCORE case studies Source: modified from UNEP, 2009
For the analysis, a list of selected criteria was used for the case studies in Europe and in India
as shown in Table 8. The Quality of life parameter is not considered as it would need
reference data and a project that demonstrates actual improvement or worsening of the
situation to be able to conduct any assessment.
Table 8: List of criteria considered for the social sustainability assessment of a biorefinery. No Parameter Characteristics/Criteria Level of
assessment
Stage of the
supply chain
Type of data
1 Trade of feedstock
Incentives and barriers EU/National Feedstock Qualitative
2 Identification of stakeholders
along the supply chain
Producers (farmers)
Regulators
Business
Traders
Local All Qualitative,
literature and
interviews
3 Policies and regulations International
National
Regional
Local
National and
International
All Qualitative
(section 5)
4 Potential biorefinery location
Logistic
Availability of feedstock
Current use of residues
Potential for supply of
feedstock
National and
local
Feedstock,
Transport and
storage,
Biorefinery
Included in
Reports of WP1
5 Land use tenure Land ownership rights National Feedstock Qualitative,
literature
6 Community participation Acceptance of community Local Feedstock, Qualitative,
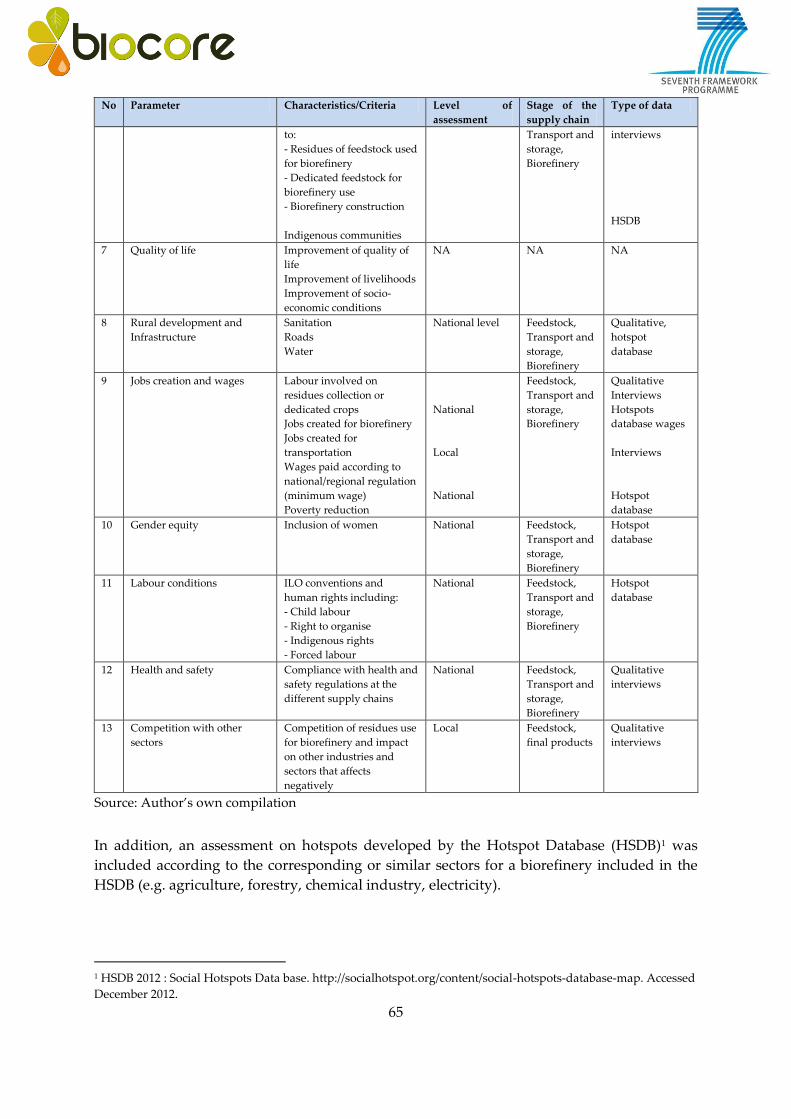
65
No Parameter Characteristics/Criteria Level of
assessment
Stage of the
supply chain
Type of data
to:
- Residues of feedstock used
for biorefinery
- Dedicated feedstock for
biorefinery use
- Biorefinery construction
Indigenous communities
Transport and
storage,
Biorefinery
interviews
HSDB
7 Quality of life Improvement of quality of
life
Improvement of livelihoods
Improvement of socio-
economic conditions
NA NA NA
8 Rural development and
Infrastructure
Sanitation
Roads
Water
National level Feedstock,
Transport and
storage,
Biorefinery
Qualitative,
hotspot
database
9 Jobs creation and wages Labour involved on
residues collection or
dedicated crops
Jobs created for biorefinery
Jobs created for
transportation
Wages paid according to
national/regional regulation
(minimum wage)
Poverty reduction
National
Local
National
Feedstock,
Transport and
storage,
Biorefinery
Qualitative
Interviews
Hotspots
database wages
Interviews
Hotspot
database
10 Gender equity Inclusion of women National Feedstock,
Transport and
storage,
Biorefinery
Hotspot
database
11 Labour conditions ILO conventions and
human rights including:
- Child labour
- Right to organise
- Indigenous rights
- Forced labour
National Feedstock,
Transport and
storage,
Biorefinery
Hotspot
database
12 Health and safety Compliance with health and
safety regulations at the
different supply chains
National Feedstock,
Transport and
storage,
Biorefinery
Qualitative
interviews
13 Competition with other
sectors
Competition of residues use
for biorefinery and impact
on other industries and
sectors that affects
negatively
Local Feedstock,
final products
Qualitative
interviews
Source: Author’s own compilation
In addition, an assessment on hotspots developed by the Hotspot Database (HSDB)1 was
included according to the corresponding or similar sectors for a biorefinery included in the
HSDB (e.g. agriculture, forestry, chemical industry, electricity).
1 HSDB 2012 : Social Hotspots Data base. http://socialhotspot.org/content/social-hotspots-database-map. Accessed
December 2012.

66
System boundary
The sLCA is limited to stakeholders and impacts along the supply chain as per figure below.
Other stages in other supply chains are not considered and some of the impacts can only be
assessed at a national level. Stakeholders for each case study are considered at the local level.
Les paramètres nécessaires sont manquants ou erronés.
Figure 37: BIOCORE supply chain for sLCA and stakeholders Source: Author’s own compilation
4.1.5 Questionnaires and Surveys
The survey questionnaire was prepared by converting the identified social sustainability
issues into questions to arrive at qualitative and quantitative estimates of the sub-indicators
to be analysed. For the detailed case study of India using the method of AHP, basic
background information was collected in addition to asking the stakeholders who were
being surveyed to provide an assessment of the degree of their responses to the questions
listed, where the degree could be assessed on a scale as indicated under the possible
responses to the questions. If the particular question was not of relevance to the stakeholder,
the rank assigned to it was on a lower side of the scale (1-4). 5-8 stakeholders per category of
stakeholders were interviewed as part of the survey. To make this AHP process work, it was
important to guide the user to answer the AHP questions in an understandable and simple
manner. The survey was conducted in a few randomly selected villages in the two study
districts-Barnala/Sangrur and Faridkot of Punjab in India. A scoping visit was first
undertaken in some the above villages followed by the final survey.
For the case studies in the EU (France, Hungary and Germany) semi-structured interviews
were applied to local stakeholders in order to gather additional information on the social
criteria selected.
4.2 Background of the study sites
Three European countries (France, Hungary and Germany) and India were selected as the
study regions in the project. One study site, each from the three European countries and two
study sites from India were further selected (see Figure 38 and Figure 39).

67
Figure 38: Study sites in Europe Source: Biocore WP1 Final Report, Aug. 2012
Figure 39: Study sites in India Source: Biocore WP1 Final Report, Aug. 2012
4.2.1 India
There are two study sites in India and this section presents the locational, geographical and
socio-economic characteristics of these sites.

68
4.2.1.1 Location and geographical characteristics
...
Figure 40: Study sites in India Source: Biocore WP1 Final Report, Aug. 2012
As already mentioned, the two selected districts of the Indian case study region are Sangrur-
Barnala and Faridkot. Sangrur and Barnala are basically adjacent districts in Southern
Punjab. The climate of the area is usually dry and is characterised by a short monsoon. On
average, the region experiences 27 rainy days (i.e. days with rainfall of 2.5 mm or more) in a
year. The available land in the Sangrur-Barnala region is about 500,000 hectares, while that in
Faridkot is 150,000 hectares.
About 90 percent of the land in the study districts are under agriculture2. The total farm area
in the district of Sangrur is 440,000 hectares while in Faridkot the area is 130,000 hectares.
Paddy and wheat are common agricultural crops grown here. The area has huge straw
potential. Currently, 2.5 million tons of straw are available (1.9 million tons from rice straw
and 0.6 million tons from wheat straw) in this area.3
The planned capacities for the biorefinery at the selected locations in Punjab have been
decided as 500,000 tonnes/year and 150,000 tonnes/year with both the capacities to be
modelled simultaneously for Sangrur including Barnala and the smaller capacity to be
modelled for Faridkot.4 The Indian study region being part of a rice-wheat growing area, rice
and wheat crop straw, which are abundant agro-residues, were chosen as the biomass
feedstock. Currently, rice straw finds limited applications in industries and the unsold
quantities are mostly burnt in the field5 thus posing a major threat to environment and
human health. The rice straw finds its appplications mostly for, (i) bedding purposes for
2 Biocore WP1 Final Report, Aug. 2012 3 Biocore WP1 Final Report, Aug. 2012 4 IBID 5 IBID

69
cattle; and (ii) pulp and paper mills. With regard to wheat, almost 40 percent of wheat straw
is used as fodder6, while 25 percent are used by the pulp and paper industry. Only 10 percent
of the wheat straw is burnt (Table 9).
Table 9: Current use of straw (rice and wheat) in the Indian case studies
Rice straw Wheat straw
Field burning 90% 10%
Fodder <10% 40%
Pulp and Paper industry <10% 25%
Others <10% 25%*
*others include storage for future requirement or export to neighbouring states.
Source: Biocore WP1 Final Report, Aug. 2012
4.2.1.2 Socioeconomic characteristics/issues
As per 2011 census, Sangrur had a population size of 1,654,408 while Barnala has 596,294
persons. Sex ratio is 883 in Sangrur which is slightly higher than 876 in Barnala. Male literacy
rates for Sangrur and Barnala were 74.2 and 73.1 percent respectively while female literacy
rates were 62.9 and 64.1 percent respectively. According to the 2001 census, Sangrur district
had a total of 348,922 households with an average household size of 6 members. There were
697 villages in that district. All of these villages were electrified and had safe drinking water
facilities. More than 680 villages were reported to have primary school while primary health
centres were available in 214 villages.
Faridkot had a population of 618,008 with a female population 290,887 as per 2011 census.
More than 60 percent of the population lived in rural areas. There were 889 females per 1000
males. Literacy rates for males and females were 75.9 and 64.8 percent, respectively. Census
data from 2011 reveals that 163 villages in the district had access to safe drinking water and
electricity. Primary schools were present in 160 villages, while primary health sub-centres
were present in 61 villages.
Table 10 presents the comparative socio-economic statistics for the two selected regions in
India.
Table 10: Socio-economic comparison of Sangrur-Barnala and Faridkot
Sangrur /Barnala Faridkot
2011
Population 1,654,408 / 596,294 618,008
Female 7,757,80 / 278,446 290,887
6 IBID
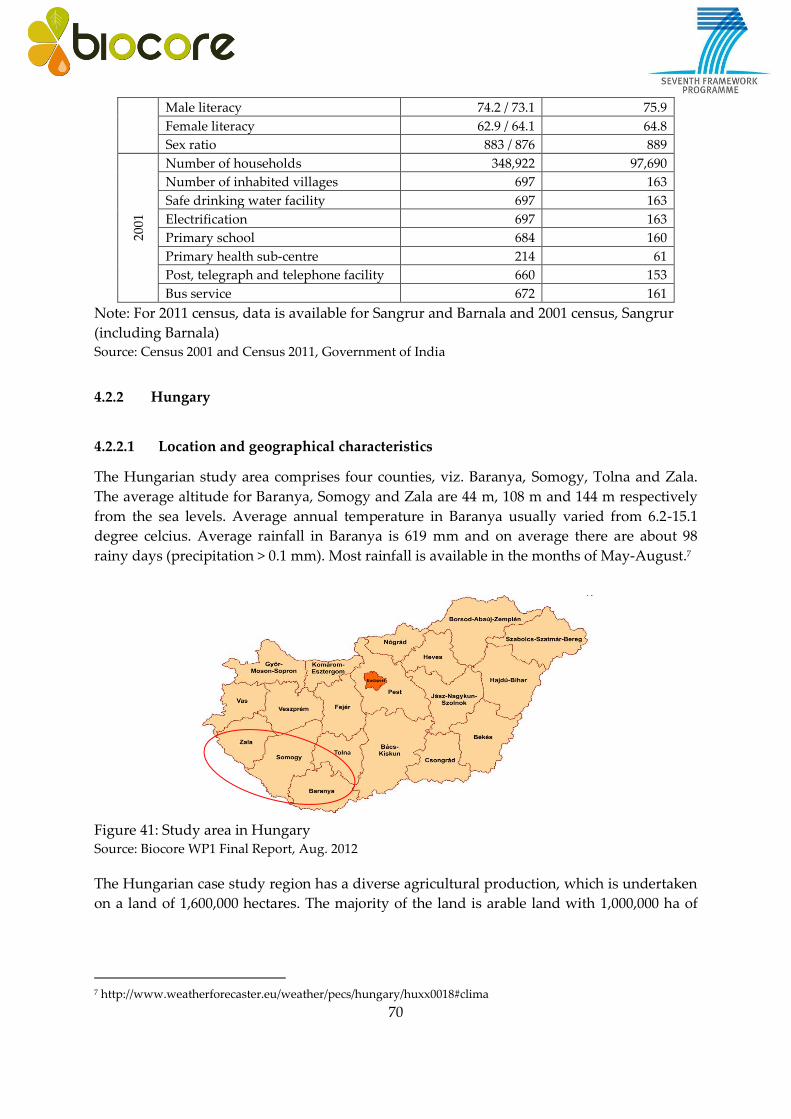
70
Male literacy 74.2 / 73.1 75.9
Female literacy 62.9 / 64.1 64.8
Sex ratio 883 / 876 889 20
01
Number of households 348,922 97,690
Number of inhabited villages 697 163
Safe drinking water facility 697 163
Electrification 697 163
Primary school 684 160
Primary health sub-centre 214 61
Post, telegraph and telephone facility 660 153
Bus service 672 161
Note: For 2011 census, data is available for Sangrur and Barnala and 2001 census, Sangrur
(including Barnala) Source: Census 2001 and Census 2011, Government of India
4.2.2 Hungary
4.2.2.1 Location and geographical characteristics
The Hungarian study area comprises four counties, viz. Baranya, Somogy, Tolna and Zala.
The average altitude for Baranya, Somogy and Zala are 44 m, 108 m and 144 m respectively
from the sea levels. Average annual temperature in Baranya usually varied from 6.2-15.1
degree celcius. Average rainfall in Baranya is 619 mm and on average there are about 98
rainy days (precipitation > 0.1 mm). Most rainfall is available in the months of May-August.7
Figure 41: Study area in Hungary Source: Biocore WP1 Final Report, Aug. 2012
The Hungarian case study region has a diverse agricultural production, which is undertaken
on a land of 1,600,000 hectares. The majority of the land is arable land with 1,000,000 ha of
7 http://www.weatherforecaster.eu/weather/pecs/hungary/huxx0018#clima

71
utilised agricultural area (UAA), out of which 610,000 ha is used for annual crops. The
majority of the cultivators in the region are large farmers8.
Maize (UAA of 335,000 ha) is the most important annual crop followed by wheat (190,000
ha), barley (53,000 ha) and others9 (29,000 ha). The UAA of perennial crops and SRC are
40,000 ha and 3,500 ha, respectively. Apart from these, there are natural and temporary
grasslands of 7,000 ha and 95,000 ha, respectively. The raw material to be procured from the
Hungarian case study will be a mix of straw (both maize and wheat), hardwood and SRC
(poplar) a in 3:1:1 ratio.10 However, 20 percent of the straw generated in the region can be
available for the proposed plant because of high biomass competition.
4.2.2.2 Socioeconomic characteristics/issues
Among the four selected counties, Somogy is least densely populated while Baranya is the
most densely populated. As per 2001 census, 40 percent of the population are employed
while the unemployed population is 10 percent.11 Table 11 presents some basic socio-
economic statistics for these counties.
Table 11: Statistics on workforce in counties in Hungary (2001)
Zala Baranya Somogy Tolna
Population 297,404 407,448 335,237 249,683 Active persons 127,731 155,085 128,267 98,451
Employed persons 117,614 136,390 112,498 87,908 Employees 100,236 115,560 94,680 73,197
Self-employed persons with employees (employers) 4,876 6,091 4,775 3,206
Unemployed persons 10,117 18,695 15,769 10,543 Inactive persons 169,673 252,363 206,970 151,232
Source: Eurostat 2013
4.2.3 France
4.2.3.1 Location and geographical characteristics
The Beauce is the French study region located in central France. The Beauce region is
surrounded by Maintenon in the North, Châteaudun in the West, Rleans in the South and
Malesherhes in the East. The distance to Paris is about 100 km. It covers the area of four
departments, viz., Loiret, Eure-et-Loir, Essonne and Yvelines. The Beauce is a vast plateau
and part of the Paris Basin. Many rivers flow through the area. The Beauce is characterized
by silt soils and flat area. It is a relatively dry region (average annual rainfall 550 mm). The
average altitude is 140 meters.12 The average temperature varies between 7.5-15.5 degree
8 Biocore WP1 Final Report, Aug. 2012 9Others include rye, triticale, oat 10 Biocore WP1 Final Report, Aug. 2012 11 http://en.wikipedia.org/wiki/Counties_of_Hungary 12 Biocore WP1 Final Report, Aug. 2012
72
celcius. On an average there are 164 rainy days (precipitation > 0.1 mm) in a year. The high
rainfall months in the year are May-August.13
Figure 42: Beauce location Source: Biocore WP1 Final Report, Aug. 2012
In the French study region, agriculture is practiced on 0.8 million hectares of land out of a
total land area of 0.9 million. Among the agricultural land, 0.6 million hectares are used for
annual crops. Cereals are the major crops in the Beauce region with an average yield of 10
tons per hectare. Some of the main crops grown in the area are: soft wheat (50%), rapeseed
(15%), barley (15%) and maize (5%).
The local agricultural market is well developed. All farmers in the region receive CAP
subsidies, but no price guarantee is available. Organic farming currently represents less than
3 percent of the UAA. The major competitive use of straw in the region is 66 percent of SOC
maintainence and 10 percent of export to the nearby breeding region (for bedding or
feeding). The remaininig straw can be used as raw materials in the plant.
4.2.3.2 Socioeconomic characteristics/issues
As per population census 2009, Essonne is the most densely populated area while Eure-et-
Loir is the least in the study region. While Loiret and Loir have a greater proportion of the
population working in the agricultural sector compared to the industrial sector, Yvelines
and Essonne have the least proportion of the population engaged in agricultural activities14.
Table 12 presents the socio economic statistics.
Table 12: Department-wise socio-economic statistics in France (2009)
13 http://www.weatherforecaster.eu/weather/paris/france/frxx0076#clima 14 INSEE database, National Institute of Statistics and Economic Studies – France

73
Loiret Yvelines Loir Essonne
Total population 653,510 1,407,560 425,502 1,208,004
Population density 96.5 616.2 72.4 669.5
Number of households (HH) 278,099 548,804 174,630 467,035
Per HH average net income (euro) 23,645 34,171 23,460 28,033
Work participation rate (in %) 73.4 74.7 74.2 74.7
Unemployment rate (in %) 10 8.3 10.2 9
Share of agriculture in labor force (in %) 10.8 1.6 16.7 1.5
Share of industry in labor force (in %) 6.1 4.3 6.7 4.7
Share of trade, transport & other services in labor force (in %) 59 70 5.3 67.4
Source: INSEE database, National Institute of Statistics and Economic Studies – France
4.2.4 Germany
4.2.4.1 Location and geographical characteristics
…
Figure 43: German study area Source: http://www.nationsonline.org/oneworld/countries_germany.htm
The German study region comprises four federal states: North-Rhine-Westphalia (NW),
Hessen (HE), Rhineland-Palatinate (RP) and Saarland (SL). The average temperature in the
region is 9-10 degree celcius and annual average rainfall is about 800 mm. The region gets its
maximum rainfall in June-August. The altitude varies from 45 to 322 m.

74
45 percent of the total land of 7.7 million hectares are under agriculture while 35 percent are
covered with forest. The region has significant availability of hardwood with 64 percent
being currently used for heating15.
4.2.4.2 Socioeconomic characteristics/issues
As per recent data, Hessen (HE) is the most densely populated state while Rhineland-
Palatinate (RP) is the least densely populated in the study area. While GDP is highest for
NW, GDP per capita is highest for HE. On the other hand, GDP is lowest in SL but GDP per
capita is lowest in RP. But, average household income is lowest for SL and highest for NW.
4.3 Legal and Policy Assessment – Results
This section presents the analysis of the legal and political framework that exists in the study
sites and discusses the sustainability issues in the context.
4.3.1 Case of India
4.3.1.1 Matrix of policies, laws and guidelines in relation to biofuels value chain
The approach to biofuels adopted in India, in particular, is somewhat different to the current
international approaches and to an extent avoids the conflict with food security. It is based
solely on non-food feedstocks to be raised on degraded or wastelands that are not suited for
agriculture, thus avoiding a possible conflict of fuel vs. food security (National Biofuel Policy
of India). The Indian government’s energy policy tries to support renewable energy by
providing incentives on a federal and state government level. One of the main objectives is
the supply of energy and electricity to rural areas (International Business Publications, 2003).
Table 13 shows an overview of biofuel policies in India.
15 Biocore WP1 Final Report, Aug. 2012

75
Table 13: Biofuel policies in India
Policy Year Characterisitics
Announced in 2003. Replace 20% diesel consumption by 2012.
Target of 13 million tonnes of diesel by 2013
Program divided into two phases. Phase-1: 2003-2007, 400000 ha (Rs
1500 crore investment; States were identified
Phase-2: Target reduced to 5 %; however, the mission stagnated due to
reasons like uncertainty in land tenure, food vs. fuel debate, global oil
price vulnerability
Icluded several micro missions covering promotion of large-scale
plantation of feedstock crops in forests and wastelands, procurement of
seeds and oil extraction, blending, trade and R&D.
Mandatory blending of 5% ethanol in 9 major sugar producing states
and 4 UTs. Low procurement price (INR 14.9/l) + sub 75 p; revised
policy increased it to around INR 23/L, whereas the costs were INR
30/l based on CACP cost guidelines
Scale up, in 2007 for mandatory usage all over India (10% blending for
major sugarcane producing states and 5% blending for rest),
Growing gap of demand and supply. Average target met 2%
Mentions use of second generation feedstocks like rice straw and grains
for biofuel production in the long run within India. But expressed
uncertainty
Announced in 2009, nodal ministry MNRE, co-ordination with other
ministries, like MoRD, MoEF, MoP&G, DBT, etc
20% blending of biofuels by 2017.
Promotion for cultivation, production and use of biofuels to
increasingly substitute other application
Policy discussion around second generation feedstock like agri-residue
(rice straw, wheat straw etc) for bioethanol generation along with non
edible seeds and molasses as feedstock for biodiesel and bioethanol
production in the country.
Formation of two committee to promote biofuel production and usage
Blending to be done subject to commercial viability
It explores incentives for developing research on second generation
biofuel feedstocks for bioethanol.
Import tariff on ethanol, independent of use, at a level not greater than
the price of petroleum products
Ethanol to be priced at its economic cost in relation to petrol but not
higher than its import parity price
Integrated Energy Policy 2006
2003National Biodiesel Mission
Ethanol Blending Program 2002
National Biofuel Policy 2009
Source: Author’s own compilation

76
4.3.1.2 Legal and political sustainability assessment across the value chain of biofuels
Biofuel policies play an important role in the development of the energy sector. The
profitability of biofuel production is significantly influenced by policies affecting multiple
sectors such as agriculture, research, industry and trade. Identifying relevant policies and
quantifying their specific impacts is difficult given the variety of policy instruments (taxes,
subsidies, price support, etc.) and the way they are applied (FAO 2008).
Given the fact that the production of biofuels is intensive in the use of land, state
governments become important players in defining and implementing biofuels policies that
can be implemented effectively. Different states have different policies in place to promote
bio-based and renewable energy and implemented through state agencies like village level
administrative units, forest departments, universities, research institutions, etc. Several states
such as Chhattishgarh, Uttaranchal and Rajasthan have established nodal organizations and
dedicated biofuels boards to coordinate work in this area. The Ministry of New and
Renewable Energy (MNRE) is offering certain initiatives, however its policy framework is
not exhaustive and most of the measures are peripheral, thereby reducing their impact.
Targets set by these groups, such as the biofuel blending programme and renewable
purchase mandates, are critical. Yet without enforcement or consistent support, they lose
some of their impact.
The focus of biofuel programmes within India has been on non-edible feedstocks (like
Jatropha, Pongamia seeds etc.) and on molasses produced as a by-product of sugarcane
based processes of bioethanol production for its subsequent blending with gasoline or petrol.
It is important to prioritize feedstock-targeted blending mandates that will give a boost to
alternative feedstocks besides molasses and make them viable for biofuel production.
In various biofuel program announcements of India it has been highlighted that feedstocks
have to be sourced from wastelands without creating any diversion of farm lands for food
crops (Chauhan, 2008) to prevent adverse implications for food security. The legal and
political regime for biofuels in India has been discursive and not linear with a multitude of
contrasting views from different types of institutions and actors. Various agendas have
emerged from the national and state level legal and political frameworks which have been
translated into different types of actions in the biofuel sector for states of India, leading to
both pro- and anti-biofuel views. The second generation based biofuel production concept is
quite nascent in India. Only in certain policy declarations post 2008, there has been a mention
of the need to develop second generation based biofuel production systems in the long run
for India. In order to implement the production of these fuels on a large scale, certain key
issues have to be resolved. The second generation biofuel products that are being considered
for implementation in India are ethanol, biodiesel, lactic and acetic acid. India is faced with
many challenges and gaps, particularly those associated with technology for each of these
second generation products under different processes and techniques. Figure 44 summarizes
these gaps and challenges.

77
Figure 44: Gaps and challenges in the success of second generation biofuels in India Source: Author’s own compilation based on Department of Biotechnology, Ministry of Science and
Technology, Government of India document on « Technology Assessment of Bio-industrial Products
in India (2012)
Currently, the second generation biofuel sector in India is mainly at an R&D stage where
R&D is being carried out by the Ministry of Science and Technology along with institutions
like the Indian Institute of Technology, the Indian Institute of Science as well as with some
private and public companies. A major part of the R&D is also focused on testing out the
possibility of second generation biofuel production through feedstocks like algal production,
hydrocarbon production, strain improvement, utilisation of spent biomass, and development
of automated downstream processing along with the evaluation of open and closed
cultivation systems. However significant hurdles in technology development still need to be
overcome before second-generation biofuels can be produced at commercial scale, even with
the massive investments in R&D observed in recent years. Though it can be seen that there is
ample biomass resources in the form of agro-residues to support production of ligno-
cellulosic biofuels, this potential is restricted by current uses of the residues as cattle fodder
and applications in certain industries. Much work remains to improve second generation
conversion pathways, reduce costs, and improve the performance and reliability of
conversion processes (IEA, 2008b). Policies must be carefully crafted to avoid unwanted
consequences and delayed commercialization. Demonstration projects need to be set up for
biodiesel and bioethanol production, focusing on conversion technologies through Public
Private Partnerships (PPP). Grants should be provided to academic institutions, research
organizations, specialized centers and industry for promising R&D and demonstration
projects.
India lacks mature technologies for second-generation biofuel production from
lignocellulosic biomass, which is an abundant source of renewable energy that may be
exploited in most parts of the country. Though biomass itself is cheap, the costs of its
processing are relatively high. Technologies for biomass-to-biofuel conversion are also under
various stages of development. The government should take positive steps towards
promoting the use of ethanol and biodiesel as a fuel by providing tax exemptions at least in
initial stages. The responsibility of the storage, distribution and marketing of biofuels in
India has been with the Oil Marketing Companies (OMCs). India’s biofuel policy exempts

78
the biofuel sector from central taxes and duties. While biodiesel is exempt from excise duty,
bioethanol enjoys a concessional excise duty of 16%. Customs and excise duty concessions
are also provided on plant and machinery for the production of biodiesel and bioethanol.
While these policies promote the biofuel sector, those promoting the production of feedstock
need to be highlighted in order to fully realize the benefits provided on the processing front,
since production and processing are interdependent. Though the policy mentions exemption
of central taxes and duties on biofuels, sales tax, license fee, permit fee and import taxes still
exist, hindering the growth and development of the industry. The policy provides no
additional incentives for blenders and retailers of biofuel unlike in other countries.
Further, the design and implementation of environmental performance standards—
including the prohibition of practices such as growing invasive species, removing excessive
annual crop residue, providing incentive payments for avoided GHG payments, or retaining
natural spaces as wildlife corridors—would bolster the sustainability of second-generation
feedstocks.
There also has to be a higher focus by the government on carbon trading and renewable
energy targets. Legislation and regulations that reflect the benefits of producing bio-products
from renewable resources, including nationally consistent and implemented sustainability
criteria and frameworks can play an important role.
Integrated biorefineries produce a range of products to optimise the use of the feedstock and
improve process economics. There is a need to develop a market for the different bio-based
products and improving properties of existing products to increase the competitive
advantage of these products versus their petroleum-based reference products. Product
design should focus on the properties of bio-based products, using natural formulations to
achieve desired effects. In other words, the bio-based products should not only meet the
desired usability and durability standards and characteristics of their counterpart produced
from reference chemicals, but meet certain sustainability standards that would find larger
penetration in the consumer market vis-à-vis non bio-based products. Market-driven
research should aim at creating products that consumers want, and it is essential that bio-
based products reach at least the same level of quality as their fossil based counterparts.
Additionally, valuing biomass for bio-based products such as renewable chemicals and
plastics could place pressure on existing uses of biomass e.g. pulp production or
co‐generation of energy in pulp mills.
Discussion with the stakeholders suggest that there is a lack of shared understanding of the
benefits of bio-based products and their potential to reduce our dependence on imported oil
and polymers and reducing greenhouse gas emissions. Here, the role of government through
its public procurement that reflects and anticipates the development of bio‐based products
from renewable resources will play an important role.

79
4.3.1.3 Institutions (including government ministries and departments) involved in the
bioenergy planning/applications
There have been many institutions/organizations that have got engaged in biofuel
development and promotion in India. These institutions can be broadly grouped into 5
categories:
1. Private companies like Gujarat Oleochem, Haldia Petrochemicals, Indian Glycol
Limited, Nandan Biomatrix Limited, Novozymes South Asia, Praj Industries, Tata
Chemicals Limited, UOP Honeywell, Reliance Petrochemicals
2. Public Sector organisations like Indian Oil Corporation Limited, Bharat Petroleum
Corporation Ltd. Hindustan Organic Chemicals Limited
3. Academics/research organizations: Indian Institute of Science, Indian Institute of
Technology, CSIR Labs.
4. Civil society organizations
5. Government Ministries/Departments
Although the Ministry of New and Renewable Energy (MNRE) is the nodal government
ministry for policy formulation for the promotion of biofuels in India, there are several other
ministries who are also associated with policy making, developing regulation, promotion
and development of the biofuels sector, including introduction of various financial
incentives.
Table 14 presents the list of these ministries as well as their responsibilities.
Table 14: Ministries involved in the development of biofuels in India
Ministry in Government of
India
Responsibility
New and Renewable Energy
Sources
Policymaking and overall coordination concerning biofuels.
Undertake Research and Development (R&D) of various
applications of biofuels
Ministry of Petroleum and
Natural Gas (MoPNG)
Marketing biofuels as well as development and implementation
of pricing and procurement policy
Agriculture R&D of biofuel feedstock through ICAR and IARI (sweet
sorghum, jatropha, pongamia oil tree (Millettia pinnata), and
inedible oilseeds). Undertake jatropha plantation on non-forest
land.
Ministry of Road Transport and
Highway
Plantation along highways and use of biofuel blended fuel. Work
with automobile manufacturers‟ association in India for engine
modification, emission norms, etc.
Ministry of Railways Undertake plantation of jatropha on wastelands, along rail rights
of way, and conduct trials of biodiesel blended fuel in
locomotives
Ministry of Agriculture (MoA) Research and development on feedstock crops.
Ministry of Rural Development
(MoRD)
Plantation of jatropha on wastelands. Integrate biodiesel
program with rural development schemes (such as Mahatma
Gandhi National Rural Employment Guarantee Scheme).

80
Ministry in Government of
India
Responsibility
Coordinate R&D with other agencies
Ministry of Science and
Technology (MoS&T)
Biotechnological research on feedstock crops.
Ministry of Environment and
Forest (MoEF)
Ensuring implementation of Tree-Brone Oilseeds (TBO) crop
plantations in forest wastelands; and monitoring health and
environmental effects of biofuels.
Source: Based on NCAP, http://www.ncap.res.in/upload_files/policy_paper/pp27.pdf and
http://www.pcra-biofuels.org/govt.htm
4.3.2 Case of Europe
4.3.2.1 Matrix of policies, laws and guidelines in relation to biofuels value chain
A key driver for the development and implementation of biorefineries is the growth in
demand for energy, fuels, and chemicals. Accordingly, the aim of research is in developing
new technologies and creating novel processes, products, and capabilities to ensure the
growth is sustainable from economic, environmental and social perspectives (IEA, 2007).
In the context of the European Union, several policies, programmes and strategies have
included the elements for Research and Development in the topic of biotechnology. These
strategic and regulatory documents are presented in Figure 45.
Figure 45: Overview of strategic and regulatory documents related to the biorefineries
concept, research and implementation Source: Diaz-Chavez, 2012
The concept of biorefineries in the EU is expected to be developed based on the integration
with existing industrial value chains (Star Colibri, 2012). It is also expected that the
development of biorefineries will be driven by some sectors in the biobased economy
including: agro-industry, forest based industry, the energy sector, biofuels industry and the
chemical industry.

81
Therefore, different policy and regulatory policy instruments, along with the participation of
stakeholders, help to develop the pathway in order to have a biobased economy in Europe.
Some of these instruments more related to biorefineries activities are presented in the
following Table 15, indicating their main characteristics.
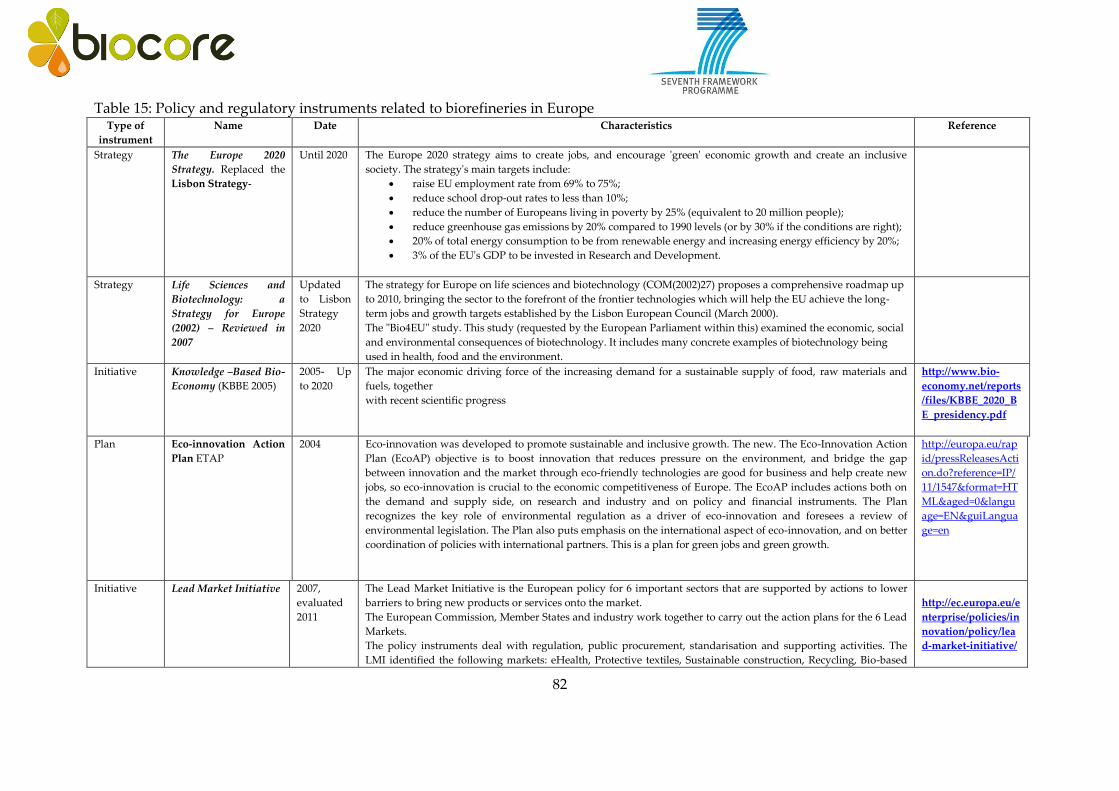
82
Table 15: Policy and regulatory instruments related to biorefineries in Europe Type of
instrument
Name Date Characteristics Reference
Strategy The Europe 2020
Strategy. Replaced the
Lisbon Strategy-
Until 2020 The Europe 2020 strategy aims to create jobs, and encourage 'green' economic growth and create an inclusive
society. The strategy's main targets include:
raise EU employment rate from 69% to 75%;
reduce school drop-out rates to less than 10%;
reduce the number of Europeans living in poverty by 25% (equivalent to 20 million people);
reduce greenhouse gas emissions by 20% compared to 1990 levels (or by 30% if the conditions are right);
20% of total energy consumption to be from renewable energy and increasing energy efficiency by 20%;
3% of the EU's GDP to be invested in Research and Development.
Strategy Life Sciences and
Biotechnology: a
Strategy for Europe
(2002) – Reviewed in
2007
Updated
to Lisbon
Strategy
2020
The strategy for Europe on life sciences and biotechnology (COM(2002)27) proposes a comprehensive roadmap up
to 2010, bringing the sector to the forefront of the frontier technologies which will help the EU achieve the long-
term jobs and growth targets established by the Lisbon European Council (March 2000).
The "Bio4EU" study. This study (requested by the European Parliament within this) examined the economic, social
and environmental consequences of biotechnology. It includes many concrete examples of biotechnology being
used in health, food and the environment.
Initiative Knowledge –Based Bio-
Economy (KBBE 2005)
2005- Up
to 2020
The major economic driving force of the increasing demand for a sustainable supply of food, raw materials and
fuels, together
with recent scientific progress
http://www.bio-
economy.net/reports
/files/KBBE_2020_B
E_presidency.pdf
Plan Eco-innovation Action
Plan ETAP
2004 Eco-innovation was developed to promote sustainable and inclusive growth. The new. The Eco-Innovation Action
Plan (EcoAP) objective is to boost innovation that reduces pressure on the environment, and bridge the gap
between innovation and the market through eco-friendly technologies are good for business and help create new
jobs, so eco-innovation is crucial to the economic competitiveness of Europe. The EcoAP includes actions both on
the demand and supply side, on research and industry and on policy and financial instruments. The Plan
recognizes the key role of environmental regulation as a driver of eco-innovation and foresees a review of
environmental legislation. The Plan also puts emphasis on the international aspect of eco-innovation, and on better
coordination of policies with international partners. This is a plan for green jobs and green growth.
http://europa.eu/rap
id/pressReleasesActi
on.do?reference=IP/
11/1547&format=HT
ML&aged=0&langu
age=EN&guiLangua
ge=en
Initiative Lead Market Initiative 2007,
evaluated
2011
The Lead Market Initiative is the European policy for 6 important sectors that are supported by actions to lower
barriers to bring new products or services onto the market.
The European Commission, Member States and industry work together to carry out the action plans for the 6 Lead
Markets.
The policy instruments deal with regulation, public procurement, standarisation and supporting activities. The
LMI identified the following markets: eHealth, Protective textiles, Sustainable construction, Recycling, Bio-based
http://ec.europa.eu/e
nterprise/policies/in
novation/policy/lea
d-market-initiative/

83
products and Renewable energies
Initiative
(Package)
Climate and
Environment Package
From 2007 The climate and energy package is a set of binding legislation which aims to ensure the European Union meets its
ambitious climate and energy targets for 2020.
These targets, known as the "20-20-20" targets, set three key objectives for 2020:
A 20% reduction in EU greenhouse gas emissions from 1990 levels;
Raising the share of EU energy consumption produced from renewable resources to 20%;
A 20% improvement in the EU's energy efficiency
http://ec.europa.eu/c
lima/policies/packa
ge/index_en.htm
Plan Strategic Energy
Technology Plan
2007 The SET-Plan establishes an energy technology policy for Europe. It's a strategic plan to accelerate the
development and deployment of cost-effective low carbon technologies. The plan comprises measures relating to
planning, implementation, resources and international cooperation in the field of energy technology
SETIS is the European Commission's Information System for the SET-Plan led by the Joint Research Centre. It
supports the strategic planning and implementation of the SET-Plan. It makes the case for technology options and
priorities, monitors and reviews progress regarding implementation, assesses the impact on policy, and identifies
corrective measures if needed.
http://ec.europa.eu/e
nergy/technology/se
t_plan/set_plan_en.
htm
Renewable Energy
Directive (2009)
The Directive 2009/28/EC on renewable energy, implemented by Member States by December 2010, sets ambitious
targets for all Member States, such that the EU will reach a 20% share of energy from renewable sources by 2020
and a 10% share of renewable energy specifically in the transport sector. It also improves the legal framework for
promoting renewable electricity, requires national action plans that establish pathways for the development of
renewable energy sources including bioenergy, creates cooperation mechanisms to help achieve the targets cost
effectively and establishes the sustainability criteria for biofuels. The two main objectives of EU energy policy are
increasing security of energy supply and reducing greenhouse gas emissions.
http://ec.europa.eu/e
nergy/renewables/ta
rgets_en.htm
Policy Common Agricultural
Policy
The common agricultural policy – ensures adequate European food production goes hand in hand with
economically viable rural communities and action on environmental challenges such as climate change, water
management, bioenergy and biodiversity.
Today, the CAP still has a pivotal role in the European Union, not just because farmland and forests account for
more than 90% of land within the EU, but also because it has become an essential mechanism for facing new
challenges in terms of food quality, environmental protection and trade. The 2003 reform was a key moment in the
CAP’s development, adapting the policy to meet the new requirements of farmers, consumers and the planet. This
approach continues to form the basis of the future development of the common agricultural policy of an enlarged
Union present on the world stage.
When consulted about their views on such reforms in 2010, Europeans said they wanted EU farm policy to help
farmers not just to produce food, but also to preserve natural resources and landscapes, improve animal welfare
and keep rural communities viable. The EU has published a set of reform proposals that reflect these demands,
with an emphasis on sustainable farming practices, innovation, research and the spread of knowledge – as well as
http://europa.eu/pol
/agr/index_en.htm

84
a fairer support system for European. Furthermore, the Common Agricultural Policy helps agriculture and forestry
to provide biomass for energy and encourages the use of bioenergy in rural areas.
Policy Rural Development
policy
2007-2013 With over 56 % of the population in the 27 Member States of the European Union (EU) living in rural areas, which
cover 91 % of the territory, rural development is a vitally important policy area. Farming and forestry remain
crucial for land use and the management of natural resources in the EU's rural areas, and as a platform for
economic diversification in rural communities. The strengthening of EU rural development policy is, therefore, an
overall EU priority. More generally, average income per head is lower in rural regions than in towns and cities,
while the skills base is narrower and the service sector is less developed. Also, caring for the rural environment
often carries a financial cost. The European countryside has a great deal to offer. It provides essential raw
materials. The three main objectives of the policy are:
improving the competitiveness of the agricultural and forestry sector;
improving the environment and the countryside;
improving the quality of life in rural areas and encouraging diversification of the rural economy.
http://ec.europa.eu/a
griculture/rurdev/in
dex_en.htm
Fund European Agricultural
Fund for Rural
Development (EAFRD)
LFA since
1975
Developed to support rural development by the “Aid to farmers in Less Favoured Areas” (LFA) which provides a
mechanism for maintaining the countryside in areas where agricultural production or activity is more difficult
because of natural handicaps. Five areas are characterised as LFA: Mountain Areas16; Intermediate Less Favoured
Areas (those in danger of abandonment)17; Areas affected by specific handicapped18
http://eur-
lex.europa.eu/LexUr
iServ/LexUriServ.do
?uri=OJ:L:2005:277:0
001:0040:EN:PDF
Strategy EU strategy for
biofuels
2006 Developed to support research and innovation to improve production processes and to lower costs. Focus on
research and development via the Seventh Framework Programme for Research and Development, the full use of
second generation biomass and biofuels (i.e. originating from the processing of ligno-cellulosic feedstock such as
straw and forest residues). The development of industry-led European technology platforms such as the European
Biofuels Technology Platform, should make it possible to establish a shared European vision and strategy for the
production and use of biofuels.
http://europa.eu/legi
slation_summaries/
agriculture/environ
ment/l28175_en.htm
Regulation REACH 2007 Registration, Evaluation, Authorisation & restriction of Chemicals
REACH is a European Union regulation concerning the Registration, Evaluation, Authorisation and restriction of
Chemicals. The system has several aims: to provide a high level of protection of human health and the
environment from the use of chemicals; to make the people who place chemicals on the market (manufacturers and
importers) responsible for understanding and managing the risks associated with their use.); to allow the free
http://www.hse.gov.
uk/reach/index.htm
16 Areas affected by a short growing season because of a high altitude, or by steep slopes at a lower altitude, or by a combination of the two. 17 Areas with land of poor productivity; production which results from low productivity of the natural environment; and a low or dwindling population predominantly
dependent on agricultural activity 18 Areas that need to conserve or improve the environment; maintain the countryside;; preserve the tourist potential of the areas; protect the coastline.

85
movement of substances on the EU market; to enhance innovation in and the competitiveness of the EU chemicals
industry; to promote the use of alternative methods for the assessment of the hazardous properties of substances
e.g. quantitative structure-activity relationships (QSAR) and read across.
Regulator European Chemicals
Agency
Although ECHA is not a policy instrument, it isthe driving force among regulatory authorities in implementing the
EU's groundbreaking chemicals legislation for the benefit of human health and the environment as well as for
innovation and competitiveness. ECHA helps companies to comply with the legislation, advances the safe use of
chemicals, provides information on chemicals and addresses chemicals of concern.
http://echa.europa.e
u/home
Directive Fuel Quality directive The Directive establishes the limits on the content of ethanol, ether and other oxygenates in petrol. A standard
EN590 is developed which determines the quality of ethanol and biofuels. For biodiesel, an amendment in the
standard EN 14214 is being discussed to facilitate the use of a large variety of vegetable oils and non edible oils
which are feasible without having no ill effects on the performance and sustainability standards of biofuel like
biodiesel.

86
According to a report produced for the EC to review the progress since 2008 up to 2012 on
the use of biomass for transport, energy and heat and cold (Hamelinck et al. 2012), the
majority of Member States (MS) had a Renewable Energy Sources (RES) - including biomass-
growth rate in 2009/2010 above the average annual growth rate required to achieve the 2020
minimum trajectory target. The report also stressed that MS are therefore on track if they
keep this up. Still, a large number of MS need to speed up RES developments in order to
fulfil their 2020 minimum trajectory target.
4.3.2.2 Legal and political sustainability assessment across the value chain of biofuels
In addition to the policy instruments and regulations directly directed at the biofuel sector
(including economic incentives), some sustainability criteria specifically driven for biofuel
production and use is set in the Renewable Energy Directive (RED) in terms of sustainability.
These are set in Article 17 of the Policy. The RED (EC, 2009) includes environmental criteria
for biofuels and reporting obligations for the Commission on the impact on social aspects in
the Community and in third countries for increased demand for biofuels (Article 17). These
requirements are set in Box 1.
Box 1. RED (2009) Article 17 on sustainability criteria for biofuels and bioliquids Paragraph (7). “The Commission shall, every two years, report to the European Parliament and the
Council, in respect of both third countries and Member States that are a significant source of biofuels or
of raw material for biofuels consumed within the Community, on national measures taken to respect the
sustainability criteria set out in paragraphs 2 to 5 and for soil, water and air protection. The first report
shall be submitted in 2012.
The Commission shall, every two years, report to the European Parliament and the Council on the
impact on social sustainability in the Community and in third countries of increased demand for
biofuel, on the impact of Community biofuel policy on the availability of foodstuffs at affordable prices,
in particular for people living in developing countries, and wider development issues. Reports shall
address the respect of land-use rights. They shall state, both for third countries and Member States that
are a significant source of raw material for biofuel consumed within the Community, whether the
country has ratified and implemented each of the following Conventions of the International Labour
Organisation:
Convention concerning Forced or Compulsory Labour (No 29)
Convention concerning Freedom of Association and Protection of the Right to Organise (No 87)
Convention concerning the Application of the Principles of the Right to Organise and to
Bargain Collectively (No 98)
Convention concerning Equal Remuneration of Men and Women Workers for Work of Equal
Value (No 100)
Convention concerning the Abolition of Forced Labour (No 105)
Convention concerning Discrimination in Respect of Employment and Occupation (No 111)
Convention concerning Minimum Age for Admission to Employment (No 138)
Convention concerning the Prohibition and Immediate Action for the Elimination of the Worst
Forms of Child Labour (No 182).
Those reports shall state, both for third countries and Member States that are a significant source of raw
material for biofuel consumed within the Community, whether the country has ratified and
implemented:
the Cartagena Protocol on Biosafety
the Convention on International Trade in Endangered Species of Wild Fauna and Flora.
The first report shall be submitted in 2012. The Commission shall, if appropriate, propose corrective
action, in particular if evidence shows that biofuel production has a significant impact on food prices.’

87
In October 2012, the EC published a proposal for an amended RED (COM2012 595, 2012):
“The aim of the current proposal is to start the transition to biofuels that deliver substantial
greenhouse gas savings when also estimated indirect land-use change emissions are
reported. While existing investments should be protected, the aims of the current proposal
are to:
limit the contribution that conventional biofuels (with a risk of ILUC emissions) make
towards attainment of the targets in the Renewable Energy Directive,
improve the greenhouse gas performance of biofuel production processes (reducing
associated emissions) by raising the greenhouse gas saving threshold for new
installations subject to protecting installations already in operation on 1st July 2014,
encourage a greater market penetration of advanced (low-ILUC) biofuels by allowing
such fuels to contribute more to the targets in the Renewable Energy Directive than
conventional biofuels,
improve the reporting of greenhouse gas emissions by obliging Member States and fuel
suppliers to report the estimated indirect land-use change emissions of biofuels.”
The proposal also aims at protecting existing investments until 2020. The proposal does not
take a position on the actual need for financial support to biofuels before 2020. However, the
Commission is of the view that in the period after 2020 biofuels which do not lead to
substantial greenhouse gas savings (when emissions from indirect land-use change are
included) and are produced from crops used for food and feed should not be subsidised”
(COM2012 595, 2012).
The use of biofuels produced from “food crops, such as those based on cereals and other
starch rich crops, sugars and oil crops” to meet the 10% renewable energy target of the RED
shall be limited to 5%, according to the proposal. Specific issues related to socio-economic
topics are not included.
Furthermore, the communication looks to “prepare for the transition towards advanced
biofuels and minimise the overall indirect land use change impacts in the period to 2020”
(COM 2012, page 8). Box 2 presents the proposal regarding the amendment of Article 18 on
sustainability.
Box 2. COM 2012 on the change to Article 18 (4), second sub-paragraph (COM, 2012). 'The Commission may decide that voluntary national or international schemes setting standards for the
production of biomass products contain accurate data for the purposes of Article 17(2) or demonstrate that
consignments of biofuel or bioliquid comply with the sustainability criteria set out in Article 17(3) to (5). The
Commission may decide that those schemes contain accurate data for the purposes of information on measures
taken for the conservation of areas that provide, in critical situations, basic ecosystem services (such as
watershed protection and erosion control), for soil, water and air protection, the restoration of degraded land,
the avoidance of excessive water consumption in areas where water is scarce and on the issues referred to in
the second subparagraph of Article 17(7). The Commission may also recognise areas for the protection of rare,
threatened or endangered ecosystems or species recognised by international agreements or included in lists
drawn up by intergovernmental organisations or the International Union for the Conservation of Nature for
the purposes of Article 17 (3 )(b) (ii).'
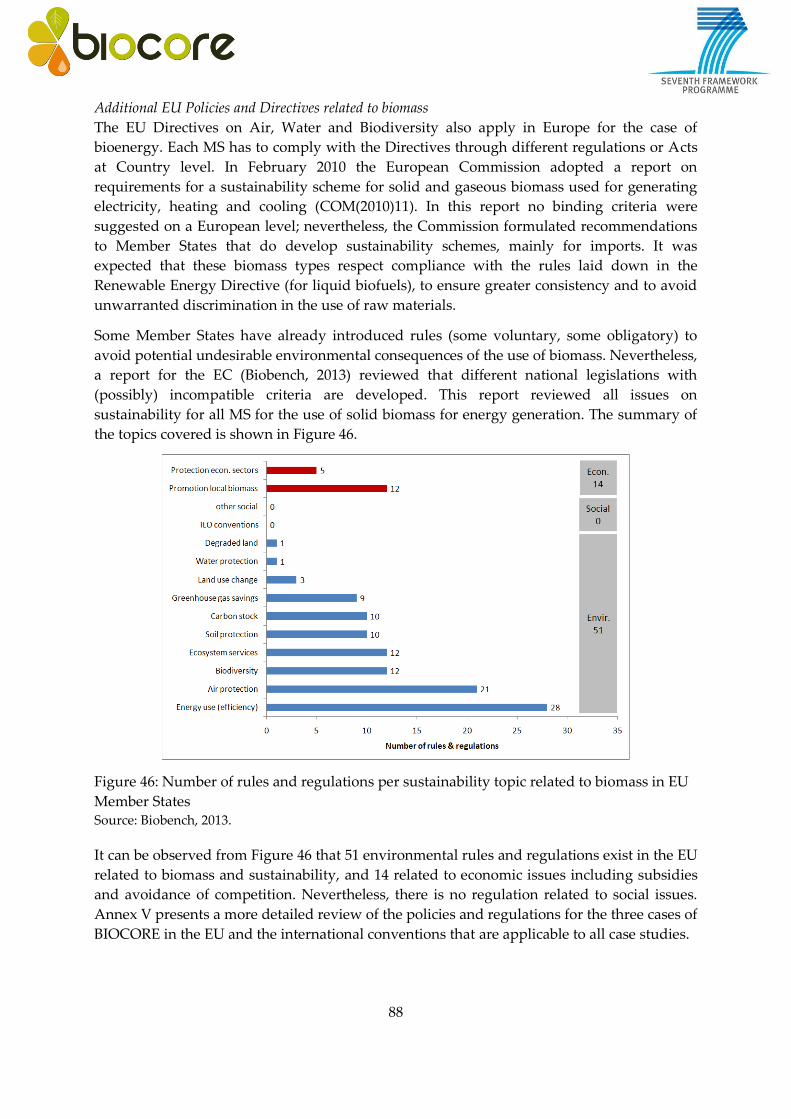
88
Additional EU Policies and Directives related to biomass
The EU Directives on Air, Water and Biodiversity also apply in Europe for the case of
bioenergy. Each MS has to comply with the Directives through different regulations or Acts
at Country level. In February 2010 the European Commission adopted a report on
requirements for a sustainability scheme for solid and gaseous biomass used for generating
electricity, heating and cooling (COM(2010)11). In this report no binding criteria were
suggested on a European level; nevertheless, the Commission formulated recommendations
to Member States that do develop sustainability schemes, mainly for imports. It was
expected that these biomass types respect compliance with the rules laid down in the
Renewable Energy Directive (for liquid biofuels), to ensure greater consistency and to avoid
unwarranted discrimination in the use of raw materials.
Some Member States have already introduced rules (some voluntary, some obligatory) to
avoid potential undesirable environmental consequences of the use of biomass. Nevertheless,
a report for the EC (Biobench, 2013) reviewed that different national legislations with
(possibly) incompatible criteria are developed. This report reviewed all issues on
sustainability for all MS for the use of solid biomass for energy generation. The summary of
the topics covered is shown in Figure 46.
Figure 46: Number of rules and regulations per sustainability topic related to biomass in EU
Member States Source: Biobench, 2013.
It can be observed from Figure 46 that 51 environmental rules and regulations exist in the EU
related to biomass and sustainability, and 14 related to economic issues including subsidies
and avoidance of competition. Nevertheless, there is no regulation related to social issues.
Annex V presents a more detailed review of the policies and regulations for the three cases of
BIOCORE in the EU and the international conventions that are applicable to all case studies.
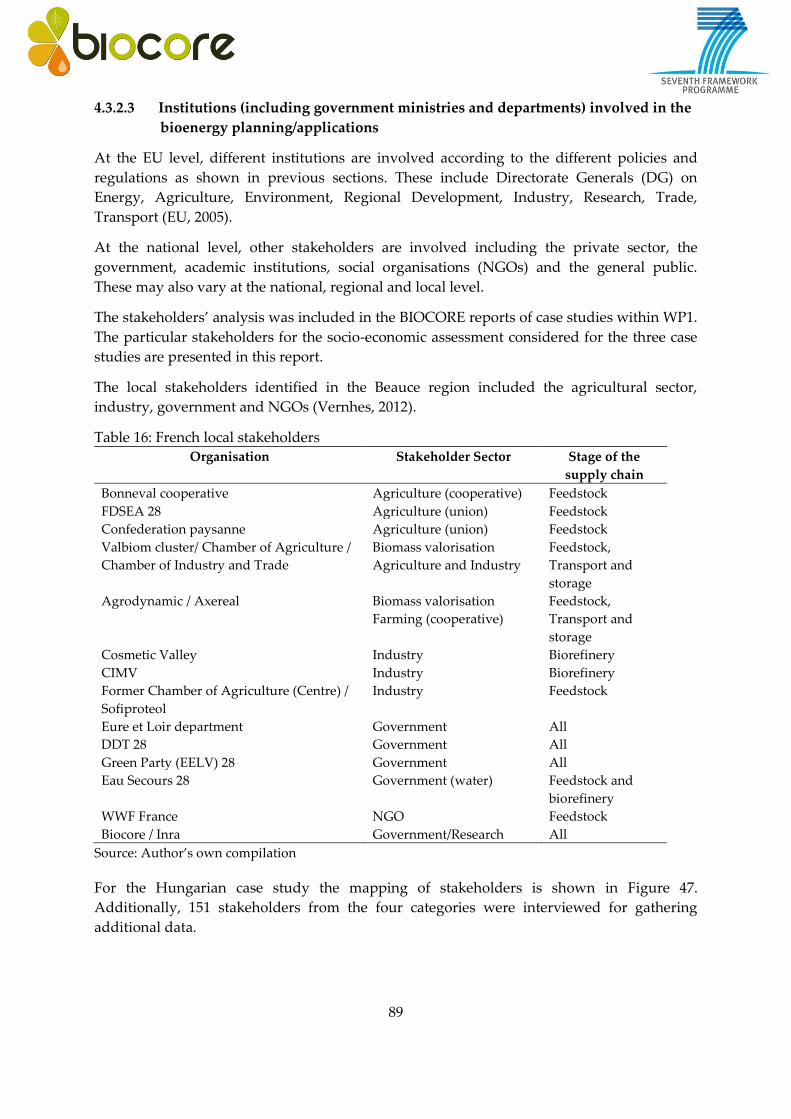
89
4.3.2.3 Institutions (including government ministries and departments) involved in the
bioenergy planning/applications
At the EU level, different institutions are involved according to the different policies and
regulations as shown in previous sections. These include Directorate Generals (DG) on
Energy, Agriculture, Environment, Regional Development, Industry, Research, Trade,
Transport (EU, 2005).
At the national level, other stakeholders are involved including the private sector, the
government, academic institutions, social organisations (NGOs) and the general public.
These may also vary at the national, regional and local level.
The stakeholders’ analysis was included in the BIOCORE reports of case studies within WP1.
The particular stakeholders for the socio-economic assessment considered for the three case
studies are presented in this report.
The local stakeholders identified in the Beauce region included the agricultural sector,
industry, government and NGOs (Vernhes, 2012).
Table 16: French local stakeholders
Organisation Stakeholder Sector Stage of the
supply chain
Bonneval cooperative Agriculture (cooperative) Feedstock
FDSEA 28 Agriculture (union) Feedstock
Confederation paysanne Agriculture (union) Feedstock
Valbiom cluster/ Chamber of Agriculture /
Chamber of Industry and Trade
Biomass valorisation
Agriculture and Industry
Feedstock,
Transport and
storage
Agrodynamic / Axereal Biomass valorisation
Farming (cooperative)
Feedstock,
Transport and
storage
Cosmetic Valley Industry Biorefinery
CIMV Industry Biorefinery
Former Chamber of Agriculture (Centre) /
Sofiproteol
Industry Feedstock
Eure et Loir department Government All
DDT 28 Government All
Green Party (EELV) 28 Government All
Eau Secours 28 Government (water) Feedstock and
biorefinery
WWF France NGO Feedstock
Biocore / Inra Government/Research All
Source: Author’s own compilation
For the Hungarian case study the mapping of stakeholders is shown in Figure 47.
Additionally, 151 stakeholders from the four categories were interviewed for gathering
additional data.
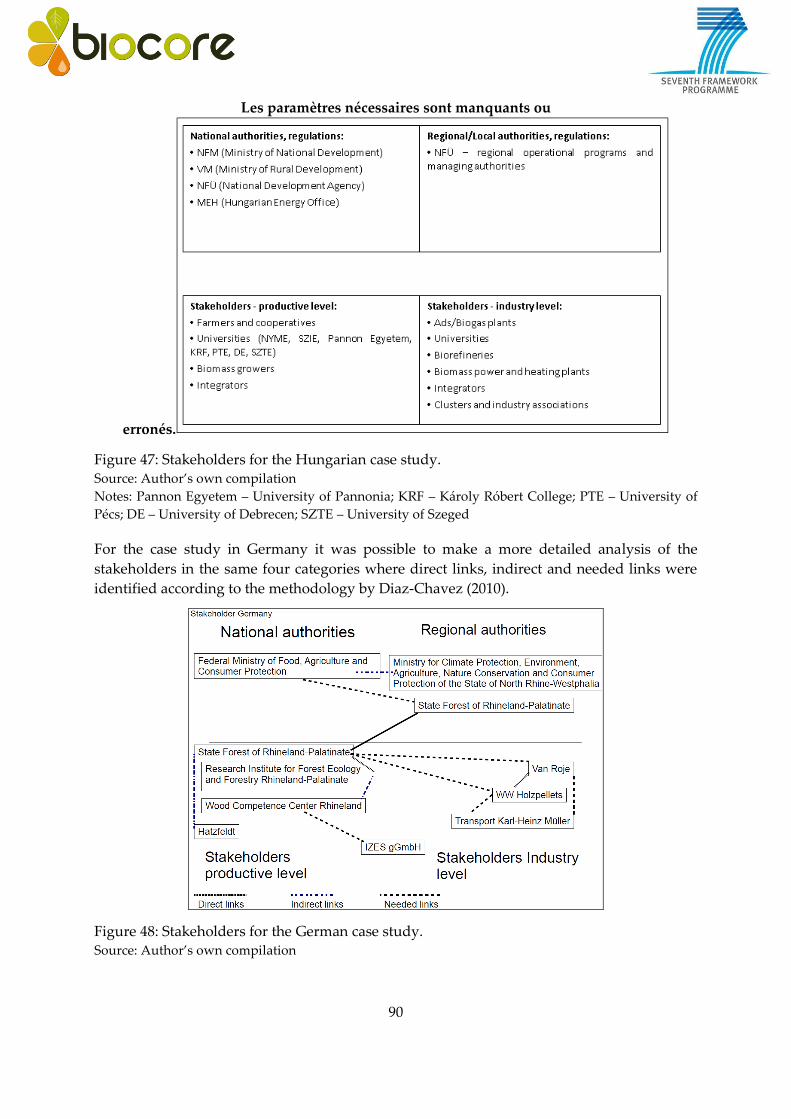
90
Les paramètres nécessaires sont manquants ou
erronés.
Figure 47: Stakeholders for the Hungarian case study. Source: Author’s own compilation
Notes: Pannon Egyetem – University of Pannonia; KRF – Károly Róbert College; PTE – University of
Pécs; DE – University of Debrecen; SZTE – University of Szeged
For the case study in Germany it was possible to make a more detailed analysis of the
stakeholders in the same four categories where direct links, indirect and needed links were
identified according to the methodology by Diaz-Chavez (2010).
Figure 48: Stakeholders for the German case study. Source: Author’s own compilation

91
4.4 Social Sustainability Assessment – Results
4.4.1 Results of social ‘sustainability assessment’ based on Multi-Criteria Analysis
approach (using AHP) – Case of India
As noted in the methodology section of this report, AHP is a methodology used to formulate
and analyse decisions. The AHP divides the problem or questions in the research into
elements, according to their common characteristics that can then be divided into levels. The
advantage of the AHP tool is that it considers both quantitative and qualitative factors to
handle different groups of actors. It allows users to assess the relative weight of multiple
criteria or multiple options against given criteria in an intuitive manner. In case that
quantitative ratings are not available, policy makers or assessors can still recognize whether
one criterion is more important than another.
The AHP tool has been used as one of the tools for the social sustainability assessment in this
study. While assessing sustainability of BIOCORE, a list of both qualitative and quantitative
indicators across various domains (Annex II) was identified to address sustainability of a
biorefinery. These indicators were then used to design the AHP questionnaire which
facilitated a dialogue with the selected stakeholders and helped collect their perceptions in
the context of assessing social sustainability of bio-refineries in the State of Punjab in India.
Although there is a potential for a biorefinery setup based on biomass in an area where there
are high levels of agricultural production, a social sustainability assessment has not yet been
conducted for this potential biorefinery set up. The absence of such an assessment could
hinder industries and organizations to set up such an infrastructure fearing different kinds of
sustainability risks and concerns. The risks, or barriers involved, which are also highlighted
by the study (by the way of showing the indicators with the lowest scores), would be useful
in understanding what we have currently and what needs to be done in the near future.
Assigning a score to different sustainability indicators helps in understanding the problems
and addressing them before such an infrastructure is put in place, showing forward thinking
about the sustainability aspects and helping address the factors that could hinder
sustainability.
The two study sites in the State of Punjab in India were the districts of Sangrur (including
parts of adjoining district of Barnala) and Faridkot. Sangrur (and its adjacent district,
Barnala) are located in Southern Punjab while Faridkot is located in South-Western Punjab.
The surveyed farmers belonged to the villages - Bhogpur/Jalandhar, Attari/ASR, Handiaya,
Thaula, Faguala, Manavindi, Dhaula Pind, Burjamasta Pind, Ryunwalla Pind in the two
districts. Both these areas produce wheat and rice crops.
The first step of the AHP analysis for the study was to define the goal. The goal was defined
as “To check which indicator supports best, the feasibility19 for Biocore to be set up
(according to the different stakeholders).” Once the goal was defined, the alternatives, which
in simple terms meant the sustainability indicators and the different stakeholders (or the
term child in the software), were defined. These broad sustainability indicators for the study,
in line with the broad domains of the study, were selected as:
19 Here, the term feasibility is being used to show support for the sustainability of a biorefinery
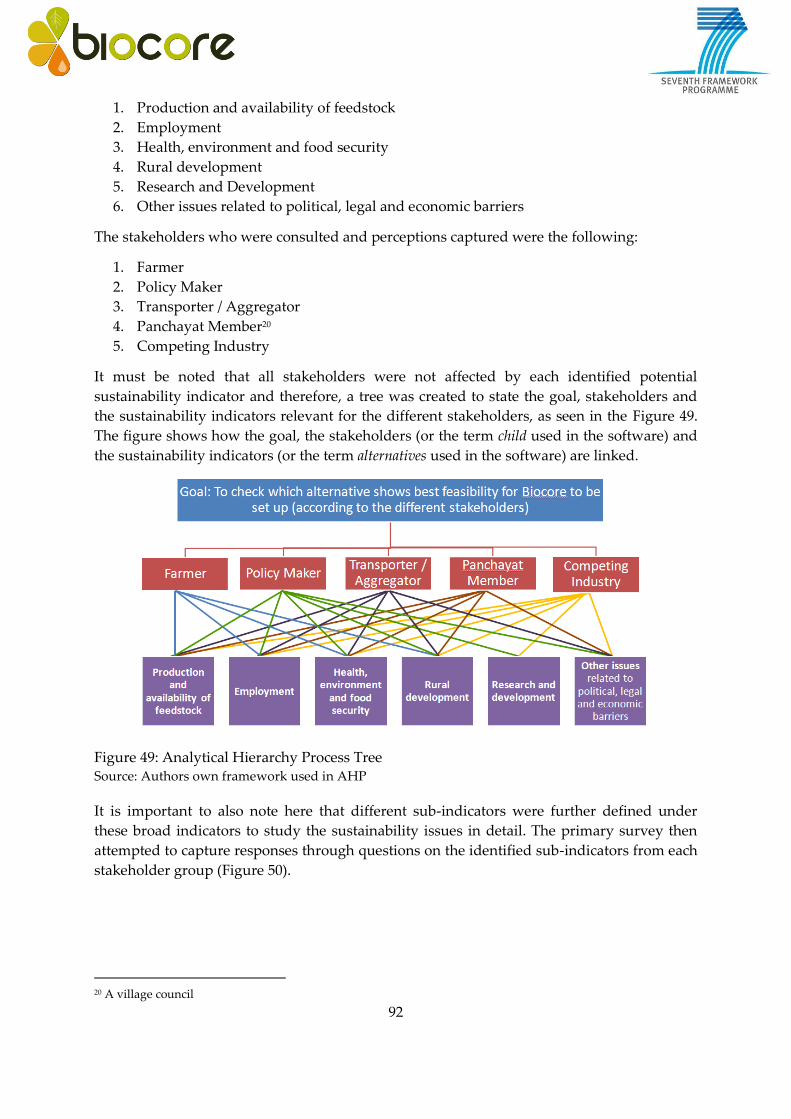
92
1. Production and availability of feedstock
2. Employment
3. Health, environment and food security
4. Rural development
5. Research and Development
6. Other issues related to political, legal and economic barriers
The stakeholders who were consulted and perceptions captured were the following:
1. Farmer
2. Policy Maker
3. Transporter / Aggregator
4. Panchayat Member20
5. Competing Industry
It must be noted that all stakeholders were not affected by each identified potential
sustainability indicator and therefore, a tree was created to state the goal, stakeholders and
the sustainability indicators relevant for the different stakeholders, as seen in the Figure 49.
The figure shows how the goal, the stakeholders (or the term child used in the software) and
the sustainability indicators (or the term alternatives used in the software) are linked.
Figure 49: Analytical Hierarchy Process Tree Source: Authors own framework used in AHP
It is important to also note here that different sub-indicators were further defined under
these broad indicators to study the sustainability issues in detail. The primary survey then
attempted to capture responses through questions on the identified sub-indicators from each
stakeholder group (Figure 50).
20 A village council

93
Figure 50: Sustainability indicators and questions related to these indicators Source: Authors own compilation
Some of the specific issues looked at for the social sustainability assessment under the broad
indicators were the following:
1. Production and availability of feedstock included the availability of biomass for use
in a biorefinery, willingness to shift cropping patterns to rice and wheat, the role of
Panchayat in deciding the cropping patterns, etc.,
2. Employment included current limitations in employment opportunity, openness in
exploring and taking non-agricultural activities (particularly industrial employment),
working conditions in competing industries, willingness to work in a biorefinery,
strength of labour unions, child labour issues, etc.,,
3. Health, environment and food security included health impacts due to working
conditions in competing industries, food security impacts during to the presence of a
biorefinery, environment, water and land related stress in the area related to industrial
activity, etc.,
4. Rural Development included improvement in infrastructure due to industrialization
in the area and whether a biorefinery would help enhance this infrastructure,
5. Research and Development included the extent to which investment in research and
development has occurred in clean/bio energy and the need for such investments,
6. Other issues included current political and administrative barriers in setting up a
biorefinery, creation of new economic opportunities for locals, etc..

94
Stakholders’ response to the above issues was collected based on a questionnaire survey.
Data were collected from various stakeholders corresponding to the hierarchical structure,
on a scoring scale using the questionnaire. A score of one meant that the indicator
sustainably supports biorefinery while a score of zero meant the indicator does not
sustainably support biorefinery. The responses of the stakeholders were converted into
suitable numbers and were finally used in the Expert Choice Software in order to arrive at a
combined score.
4.4.1.1 Result and analysis with respect to goal
The sustainability indicators were evaluated (the term synthesised was used by the software)
with respect to the goal of looking at how the selected indicators sustainably supported
biorefinery. Figure 51 shows how the different indicators sustainably support Biocore. Here,
the analysis states that if a biorefinery is set up in the selected region, there will be enough
production and availability of feedstock to run the biorefinery. However, interactions from
the field survey revealed that there are some concerns associated with the collection, drying
logistics and storing of the straws, and they need propor management if the agro-residues
can be utilized in the long run. Farmers will also need to be convinced about the advantages
of collecting and selling their straw. Selling rice straw could provide new income possibilities
to the farmers and reduce the levels of harmful air pollution and damages to soil flora and
fauna.
Results also reveal that there would not be any constraint with regard to human capital.
Further issues like (child) labour related conflicts would pose limited challenges. One of the
main socio-economic benefits that came out during the interaction with the stakeholders is
the improvement in local employment due to future presence of a biorefinery in the state.
There is a lot of disguised unemployment in the state, and the stakeholders felt that with
adequate industry specific training, the currently unemployed can find significant
employment potential along biomass conversion processes. This can also be supported from
the report by the World Economic Forum on ‘The Future of Industrial Biorefineries’, that
points out at the creation of job opportunities, particularly in rural areas where incomes and
economic prospects are currently moderate. However, it is important to mention that certain
case studies have found that biorefinery operations may have the potential to generate
significant long-run increases in employment but at the same time short-term displacement
effects may take place in the labour market. Thus, though the availability of labour to work
in the biorefinery does not come across as a problem as there is surplus labour available in
the region and that is looking for alternative employment opportunities, however they will
require skill training before they can work in the biorefineries on the biomass conversion
processes.
One of the indicators that has been identified to pose a concern to sustainability aspects is
that of lack of adequate ‘research and development’. This calls for the need to increase the
level of R&D activities to support the setting up of the biorefinery given that the current
R&D is insufficient. ‘Rural development,’ is another indicator of concern in the context of
support for the sustainability of a biorefinery where the present infrastructure, even with
industrialization is not sufficient to support the sustainability of a biorefinery and there may
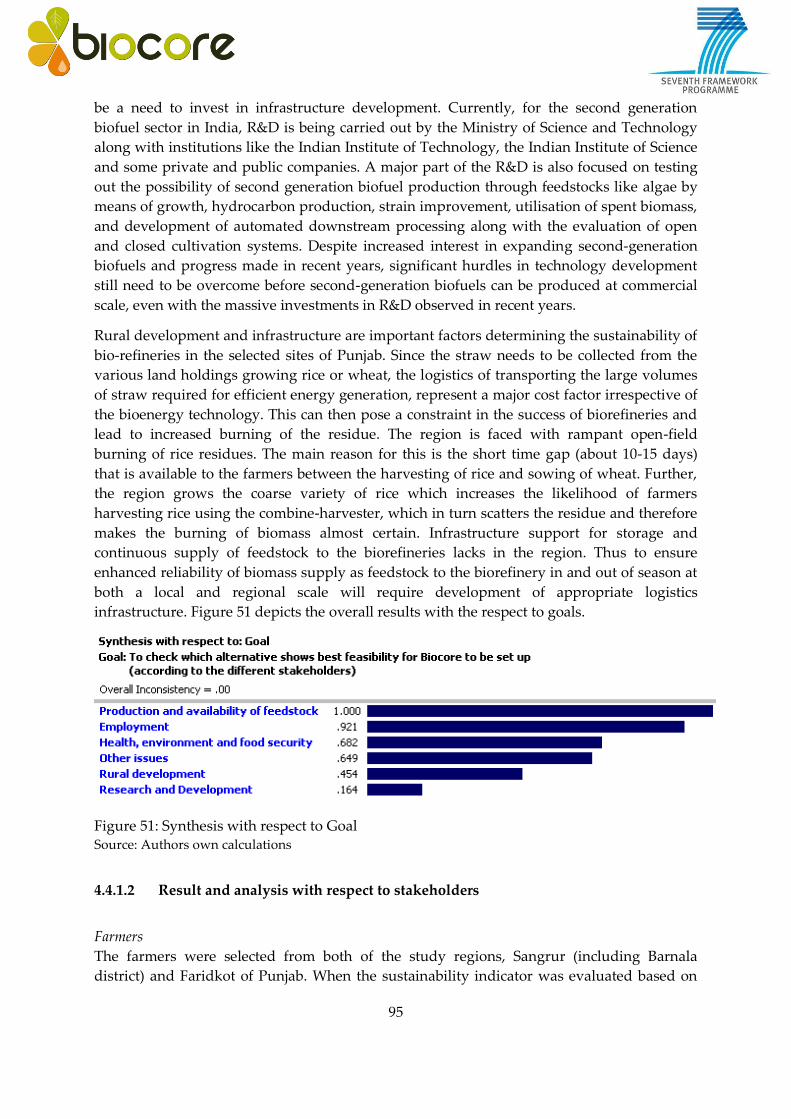
95
be a need to invest in infrastructure development. Currently, for the second generation
biofuel sector in India, R&D is being carried out by the Ministry of Science and Technology
along with institutions like the Indian Institute of Technology, the Indian Institute of Science
and some private and public companies. A major part of the R&D is also focused on testing
out the possibility of second generation biofuel production through feedstocks like algae by
means of growth, hydrocarbon production, strain improvement, utilisation of spent biomass,
and development of automated downstream processing along with the evaluation of open
and closed cultivation systems. Despite increased interest in expanding second-generation
biofuels and progress made in recent years, significant hurdles in technology development
still need to be overcome before second-generation biofuels can be produced at commercial
scale, even with the massive investments in R&D observed in recent years.
Rural development and infrastructure are important factors determining the sustainability of
bio-refineries in the selected sites of Punjab. Since the straw needs to be collected from the
various land holdings growing rice or wheat, the logistics of transporting the large volumes
of straw required for efficient energy generation, represent a major cost factor irrespective of
the bioenergy technology. This can then pose a constraint in the success of biorefineries and
lead to increased burning of the residue. The region is faced with rampant open-field
burning of rice residues. The main reason for this is the short time gap (about 10-15 days)
that is available to the farmers between the harvesting of rice and sowing of wheat. Further,
the region grows the coarse variety of rice which increases the likelihood of farmers
harvesting rice using the combine-harvester, which in turn scatters the residue and therefore
makes the burning of biomass almost certain. Infrastructure support for storage and
continuous supply of feedstock to the biorefineries lacks in the region. Thus to ensure
enhanced reliability of biomass supply as feedstock to the biorefinery in and out of season at
both a local and regional scale will require development of appropriate logistics
infrastructure. Figure 51 depicts the overall results with the respect to goals.
Figure 51: Synthesis with respect to Goal Source: Authors own calculations
4.4.1.2 Result and analysis with respect to stakeholders
Farmers
The farmers were selected from both of the study regions, Sangrur (including Barnala
district) and Faridkot of Punjab. When the sustainability indicator was evaluated based on
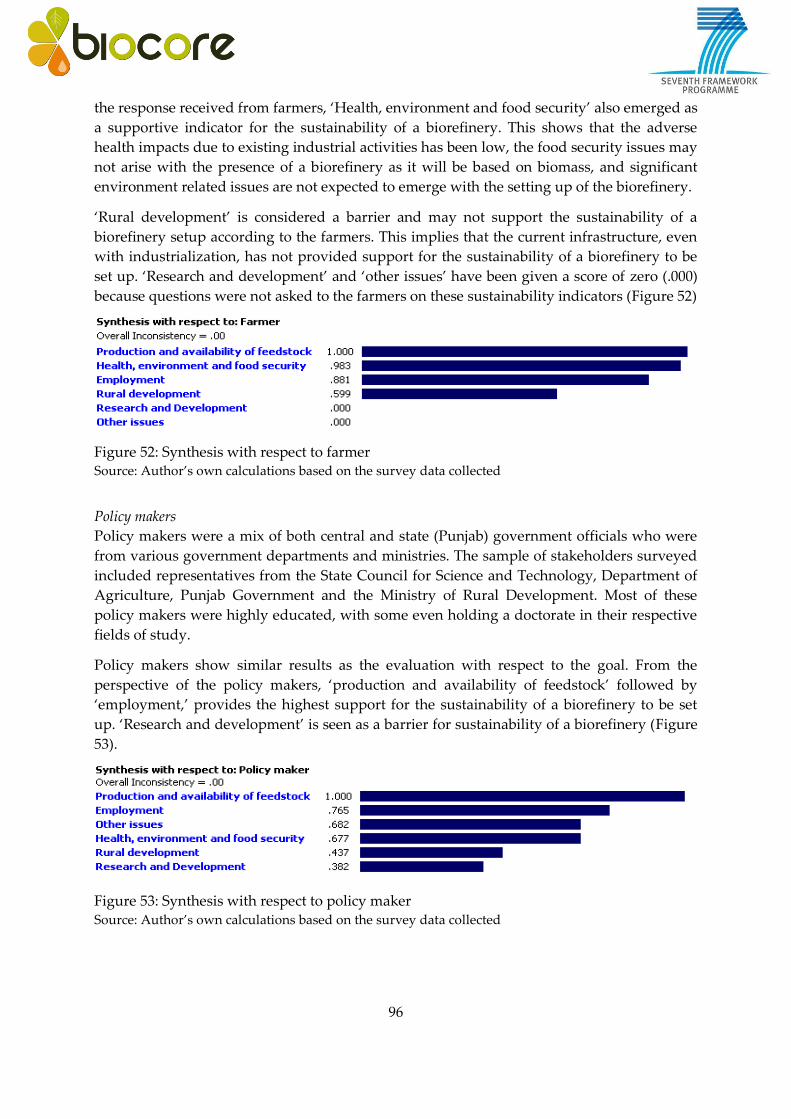
96
the response received from farmers, ‘Health, environment and food security’ also emerged as
a supportive indicator for the sustainability of a biorefinery. This shows that the adverse
health impacts due to existing industrial activities has been low, the food security issues may
not arise with the presence of a biorefinery as it will be based on biomass, and significant
environment related issues are not expected to emerge with the setting up of the biorefinery.
‘Rural development’ is considered a barrier and may not support the sustainability of a
biorefinery setup according to the farmers. This implies that the current infrastructure, even
with industrialization, has not provided support for the sustainability of a biorefinery to be
set up. ‘Research and development’ and ‘other issues’ have been given a score of zero (.000)
because questions were not asked to the farmers on these sustainability indicators (Figure 52)
Figure 52: Synthesis with respect to farmer Source: Author’s own calculations based on the survey data collected
Policy makers
Policy makers were a mix of both central and state (Punjab) government officials who were
from various government departments and ministries. The sample of stakeholders surveyed
included representatives from the State Council for Science and Technology, Department of
Agriculture, Punjab Government and the Ministry of Rural Development. Most of these
policy makers were highly educated, with some even holding a doctorate in their respective
fields of study.
Policy makers show similar results as the evaluation with respect to the goal. From the
perspective of the policy makers, ‘production and availability of feedstock’ followed by
‘employment,’ provides the highest support for the sustainability of a biorefinery to be set
up. ‘Research and development’ is seen as a barrier for sustainability of a biorefinery (Figure
53).
Figure 53: Synthesis with respect to policy maker Source: Author’s own calculations based on the survey data collected
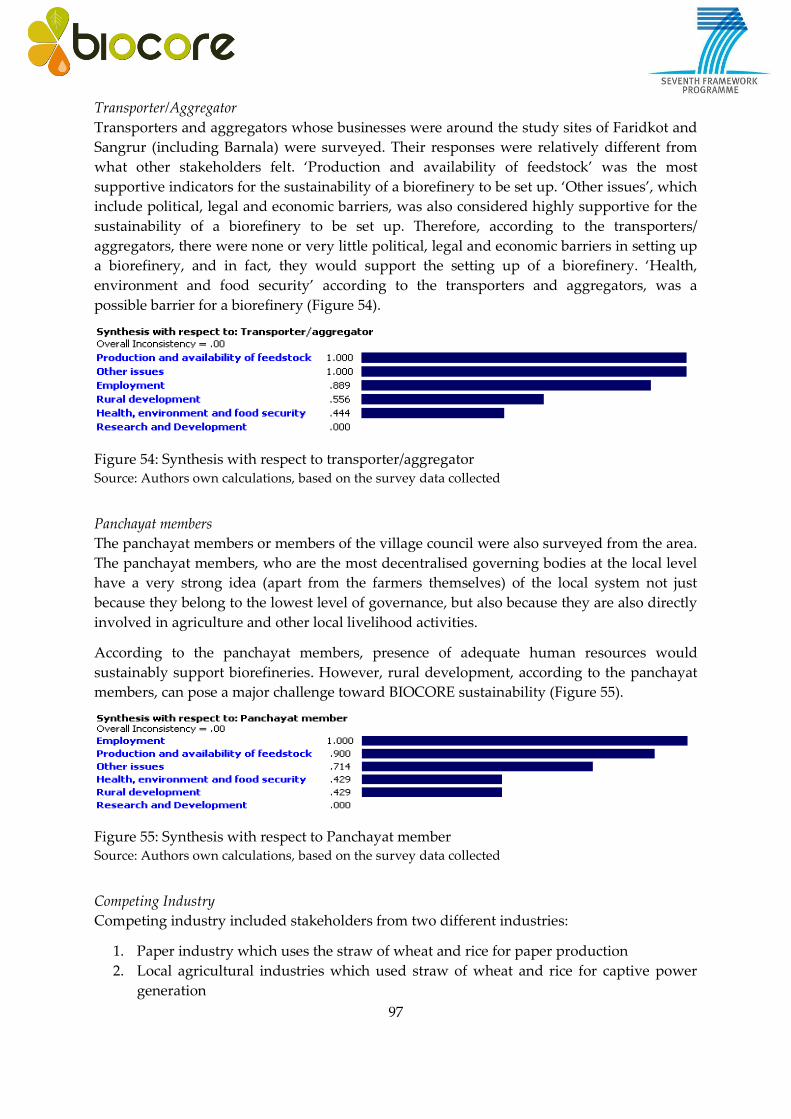
97
Transporter/Aggregator
Transporters and aggregators whose businesses were around the study sites of Faridkot and
Sangrur (including Barnala) were surveyed. Their responses were relatively different from
what other stakeholders felt. ‘Production and availability of feedstock’ was the most
supportive indicators for the sustainability of a biorefinery to be set up. ‘Other issues’, which
include political, legal and economic barriers, was also considered highly supportive for the
sustainability of a biorefinery to be set up. Therefore, according to the transporters/
aggregators, there were none or very little political, legal and economic barriers in setting up
a biorefinery, and in fact, they would support the setting up of a biorefinery. ‘Health,
environment and food security’ according to the transporters and aggregators, was a
possible barrier for a biorefinery (Figure 54).
Figure 54: Synthesis with respect to transporter/aggregator Source: Authors own calculations, based on the survey data collected
Panchayat members
The panchayat members or members of the village council were also surveyed from the area.
The panchayat members, who are the most decentralised governing bodies at the local level
have a very strong idea (apart from the farmers themselves) of the local system not just
because they belong to the lowest level of governance, but also because they are also directly
involved in agriculture and other local livelihood activities.
According to the panchayat members, presence of adequate human resources would
sustainably support biorefineries. However, rural development, according to the panchayat
members, can pose a major challenge toward BIOCORE sustainability (Figure 55).
Figure 55: Synthesis with respect to Panchayat member Source: Authors own calculations, based on the survey data collected
Competing Industry
Competing industry included stakeholders from two different industries:
1. Paper industry which uses the straw of wheat and rice for paper production
2. Local agricultural industries which used straw of wheat and rice for captive power
generation

98
The competing industry felt that ‘production and availability of feedstock’ and availability of
adequate human resources with limited political influence would sustainably support
BIOCORE. However, rural development, according to them, can pose a major challenge
toward BIOCORE sustainability (Figure 56).
Figure 56: Synthesis with respect to competing industry Source: Author’s own calculations, based on the survey data collected
4.4.2 Results of social ‘sustainability assessment’ based on a combined approach of
Social Impact Assessment (SIA) and Social Life Cycle Assessment (SLCA)
4.4.2.1 Case of Europe
The assessment was done on the criteria selected as indicated in section 4.1.4. Some of the
indicators provide background for the assessment (1-6; 13-14) and were assessed with an SIA
methodology. The parameters (8-12) assessed with the hotspot database used a scale for the
risk from low, medium, high and very high. These parameters were included in the Hotspot
index according to the methodology from Benoit et al. (2010). As the assessment includes
more than 50 characterized social issues for 20 Social Themes, the amount of data is difficult
to assess for decision-making. For this reason, Benoit et al. (2012) recommend to calculate a
Social Hotspot Index for each CSS and identify hotspots in the supply chain. The authors
constructed the Index by weighting the level of risk identified for each Social Issue. A zero
was assigned to social issues with low risk, a 1 was assigned to those that are medium, a 2 to
those with high risk, and a 3 for those with very high risk. Summing across all social issues
resulted in a total number of weighted hotspot issues to be aware of when working in that
country and sector. Thus, social issues are not compared against each other. All issues are
weighted equally in the sum and all are considered a risk or negative impact. Positive
impacts are not assessed with the Social Hotspot Index.
The summary of the assessment of the case studies is presented in Table 17. The full detailed
case studies are presented in Annex V.

99
Table 17: Summary of social sustainability criteria for the EU case studies. No Parameter/criteria France Germany Hungary
1 Trade of feedstock
The incentives reported
for the National Case in
France, are specific for
biofuels production. The
incentives refer to tax
exemptions
2 Identification of
stakeholders along the
supply chain
Stakeholders have been
identified in section
4.3.2.3
Stakeholders have been
identified in section
4.3.2.3
Stakeholders have been
identified in section
4.3.2.3
3 Policies and regulations Have been identified in
section 4.3.2.1
Biomass Action Plan
und Deutsches
Ressourceneffizienzpro
gramm (German
Resource Efficiency
Programme)
Lignocellulose
Biorefinery (including
the Green Biorefinery)
The Hotspot database
for the case of Hungary
identified as medium
level the Indicators and
Risk for Potential of
Country not passing Labor
Laws. Seven Laws
related to the sector
were identified
(although the HSDB
does not indicate which
ones). For the indicator
of “overall legal
fragility” of the HSDB,
Hungary ranked
medium.
4 Potential biorefinery
location Logistic
This criteria was
assessed in WP1 for all
case studies
This criteria was
assessed in WP1 for all
case studies
This criteria was
assessed in WP1 for all
case studies
5 Land use tenure Is not a problem in the
EU.
Between 2000 and 2010,
the number of large
farms increased by 10%
to reach and the
average Agricultural
Unit (UAA) per
exploitation went from
89ha to 105ha meaning
that more land is
concentrated in fewer
hands
Is not a problem in the
EU.
Is not a problem in the
EU.
6 Community
participation
Interviews in the Beauce
regions and concluded
that all stakeholders
seemed to agree on the
fact that the most
challenging issue would
be the timing: pressing,
collecting, transporting
and storing such a large
amount of straw in such
a limited period of time
Results of the interviews
in Germany stated that
willigness to participate
if jobs and prices are
competitive.
Results of the interviews
in Hungary stated a
division on the
willingness to sell that
farmers, forest owners
would sell if the prices
are competitive and
contracts are clear and
for long term.
7 Quality of life NA NA NA

100
No Parameter/criteria France Germany Hungary
8 Rural development and
Infrastructure
HSDB themes:
1. Access to improved
drinking water
2. Access to improved
sanitation
3. Access to hospital
beds
In the case of France for
the three criteria
selected in the sLCA
Hotspot database, the
risks are categorized as
Low.
In the case of Germany
for the three criteria
selected in the sLCA
Hotspot database, the
risks are categorized as
Low.
In the case of Hungary
for the three criteria
selected in the sLCA
Hotspot database, the
risks are categorized as
Low.
Transport is an issue in
the case study as it is a
remote area and road
transport is not efficient.
9 Jobs creation and wages
HSDB has three criteria
in two themes:
Potential of minimum
wage not being
updated
Wage Assessment
Straw pressing and
transport is the main
issue. Interviews
reported that
Agricultural Units may
be created. Range of job
creation was between
155 to 230 along the
supply chain.
T HSDB has three
criteria in two themes of
the Labor rights and
decent jobs category).
The three criteria have
been assessed as Low
risk
Interviews results
highlighted the creation
of jobs in the region if a
biorefinery is set up.
Regarding wages, the
hotspot database has
three criteria in two
themes of the Labor
rights and decent jobs
category)
The three criteria have
been assessed as Low
risk.
Interviews highlighted
jobs creation and the
need for high skilled
positions in a limited
number. Range of jobs
creation were from 250
to 2000 (including
indirect jobs)
The three criteria in the
HSDB have been
assessed as Low risk.
10 Gender equity
HSDB: Overall fragility
of Gender equity
The HSDB for the
criteria of overall
fragility of Gender
equity France was
assessed as Low risk.
For Overall fragility of
Gender equity Germany
was ranked as Low risk
For Overall fragility of
Gender equity Hungary
was ranked as Low risk
11 Labour conditions
Child Labor
Forced labor
Excessive working
time
Freedom of
Association
Collective
bargaining rights
Right to strike
In the HSDB child labor
it was reported as no
evidence. Out of nine
issues assessed four
were assessed as Low
and five as Medium. It
has to be noted that the
assessment is done for
various sectors,
therefore it would be
difficult to specify if
these issues are related t
the agriculture sector.
Most of the indicatords
in the HSDB were
assessed as low risk
whilenot having the
right to strike was
assessed as high
For the five indicators of
the HSDB only risk of
not having bargaining
rights was assessed as
high while risk of forced
labour and risk of not
having freedom of
association were
assessed as medium.
The rest of the
indicators were assessed
as low.
12 Health and safety The implementation of a
Safety and Health
measures is considered
to be according to the
EU legislation and
National Laws.
Additional, it is
expected that large
industries such as a
biorefinery will develop
The implementation of a
Safety and Health
measures is considered
to be according to the
EU legislation and
National Laws.
Additional it is expected
that large industries
such as a biorefinery
will develop a Quality
The implementation of a
Safety and Health
measures is considered
to be according to the
EU legislation and
National Laws.
Additional it is expected
that large industries
such as a biorefinery
will develop a Quality
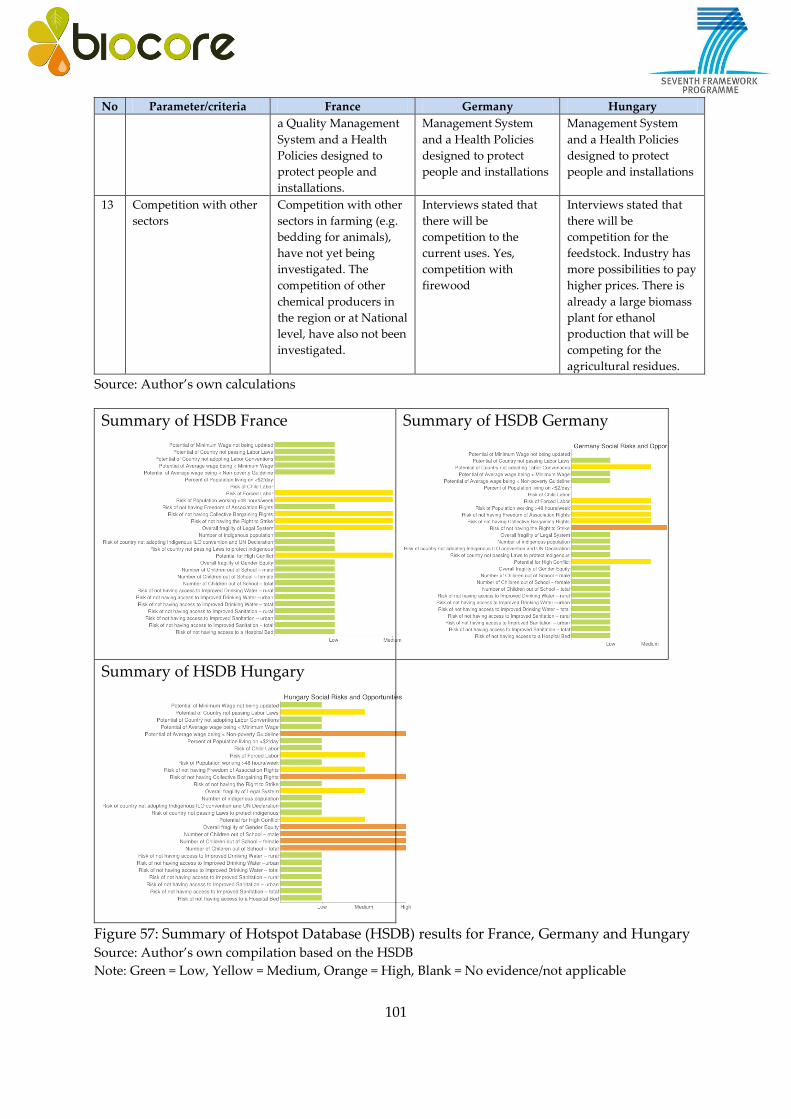
101
No Parameter/criteria France Germany Hungary
a Quality Management
System and a Health
Policies designed to
protect people and
installations.
Management System
and a Health Policies
designed to protect
people and installations
Management System
and a Health Policies
designed to protect
people and installations
13 Competition with other
sectors
Competition with other
sectors in farming (e.g.
bedding for animals),
have not yet being
investigated. The
competition of other
chemical producers in
the region or at National
level, have also not been
investigated.
Interviews stated that
there will be
competition to the
current uses. Yes,
competition with
firewood
Interviews stated that
there will be
competition for the
feedstock. Industry has
more possibilities to pay
higher prices. There is
already a large biomass
plant for ethanol
production that will be
competing for the
agricultural residues.
Source: Author’s own calculations
Summary of HSDB France
Summary of HSDB Germany
Summary of HSDB Hungary
Figure 57: Summary of Hotspot Database (HSDB) results for France, Germany and Hungary Source: Author’s own compilation based on the HSDB
Note: Green = Low, Yellow = Medium, Orange = High, Blank = No evidence/not applicable

102
4.4.2.2 Case of India
The summary of the assessment of the India case study is presented in Table 18. The full
detailed case studies are presented in Annex V.
Table 18: Summary of social sustainability assessment for the case study of India No Parameter/criteria India
1 Trade of feedstock
Targets and incentives have been discussed in the Policy Section. With regard
to barriers in trade in feedstock, the multi-criterion assessment revealed
limited impact on the parameter. Interaction with stakeholders also revealed
that there are limited barriers with regard to trade/supply or distribution of
final products in the market.
2 Identification of
stakeholders along the
supply chain
The stakeholder categories along the supply chain considered for the social
assessment are presented in section 4.1.2
3 Policies and regulations Policies and regulations were assessed in section 4.1.1
The HSDB indicator on Risk for Overall fragility of Legal System was ranked as
medium. HSDB indicator on Risk of country no passing Laws to protect Indigenous
population which was ranked medium.
4 Potential biorefinery
location Logistic
This was described in WP1. In the context of the social sustainability
assessment is not assessed as the other indicators provide the assessment
5 Land use tenure Although the particular case study of India did not report conflicts under land
use and land use tenure, the Land Portal (2013) through the Land Matrix
Database (2013) reported some cases of land grabbing in India. These case
studies were mainly for setting plants for the industrial sector. The portal did
not provide additional information about the companies. Nevertheless, the
information is updated until 2012 and some of the land grabbings consider a
significant amount of land where land rights were not respected. This
assessment is presented in full in the annex.
6 Community
participation
The HSDB assessed the number of indigenous population as a percentage of the
total and per sector. In this case, India ranked high and for this reason it was
included within community participation.
However it is important to note that, Schedule Tribes are present in all Indian
states and Union Territories (UTs) except in the States/UTs of Haryana, Punjab,
Delhi, Pondicherry and Chandigarh. No tribe has been notified as ST in
Punjab, according to the Constitution (Scheduled Tribes) order, 1950 as
amended by the Scheduled Tribes Orders (amendment) Act, 197621. So at the
proposed bio-refinery location, this parameter may not be of the Indian
average of high risk.
7 Quality of life NA
8 Rural development and
Infrastructure
HSDB themes:
4. Access to improved
drinking water
5. Access to improved
sanitation
6. Access to hospital
beds
In the case of India for the three criteria selected in the Hotspot database, the
risks are categorized as Medium, High and Very High.
21 http://www.punjabtourism.gov.in/LD13-Indigenous%20Peoples%20Planning%20Framework_5May.pdf
http://censusindia.gov.in/Tables_Published/A-Series/A-Series_links/t_00_005.aspx

103
No Parameter/criteria India
9 Jobs creation and
wages
HSDB has three criteria
in two themes:
Potential of
minimum wage not
being updated
Wage Assessment
The three criteria have been assessed as Low risk.
10 Gender equity
HSDB: Overall fragility
of Gender equity
For this indicator, India was ranked as Very High risk.
11 Labour conditions
Child Labor
Forced labor
Excessive working
time
Freedom of
Association
Collective
bargaining rights
Right to strike
All the criteria were ranked as high in the HSDB except for freedom of
association rights that was ranked as medium.
12 Health and safety This category is not assessed in the hotspot database
India has implemented laws, which regulate the measures the companies have
to take to reinforce occupational health and safety measures. Especially, the
Factories Act, 1948, the Mines Act, the Ports Act and the Construction Act refer
to safety of employees working in the respective sectors. For other employees,
for example such as those employed in shops or establishments, various state
legislations are enacted, which provide for almost similar matters as under the
Factories Act22. Though the consultations with the stakeholders have indicated
good compliance with these laws and regulations, but literature has reported
high number of accidents in the country in the past, despite there being
comprehensive legislation.
13 Competition with other
sectors
Stakeholders consider there is competition for the residue with cattle feed (in
case of wheat straw) and some industries, particularly the paper and pulp
industry, however, the supply potential is high which can be tapped by
offering a reasonable price to the farmers in Punjab. So this factor could be
considered as a relatively low risk.
Source: Author’s own compilation
22 Labour Laws

104
Summary of HSDB India
Figure 58: Summary of Hotspot Database (HSDB) results for India Source: Author’s own compilation based on the HSDB
Note: Green = Low, Yellow = Medium, Orange = High, Blank = No evidence/not applicable
4.4.3 Overall assessment
As part of the methodology proposed within the BIOCORE project, a combination of social
LCA and social impact assessment is used to assess the case studies in other issues. The
socio-economic assessment also considered the assessment of parameters and criteria
previously selected and which information has already been stated in the previous sections.
The criteria have been assessed as possible negative and positive impacts and, if negative,
how can they be mitigated or which precautions need to be considered. This assessment does
not include a complete social assessment, which requires a well-documented project
proposal and would need to comply with the national regulations. Nevertheless, it should be
noted that a proper Environmental and Social Impact Assessment is recommended to
comply with good practice.
The impacts have been classified firstly by type: direct, if the project is producing the impact,
or background, if the local conditions are influencing the implementation of the project; as
positive, if it is likely to produce a benefit and negative, if on the contrary, they are likely to
produce an impact that will not be of social benefit to the country or the local community;
neutral if it is considered it will not hav effects in any form. If negative, a comment on
possible forms to mitigate, reduce or avoid the impact is added. Finally, a risk value is
provided as low, medium or high according to the data provided. This risk value indicates
the likeliness to present a problem in the future even if the impact was assessed as positive.
The assessments are presented in the following for the three cases in the EU (Table 19) and
the case of India (Table 20) for the overall sustainability assessment for biorefineries.
Additional information is provided in Annex 7.4.
Cumulative and indirect impacts have not been considered due to the lack of information of
the local conditions. This assessment can be considered as a general one to be conducted for
biorefineries.

105
Table 19: Social impact assessment summary for the cases in Europe. (After Diaz-Chavez, 2013). NO Parameter Characteristics/Criteria Type Impact Risk Benefit Mitigation Other
1 Production of feedstock Incentives B + H Incentives have an advantage but fair
play is necessary to reduce/avoid
competition with other sector
In the EU several incentives are al ready
in place.
Barriers B - L Look for market opportunities and
avoid Financing Insecurity for large
investments.
2 Identification of Stakeholders
along the supply chain
Producers (farmers)
Regulators
Business
Traders
Research
B + H Identification at local level and the
promotion of unions, cooperatives or
associations that may help develop the
market and the industry at local level.
3 Policies and regulations National
B + H A Policy framework is in place in the EU
plus National and local policies,
programmes and regulations.
Enforcement B - L In general for the EU there is no
problem with enforcement although
the HSDB presented some problems
in the Hungarian case..
5 Land use tenure Land ownership rights B N This is not a problem in the EU. Land
abandonment has been reported as a
problem but not in the sense of
ownership.
6 Community participation Community participation D + H Community participation in a defined
business model and community is
necessary as well as consultation with
farmers and local stakeholders.
8 Rural development and
Infrastructure
Roads
B - L In general in the EU there is not a
problem with infrastructure. Although
stakeholders in Hungary reported that
roads are not good for transport of
feedstock in the suggested region for a
biorefinery plant. As a mitigation
measure alternative routes, site or
storage sites.
.
Water (availability and
quality) for the local
population
D N . For the case studies selected in the EU
this is not considered to be a problem.

106
9 Job creation and wages Labour involved on
feedstock production
D + & - L H It can be a risk for the producers
(farms and forestry) to sign contracts
for long periods A third party could be
involved to guarantee the investment
Labour involved in
production
D + L Although some jobs may be created , the
number will be limited as the biorefinery
does not require large number of
employees..
Wages paid according to
national/regional regulation
(minimum wage)
D N L .. This is not highly relevant in the EU
Rural development D + H . This could be a better option in
abandoned land reported in the EU. In
general it is seem as important by
stakeholders in the three case studies
selected.
10 Gender equity Inclusion of women D
11 Labour conditions ILO conventions including
- Child labour
- Right to organise
- Indigenous rights
- Forced labour
D + & - L H ILO conventions have been signed
therefore are incorporated within the
National Laws.
12 Health and safety Compliance with health and safety regulations at the different supply chains
D L M Low negative impacts are considered
as few reports exist about this mainly
in rural areas. In the industry sector
this is regulated.
There are regulations in place in the EU..
13 Competition with other sectors Competition of residues use for biorefinery and impact on other industries and sectors that affects negatively
D + & - M M This could have a medium negative
impact in some regions where
competition with the raw material is
foreseen or already exist. This was
mentioned by stakeholders in the three
case studies. Link with the local
government and the incentives is
necessary to address to minimise
completion among sectors.
Type of impact: D direct; B background; Impact + positive; - negative; N neutral
Risk/Benefits: L low; M, Medium; H high; VH very high

107
Table 20: Social sustainability assessment for the case study of India (Diaz-Chavez, 2013). NO Parameter Characteristics/Criteria Type Impact Risk Benefit Mitigation Other
1 Production of feedstock Incentives B + M There are not clear incentives in place
that show current benefits for
investment in biorefineries activities.
Barriers B - L Local issues related to the
collection of the residues
2 Identification of
Stakeholders along the
supply chain
Producers (farmers)
Regulators
Business
Traders
Research
B + H Identification at local level of
stakeholders might help to further
develop the market and the industry
at local level.
3 Policies and regulations National
B + M A Policy framework is in place.
Application and enforcement seem to
have some issues on transparency.
Enforcement B - H Potential high risk of overall legal
fragility system.
International conventions
and agreements
B H Law enforcement Mainly ILO conventions and
indicators related to Human rights are
a high risk in I (e.g. gender,
indigenous population). There is not
much data at the local level and per
sector.
5 Land use tenure Land ownership rights D - M Transparency on land deals. Land deals are not an issue for the
biorefinery project as it focuses mainly
on residues. It would only apply to
the land where the facility will be
installed.
6 Community participation Community participation B + & - H Law enforcement and plans to
integrate indigenous population
At local level does not seem to be a
problem area (see AHP).
Nevertheless, at national level there
are other indicators that were
considered of high risk such as the
Number of indigenous population
and the no passing ILO conventions
on indigenous people.
8 Rural development and
Infrastructure
Road D + L M This indicator was not fully analysed
although the AHP reviewed the
transport of the feedstock and it does

108
not seem to be a problem at local
level. Further imformation on
transport was assessed in WP1
Water (availability and
quality) for the local
population
D - M . Total drinking water has been
assessed as medium rank and
therefore any activity at local level
needs to consider this indicator.
Sanitation infrastructure D - VH Planning new facilities including
adequate sanitation measures and
contribute to improvement at local
level.
Sanitation infrastructure was assessed
as very high risk at National level and
also within the sectors. This needs to
be considered if setting a facility at
local level.
Risk of not having bed at
hospital
D - H This indicator was assessed and
ranked as high at national level.
Further review will be needed to
assess it at the local level for any
future investment.
9 Job creation and wages Labour involved on
feedstock gathering
D + & - H A third party could be involved to
guarantee the investment
In general it is expected that job
creation will be involved at different
stages of the supply chain. A program
to gain skills would need to be in
place to benefit the farmers.
Labour involved in oil
production
D
+ L Although some jobs may be created ,
the number will be limited as an oil
mill does not require large number of
employees. Skills may be transferred
to improve the local conditions.
Wages paid according to
national/regional
regulation (minimum
wage)
D + L M For those jobs created the National
Laws on minimum wages will need to
be applied. The HSDB assessment did
not consider this a problem as was
ranked as Low. There might be
differences per sectors involved in the
biorefinery activities.
Poverty reduction D N Not enough data is available to
properly assess poverty reduction
possibilities in the region.
10 Gender equity Inclusion of women D H M Inclusion of women in the
decision-making process at local
At National level gender equity is a
high risk and should be considered

109
level and in business models. for the decision-making process at
local level.
11 Labour conditions ILO conventions including
- Child labour
- Right to organise
- Indigenous rights
- Forced labour
B + & - H H Main ILO conventions have been
signed but there is little
information on the enforcement.
ILO conventions have been signed
therefore are incorporated within the
National Laws.
12 Health and safety Compliance with health
and safety regulations at
the different supply chains
D The overall risk of the legal system
fragility needs to be considered to
enforce the regulations related to
health and safety
13 Competition with other
sectors
Competition of residues
use for biorefinery and
impact on other industries
and sectors that affects
negatively
D + M Some competition was reported in the
AHD for the use of residues of wheat
but not for the rice residues. Therefore
there are opportunities .
Source: Author’s own analysis
Type of impact: D direct; B background
Impact + positive; - negative; N neutral
Risk/Benefits: L low; M, Medium; H high; VH very high

110
4.5 Discussion of results, conclusions and outlook
4.5.1 Legal and policy assessment
At the EU level different Institutions are involved according to the different Policies and
regulations show in previous sections (see Figure 5.1). These include Directorate Generals
(DG) on: Energy, Agriculture, Environment, Regional Development, Industry, Research,
Trade, Transport (EU, 2005).
At National level other stakeholders are involved including the private sector, the
government, academic institutions, social organisations (NGOs) and the general public.
These may also vary at the National, Regional and Local level.
In the EU there is a considerable number of policy and regulatory instruments in place, at EU
and National level related to the activities of biorefineries. Although the Rnewable Energy
Directive does not consider social criteria int e same regulkatory form as environmental
criteria, it is still suggested to consider other aspects beyond job creation, e.g. rural
development, health and safety, gender issues. As per environmental aspects the suggested
“RED2” on solid biomass should be regulated at EU level as there is not a sustainability
framework for lignocellulosic feedstock.
A review of voluntary standards, especially for the forestry sector is in place in the EU.
Nevertheless, further standards related to the final bio-based products should be considered.
For instance, the C content. A new EU satnadrd is under development. The CEN TC411 for
lignocellulosic feedstock.
Stakeholders reported a need to create a policy safe environment to support investment.
Some policy changes are viewed as a problem by some stakeholders.
4.5.2 Social sustainability assessment
Social sustainability assessment is one of the four pillars in the sustainability framework
applied in this project (see Diaz-Chavez, 2006 and methodology section). Social sustainability
assessment is generally overseen in supply chain analysis due to the nature of the data
required.
The methodology applied for the social sustainability (Diaz-Chavez, 2012a; 2012b) is an
innovative combined methodology using the social Life Cycle Assessment tool hotspot
database and social impact assessment. The combination of the methodologies allows for
better assessment that covers both the national and local level. Despite that, the HSDB
considers that the weighting of indicators is done at a national level. It should be noted that
the HSDB has been improved and a new portal is on use that is different to the original
portal that was used for this assessment. Therefore, an update will be required. Additionally,
a combination of qualitative and quantitative data enabled a more robust assessment
111
4.5.2.1 Multi-Criteria Analysis (Case of India)
From the Analytical Hierarchy Process, it may be concluded that according to all
stakeholders, ’production and availability of feedstock’ provides the most support for a
biorefinery to be set up. This means that there will be enough production and availability of
feedstock, the willingness to shift cropping patterns and no interference from the village
council on cropping patterns for a biorefinery to be set up. ‘Employment’ is another
supportive indicator for the sustainability of a biorefinery. This shows that there would be
enough employment generated (in terms of willingness to work as well as openness to
working in non-agricultural activities) if a biorefinery is set up along with low levels of child
labour, etc. On the other hand, ‘research and development’ may cause barriers for a
biorefinery to be set up, i.e. not much investment has been made in the research and
development area in clean/bioenergy. ‘Rural development’ is another sustainability indicator
of concern which may hinder a possible biorefinery setup, i.e. there has not been much
improvement in rural development in the area even with the current levels of
industrialization.
For a biorefinery to be set up, although there may be enough production and availability of
feedstock and employment would be generated for the biorefinery setup, research and rural
development are causes of concern. A biorefinery may need to invest in these two aspects for
it to be sustainable. Alternatively, research and rural development could be a spillover of a
biorefinery setup. With improved technologies and increasing employment, a biorefinery
setup may be able to contribute to an improved research and development and the overall
growth and development of the area.
4.5.2.2 Social sustainability assessment using SIA and sLCA
Social sustainability assesssment is one of the four pillars in the sustainability framework
applied in this project (see Diaz-Chavez, 2006 and the methodology section 4.1.1.1). Social
sustainability assessment is generally overseen in supply chain analysis due to the nature of
data required. The methodology applied for the social sustainability (Diaz-Chavez, 2012a;
2012b) is an innovative combined methodology using the social Life Cycle Assessment tool,
hotspot database and social impact assssment. The combination of the methodologies allows
for better assessment that covers the national and the local level. Despite that the HSDB
considers sectors (see Annex V) the weighting of indicators is done at a national level. It
should be noted that when the HSDB has been improved after the finalisation of this
assessment. Therefore, a future update of the sectors assessment is recommended.
Additionally, a combination of qualitative and quantitative data enabled a more robust
assessment.
In general terms, the social sustainability assessment seems to be positive for the case studies
and it is possible to mitigate or prevent some of the potential negative impacts. The local
conditions are those that need to be better considered for the establishment of a biorefinery.
The BIOCORE assessment offered a review of the overall benefits regarding job creation and
rural development as the potential positive social aspects that a biorefinery can bring.
Although the number of jobs was suggested by stakeholders in a range of 50 – 500
(depending on the area) rural development is foressen as a major positive impact in the EU
112
expanding some services just as transport and storage of the feedstock as well as the pre-
treatment. Some of the main issues to consider on the negative side are the possible
competition with other sectors and the willigness to sell the feedstock to a biorefinery. These
issues will need to be further considered in a case-specfic assessment if a biorefinery should
be implemented.
As final recommendations, the following are suggested:
For the establishment of a biorefinery, a proper feasibility study along with social and
environmental impact assessment will be required, one that takes into account the
whole supply chain.
Local considerations need to be addressed, and for this reason, the mapping of
stakeholders is essential, alongside canvassing their opinion through focus groups or
interviews
The links between the different stakeholders should be considered to maximise
benefits and minimise barriers such as competition.
As the investment required is estimated to be significant, it is advisable to consider
the application of the Equator Principles23 mainly for the biorefinery to comply with
international sustainability standards.
Further research needs to be conducted at local level on social aspects (e.g. land
abandonement and rural development initiatives) as well as the application and need
of standards for future biobased products new to the market.
A need of social research on health and safety issues on a biobased industry is
deemed essential.
23
http://equator-principles.com/

113
5 References
Benjelloun, B. 2011: Price information, Personal communication, October 2011.
Benjelloun, B. and Detournier, E. 2013: Personal communication on the economics of the
CIMV process, Dezember 2013.
Benoit, C., Norris, G., Aulisio, D., Rogers, S., Reed, J. and Overaker, S. 2010: The hotspot
Database. Risk and Opportunity Table Development. A project of New Earth. pp 70.
Benoit-Norris, C., Aulisio Cavan, D., and Norris, G. 2012: Identifying Social Impacts in
Product Supply Chains: Overview and Application of the Social Hotspot Database.
Sustainability 2012, 4, 1946-1965; doi:10.3390/su4091946 BIOBENCH 2013:
Benchmarking biomass sustainability criteria for energy purposes. Study carried out
under the authority of the European Commission, Directorate-General for Energy.
2011/TEM/R/051.
BIOBENCH, 2013: Benchmarking biomass sustainability criteria for energy purposes. Study
carried out under the authority of the European Commission, Directorate-General for
Energy. 2011/TEM/R/051.
COM 2010: Report from the Commission to the Council and the European Parliament on
sustainability requirements for the use of solid and gaseous biomass sources in
electricity, heating and cooling. COM(2010)11, February 2010
COM 2012: Proposal for a Directive of the European parliament and of the council amending
directive 98/70/EC relating to the quality of petrol and diesel fuels and amending
directive 2009/28/EC on the promotion of the use of energy from renewable. Accessed
December 2012. Sources:
http://ec.europa.eu/energy/renewables/biofuels/doc/biofuels/com_2012_0595_en.pdf
Dale, B. E. and Ong, R. G. 2012: Energy, Wealth, and Human Development: Why and How
Biomass Pretreatment Research Must Improve, in: American Institue of Chemical
Engineers, published online July 16, 2012.
DeFusco, R. A., McLeavey, D. W., Pinto, J. E. and Runkle, D. E. 2001: Quantitative Investment
Analysis, John Wiley & Sons, UK.
Diaz-Chavez, R. 2006: Measuring Sustainability in Peri-Urban areas: Case Study of Mexico
City. In: Simon, D and Thompson D (eds). The Peri-Urban Interface. Approaches to
Sustainable Natural and Human Resource Use. Earthscan. London. Pages 246-261.
Diaz-Chavez, R. 2009: Updated Sustainability Assessment: A comparison of BEST sites 2007-
2008. FP7 Project EU.Bioethanol for Sustainable Transport. Deliverable 9.23. URL:
http://www.best-europe.org/.
Diaz-Chavez R, Mutimba S, Watson H, Rodriguez-Sanchez S and Nguer M. 2010: Mapping
food and bioenergy in Africa: A report prepared for FARA. Accra, Ghana. 60 pp.
ISBN 978-9988-1-1060-x. Web site: www.fara-africa.org

114
Diaz-Chavez, R 2012a: Methodology for social sustainability assessment in biorefineries.
BIOCORE internal report.
Diaz-Chavez, R. 2102b: Socio-Economic Assessment of Biorefinery projects. A
methodological review. 20th EU Biomass Conference. Milan 18 - 22 June 2012.
EC 2009: Directive 2009/28/EC of the European Parliament and of the Council of 23 April
2009 on the promotion of the use of energy from renewable sources and amending
and subsequently repealing Directives 2001/77/EC and 2003/30/EC. - Official Journal
of the European Union; L 140/16 - L 140/62
EEA (European Environment Agency) 2003: Indicator Fact Sheet: Water Prices,
http://www.eea.europa.eu/data-and-maps/indicators/water-prices/water-prices.
EU 2005: EU Biomass Action Plan. Minutes of the meeting.
http://www.docstoc.com/docs/961468/Minutes-of-the-Meeting---PDF. Accessed
January 2013.
Eurostat 2013: Prodcom – Statistics on the production of manufactured goods,
http://epp.eurostat.ec.europa.eu/portal/page/portal/prodcom/data/database.
Fertilizerworks 2013: Fertilizer Reports: SE Asia Ammonium Sulphate,
www.fertilizerworks.com.
Hong, Y., Nizami, A.-S., Bafrani, M. P. and Saville, B. A. 2013: Impact of cellulose production
on environmental and financial metrics for lignocellulosic ethanol, in: Biofuels,
Bioproducts & Biorefining 7: 303-313 (2013).
HSDB 2012: Social Hotspots Data base. http://socialhotspot.org/content/social-hotspots-
database-map. Accessed December 2012.
Humbird, D., Davis, R., Tao, L., Kinchin, C., Hsu, D. and Aden, A. 2011: Process Design and
Economics for Biochemical Conversion of Lignocellulosic Biomass to Ethanol.
Technical report (2011), www.nrel.gov/biomass/pdfs/47764.pdf.
ICIS 2013: ICIS Price History, http://www.icispricing.com.
IFEU 2013: Background information on data compilation for BIOCORE scenarios.
IFEU 2013a: BIOCORE system description.
ISO (International Sugar Organisation) 2012: Quarterly Market Outlook, November 2012.
Jung, A., Dörrenberg, P., Rauch, A. and Thöne, M. 2010: Government support for ethanol
and biodiesel in the European Union – 2010 update, For the Global Subsidies
Initiative (GSI) of the International Institute for Sustainable Development (IISD)
Geneva, Switzerland.
Kokossis, A., Nikolakopoulos, T., Piotrowski, S. and Carus, M. 2011: Deliverable D5.3:
Concept-based biorefinery model – first draft.

115
Larsson, E., Max-Hansen, M., Palsson, A. and Studeny, R. 2008: A feasibility stude on
conversion of an ethanol to a butanol plant, KET050 Feasibility Studies on Industrial
Plants, Dept of Chemical Engineering, Lund Institute of Technology, Sweden.
Peters, M.S. and Timmerhaus, K.D. 1991: Plant Design and Economics for Chemical
Engineers, McGraw-Hill, New York, USA.
Piotrowski et al. 2012: Deliverable 7.1: Interim assessment of the economic,
social/legal/political sustainability of the BIOCORE biorefining system.
Sinnott, R.-K. 1999: Coulson & Richardson’s Chemical Engineering, Vol. 6: Chemical
Engineering Design, Third Edition, Butterworth Heinemann, Oxford, UK.
Towler, G. and Sinnott, R. 2013: Chemical Engineering Design: Principles, Practive and
Economics of Plant and Process Design, Second Edition, Elsevier, Oxford, UK.
Vernhes, T. 2012: Socio-economic impacts of lignocellulosic biorefineries. The case of a wheat
straw biorefinery in the Beauce region, France. MSc Thesis Centre for Environmental
Policy, Imperial College London. UK.
Weastra 2012: Determination of market potential for selected platform chemicals: itaconic
acid, succinic acid, 2,5-Furandicarboxylic acid, Report of WP 8.1 of the FP7-project
Bioconsept, http://www.bioconsept.eu.