deliverable no 1.3 [report on the ... - feem-project.net · the study by van der zwaan et al....
TRANSCRIPT

Project No 282846
LIMITS Low climate IMpact scenarios and the Implications
of required Tight emission control Strategies FP7-Cooperation-ENV Collaborative project Small or medium-scale focused research project
DELIVERABLE No 1.3 [Report on the feasibility and costs of the 2°C target as a
function of technology and policy]
Due date of deliverable: July 31, 2014 Actual submission date: July 31,2014
Start date of project: 01/10/2011
Duration: 36 months
Organisation name of lead contractor for this deliverable: PIK
Revision: 0
Project co-funded by the European Commission within the Seventh Framework Programme
Dissemination level
PU Public X PP Restricted to other programme participants (including the Commission Services) RE Restricted to a group specified by the consortium (including the Commission Services) CO Confidential, only for members of the consortium (including the Commission Services)

LIMITS – LOW CLIMATE IMPACT SCENARIOS AND THE IMPLICATION OF REQUIRED TIGHT
EMISSION CONTROL STRATEGIES
PROJECT NO 282846
1
Report on the feasibility and costs of the 2°C target as a function of technology and policy
This project has received funding from the European Union’s Seventh Programme for research,
technological development and demonstration under grant agreement No. 282846 (LIMITS).
Participants to the redaction of this report: Elmar Kriegler (PIK), Massimo Tavoni (FEEM), Nils Petermann
(PIK)
Table of Contents
1. Introduction and Overview .....................................................................................................................2
2. Technology’s relevance for the achievability and costs of reaching the 2°C target ...........................3
3. Post-2020 climate agreements in the major economies assessed in the light of global models .......6
Abstract...................................................................................................................................................6
Motivation and objectives ......................................................................................................................6
Emission reductions: when, where, and how? .....................................................................................8
Economic and financial implications. ................................................................................................. 13
Conclusions: modeling input to the Durban negotiation process...................................................... 16
References. ......................................................................................................................................... 18
Acknowledgement ............................................................................................................................... 22
Supplementary information. ................................................................................................................ 23

LIMITS – LOW CLIMATE IMPACT SCENARIOS AND THE IMPLICATION OF REQUIRED TIGHT
EMISSION CONTROL STRATEGIES
PROJECT NO 282846
2
1. Introduction and Overview
Meeting the internationally-agreed 2°C target and achieving the necessary international cooperation is
both a technological and a political challenge. Rigorous analysis of the implications of implementing the
2°C target can uncover the subtleties of this challenge and provide useful insights for analysts of
technology development efforts, policy design, and international negotiation processes. The EU-funded
LIMITS project has performed a range of studies contributing to such analysis.
As part of LIMITS Work Package 1 (WP1), which assesses global mitigation pathways for limiting the
global temperature increase below 2°C, this report presents findings on the role of technology and
policy and on regional mitigation requirements. This report investigates the role of technology,
investment needs, and regional economic costs associated with 2°C mitigation pathways and expands
on the findings in the previous WP1 reports: D1.1 “Report on the range of mitigation requirements for
the major economies that are compatible with a global 2°C target under varying assumptions” and D1.2
“Report on the assessment of compensation mechanisms and burden sharing regimes for achieving the
2°C target”.
Report D1.1 already included findings on the role and diffusion of key technologies for 2°C mitigation
pathways. In Section 2 of this report, we add key insights from the Stanford Energy Modeling Forum 27
(EMF27) study, which was utilized by LIMITS partners to explore the role of individual mitigation options
for the achievability and the implementation of the 2°C target. LIMITS has coordinated its technology
work with EMF27 to exploit available synergies, and LIMITS partners have contributed extensively to
the overview and model comparison analysis as documented in the associated publications.
Section 3 of this report summarises the findings of WP1 on the role of policy frameworks for the
implementation of the 2°C target, with a focus on the major economies. This synthesis draws on the
results of the LIMITS integrated assessment model comparison study on Durban Platform Scenarios as
published in Climate Change Economics. Individual results from the study were presented in
Deliverables D.1.1 and D.1.2. The synthesis article by Tavoni et al. expands on this work by
investigating regional carbon budgets, emissions peaking, mitigation effort and costs, investment
requirements and implications of two burden sharing regimes. They show that achieving 2°C at a
minimum global cost would require emissions to peak by this or next decade at the latest in all major
economies and highlight the uneven distribution of regional mitigation costs in the absence of transfers.
On the other hand, burden sharing combined with a large carbon trading market could reduce cost
differences and finance the investments gap in green energy. Based on the analysis of these issues,
Tavoni et al. suggest that policy approaches are promising which seek to align national interests with
climate cooperation. These could include:
a) Linkages and extensions of carbon markets
b) Climate finance to fill the investment gap
c) Issue linkage with national policy priorities
This report concludes the deliverables under LIMITS work package 1 (WP1). With its focus on
technology, policy and regional distribution challenges for the achievability of the 2°C target, WP1 has
generated results with direct relevance to the international climate policy coordination process.

LIMITS – LOW CLIMATE IMPACT SCENARIOS AND THE IMPLICATION OF REQUIRED TIGHT
EMISSION CONTROL STRATEGIES
PROJECT NO 282846
3
2. Technology’s relevance for the achievability and costs of
reaching the 2°C target
The implications of the availability of key mitigation technologies have been explored by the Stanford
Energy Modeling Forum’s EMF27 project. The LIMITS team contributed to the design and analysis of
the scenarios assessed in EMF27 with the goal to examine specific technology requirements of
implementing the 2°C target. Due to the coordination between LIMITS and EMF27, the latter performed
technology sensitivity analyses of a 450 ppm CO2e climate target that is consistent with the more
stringent 2°C target among the LIMITS scenarios. As a result of the contribution by LIMTS partners to
EMF27, six of the papers in the EMF27 special issue of the journal Climatic Change acknowledge
support from LIMITS and provide insights on the role of energy technologies and energy resources in
2°C scenarios that are compatible with the LIMITS context. These papers are (LIMITS authors
indicated in bold font):
Kriegler, Weyant et al. (2014) The role of technology for achieving climate policy objectives: overview of the EMF 27 study on global technology and climate policy strategies, Climatic Change 123(3-4) 353-367, DOI: 10.1007/s10584-013-0953-7.
Krey, Luderer et al. (2014) Getting from here to there: energy technology transformation pathways in the EMF27 scenarios, Climatic Change 123(3-4) 369-382, DOI: 10.1007/s10584-013-0947-5.
Blanford, Kriegler, Tavoni (2014) Harmonization vs. Fragmentation: Overview of climate policy scenarios in EMF27, Climatic Change 123(3-4) 383-396, DOI: 10.1007/s10584-013-0951-9.
McCollum, Bauer et al. (2014) Fossil resource and energy security dynamics in conventional and carbon-constrained world, Climatic Change 123(3-4) 413-426, DOI: 10.1007/s10584-013-0939-5
Luderer, Krey et al. (2014) The role of renewable energy in climate mitigation: results from the EMF 27 scenarios, Climatic Change 123(3-4) 427-441, DOI: 10.1007/s10584-013-0924-z.
Rose, Kriegler et al. (2014) Bioenergy in energy transformation and climate management. Climatic Change, Climatic Change 123(3-4) 477-493, DOI: 10.1007/s10584-013-0965-3.
Kriegler, Weyant et al. provide an overview of the impact of key technology on the feasibility and costs
of climate targets, including meeting the 2°C target with high likelihood (limiting atmospheric
greenhouse gas concentration to 450 ppm CO2e by 2100). They find that this would require a complete
decarbonization of the global energy system within the 21st century. Robust characteristics of the
energy transformation for meeting the 2°C target are:
Increased energy intensity improvements: In 450 ppm CO2e scenarios, energy intensity
improvements are accelerated to 1.3–2.9% (model median: 2.3%) per year compared to the
1970–2010 global rate of 1.3 % per year.
Decarbonization of the electricity sector and electrification of energy end use: Model
runs of 450 ppm CO2e scenarios generally show that decarbonization is achieved most swiftly
for electricity generation, a sector for which many non- or low-emissions technologies are
available, and then substitution of electric power and end-use efficiency for fossil fuel use in
end-use sectors. Since non-electric energy end use is hardest to decarbonize, particularly in
the transport sector, electrification of end use is an important element of decarbonization,
LIMITS – LOW CLIMATE IMPACT SCENARIOS AND THE IMPLICATION OF REQUIRED TIGHT
EMISSION CONTROL STRATEGIES
PROJECT NO 282846
4
although substantial residual use of solid fuels in industry and liquid fuels in transportation
remains in most models, calling for compensation from negative emission technologies.
Negative emissions technology: The availability of a negative emissions technology,
represented in the models by the combination of carbon capture and storage and bioenergy
(BECCS) seems to be a key element for meeting the climate targets due to the ability to
compensate fossil fuel emissions across sectors and time.
The cost of the energy transformation needed for achieving the 2°C target is sensitive to variations in
technology availability. A cost-optimal 2°C scenario would see substantial contributions from all of the
above-mentioned factors (energy intensity improvements, decarbonized electricity and electrification,
negative emissions technology). Within the electricity sector, the importance of individual low-carbon
technologies (such as nuclear or wind power) is relatively limited due to the many alternatives in that
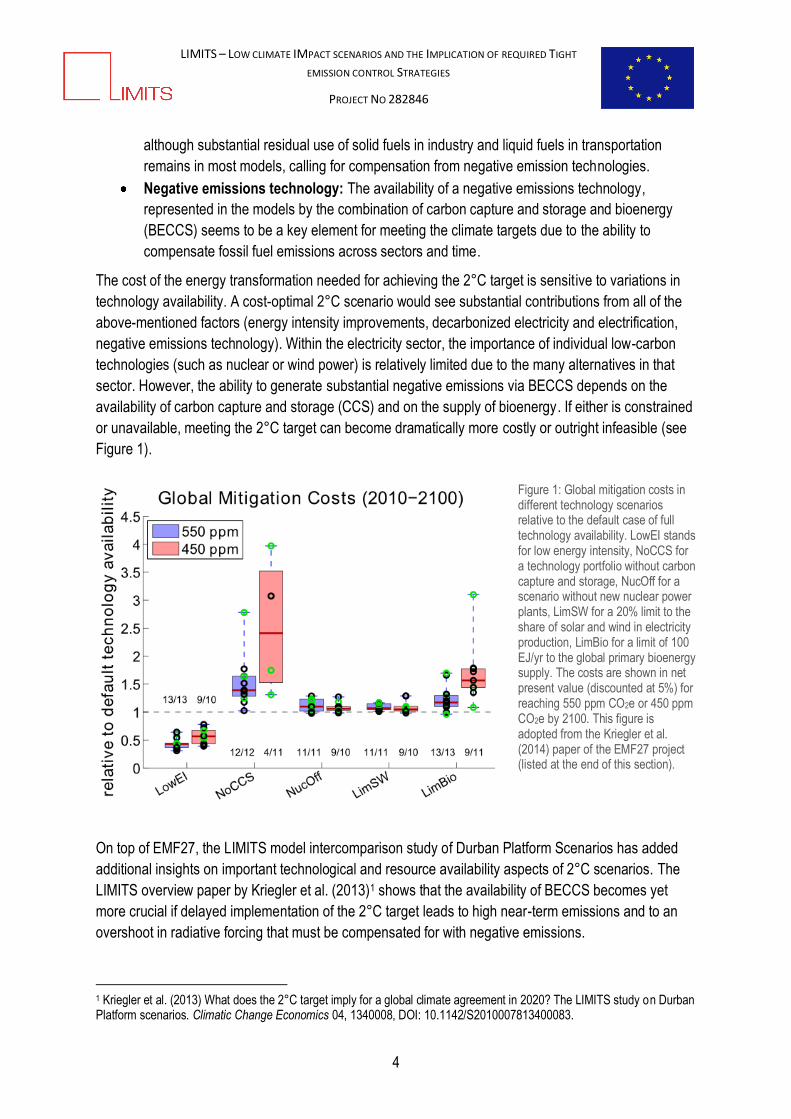
sector. However, the ability to generate substantial negative emissions via BECCS depends on the
availability of carbon capture and storage (CCS) and on the supply of bioenergy. If either is constrained
or unavailable, meeting the 2°C target can become dramatically more costly or outright infeasible (see
Figure 1).
Figure 1: Global mitigation costs in different technology scenarios relative to the default case of full technology availability. LowEI stands for low energy intensity, NoCCS for a technology portfolio without carbon capture and storage, NucOff for a scenario without new nuclear power plants, LimSW for a 20% limit to the share of solar and wind in electricity production, LimBio for a limit of 100 EJ/yr to the global primary bioenergy supply. The costs are shown in net present value (discounted at 5%) for reaching 550 ppm CO2e or 450 ppm CO2e by 2100. This figure is adopted from the Kriegler et al. (2014) paper of the EMF27 project (listed at the end of this section).
On top of EMF27, the LIMITS model intercomparison study of Durban Platform Scenarios has added
additional insights on important technological and resource availability aspects of 2°C scenarios. The
LIMITS overview paper by Kriegler et al. (2013)1 shows that the availability of BECCS becomes yet
more crucial if delayed implementation of the 2°C target leads to high near-term emissions and to an
overshoot in radiative forcing that must be compensated for with negative emissions.
1 Kriegler et al. (2013) What does the 2°C target imply for a global climate agreement in 2020? The LIMITS study on Durban Platform scenarios. Climatic Change Economics 04, 1340008, DOI: 10.1142/S2010007813400083.

LIMITS – LOW CLIMATE IMPACT SCENARIOS AND THE IMPLICATION OF REQUIRED TIGHT
EMISSION CONTROL STRATEGIES
PROJECT NO 282846
5
The study by van der Zwaan et al. (2013)2 assesses technology diffusion dynamics in 2°C scenarios
and confirm findings from EMF27 regarding the critical role of emissions-free electricity as well as the
importance of options for negative emissions. Van der Zwaan et al. find that power sector CO2
emissions should become deeply negative from around 2050 onwards in order to compensate for GHG
emissions in other sectors where abatement is more costly. While there may only be a limited portfolio
of technologies that can generate negative emissions, the options for decarbonizing the power sector
are otherwise varied. Zwaan et al. find that the model results strongly diverge in decarbonization
technology deployment in the electricity sector, which suggests that a range of promising options exists
and that there is considerable uncertainty about the most cost-effective abatement technology mix.
Nevertheless, a robust case for the contribution of bioenergy to 2°C mitigation scenarios is made in the
study by Calvin et al. (2013)3. This confirms the role of bioenergy in stringent mitigation scenarios found
by EMF27 (see Figure 1). Bioenergy is not only important as part of the negative emissions option
BECCS, but also as a versatile fuel that can contribute to low-carbon non-electric energy supply.
Overall, these results from the EMF27 study on the role of technologies and the LIMITS study on
Durban Platform scenarios highlight the key role of technology for the achievability the 2°C target in the
long run.
2 Van der Zwaan et al. (2013) A cross-model comparison of global long-term technology diffusion under a 2°C climate
change control target, Climatic Change Economics 04, 1340013, DOI: 10.1142/S2010007813400137. 3 Calvin et al. (2013) A multi-model analysis of the regional and sectoral roles of bioenergy in near- and long-
term CO2 emissions reduction, Climatic Change Economics 04, 1340014, DOI: 10.1142/S2010007813400149.

LIMITS – LOW CLIMATE IMPACT SCENARIOS AND THE IMPLICATION OF REQUIRED TIGHT
EMISSION CONTROL STRATEGIES
PROJECT NO 282846
6
3. Post-2020 climate agreements in the major economies
assessed in the light of global models
Massimo Tavoni1,11*, Elmar Kriegler2, Keywan Riahi4 , Detlef van Vuuren3,8, Tino Aboumahboub2, Alex
Bowen6, Katherine Calvin7, Emanuele Campiglio6, Tom Kober5, Jessica Jewell4, Gunnar Luderer2,
Giacomo Marangoni1,11, David McCollum4, Mariesse van Sluisveld3, Anne Zimmer2 and Bob van der
Zwaan5,9,10
1. Fondazione Eni Enrico Mattei (FEEM) and Centro Mediterraneo sui Cambiamenti Climatici (CMCC), Corso Magenta
63, Milan, Italy
2. Potsdam Institute for Climate Impact Research (PIK), P.O. Box 60 12 03, 14412 Potsdam, Germany
3. Utrecht University (UU), Utrecht, The Netherlands
4. International Institute for Applied Systems Analysis (IIASA), Schlossplatz 1, 2361 Laxenburg, Austria
5. Energy research Centre of the Netherlands (ECN), Radarweg 60, 1043 NT, Amsterdam, The Netherlands
6. Grantham Research Institute – London School of Economics (LSE), London, UK
7. Pacific Northwest National Laboratory/Joint Global Change Research Institute (PNNL/JGCRI), College Park, MD
20740, USA
8. Netherlands Environmental Assessment Agency (PBL) 3720 AH Bilthoven, The Netherlands
9. University of Amsterdam, Faculty of Science, Amsterdam, The Netherlands
10. Johns Hopkins University, School of Advanced International Studies, Bologna, Italy
11. Politecnico di Milano, Milano, Italy
*. Corresponding author: [email protected]
Abstract
This article assesses the implications of post-2020 international climate policy architectures for the
major economies. We assess scenario results from a recent model inter-comparison project (MIP)
involving several land-energy-economy-climate models, and put it into the context of the existing
modeling literature. We show that achieving 2°C at a minimum global cost would require emissions to
peak by this or next decade at the latest in all major economies, and to manage regional carbon
budgets of few hundreds GtCO2. We highlight the uneven distribution of regional mitigation costs in the
absence of transfers, and show that a large carbon trading market to be established by 2030 could
reduce cost differences and finance the investments gap in green energy. We conclude with
recommendations for climate policy design.
Motivation and objectives
So far, international climate policy has been largely ineffective in curbing the rise of global greenhouse-
gas emissions. Still, ambitious climate targets such as the internationally agreed upon 2°C target
require a phase-out of global emissions by the end of the century, and an active participation of all
world regions in climate policy1. Given the many obstacles to global cooperative action on climate
change, the question remains how diverse national climate policies can be coordinated and
strengthened globally. Within the United Nations Framework Convention on Climate Change
(UNFCCC), the Durban Platform for Enhanced Action2 seems to provide the most important opportunity
for a post-2020 international climate agreement, which is needed urgently if the 2°C ceiling is not to be
breached. It contains several innovative elements, most notably a focus on the major economies that

LIMITS – LOW CLIMATE IMPACT SCENARIOS AND THE IMPLICATION OF REQUIRED TIGHT
EMISSION CONTROL STRATEGIES
PROJECT NO 282846
7
goes beyond the traditional divide between Annex I and non-Annex I countries. The Durban platform
calls for a new climate treaty to be agreed in 2015 and implemented as early as 2020. Despite
encouraging signs such as the recent commitment of the US administration to put a cap on emissions,
aligning the incentives of the major economies in pursuing climate policies remains a challenge - as
demonstrated in the recent UNFCCC Conference of the Parties (COP-19) in Warsaw. In this paper, we
aim at assessing the implications of post 2020 climate policies with specific reference to the major
economies. We provide quantitative estimates of regional emission budgets, timing of emission
peaking, and distribution of mitigation costs. We examine the role of carbon markets and different
burden sharing schemes to alleviate distributional inequalities and finance the investment needs in low
carbon mitigation technologies. In order to quantify these policy relevant variables, we avail of the use
of global models.
Integrated assessment models (IAMs) are tools designed to investigate the implications of achieving
climate and other objectives in an integrated and rigorous framework. They are numerical models that
account for major interactions among energy, land-use, economic and climate systems. Their results
are driven by maximization of a welfare function or minimization of energy costs – through either
optimization or simulation process. Models generate global long-term scenarios for a number of regions
or countries that can be used to inform climate and energy policies and to translate long-term climate
objectives into potential medium-term courses of actions4–10. Scenarios from IAMs provide important
input to scientific reviews such as the assessment reports of the Intergovernmental Panel on Climate
Change (IPCC) and the United Nations Environment Programme (UNEP) Emissions Gap Report. Given
the focus of this review on climate mitigation policies, the models reviewed are employed to assess the
implications of cost-effective policies to achieve a given climate goal (like in the IPCC), rather than to
determine the appropriate ambition of such a goal in a cost-benefit setting. In other words, the potential
damages from climate change costs are not considered explicitly here, putting our analysis outside the
controversial discussion regarding climate impacts.
In order to generate conclusions that are robust to different models’ specifications, IAM teams have
engaged in model inter-comparison projects (MIPs), in which a variety of models implement a common
study protocol. Though cross-model comparison literature has developed fast, it has so far mostly
reported on global issues7,11,12,45. Information from an MIP regarding the regional impacts of post 2020
climate policies is limited. This review aims at synthetizing insights from the most comprehensive MIP
on this subject, the LIMITS project13,14,98. Though other MIPs have explored the role of fragmented
regional mitigation effort and staged accession to climate cooperation (EMF2233, AMPERE34, EMF271),
globally delayed participation (RECIPE35, ROSE36, AMPERE12), and burden-sharing schemes
(RECIPE37), none except of LIMITS has focused on potential outcomes of the Durban platform
negotiations, i.e. a period of fragmented moderate climate policy followed by global cooperative action
towards a 2C climate target after 2020 under different assumptions about burden sharing regimes. In
addition, in LIMITS results are reported at a high regional resolution (for 10 regional aggregates which
best match the native model regions), short term climate and energy policies are well detailed, the
likelihood of achieving 2°C is relatively harmonized (using the MAGICC climate model) and a new
burden sharing scheme is introduced and evaluated. Though we will use LIMITS as guiding example

LIMITS – LOW CLIMATE IMPACT SCENARIOS AND THE IMPLICATION OF REQUIRED TIGHT
EMISSION CONTROL STRATEGIES
PROJECT NO 282846
8
throughout the paper, the insights are framed by and compared with all the relevant literature on climate
policy modeling3,15–20.
Box 1. International climate policy through the lens of IAMs
International climate policy involves complicated negotiations among different parties over a wide range
of activities. As international climate agreements are voluntary, they need to be self-enforcing. The
formation of such deals can be studied by model-based analysis of the incentives for joining or leaving
these agreements. This has led to a specific strand of literature based on game theory and strategic
interaction21–26, which includes IAM applications27–3132. More often, though, the formation mechanism of
the policy agreement is taken as given. Models explore the implications of regional or global, comparing
them, for instance, with a counterfactual world in which such policies are absent.
The LIMITS MIP can be used to illustrate how this is done in practice. A set of scenarios are
implemented in the six participating models (GCAM,IMAGE,MESSAGE,REMIND,TIAM-ECN,WITCH).
These include 1) the extent and date of implementation of climate and energy policies, 2) the stringency
of the regional emission pledges, 3) the long-term climate objective, and 4) the way the climate policy
burden is shared across regions (see the Table S2 for the scenario description). First of all, a
counterfactual scenario with no climate policies is built (‘No Policies’). Second, the study analysed a
reference case representing the current situation of regionally fragmented mitigation efforts, based on
extrapolation of the weak Copenhagen pledges throughout the whole century (‘Weak Pledges’, see
Table S3 for their exact definition). In addition, a successful outcome of the Durban Platform
negotiations was modeled by global cooperation after 2020 on either a long-term CO2 concentration
objective of 450 ppm-eq or 500 ppm-eq. These levels correspond to either a likely (>66%) or as-likely-
as-not (>50%) chance of achieving 2°C.
The stabilization scenarios are implemented in a cost effective way, with emissions reduced at the
margin where it is cheapest to do so. Different burden-sharing regimes across regions have been
considered, to allow regions to be compensated for their emission reductions. Thus, in addition to the
case of globally harmonized carbon tax (without allowing for transfers between regions, e.g., via the
trade of emission permits), we considered the assignment of emissions permits based on either
convergence to equal per capita emissions or equalization of regional mitigation costs as a share of
output.
Emission reductions: when, where, and how?
One of the most valuable uses of integrated assessment models is in the translation of mitigation
policies into climate outcomes, and conversely the translation of global climate objectives into regional
commitments and timing of emission reductions. This allows the ‘when’ and ‘where’ questions that are
key elements of climate policy considerations to be addressed.
Figure 1 provides insights on the ‘when’ question, reporting the year of peaking of greenhouse gas
emissions in 10 major economies for different policies (see Table S1 for a definition of the 10 regional
aggregates). The emission peak year is an important indicator for policy, as it signals by when
emissions should start to fall. Without explicit mitigation policies, models project emissions to increase

LIMITS – LOW CLIMATE IMPACT SCENARIOS AND THE IMPLICATION OF REQUIRED TIGHT
EMISSION CONTROL STRATEGIES
PROJECT NO 282846
9
until very late in the century in essentially all regions. This result is based on the expectation of
continued economic growth and availability of fossil fuels. Weak mitigation pledges, based on the
extrapolation of those made under the Cancun Agreement beyond 202038, would lead to differentiated
peak years that depend on the stringency of the commitment and the growth of baseline emissions,
which is driven largely by economic growth rates39. Here, industrialized economies are projected to
keep emissions below current levels, but several developing country regions would see emissions rising
until the second half of the century. A marked difference is observable when moving to climate
stabilization targets around 2°C. In order to minimize global costs, emissions would need to peak by the
end of this decade in all major regions in order to have more than a 66% chance of limiting temperature
increase to 2°C (i.e. 450 ppm-eq). Relaxing the chances of meeting 2°C to 50% (i.e. 500 ppm-eq)
would buy some time, i.e. on the order of 10-15 years for some developing countries.
Figure 1: Peak Year: timing of regional maximum emissions (Kyoto gases, median across models). “2100” denotes an increasing emissions trajectory throughout the 21st century until the end of the time horizon of the models. Model time step is typically 5 to 10 years. Full set of results by model is available in Figure S1.
A useful metric for quantifying climate change is that of cumulative emissions, or carbon budgets, which
simply are the sum of emissions over time. These have been shown to be strong, linear predictors of
global temperature increase40–42. The emission scenarios from the integrated assessment models
provide a split into regional budgets under the assumption of cost efficient implementation. Clearly,
even under this assumption there is considerable uncertainty about the cost-effective regional split of
emissions budgets as it depends on, inter alia, baseline emissions, regional mitigation potentials,
differences in the global emissions reduction rate and terms of trade effects, all of which can vary
substantially across models and regions14,33,43.
Figure 2 provides estimates about regional cumulative emission budgets, as well as the historical
contribution to emissions of the major economies. It indicates that in the No Policies scenario, unabated

LIMITS – LOW CLIMATE IMPACT SCENARIOS AND THE IMPLICATION OF REQUIRED TIGHT
EMISSION CONTROL STRATEGIES
PROJECT NO 282846
10
emissions of major economies like China or regions such as the OECD would by themselves exhaust
the entire global budget compatible with 2°C. This would remain true even if countries committed to
weak mitigation pledges, testifying to the crucial importance of a comprehensive climate agreement if
the 2°C target is to be met. A limit of 2°C would require a significant reduction of carbon budgets in al l
major economies. No major economy would receive more than few hundred GtCO2. When looking at
all GHGs (Figure S3), budgets would increase for all regions, especially under the stringent climate
scenarios, since non-CO2 gases are assumed to be harder to abate.
Figure 2. Regional carbon budgets, as cumulative CO2 emissions for the period 2010-2100. All numbers are median across models. Historical emissions are for the period 1751-2010 (source CDIAC). The shaded area show the World carbon budget range for 450 and 500 ppm-eq policies, median across models. Regional Kyoto budgets and full set of model results are available in FigureS2 and S3 respectively.
Figure 3 shows that cumulative emissions reductions relative to the No Policies scenario untill 2050 are
quite similar across the major economies (percentage numbers above the bars). Slightly larger relative
emissions reductions would be necessary for developing regions such as Latin America, India, China
and EIT. The contribution of these regions in terms of absolute GtCO2-eq emission reductions is even
larger, given the higher projected baseline emissions in developing economies and in particular in
Asia39.
IAMs can also be used to further inform about ‘how’ the regional mitigation effort might be achieved.
Figure 3 indicates that according to the LIMITS models the largest share of mitigation by sector would
take place in the energy supply sector, confirming results from bottom-up and top-down studies,13,44–47

LIMITS – LOW CLIMATE IMPACT SCENARIOS AND THE IMPLICATION OF REQUIRED TIGHT
EMISSION CONTROL STRATEGIES
PROJECT NO 282846
11
48,49. In Latin America, Rest of Asia and Africa also the land-use sector plays a major role in abatement,
due to the large potential for forest-based mitigation, especially in some models51,52. Middle East has the
largest potential on the demand side. This is consistent with the currently high energy intensity, in turn
related to relatively low energy prices. Non-CO2 gases contribute to 10-20% in terms of abatement, and
represent a significant share of residual emissions, since some emissions such as CH4 and N2O gases
from agriculture are hard to mitigate53. The overall picture is that, while energy supply has the highest
mitigation potential, regional characteristics imply different patterns of mitigation across sectors54, which
will also be influenced by the stringency of the climate target13,55.
Figure 3. Share of cumulative mitigation (2010-2050) of Kyoto gases across sectors for the 450 ppm-eq policy, median across models. The numbers above each bar indicate the regional mitigation potential measured by median cumulative (2010-2050) emission reductions (%) from the No Policies scenario. Full set of model results is available in FigureS4.
Model variation is shown in Figures S1, S4 and S5. These figures show that the full cross-model range
of estimates can reflect significant variation, especially for some factors, such as land use mitigation
potential. Though essentially all the results so far are robust to such uncertainty, model variability
should not be underestimated. A risk-management approach that explicitly reflects structural
uncertainties can provide policy-makers with robust policy recommendations56, though it has not
generally been adopted by IAM analyses so far57.
One of the most contentious topics in international climate negotiations is the distribution of the
mitigation effort. Combined with emission trading, different allocation methods can incorporate different
views of fairness while still resulting in an (almost) cost-optimal implementation, since in IAMs economic
LIMITS – LOW CLIMATE IMPACT SCENARIOS AND THE IMPLICATION OF REQUIRED TIGHT
EMISSION CONTROL STRATEGIES
PROJECT NO 282846
12
efficiency and equity are largely independent59. Despite this being a rough-and-ready approach that
does not account for issues such as transaction costs, property rights, resource curse and institutional
capacity, it nonetheless provides a convenient framework for thinking about the problem60. Many
different allocation regimes have been proposed, mostly either based on the concepts of resource
sharing (allocating the available emission space) or effort sharing (ensuring similar effort, such as equal
costs)58. Many studies have assessed the implications of different regimes for the allocation of
mitigation efforts19,58,61, finding that allocations are influenced by both the equity principle adopted and
the overall climate objective.
Figure 4 provides an example of how models project emissions allocations under different burden
sharing schemes and the 2°C target as the climate objective. The actual emissions reductions that
occur in cost-efficient scenarios assuming a globally harmonized carbon price (left) are contrasted with
emissions allowances based on two burden sharing principles which aim to equalize per capita
emissions allowances (by 2050) and regional mitigation costs respectively (these represent examples
of a resource sharing and effort sharing regime, respectively). If a region has received an allowance
above (below) its actual emissions, it can act as net seller (buyer) of emissions permits. The boundary
case, where emissions allowances exactly match domestic emissions reflects a situation where all
mitigation efforts are financed domestically, e.g. the imposition of regional emissions targets without
international allowance trading or a globally harmonized GHG tax without transfers.
Figure 4 shows that for Europe and North America actual emissions and allowances in the per capita
case would be similar and lower than the ones announced in the major economies forum meeting of
2009 (80-95% reductions). A per capita burden-sharing scheme would require a significant mitigation
effort from China and some other regions such as the Middle East (in line with previous modeling
studies14,37,62–64). The opposite would hold for India (and Africa, not shown), because of its low per
capita emissions. The equal-cost burden-sharing scheme in which all regions pay the same price in
terms of GDP reduction would require a stronger commitment from the OECD (close to 100%
reduction) and an average 50% reduction for China, while allowing India an increase (as with the equal
per capita regime). The most drastic change across the schemes would be for the Middle East: under
an equal-cost scheme, it receives a much larger emission allocation to compensate for its higher
mitigation costs, which would in part result from worse terms of trade for its fossil-fuel exports65.

LIMITS – LOW CLIMATE IMPACT SCENARIOS AND THE IMPLICATION OF REQUIRED TIGHT
EMISSION CONTROL STRATEGIES
PROJECT NO 282846
13
Figure 4. Actual emissions (left panel) and emissions allowances (center and right panels), in % reductions in 2050 from 2010 and for a 450 ppm-eq target. The two panels on the right show examples of allocation schemes with resource sharing (convergence to equal per capita rights by 2050) and effort sharing (equalization of relative mitigation costs) respectively. Full permit trading is allowed (leading to the cost-minimizing distribution of abatement activity across regions).
Economic and financial implications.
A key consideration in climate policy is how to distribute the economic effort of GHG mitigation. Even if
overall mitigation costs were low, policymakers care and argue about the regional distribution of policy
costs, since it impacts economic development, competitiveness and even political stability. The
scenarios indicate that the costs of mitigation will vary significantly across countries1,14,66–71. Figure 5
portrays this finding for the LIMITS models, showing that –in a cost effective framework with uniform
carbon pricing but without carbon trading and compensatory transfers- mitigation costs in the OECD
would be lower than global average, and the opposite would hold for developing economies, and
especially for energy exporting regions, which would face adverse terms of trade effects1,37,71–73. This
ranking is rather robust across climate targets, mitigation cost metrics and IAMs14,74, though the ranges
are considerably larger for developing economies.

LIMITS – LOW CLIMATE IMPACT SCENARIOS AND THE IMPLICATION OF REQUIRED TIGHT
EMISSION CONTROL STRATEGIES
PROJECT NO 282846
14
Figure 5. Regional over global mitigation costs for 450 ppm-eq without carbon trading and transfers. Costs are computed in net present value over the period 2010-2100, at 5% discounting.
The variation in these regional costs can be attributed to several factors, but especially to emission
intensity, mitigation potential and international trade effects14,75–77. Using data from the EMF22 model
comparison study, a higher ratio of emissions to GDP – the so called emission intensity- in the BAU has
been shown to lead to lower marginal abatement costs but to higher total costs for a common carbon
price75. Given the higher current and projected emission intensities of developing countries39, these
regions will have higher total mitigation costs.
It is not easy to devise a burden sharing scheme which can alleviate the inter-regional distributional
tensions highlighted in Figure 5. When the carbon budget is tight, as it is the case in 2°C policies, even
resource sharing schemes such as those based on per capita equalization would not compensate for
the inequality in favor of OECD countries14,78. A particular challenge lies in the uncertainty about the
relations between regional emission allocation and costs, which is much greater than the uncertainty in
global mitigation costs. This uncertainty is likely a key barrier to the implementation of an emissions
trading scheme with national caps based on a long-term burden sharing scheme. Rather, a pragmatic
approach featuring various flexible mechanisms and a regular review of emission reduction and finance
commitments seems more plausible15.
In addition to macro-economic costs, an important question for policy is how to ensure investment
flows. This relates to redirecting investments from the fossil fuel industries to sectors involved in low
carbon energy technologies and energy efficiency, and to ensure mitigation action in the different
regions worldwide. Some studies have quantified the investment gaps to achieve climate
stabilization55,79,80,81, and finding that a considerable reallocation of investment is required. As shown in

LIMITS – LOW CLIMATE IMPACT SCENARIOS AND THE IMPLICATION OF REQUIRED TIGHT
EMISSION CONTROL STRATEGIES
PROJECT NO 282846
15
Figure 6, investments in the fossil fuel extraction sector would be greatly reduced. This compensates to
a large extent for the additional investment needs in low-carbon energy (renewables, nuclear,
bioenergy). Additional investment would be needed to improve energy efficiency, the transmission and
distribution grid and the transition to low-carbon technologies in other sectors such as transport. The
LIMITS results show, for example, that investments in freely emitting fossil-power technologies remain
substantial in the weak-pledge scenarios, while they drop in the 450 ppm-eq stabilization case. In
particular, weak pledges would be insufficient to reduce investment in coal-fired power plants. But if the
world credibly embarks on a path towards 450 ppm-eq stabilization, investors would largely shun further
investment in coal plants, as shown in Figure S5.
Most of the investments would have to be made in developing countries where the largest absolute
mitigation effort would take place. According to the model calculations, the global investment gap for
transitioning from a weak pledge policy to one fully compatible with 2°C would require filling a global
investment gap of about half a trillion USD per year for the next 40 years, two thirds of which in the
developing economies. The gap would be even larger if the counterfactual scenario did not involve
emission reduction pledges. In addition, investments in clean energy R&D would also need to be
significantly scaled up, in order to prompt sufficient innovation in new technologies. Models estimate
these to be about 50-100 USD Billion/year 82–86 over the first half of this century.
Figure 6: Additional annual investment in USD billion/yr (average over the period 2010-2050; no discounting) between the 450 ppm-eq case and the weak pledge case, for different sectors and two regional groups. The last two columns (shaded) report trade of CO2 permits (positive=selling) for the two burden-sharing schemes discussed above. The vertical axis is truncated at +/- 500 USD Billions.

LIMITS – LOW CLIMATE IMPACT SCENARIOS AND THE IMPLICATION OF REQUIRED TIGHT
EMISSION CONTROL STRATEGIES
PROJECT NO 282846
16
The current level of green energy investments, estimated at roughly 250 USD billion in 2013 by
Bloomberg New Energy Finance, falls significantly short of filling this gap. How can the rest be raised?
Several opportunities exist. Removing energy subsidies would free up resources of the same order of
magnitude as the gaps87,88. Alternatively, climate policies could provide sufficient fiscal revenues within
each region to finance total investment in energy supply, while also providing incentives to the private
sector to raise finance89. Climate finance can assist developing economies in filling the investment gap
and in alleviating the distributional inequalities. It is worth noting that the financing gap is not large
relative to the increases in investment rates seen in several major emerging-market economies,
including China and India, over recent years. Such countries have the capacity if necessary to utilize
domestic saving, although the question of whether this would be equitable would remain.89
Figure 6 suggests that revenues from the international sales of CO2 permits could cover an important
fraction of the investment gap of developing economies, provided industrialized countries committed to
such large transfers. However, in order to work, a large and well-functioning carbon market would need
to be established in the next 20 years, capable of handling permits for several GtCO2-eq and hundreds
of billions of U.S. dollars of trades per year14,67,70. Such an emission market would be an order of
magnitude larger than the one currently supporting the Clean Development Mechanism (CDM) and
would require strong institutional support. The latter represent the type of barriers that are not analysed
by IAMs. The experience with CDM has already highlighted implementation difficulties at a much lower
level of ambition90.
Finally, IAM scenarios indicate that climate policies are likely to affect other objectives of policy-makers;
not all of these impacts are monetized in the models’ cost calculations. For example, climate policies
would lead to reduced energy imports and increased energy security in some major economies such as
China, India and the E.U.. This would not be the case for the USA and current energy exporters91.
Climate policies could also lead to more resilient energy systems in terms of diversity of energy options,
preservation of fossil resource ‘buffers’ and decreased sensitivity to GDP fluctuations65,92.
Transformation pathways spurred by climate policies would also foster air pollution93,94, with particular
benefits for China and India95,96. Although the magnitude of co-benefits related to air quality is
uncertain97, their current importance in major economies such as China could lend support to post-2020
climate policies.
Conclusions: modeling input to the Durban negotiation process
The challenge of achieving a comprehensive agreement to reduce emissions is often portrayed as
either technologically insurmountable or simply a matter of lack of sufficient political will. Rigorous
analysis of the implications of implementing mitigation measures can help characterizing the subtleties
of this challenge, supporting a differentiated view on the future of global climate policy and providing
useful insights for policy design and on the negotiation process. Such an analysis needs to focus on all
the key emitting regions and account for the uncertainties characterizing emission reduction
opportunities.
In this article, we show that scenarios generated by energy-economy-climate models via a model inter-
comparison project can help in this task, providing vital information to the ongoing policy debate on a
post-2020 climate agreement. The use of multiple models (MIPs) can help ensuring that key

LIMITS – LOW CLIMATE IMPACT SCENARIOS AND THE IMPLICATION OF REQUIRED TIGHT
EMISSION CONTROL STRATEGIES
PROJECT NO 282846
17
uncertainties are taken into account by using a diversity of different models and model assumptions.
Reviewing a recent MIP focused at international climate policy in the context of broader literature, we
have provided details on regional carbon budgets and emission reduction potentials. We used the
information as well to highlight the major challenges in sharing the economic effort associated with
reducing emissions equitably. The results show that emission trading via carbon markets may help to
alleviate some –but not necessarily all- of the unequal distribution of mitigation costs across countries
depending on the burden sharing scheme. In addition, a gap in investment into clean energy was
identified in the modelling studies which would need to be filled to initiate the necessary transition of the
energy system to achieve significant emissions reductions.
Our review indicates that the focus on the major economies reflected in the Durban platform process
can help policy-makers to formulate recommendations that at least partly take into account the different
regional incentives. Still, aligning national interests towards climate cooperation is by no means
straightforward. The numerical estimates by the MIPs reviewed in this article highlight some critical
areas of the climate policy process, which include the regional diversity of mitigation opportunities and
costs, the linkages and extensions of carbon markets, the climate finance to fill in the investment gap,
the issue linkages with national policy priorities, the relevance of specific sectors for emission
reductions. Progress in all these key areas will be needed to motivate enhanced national ambition in
reducing emissions in the next decades.
This review has assessed mitigation challenges and opportunities without considering the regional
benefits of reducing GHG emissions, mostly because a robust quantification of the latter is not yet
available in the literature. Similarly, some potential additional strategies for dealing with climate change,
such as adaptation and geo-engineering, have not been considered in these model exercises.
Hopefully these topics will also be examined in the near future, using similar common protocols and
availing of a large number of integrated assessment models.
LIMITS – LOW CLIMATE IMPACT SCENARIOS AND THE IMPLICATION OF REQUIRED TIGHT
EMISSION CONTROL STRATEGIES
PROJECT NO 282846
18
References.
1. Blanford, G., Kriegler, E. & Tavoni, M. Harmonization vs. Fragmentation: Overview of Climate Policy Scenarios in EMF27. Climatic Change (2014). April 2014, Volume 123, Issue 3-4, pp 383-396
2. UNFCCC. Establishment of an Ad Hoc Working Group on the Durban Platform for Enhanced Action. (2011).
3. Aldy, J. E. & Stavins, R. N. Climate negotiators create an opportunity for scholars. Science 337, 1043–1044 (2012).
4. Pachauri, S. et al. Pathways to achieve universal household access to modern energy by 2030. Environ. Res. Lett. 8, 024015 (2013).
5. McCollum, D. L., Krey, V. & Riahi, K. An integrated approach to energy sustainability. Nature Climate Change 1, 428–429 (2011).
6. Rogelj, J., McCollum, D. L., Reisinger, A., Meinshausen, M. & Riahi, K. Probabilistic cost estimates for climate change mitigation. Nature 493, 79–83 (2013).
7. Rogelj, J., McCollum, D. L., O/’Neill, B. C. & Riahi, K. 2020 emissions levels required to limit warming to below 2 degrees. Nature Clim. Change 3, 405–412 (2013).
8. Rogelj, J., McCollum, D. L. & Riahi, K. The UN’s ‘Sustainable Energy for All’ initiative is compatible with a warming limit of 2 [deg]C. Nature Clim. Change 3, 545–551 (2013).
9. Luderer, G. et al. Economic mitigation challenges: how further delay closes the door for achieving climate targets. Environmental Research Letters 8, 034033 (2013).
10. Den Elzen, M. G. J. & van Vuuren, D. Peaking profiles for achieving long-term temperature targets with more likelihood at lower costs. Proceedings of the National Academy of Sciences 104, 17931 –17936 (2007).
11. Rogelj, J. et al. Emission pathways consistent with a 2 °C global temperature limit. Nature Clim. Change 1, 413–418 (2011).
12. Riahi, K. et al. Overview WP2 - Locked into Copenhagen Pledges - Implications of short-term emission targets for the cost and feasibility of long-term climate goals. Technological Forecasting and Social Change (2014) in press DOI: 10.1016/j.techfore.2013.09.016.
13. Kriegler, E. et al. What does the 2°C target imply for a global climate agreement in 2020? The LIMITS study on Durban Platform scenarios. (2013) Climate Change Economics Vol. 04, No. 04 1340008.
14. Tavoni, M. et al. The distribution of the major economies’ effort in the Durban platform scenarios. Climate Change Economics (2013) Vol. 04, No. 04 1340009
15. Edenhofer et. al. Identifying Options for a New International Climate Regime Arising from the Durban Platform for Enhanced Action. (2013).
16. Ranson, M. & Stavins, R. N. Linkage as a Foundation for Post-Durban Climate Policy Architecture. Ethics, Policy & Environment 15, 272–275 (2012).
17. Aldy, J. E. & Stavins, R. N. Designing the post-Kyoto climate regime: lessons from the Harvard Project on International Climate Agreements. Cambridge, MA: Harvard Project on International Climate Agreements (2008). at <http://belfercenter.hks.harvard.edu/publication/18686/designing_the_postkyoto_climate_regime.html>
18. Den Elzen, M. G. J., Lucas, P. L. & van Vuuren, D. Regional abatement action and costs under allocation schemes for emission allowances for achieving low CO2 -equivalent concentrations. CLIMATIC CHANGE 90, 243–268 (2008).
19. Den Elzen, M. & Höhne, N. Sharing the reduction effort to limit global warming to 2°C. Climate Policy 10, 247–260 (2010).
20. Ekholm, T. et al. Effort sharing in ambitious, global climate change mitigation scenarios. Energy Policy 38, 1797–1810 (2010).

LIMITS – LOW CLIMATE IMPACT SCENARIOS AND THE IMPLICATION OF REQUIRED TIGHT
EMISSION CONTROL STRATEGIES
PROJECT NO 282846
19
21. Barrett, S. Self-Enforcing International Environmental Agreements. Oxford Economic Papers 46, 878–894 (1994).
22. Carraro, C. & Siniscalco, D. Strategies for the international protection of the environment. Journal of Public Economics 52, 309–328 (1993).
23. Tulkens, H. & Chander, P. The Core of an Economy with Multilateral Environmental Externalities. International Journal of Game Theory 26, 379–401 (1997).
24. Finus, M., Van Ierland, E. & Dellink, R. Stability of climate coalitions in a cartel formation game. (Fondazione Eni Enrico Mattei (FEEM), 2003). at <http://papers.ssrn.com/sol3/papers.cfm?abstract_id=447461>
25. Fuentes-Albero, C. & Rubio, S. J. Can international environmental cooperation be bought? European Journal of Operational Research 202, 255–264 (2010).
26. Barrett, S. & Dannenberg, A. Sensitivity of collective action to uncertainty about climate tipping points. Nature Climate Change 4, 36–39 (2013).
27. Bosetti, V., Carraro, C., De Cian, E., Massetti, E. & Tavoni, M. Incentives and stability of international climate coalitions: An integrated assessment. Energy Policy (2013). Volume 55, Pages 44–56
28. Nagashima, M., Dellink, R., van Ierland, E. & Weikard, H.-P. Stability of international climate coalitions — A comparison of transfer schemes. Ecological Economics 68, 1476–1487 (2009).
29. Bréchet, T., Gerard, F. & Tulkens, H. Efficiency vs. stability in climate coalitions: a conceptual and computational appraisal. Energy Journal 32, 49 (2011).
30. Carbone, J. C., Helm, C. & Rutherford, T. F. The case for international emission trade in the absence of cooperative climate policy. Journal of Environmental Economics and Management 58, 266–280 (2009).
31. Tol, R. S. Climate coalitions in an integrated assessment model. Computational Economics 18, 159–172 (2001).
32. Lessmann, K. et al. The Stability and Effectiveness of Climate Coalitions: A Comparative Analysis of Multiple Integrated Assessment Models. FEEM working paper 2014.005 (2014). at <http://services.bepress.com/feem/paper868/>
33. Clarke, L. et al. International climate policy architectures: Overview of the EMF 22 International Scenarios. Energy Economics 31, S64–S81 (2009).
34. Kriegler, E. et al. Making or breaking climate targets: The AMPERE study on staged accession scenarios for climate policy. Technological Forecasting and Social Change (2014), in press DOI: 10.1016/j.techfore.2013.09.021.
35. Jakob, M., Luderer, G., Steckel, J., Tavoni, M. & Monjon, S. Time to act now? Assessing the costs of delaying climate measures and benefits of early action. Climatic Change 1–21 (2012).
36. Luderer, G., Bertram, C., Calvin, K., Cian, E. & Kriegler, E. Implications of weak near-term climate policies on long-term mitigation pathways. Climatic Change 1–14 (2013). doi:10.1007/s10584-013-0899-9
37. Luderer, G. et al. On the regional distribution of mitigation costs in a global cap-and-trade regime. Climatic Change 114, 1–20 (2012).
38. UNFCCC. The Cancun Agreements: Outcome of the work of the Ad Hoc Working Group on Long-term Cooperative Action under the Convention. (2010). at <http://www.gci.org.uk/Documents/Romanian-Journal-of-International-Relations-and-Security-Studies.pdf#page=104>
39. Blanford, G. J., Rose, S. K. & Tavoni, M. Baseline projections of energy and emissions in Asia. Energy Economics 34, S284–S292 (2012).
40. Allen, M. et al. Warming caused by cumulative carbon emissions towards the trillionth tonne. Nature 458, 1163–1166 (2009).
41. Meinshausen, M. et al. Greenhouse-gas emission targets for limiting global warming to 2 degrees C. Nature 458, 1158–1162 (2009).

LIMITS – LOW CLIMATE IMPACT SCENARIOS AND THE IMPLICATION OF REQUIRED TIGHT
EMISSION CONTROL STRATEGIES
PROJECT NO 282846
20
42. Zickfeld, K., Eby, M., Matthews, H. D. & Weaver, A. J. Setting cumulative emissions targets to reduce the risk of dangerous climate change. Proceedings of the National Academy of Sciences 106, 16129 –16134 (2009).
43. Chen, W., Yin, X. & Zhang, H. Towards low carbon development in China: a comparison of national and global models. Climatic Change 1–14 (2013). doi:10.1007/s10584-013-0937-7
44. Hoogwijk, M. et al. Assessment of bottom-up sectoral and regional mitigation potentials. Energy Policy 38, 3044–3057 (2010).
45. Kriegler, E. et al. The Role of Technology for for Achieving Climate Policy Objectives: Overview of the EMF 27 Study on Energy System Transition Pathways Under Alternative Climate Policy Regimes. Climatic Change (2014) DOI 10.1007/s10584-013-0953-7.
46. van der Zwaan, B. C. C. et al. A Cross-model Comparison of Global Long-term Technology Diffusion under a 2˚C Climate Change Control Target. Climate Change Economics, 4, 1340013:1-24 (2013).
47. Krey, V., Luderer, G., Clarke, L. & Kriegler, E. Getting from here to there – energy technology transformation pathways in the EMF27 scenarios. Climatic Change (2014). April 2014, Volume 123, Issue 3-4, pp 369-382
48. Fischedick, M. et al. in IPCC Special Report on Renewable Energy Sources and Climate Change Mitigation 74 (Cambridge University Press, 2011).
49. Clarke, L., Krey, V., Weyant, J. & Chaturvedi, V. Regional energy system variation in global models: Results from the Asian Modeling Exercise scenarios. Energy Economics 34, S293–S305 (2012).
50. Wilson, C., Grubler, A., Bauer, N., Krey, V. & Riahi, K. Future capacity growth of energy technologies: are scenarios consistent with historical evidence? Climatic change 118, 381–395 (2013).
51. Popp, A. et al. Land-use transition for bioenergy and climate stabilization: model comparison of drivers, impacts and interactions with other land use based mitigation options. Climatic Change 1–15 (2013). doi:10.1007/s10584-013-0926-x
52. Rose, S. K. et al. Bioenergy in energy transformation and climate management. Climatic Change (2014) April 2014, Volume 123, Issue 3-4, pp 477-493.
53. Lucas, P. L., van Vuuren, D., Olivier, J. G. J. & den Elzen, M. G. J. Long-term reduction potential of non-CO2 greenhouse gases. Environmental Science & Policy 10, 85–103 (2007).
54. Calvin, K., Clarke, L., Krey, V. & Blanford, G. The role of Asia in Mitigating Climate Change: Results from the Asia Modeling Excercise. Energy Economics (2012).
55. Riahi, K. et al. in The Global Energy Assessment: Toward a Sustainable Future. (IIASA, Laxenburg, Austria and Cambridge University Press, Cambridge, UK, 2012).
56. Kunreuther, H. et al. Risk management and climate change. Nature Climate Change 3, 447–450 (2013).
57. Millner, A., Dietz, S. & Heal, G. Ambiguity and Climate Policy. National Bureau of Economic Research Working Paper Series No. 16050, (2010).
58. Höhne, N., Den Elzen, M. G. J. & Escalante, D. Regional greenhouse gas mitigation targets based on effort sharing – a comparison of studies. Climate Policy (2014) Volume 14, Issue 1, 2014.
59. Edenhofer, O. et al. The economics of low stabilization: Model comparison of mitigation strategies and costs. The Energy Journal 31, 11–48 (2010).
60. Staub-Kaminski,I., Zimmer, A., Jakob, M & Marschinski, R. Climate Policy in Practice: A Typology of Obstacles and Implications for Integrated Assessment Modeling. Climate Change Economics 5(1), (2014), http://dx.doi.org/10.1142/S2010007814400041 .
61. Den Elzen, M. & Höhne, N. Reductions of greenhouse gas emissions in Annex I and non-Annex I countries for meeting concentration stabilisation targets. Climatic Change 91, 249–274 (2008).
62. Johansson, D. J. et al. Multi-model analyses of the economic and energy implications for China and India in a post-Kyoto climate regime. (Kiel Working Paper, 2012).

LIMITS – LOW CLIMATE IMPACT SCENARIOS AND THE IMPLICATION OF REQUIRED TIGHT
EMISSION CONTROL STRATEGIES
PROJECT NO 282846
21
63. Jiahua, P. Carbon Budget for Basic Needs Satisfaction: implications for international equity and sustainability [J]. World Economics and Politics 1, 003 (2008).
64. Ding, Z. L., Duan, X. N., Ge, Q. S. & Zhang, Z. Q. Control of atmospheric CO 2 concentrations by 2050: A calculation on the emission rights of different countries. Science in China Series D: Earth Sciences 52, 1447–1469 (2009).
65. Jewell, J., Cherp, A. & Riahi, K. Energy security under de-carbonization scenarios: An assessment framework and evaluation under different technology and policy choices. Energy Policy 65, 743–760 (2014).
66. Hof, A. F., Den Elzen, M. G. J. & Van Vuuren, D. P. Environmental effectiveness and economic consequences of fragmented versus universal regimes: what can we learn from model studies? International Environmental Agreements: Politics, Law and Economics 9, 39–62 (2009).
67. Clarke, L. et al. International climate policy architectures: Overview of the EMF 22 International Scenarios. Energy Economics 31, Supplement 2, S64–S81 (2009).
68. Edenhofer, O. et al. The economics of low stabilization: Model comparison of mitigation strategies and costs. Energy Journal 31, 11–48 (2010).
69. Lüken, M. et al. The role of technological availability for the distributive impacts of climate change mitigation policy. Energy Policy 39, 6030–6039 (2011).
70. Luderer, G. et al. On the regional distribution of mitigation costs in a global cap-and-trade regime. Climatic Change (2012). doi:10.1007/s10584-012-0408-6
71. Aboumahboub, T. et al. On the regional distribution of climate mitigation costs: the impact of delayed cooperative action. Climate Change Economics (2014) Volume 05, Issue 01.
72. OECD. OECD environmental outlook to 2030. (Organisation for Economic Cooperation and Development, 2008).
73. Massetti, E. & Tavoni, M. The Cost Of Climate Change Mitigation Policy In Eastern Europe And Former Soviet Union. Climate Change Economics 2, 341–370 (2011).
74. Van Vuuren, D. et al. Comparison of top-down and bottom-up estimates of sectoral and regional greenhouse gas emission reduction potentials. Energy Policy 37, 5125–5139 (2009).
75. Stern, D. I., Pezzey, J. C. V. & Lambie, N. R. Where in the world is it cheapest to cut carbon emissions?*. Australian Journal of Agricultural and Resource Economics 56, 315–331 (2012).
76. Paltsev, S., Reilly, J., Jacoby, H. D. & Tay, K. H. in Human-Induced Climate Change (Schlesinger, M. E. et al.) 282–293 (Cambridge University Press, 2007). at <http://dx.doi.org/10.1017/CBO9780511619472>
77. Kober, T., van der Zwaan, B.C.C. & Rosler, H. Emission Certificate Trade and Costs under Regional Burden-Sharing Regimes for a 2˚C Climate Change Control Target. Climate Change Economics 5, 1, 1440001:1-32 (2014).
78. Tavoni, M., Chakravarty, S. & Socolow, R. Safe vs. fair: a formidable trade-off in tackling climate change. Sustainability 2012, 4(2), 210-226; doi:10.3390/su4020210
79. IEA. Energy Technology Perspectives 2012. (Organisation for Economic Cooperation and Development / International Energy Agency, 2012).
80. Carraro, C., Favero, A. & Massetti, E. ‘Investments and public finance in a green, low carbon, economy’. Energy Economics 34, Supplement 1, S15–S28 (2012).
81. McCollum, D. et al. Energy investments under climate policy: a comparison of global models. Climate Change Economics Volume 04, Issue 04, November 2013
82. Bosetti, V., Carraro, C., Massetti, E., Sgobbi, A. & Tavoni, M. Optimal energy investment and R&D strategies to stabilize atmospheric greenhouse gas concentrations. Resource and Energy Economics 31, 123–137 (2009).

LIMITS – LOW CLIMATE IMPACT SCENARIOS AND THE IMPLICATION OF REQUIRED TIGHT
EMISSION CONTROL STRATEGIES
PROJECT NO 282846
22
83. IEA. Global gaps in clean energy RD&D: updates and recommendations for international collaboration. (International Energy Agency, 2010). at <http://www.iea.org/publications/freepublications/publication/global_gaps.pdf>
84. Marangoni, G. & M. Tavoni. Bridging the clean energy R&D gap to 2C. Climate Change Economics February 2014, Vol. 05, No. 01.
85. Nemet, G. F. & Kammen, D. M. U.S. energy research and development: Declining investment, increasing need, and the feasibility of expansion. Energy Policy 35, 746–755 (2007).
86. Popp, D. ENTICE-BR: The effects of backstop technology R&D on climate policy models. Energy Economics 28, 188–222 (2006).
87. IMF. Energy Subsidy reform--Lessons and Implications; (2013). at <https://www.imf.org/external/np/pp/eng/2013/012813.pdf>
88. IEA. World Energy Outlook 2012. (Organisation for Economic Cooperation and Development / International Energy Agency, 2012).
89. Bowen, A., Campiglio, E. & Tavoni, M. A macroeconomic perspective on climate change mitigation: Meeting the financing challenge. Climate Change Economics, February 2014, Vol. 05, No. 01
90. Wara, M. Is the global carbon market working? Nature 445, 595–596 (2007).
91. Jewell, J. et al. Energy security in major economies under long-term low-carbon scenarios. Climate Change Economics November 2013, Vol. 04, No. 04.
92. Cherp, A., Jewell, J., Vinichenko, V., Bauer, N. & De Cian, E. Global energy security under different climate policies, GDP growth rates and fossil resource availabilities. Climatic Change 1–12 (2013).
93. Rose, S. K. et al. Non-Kyoto Radiative Forcing in Long-Run Greenhouse Gas Emissions and Climate Change Scenarios. Climatic Change April 2014, Volume 123, Issue 3-4, pp 511-525
94. Bollen, J., van der Zwaan, B.C.C., Brink, C. & Eerens, H. Local air pollution and global climate change: A combined cost-benefit analysis. Resource and Energy Economics 31, 161–181 (2009).
95. Rafaj, P., Schöpp, W., Russ, P., Heyes, C. & Amann, M. Co-benefits of post-2012 global climate mitigation policies. Mitig Adapt Strateg Glob Change 18, 801–824 (2013).
96. Rao, S. et al. Better air for better health: Forging synergies in policies for energy access, climate change and air pollution. Global Environmental Change 23, 1122–1130 (2013).
97. Nemet, G. F., Holloway, T. & Meier, P. Implications of incorporating air-quality co-benefits into climate change policymaking. Environ. Res. Lett. 5, 014007 (2010).
98. ELMAR KRIEGLER, MASSIMO TAVONI, KEYWAN RIAHI, and DETLEF P. VAN VUUREN “INTRODUCING THE LIMITS SPECIAL ISSUE“, Climate Change Economics, November 2013, Vol. 04, No. 04
Acknowledgement
The research leading to these results has received funding from the European Union Seventh
Framework Programme FP7/2007-2013 under grant agreement n° 282846 (LIMITS).

LIMITS – LOW CLIMATE IMPACT SCENARIOS AND THE IMPLICATION OF REQUIRED TIGHT
EMISSION CONTROL STRATEGIES
PROJECT NO 282846
23
Supplementary information.
AFRICA countries of Sub-Saharan Africa; some models also include North African countries, others do not; for REMIND and WITCH South Africa is included in the REST_WORLD region
CHINA countries of centrally-planned Asia; primarily China; for some models this may also include Cambodia, Vietnam, North Korea, Mongolia, etc.
EUROPE countries of Eastern and Western Europe (i.e., the EU27); some models (except REMIND and WITCH) also include Turkey
INDIA countries of South Asia; primarily India; for some models this may also include Nepal, Pakistan, Bangladesh, Afghanistan, etc.
LATIN_AM countries of Latin America and the Caribbean; Mexico, Brazil, Argentina, and other countries of Central and South America
MIDDLE_EAST countries of the Middle East; Iran, Iraq, Israel, Saudi Arabia, Qatar, etc.; for some models this may also include countries of North Africa (e.g., Algeria, Egypt, Morocco, Tunisia); for REMIND the former Soviet states of Central Asia are included
NORTH_AM countries of North America; primarily the United States of America and Canada; for REMIND Canada is included in the REST_WORLD region, for WITCH it is included in the PAC_OECD region
PAC_OECD countries of the Pacific OECD (Organisation for Economic Co-operation and Development); for most models this primarily includes Japan, Australia, and New Zealand; for REMIND only Japan is included, Australia and New Zealand are included in the REST_WORLD region; WITCH does not include Australia, which is instead part of the REST_WORLD region; WITCH also includes Canada in the PAC_OECD
EIT countries from the Economies in Transition of Eastern Europe and the Former Soviet Union; primarily Russia, Ukraine, Kazakhstan, Azerbaijan, etc.; for WITCH Turkey is also included; for REMIND this region only includes Russia
REST_ASIA other countries of Asia; South Korea, Malaysia, Philippines, Singapore, Thailand, Indonesia, etc.; for WITCH South Korea is included in the REST_WORLD region
Table S1: Definition of regional aggregates used in the paper.

LIMITS – LOW CLIMATE IMPACT SCENARIOS AND THE IMPLICATION OF REQUIRED TIGHT
EMISSION CONTROL STRATEGIES
PROJECT NO 282846
24
Scenario class
Scenario
Name
Scenario
Type
Near‐
term
Target /
Fragmen
ted
Action
Fragm
ented
Action
until
Long-term
Target Policy implementation
No policy baseline No
Policies Baseline None N/A None -
Fragmented action Weak
Pledges Reference Lenient 2100 None No carbon price harmonization
Durban Platform
scenarios without
trade of CO2 across
regions
450 ppm-
eq Climate
Policy Lenient 2020
450 ppm-
eq
Carbon price harmonization, no
trading of emission permits
500 ppm-
eq
Climate
Policy Lenient 2020
500 ppm-
eq
Carbon price harmonization, no
trading of emission permits
Durban platform
scenarios with
trade of CO2 across
regions
450 ppm-
eq, PC
Climate
Policy Lenient 2020
450 ppm-
eq
Carbon price harmonization, with
trading of emission permits.
Permits allocated on equal per
capita (linear transition from
todays per capital emissions to
equal tons per capita by 2050)
450 ppm-
eq, EE
Climate
Policy Lenient 2020
450 ppm-
eq
Carbon price harmonization, with
trading of emission permits.
Permits allocated on equal
regional cost. Relative mitigation
costs (e.g in % GDP losses wrt to
No Policies) are equalized across
regions in each time period.
Table S2. The set of LIMITS scenarios reviewed in this paper, with their main characteristics.
LIMITS – LOW CLIMATE IMPACT SCENARIOS AND THE IMPLICATION OF REQUIRED TIGHT
EMISSION CONTROL STRATEGIES
PROJECT NO 282846
25
Region
GHG
emissions
reduction
in 2020(1)
GHG
intensity
reduction
in 2020(2)
Modern
Renewable
share in
electricity(3)
Installed
renewable
capacity in 2020 (4)
(Wind, solar)
Installed
nuclear
power
capacity (5)
Average GHG
emissions
intensity
reduction
after 2020(6)
EU27 ‐15% (2005) N/A 20% (2020) - N/A 3%
China N/A ‐40% 25% (2020) 200 GW; 50GW 41 GW (2020) 3.3%
India N/A ‐20% - 20 GW; 10GW 20 GW (2020) 3.3%
Japan ‐1% (2005) N/A - 5 GW; 28GW N/A 2.2%
USA ‐5% (2005) N/A 13% (2020) - N/A 2.5%
Russia +27% (2005) N/A 4.5% (2020) - 34GW (2030) 2.6%
AUNZ -13% (2005) N/A 10% (2020) - N/A 3%
Brazil -18% (BAU) N/A - - N/A 2.7%
Mexico -15% (BAU) N/A 17% (2020) - N/A 2.8%
LAM -15% (BAU) N/A N/A - N/A 2.1%
CAS N/A N/A N/A N/A N/A 2.6%
KOR -15% (BAU) N/A - 8 GW; - N/A 3.3%
IDN -13% (BAU) N/A 7.5% (2025) - N/A 2.1%
SSA N/A N/A N/A - N/A 2.3%
CAN ‐5% (2005) N/A 13% (2020) - N/A 2.4%
EEU N/A N/A N/A N/A N/A 2.6%
EFTA N/A N/A N/A N/A N/A 3.5%
MEA N/A N/A N/A - N/A 1.5%
NAF N/A N/A 20% (2020) - N/A 1.5%
PAK N/A N/A N/A N/A N/A 1.9%
SAF -17% (BAU) N/A N/A N/A N/A 2.8%
SAS N/A N/A N/A - N/A 2.9%
SEA N/A N/A 15% (2020) - N/A 2.1%
TUR N/A N/A - 20 GW;- N/A 2.3%
TWN N/A N/A N/A N/A N/A 3.3%
Abbreviations:
AUNZ = Australia and New Zealand
LAM = Latin America
CAS = Central Asia
KOR = South Korea
IDN = Indonesia
SSA = Sub-saharan Africa
CAN = Canada
EEU = Eastern Europe
EFTA = European Free Trade Association
(Lichtenstein, Iceland, Norway, and Switzerland)
MEA = Middle East
NAF = North Africa
PAK = Pakistan
SAF= South Africa
SAS = South Asia
SEA = South-east Asia
TUR = Turkey
TWN = Taiwan

LIMITS – LOW CLIMATE IMPACT SCENARIOS AND THE IMPLICATION OF REQUIRED TIGHT
EMISSION CONTROL STRATEGIES
PROJECT NO 282846
26
(1) Including Land-use Change, Land-use Change and Forestry (LULUCF) and relative to 2005 or business as usual
(BAU) as specified in brackets. (If GHG emissions in baseline is lower, baseline trajectory is adopted for the region
concerned.)
(2) Including LULUCF and relative to 2005 (If GHG intensity reduction in baseline is higher, baseline trajectory is adopted
for the region concerned.)
(3) Reference quantity is always electricity production except for EU27 where it is final energy.
(4),(5) Capacity targets are minimum targets; target year is specified in brackets.
(6) %/year; GHG intensity improvement rates calculated based on Kyoto GHG equivalent emissions including LULUCF
relative to GDP. (If GHG emissions (intensity) reduction in baseline is higher, baseline trajectory is adopted for the
region and period concerned.)
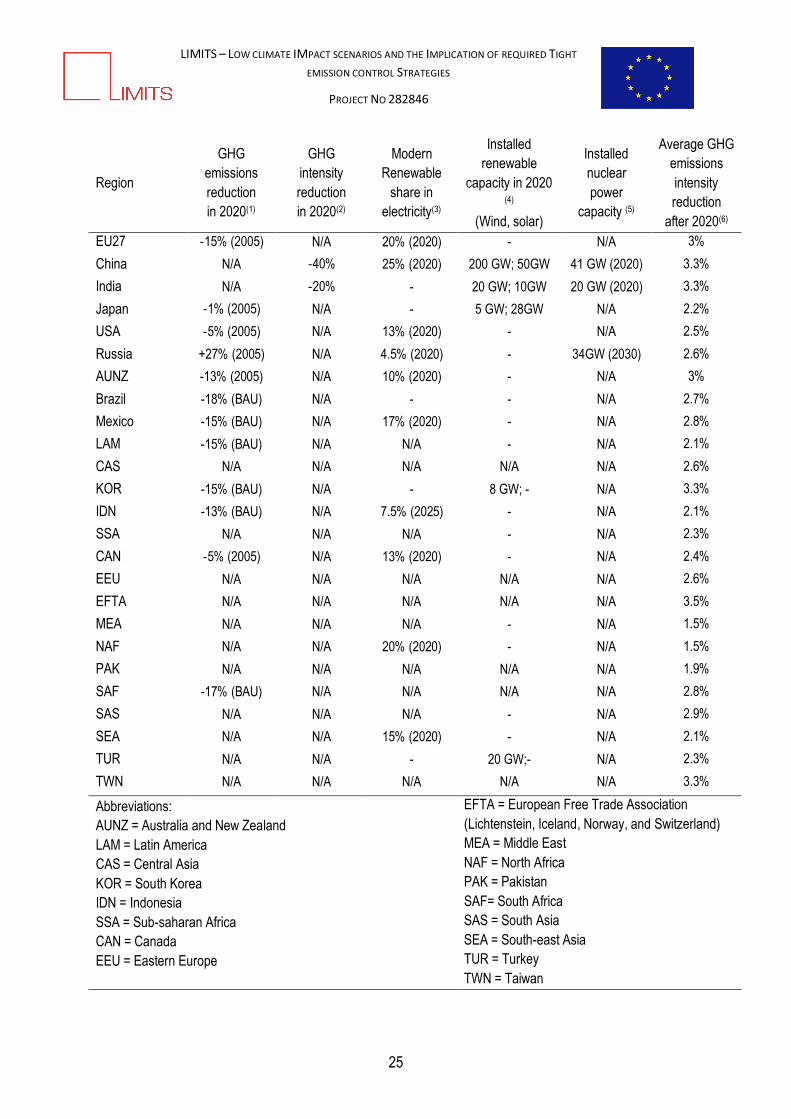
Table S3: 2020 Targets in the weak pledges and Durban platform scenarios for 25 world regions, and post 2020
targets for the weak pledges scenario. See Ref. 13 for the implementation of the 2020 pledges and subsequent
lenient policies in the various models participating in the LIMITS study.

LIMITS – LOW CLIMATE IMPACT SCENARIOS AND THE IMPLICATION OF REQUIRED TIGHT
EMISSION CONTROL STRATEGIES
PROJECT NO 282846
27
Figure S1: Timing of peak year emissions (as in Figure 1) for the full set of models.

LIMITS – LOW CLIMATE IMPACT SCENARIOS AND THE IMPLICATION OF REQUIRED TIGHT
EMISSION CONTROL STRATEGIES
PROJECT NO 282846
28
Figure S2: Cumulative GHGs (Kyoto) emissions (2010-2100), in GtCO2-eq. No historical emissions are
reported given the uncertainties on non-CO2 gases.

LIMITS – LOW CLIMATE IMPACT SCENARIOS AND THE IMPLICATION OF REQUIRED TIGHT
EMISSION CONTROL STRATEGIES
PROJECT NO 282846
29
Figure S3: Cumulative CO2 emissions (2010-2100) (as in Figure 2) for the full set of models.

LIMITS – LOW CLIMATE IMPACT SCENARIOS AND THE IMPLICATION OF REQUIRED TIGHT
EMISSION CONTROL STRATEGIES
PROJECT NO 282846
30
Figure S4: Share of cumulative mitigation (2010-2050) of Kyoto gases across sectors for the 450 ppm-
eq policy (see Figure 3), for the full set of models.

LIMITS – LOW CLIMATE IMPACT SCENARIOS AND THE IMPLICATION OF REQUIRED TIGHT
EMISSION CONTROL STRATEGIES
PROJECT NO 282846
31
Figure S5: Investments in coal power generation (without CCS) in the Weak Pledge and 450 pp-eq
scenarios, 2020 to 2040. The boxplot indicate the median, interquartile range, and full model range.