wp6 ibe ex-post case studies - feem-project.net · wp6 ibe ex-post case studies ... in a wqt...
TRANSCRIPT
Grant Agreement no. 265212
FP7 Environment (Including Climate Change)
WP6 IBE EX-POST Case studies Great Miami River Watershed Water Quality Credit Trading Program
Deliverable no.: D6.1 – IBE Review reports December 3, 2011
ii
Deliverable Title D6.1 – IBE Review reports
Filename Great Miami River Watershed Water Quality Credit Trading Program
Authors Mark S. Kieser and Jamie L. McCarthy, Kieser & Associates, LLC Date December 3, 2011
Prepared under contract from the European Commission Grant Agreement no. 265213 FP7 Environment (including Climate Change) Start of the project: 01/01/2011 Duration: 36 months Project coordinator organisation: FEEM Deliverable title: IBE Review reports Deliverable no. : D6.1 Due date of deliverable: Month 11 Actual submission date: Month 12 Dissemination level
x PU Public
PP Restricted to other programme participants (including the Commission Services)
RE Restricted to a group specified by the consortium (including the Commission Services)
CO Confidential, only for members of the consortium (including the Commission Services)
Deliverable status version control
Version data Author
Month year Name, Affiliation
1.0 December 3rd, 2011
Mark S. Kieser and Jamie L. McCarthy (, Kieser & Associates)
i
0 Executive Summary
The economic policy instrument (EPI) discussed in this case study involves nutrient
credit trading between point source wastewater treatment plants (WWTPs) and
nonpoint sources (agriculture) in the Great Miami River Watershed of Ohio (U.S.).
Commonly referred to as water quality trading (WQT) in the U.S., this EPI is a
market-based approach to pollution control in which pollutant reductions are treated
as commodities.
0.1 Definition of the analysed EPI and purpose
In a WQT market, dischargers that reduce their pollutant loads below required levels
can sell surplus reductions, called credits, to other dischargers that need to make
reductions to meet compliance requirements but face much higher costs to achieve
required reductions. Credit price can be determined via negotiations between the
buyer and seller, derived from credit auctions, or can be set by the government or
other agency.
The purpose of this case study is to describe how a watershed-based flood control
agency in southern Ohio developed a plan for WQT to provide a cost-effective
alternative for WWTP compliance. WWTPs will soon face more stringetn effluent
limits as a result of impending numeric nutrient standards being assigned to rivers
and streams receiving treated wastewater. Lessons learned from this case study have
substantial merit as an EPI because this program provides an economic framework
for applying and using WQT in a regulatory setting. This case study example is also
one of the largest and most successful WQT programs in the U.S. to negotiate
nutrient credit trades between mulitple point source buyers and nonpoint source
sellers. Of note is the use of a reverse auction for securing lowest-cost credit
contracts. This program was the first of its kind in the State of Ohio. An ex post
evaluation of the program was conducted on the first six rounds of reverse auction
bidding (out of a total of ten completed to date) for nonpoint source projects
(Newburn and Woodward, 2011).
0.2 Introduction
In 2004, ahead of statewide policy or rules for WQT, the Miami Conservancy District
(MCD) (a watershed-based flood district with taxing authority) examined
opportunities for a point source/nonpoint source WQT pilot program in the Great
Miami River watershed (see Map 0.1). The program was designed to improve locally
impaired waterways and to provide a cost-effective alternative for WWTP
compliance under forthcoming nitrogen and phosphorus standards. Once nutrient
standards are in place, municipal, industrial and other permitted point sources will
be required to meet more stringent effluent requirements. Such limits will require

ii
significant capital investments and increase annual operation and maintenance costs
for these permitted WWTPs.
The intent of the trading program is for agriculture to supply cost-effective nutrient
reduction credits in lieu of anticipated point source reductions associated with
expensive wastewater treatment plant upgrades. As agriculture is the predominant
land use in the watershed, it was originally envisioned that trading opportunities in a
water quality market with significant demand will motivate agricultural producers
to participate. Robust participation by agriculture in a trading program can
overcome common challenges in traditional programs that lack the authority or
incentives to engage producers in water quality initiatives. The goal of the program
was to establish a unit of credit for nitrogen
and phosphorus reductions generated by
agricultural best management practices
(BMPs) that reduced nutrient loading to
local surface bodies. Cost-effective credits
would be sold to downstream wastewater
treatment plants looking to offset effluent
discharges. The program was developed
with pre-compliance incentives to encouage
early participation prior to issuance of more
stringent WWTP effluent limits. Seven
point source buyers representing a total of
nine permitted outfalls have participated in
the pre-compliance version of this early
WQT market. (More than 300 permitted
dischargers exist in this watershed.)
As of the case study report, nutrient standards have not been promulgated. Despite
this setback, the MCD WQT program has been successful in conducting reverse
auctions and funding agricultural producers to implement BMPs that improve water
quality. The program has also been successful in getting financial support from
point sources even though a regulatory driver for demand has been lagging.
Map 0.1 – Location of the Great Miami River Watershed in southern Ohio, U.S.
0.3 Legislative setting and economic background
The MCD WQT framework was approved by the Ohio Environmental Protection
Agency (OEPA) prior to the promulgation of statewide trading rules in 2007. The
statewide trading rules contain a grandfather clause that authorizes the MCD WQT
program to continue using their existing trading framework for a limited time period
of ten years. Each of the wastewater treatment plants (WWTPs) purchasing credits
through MCD’s WQT program have modified National Pollution Discharge
iii
Elimination System (NPDES) permits that allow them to purchase credits to meet
their effluent limit (or future limit). The WWTPs were given an additional financial
incentive because of their early pre-compliance participation in the WQT pilot
program. The incentive is in the form of a more favorable trading ratio in the future
after the pre-compliance period.
As part of MCD’s effort in developing a pilot point source/nonpoint source WQT
program in the watershed, an economic analysis was conducted to examine two
requisite conditions for WQT in the watershed. The analysis found that there was an
adequate supply of agricultural nonpoint source reductions in phosphorus to meet
all of the demand (and most of the nitrogen demand) through application of no-till
management practices on 50% of the row crops in the watershed (K&A, 2004). The
cost differentials between point source upgrades (approximately $422.5 million) and
trading credits from agriculture (approximately $37.8 million) were sufficient to
support a trading program (K&A, 2004).
MCD’s WQT program focuses on those practices which achieve the highest and most
cost-effective loading reductions of total phosphorus (TP) and total nitrogen (TN) in
relation to the buyer’s location in a watershed and point of water quality concern.
For the MCD WQT program, these locations are upstream of WWTP buyers. Other
federal conservation programs focus more on producers interested in implementing
conservation plans and consider numerous conservation benefits of all
environmental resources regardless of watershed location of load reduction. These
resources include water quality issues in a ranking system that makes awards based
on cumulative benefits. While both programs fund BMPs that may result in water
quality benefits, trading programs using reverse auctions focus on those BMPs that
deliver the greatest water quality benefits per dollar expended.
0.4 Brief description of results and impacts of the proposed EPI
In the pre-compliance phase, the main goal for the MCD WQT program to date has
been testing and adapting a framework for WQT that will provide WWTPs and other
permitted point sources with reliable nutrient credits to comply with future more
strict effluent limits in NPDES permits. An economic assessment of the potential cost
efficiencies of WQT in the Great Miami River Watershed revealed that the MCD
WQT program will provide substantial cost savings in the future when stricter
numeric nutrient standards are enforced.
In terms of environmental outcomes, the MCD WQT program has implemented ten
rounds of agricultural BMP reverse auction bids. As part of the bidding process,
local county Soil and Water Conservation Districts (SWCDs) must calculate the
anticipated TP and TN load reduction from proposed BMPs. SWCDs must use state-
approved spreadsheet tools to estimate the load reduction. This system provides
more consistent load reduction estimates and assurance that the WQT program is
environmentally sustainable. Contracted BMPs represent reductions of 339 tons of
TN and 130 tons of TP reductions or credits through the first six rounds of reverse
iv
auctions. Additionally, the MCD conducts annual water quality monitoring
throughout the watershed.
The geographic and social equity of credit distribution throughout the Great Miami
River Watershed is affected by the program framework. The MCD WQT program
requires point source buyers to purchase credits from upstream sources. This
influences the distribution of eligible producers that can implement BMPs and sell
nutrient credits based on the point source buyers in the market. In addition, because
cost-effectiveness is one of the main project goals, as opposed to social equity,
producers working with more experienced SWCDs tended to have more BMP
proposals submitted and accepted than producers working with less experienced
SWCDs. Newburn and Woodward (2011) determined that over time, SWCDs that
participated in bidding each year could better inform their producers on what cost
range to submit in their bids. This lead to an uneven distribution of BMP projects
selected among the eligible counties in the watershed.
In addition to funding the lowest cost nutrient reductions in the watershed, there
were several other benefits of the WQT program that were not directly targeted.
Ancillary environmental benefits were realized through nonpoint source nutrient
reductions, including: habitat improvement, stream shading/temperature benefits,
streambank stabilization, flow velocity stabilization, and floodplain preservation.
The MCD WQT program also fostered collaboration and cooperation between many
disparate stakeholder groups beyond the pollutant reduction transaction. For
example, several cities in the watershed have been working collaboratively with
landowners and producers to develop recreational trails in what has been coined
“Ohio’s Great Corridor”. In general, WQT has allowed MCD to leverage additional
funds and resources for general water quality management that would otherwise be
invested in traditional WWTP technology upgrades. In this way, WQT has achieved
the intended water quality benefits and additional ancillary environmental,
community quality of life, and watershed management benefits.
0.5 Conclusions and lessons learned
Overall the EPI has been relatively successful in meeting the goals of cost-effectively
generating nutrient reductions in the watershed. Throughout the process of
developing and testing a WQT framework, several enabling and disabling factors
were identified. Necessary factors for successfully developing and implementing
WQT include the commitment and leadership of a watershed “champion”. This
champion must engage a multitude of stakeholders and work through a public
process to gain the support and buy-in from different stakeholder groups. It is
important to take advantage of existing, well-established relationships within the
watershed, especially when it comes to getting buy-in and participation from the
agricultural community.
Disabling factors for WQT were also identified. The Great Miami River Watershed,
like many watersheds in the U.S., lacks a definitive regulatory driver for water
v
quality improvements, especially for point source dischargers. This is due in part to
the lagging development of state numeric nutrient criteria. This lack of criteria has
lead to a great deal of uncertainty in WQT markets and has limited demand.
i
Table of Contents
0 Executive Summary ................................................................................................................................. i
0.1 Definition of the analysed EPI and purpose .................................................................................. i
0.2 Introduction ................................................................................................................................... i
0.3 Legislative setting and economic background ............................................................................. ii
0.4 Brief description of results and impacts of the proposed EPI.......................................................iii
0.5 Conclusions and lessons learned ............................................................................................... iv
1 EPI Background ......................................................................................................................................1
1.1 Baseline characterization.............................................................................................................1
1.2 Key program features...................................................................................................................2
2 Characterisation of the case study area..................................................................................................4
2.1 Land use in the Great Miami River Watershed ............................................................................4
2.2 Water quality and economic drivers in the Great Miami River Watershed ...................................5
3 Assessment Criteria ................................................................................................................................9
3.1 Environmental outcomes..............................................................................................................9
3.2 Economic Assessment Criteria ..................................................................................................10
3.3 Distributional Effects and Social Equity......................................................................................12
3.4 Institutions..................................................................................................................................14
3.5 Policy Implementability...............................................................................................................15
3.6 Transaction Costs ......................................................................................................................16
3.7 Uncertainty.................................................................................................................................17
4 Conclusions...........................................................................................................................................18
4.1 Lessons learned.........................................................................................................................19
4.2 Enabling / Disabling Factors ......................................................................................................20
5 References............................................................................................................................................21
6 Data Sources.........................................................................................................................................23
1
1 EPI Background
The Miami Conservancy District (MCD) initiated collaborative efforts with municipal
wastewater treatment plants (WWTPs) and agriculture in 2003 to consider
development of a point source/nonpoint source water quality trading (WQT) pilot
program in the Great Miami River. This innovative EPI was developed prior to
statewide rules for WQT and as such, MCD program elements followed the Federal
Final Water Quality Trading Policy (USEPA, 2003). Starting in 2004, the MCD
developed a policy framework for post-compliance WQT and began testing this
framework in 2006 by implementing agricultulral BMPs through pilot trading.
Elements of the framework are briefly described in this section.
1.1 Baseline characterization
WQT is a market-based approach to pollution control in which pollutant removal is
traded as a commodity. With WQT, dischargers that reduce their pollutant loading
below required levels can sell surplus reductions, called credits, to other dischargers
that need to make reductions to meet compliance requirements. The WQT program
in the GMR watershed was driven by the potential cost savings that nutrient credits
could provide over treatment technology upgrades at WWTPs. The credits take on a
monetary value, and it is the buying and selling of pollutant credits among
dischargers to achieve an overall net reduction in loading in a watershed that is the
essence of WQT. Credit price can be determined via negotiations between the credit
buyer and seller, or it can be set by the government or other agencies. Usually the
credit price cannot be lower than the cost to reduce pollutant loadings incurred by
the seller (i.e., BMP implementation cost), and it cannot be higher than the cost of an
abatement alternative for the buyer (i.e., treatment technology upgrade).
In 2004, MCD examined opportunities for a WQT pilot program in the GMR to
improve locally impaired waterways and to provide WWTPs with flexible
alternatives to address forthcoming nitrogen and phosphorus standards. As
agriculture is the predominant land use in the watershed, it was envisioned that
trading opportunities in a water quality market with significant demand would
motivate agricultural producers to participate. Robust participation by agriculture in
the program may help overcome common challenges in traditional conservation
programs that lack the authority or incentives to engage agricultural producers in
water quality initiatives. As such, an economic analysis was conducted to examine if
two requisite conditions for WQT existed in the watershed. The analysis indicated
that there was an adequate supply of agricultural nonpoint source reductions in
phosphorus to meet all of the WWTP demand (and most of the nitrogen demand)
through application of no-till management practices on 50% of the row crops in the
watershed (K&A, 2004). The analysis also found cost differentials between WWTP
upgrades (approximately $422.5 million) and trading credits from agriculture
2
(approximately $37.8 million) were sufficient to support a trading program (K&A,
2004).
During this pre-compliance pilot period where nutrient limitations have not yet been
included in WWTP permits, the MCD collects funds from WWTPs in the watershed
that are used to purchase nutrient credits and fund administrative and water quality
monitoring costs. The program has also been supported through numerous federal
grants. In the post-compliance period, all revenue used to purchase credits will come
from permitted point sources.
1.2 Key program features
Several conditions existed or were developed in order for the MCD pilot program to
be operational. The first necessary condition was a driver for nutrient reductions.
WWTPs in the watershed anticipate stricter effluent limits in their discharge permits
and water quality impairments in the watershed continue to trigger TMDLs that will
allocate nutrient load restrictions for both point and nonpoint sources. Second, a
feasibility study for WQT in the watershed indicated that future WWTP demand for
nutrient credits would result from stricter effluent limits. The study also reported
the capacity for ample agricultural credit supply throughout the watershed. Political
conditions in the watershed were also ripe for WQT. OEPA, the state permitting
authority, modified WWTP discharge permits as part of the pilot program to allow
nutrient credits to offset effluent limits. Lastly, the MCD has been a watershed
champion for WQT and gained stakeholder buy-in through a robust public
participation process.
The Great Miami River Watershed Water Quality Credit Trading Program Operations
Manual developed by the Water Conservation Subdistrict of the MCD (MCD, 2005)
outlines the WQT program framework. Key features of the program are briefly
described here:
Policy Objectives The manual points to the following environmental, social, and
economic objectives (MCD, 2005): 1) improved surface water quality in the
watershed (primarily measured by nutrient concentrations, biological indicators, and
beneficial use attainment); 2) increased implementation of agricultural BMPs (tracked
and quantified through pounds of nutrients not discharged; and, 3) lower costs for
WWTP rate payers (eventually quantified through the savings WQT offers when
compared to treatment technology upgrades at plants).
Program Design and Delivery Mechanisms The program involves voluntary point
source/nonpoint source trading of phosphorus and nitrogen credits, where a credit
represents one pound of phopshorus or nitrogen prevented from discharing into
surface water in the watershed (MCD, 2005). Landowners work with truested
agricultural agents from County Soil and Water Conservation Districts (SWCDs) to
develop BMP proposals for credits. The MCD, acting as a third party credit
clearinghouse, selects proposals using a reverse auction process where contracts are
awarded to proposals with the lowest cost credits first. Contracts are then awarded
3
to proposals with the next highest credit costs until the target number of credits are
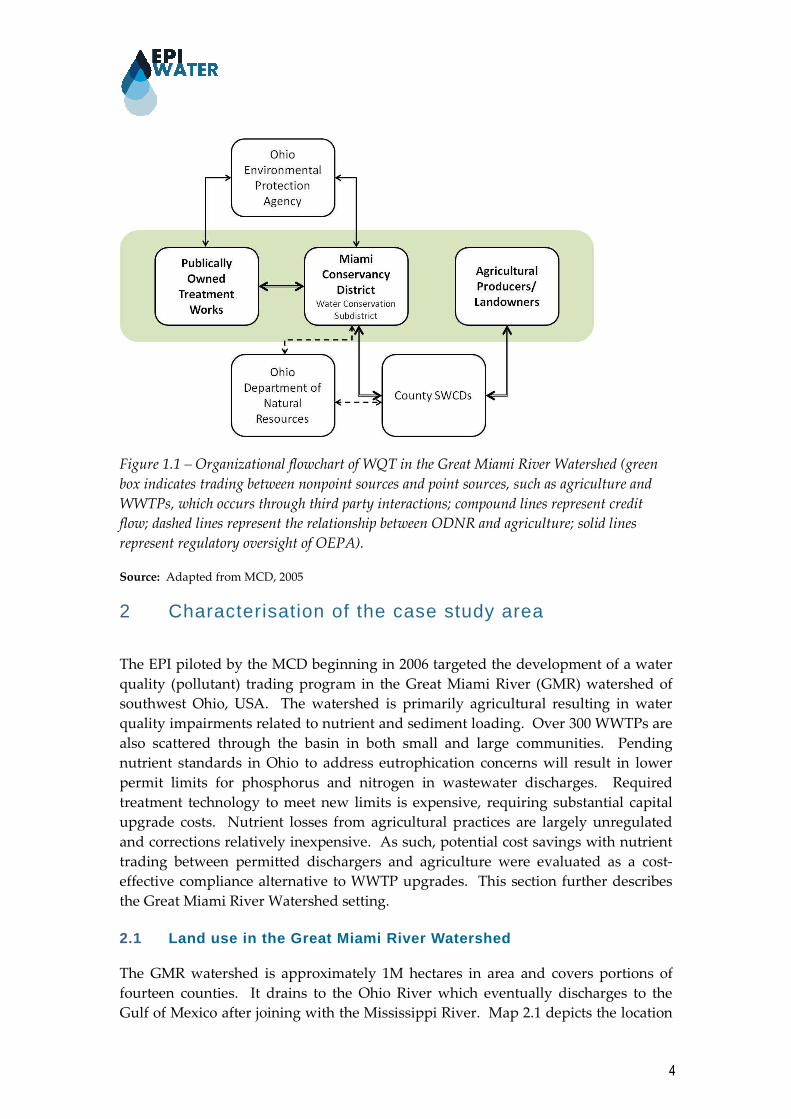
obtained. Figure 1.1 demonstrates the flow of nutrient credits from agriculture to
WWTPs (see compound arrows). Dashed lines between SWCDs and the Ohio
Department of Natural Resources (ODNR) represent credit calculation and BMP
inspection oversight. ODNR and MCD interact through adaptive management of
credit calculations.
Safeguarding Mechanisms to Avoid Negative Effects During the pilot trading
period, the program uses two safeguarding mechanims to ensure environmental
protection and validity of nutrient credits: 1) WWTPs are limited to buying only
upstream nutrient credits to avoid nutrient hotspots at or below the plant and ensure
environmental benefits throughout the watershed, and 2) annual site inspections are
conducted to ensure BMPs are maintained and operated to agreed upon standards.
A third mechanism is described in the manual and will be used once post-
compliance trading begins. This mechanism involves MCD managing an insurance
pool of credits that can be used to address credit failure.
Imact Assessments The manual outlines two different ways in which the WQT
program will be evaluated and how improvements will be made once post-
compliance trading begins: 1) the performance of agricultural BMPs will be
validated through site-specific water quality monitoring and results will be used to
periodically evaluate the credit estimation methods, and 2) the overall program
performance will be validated through continuous water quality monitoring at
several points throughout the watershed and results will be used to evaluate the
entire WQT program to ensure environmental protection.
Political and Legal Process The structure of the program is such that MCD has
taken on the role of credit clearinghouse and facilitator of trading. The program
relies on existing legal framework between WWTPs and the OEPA. Figure 1.1
represents OEPA’s role in the program in terms of reviewing water quality
monitoring data and working with WWTPs to incorporate trading into discharge
permits (solid line arrows). WWTPs then enter puchases of credits through the
MCD.
Public Participation The manual describes the initial interaction of stakeholders in
developing the WQT program. Over 100 meetings have been held between MCD
and SWCD boards, joint boards, WWTPs, and community-based watershed
organization to solicit input. Numerous meetings where also held with state (OEPA,
ODNR) and federal agencies (US EPA, USDA), Ohio Environmental Council and
Ohio Farm Bureau.
4
Figure 1.1 – Organizational flowchart of WQT in the Great Miami River Watershed (green
box indicates trading between nonpoint sources and point sources, such as agriculture and
WWTPs, which occurs through third party interactions; compound lines represent credit
flow; dashed lines represent the relationship between ODNR and agriculture; solid lines
represent regulatory oversight of OEPA).
Source: Adapted from MCD, 2005
2 Characterisation of the case study area
The EPI piloted by the MCD beginning in 2006 targeted the development of a water
quality (pollutant) trading program in the Great Miami River (GMR) watershed of
southwest Ohio, USA. The watershed is primarily agricultural resulting in water
quality impairments related to nutrient and sediment loading. Over 300 WWTPs are
also scattered through the basin in both small and large communities. Pending
nutrient standards in Ohio to address eutrophication concerns will result in lower
permit limits for phosphorus and nitrogen in wastewater discharges. Required
treatment technology to meet new limits is expensive, requiring substantial capital
upgrade costs. Nutrient losses from agricultural practices are largely unregulated
and corrections relatively inexpensive. As such, potential cost savings with nutrient
trading between permitted dischargers and agriculture were evaluated as a cost-
effective compliance alternative to WWTP upgrades. This section further describes
the Great Miami River Watershed setting.
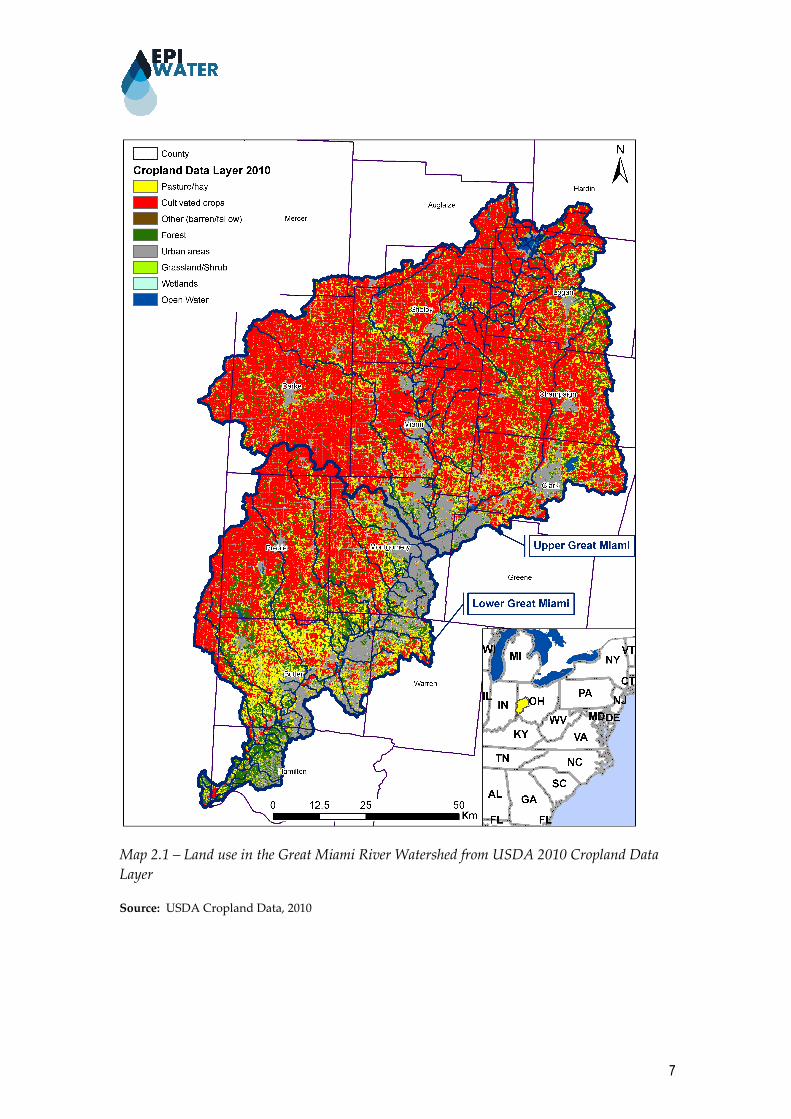
2.1 Land use in the Great Miami River Watershed
The GMR watershed is approximately 1M hectares in area and covers portions of
fourteen counties. It drains to the Ohio River which eventually discharges to the
Gulf of Mexico after joining with the Mississippi River. Map 2.1 depicts the location
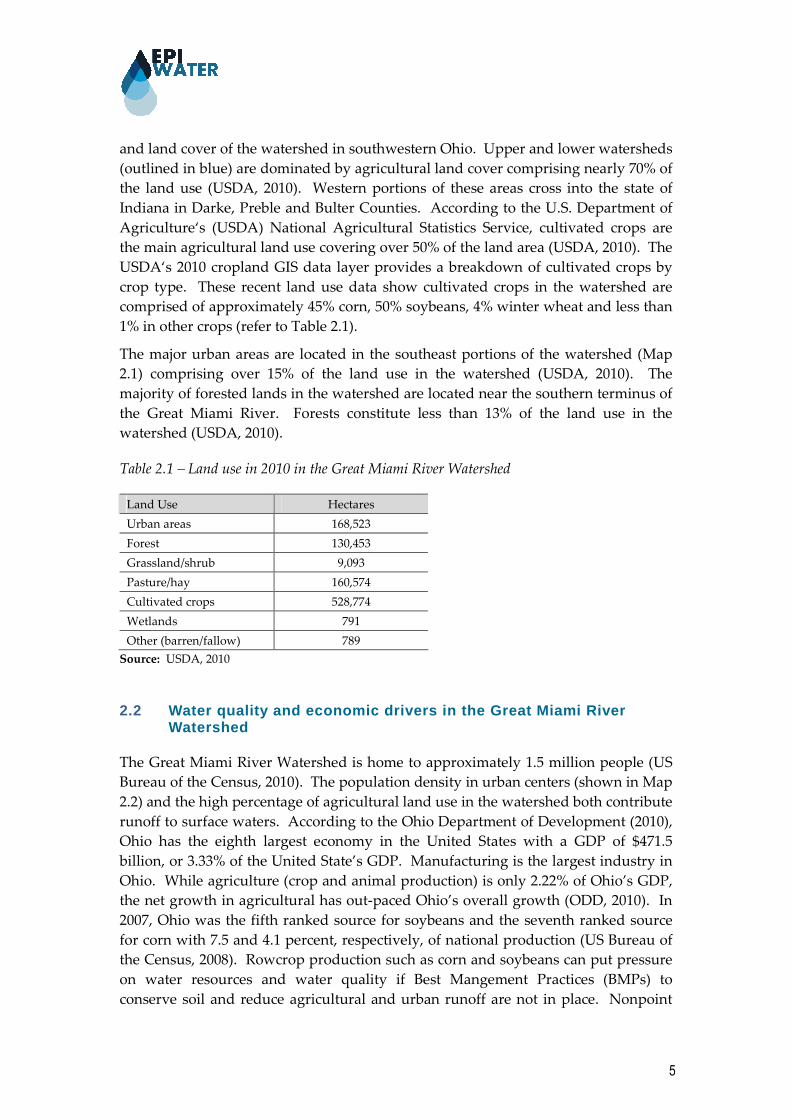
5
and land cover of the watershed in southwestern Ohio. Upper and lower watersheds
(outlined in blue) are dominated by agricultural land cover comprising nearly 70% of
the land use (USDA, 2010). Western portions of these areas cross into the state of
Indiana in Darke, Preble and Bulter Counties. According to the U.S. Department of
Agriculture‘s (USDA) National Agricultural Statistics Service, cultivated crops are
the main agricultural land use covering over 50% of the land area (USDA, 2010). The
USDA‘s 2010 cropland GIS data layer provides a breakdown of cultivated crops by
crop type. These recent land use data show cultivated crops in the watershed are
comprised of approximately 45% corn, 50% soybeans, 4% winter wheat and less than
1% in other crops (refer to Table 2.1).
The major urban areas are located in the southeast portions of the watershed (Map
2.1) comprising over 15% of the land use in the watershed (USDA, 2010). The
majority of forested lands in the watershed are located near the southern terminus of
the Great Miami River. Forests constitute less than 13% of the land use in the
watershed (USDA, 2010).
Table 2.1 – Land use in 2010 in the Great Miami River Watershed
Land Use Hectares
Urban areas 168,523
Forest 130,453
Grassland/shrub 9,093
Pasture/hay 160,574
Cultivated crops 528,774
Wetlands 791
Other (barren/fallow) 789
Source: USDA, 2010
2.2 Water quality and economic drivers in the Great Miami River Watershed
The Great Miami River Watershed is home to approximately 1.5 million people (US
Bureau of the Census, 2010). The population density in urban centers (shown in Map
2.2) and the high percentage of agricultural land use in the watershed both contribute
runoff to surface waters. According to the Ohio Department of Development (2010),
Ohio has the eighth largest economy in the United States with a GDP of $471.5
billion, or 3.33% of the United State’s GDP. Manufacturing is the largest industry in
Ohio. While agriculture (crop and animal production) is only 2.22% of Ohio’s GDP,
the net growth in agricultural has out-paced Ohio’s overall growth (ODD, 2010). In
2007, Ohio was the fifth ranked source for soybeans and the seventh ranked source
for corn with 7.5 and 4.1 percent, respectively, of national production (US Bureau of
the Census, 2008). Rowcrop production such as corn and soybeans can put pressure
on water resources and water quality if Best Mangement Practices (BMPs) to
conserve soil and reduce agricultural and urban runoff are not in place. Nonpoint
6
source (diffuse) pollution in general has been identified as the main source of
impairment throughout the Great Miami River Watershed resulting in over
enrichment of streams, excess sediment loading, and habitat alterations (OEPA,
2000).
In the U.S., states are required to assess surface waterbodies and report water quality
impairments to the U.S. Environmental Protection Agency (USEPA). To address
impaired waterbodies, states must analyze the sources of impairment and set a Total
Maximum Daily Load (TMDL) for pollutants of concern that the waterbody can
receive in order to meet an acceptable level of water quality. To date, the USEPA
(2011) identifies that in the Upper Great Miami River Watershed there are 25 TMDLs
for phosphorus, eight TMDLs for sediment and four TMDLs for nitrogen and two
sediment TMDLs in the Lower Great Miami River Watershed. Watersheds with
TMDLs must address the sources of pollution by setting allowable discharge limits
by sector (e.g., industrial, urban and agricultural). Water quality impairments and
TMDLs are one driver for the Great Miami River EPI pilot project to cost-effectively
meet the loading limits in TMDLs and address pollutant sources contributing to
water quality impairments.
Another water quality-related driver for this EPI has been developing in the
watershed for several years. Section 304(a) of the Federal Water Pollution Control
Act of 1972 (refered to herein as the Clean Water Act) identifies that USEPA and/or
delegated authorities shall develop numeric water quality criteria for all surface
waters (as seen in USEPA, 2000). In Ohio, the Ohio Enviromental Protection Agency
(OEPA) has been working on such standards since 2004. Permited point source
discharges in the Great Miami River anticipate that numeric standards for nutrients
will result in lower effluent limits of phosphorus and nitrogen in future permits. A
study completed by Kieser & Associates, LLC in 2004 found that a majority of the
WWTPs in the watershed would need to upgrade their treatment technology to
Biological Nutrient Removal (BNR) in order to meet the anticipated and more
stringent nutrient effluent limits (K&A, 2004). This study identified how both small
and large WWTPs may face high technology upgrade costs in the face of new
effluent limitations on nutrients.
7
Map 2.1 – Land use in the Great Miami River Watershed from USDA 2010 Cropland Data
Layer
Source: USDA Cropland Data, 2010

8
Map 2.2 – Census Tract Population Density in 2010 for Counties in the Great Miami River
Watershed
Source: U.S. Census Tract, 2010
9
3 Assessment Criteria
A number of indicators can be used to measure the success of an EPI. This summary
of assessment criteria discussed in Section 3 aims to answer the question of what
environmental outcomes this case study has produced and at what cost. Economic
efficiency and transaction costs are also explored in more detail.
3.1 Environmental outcomes
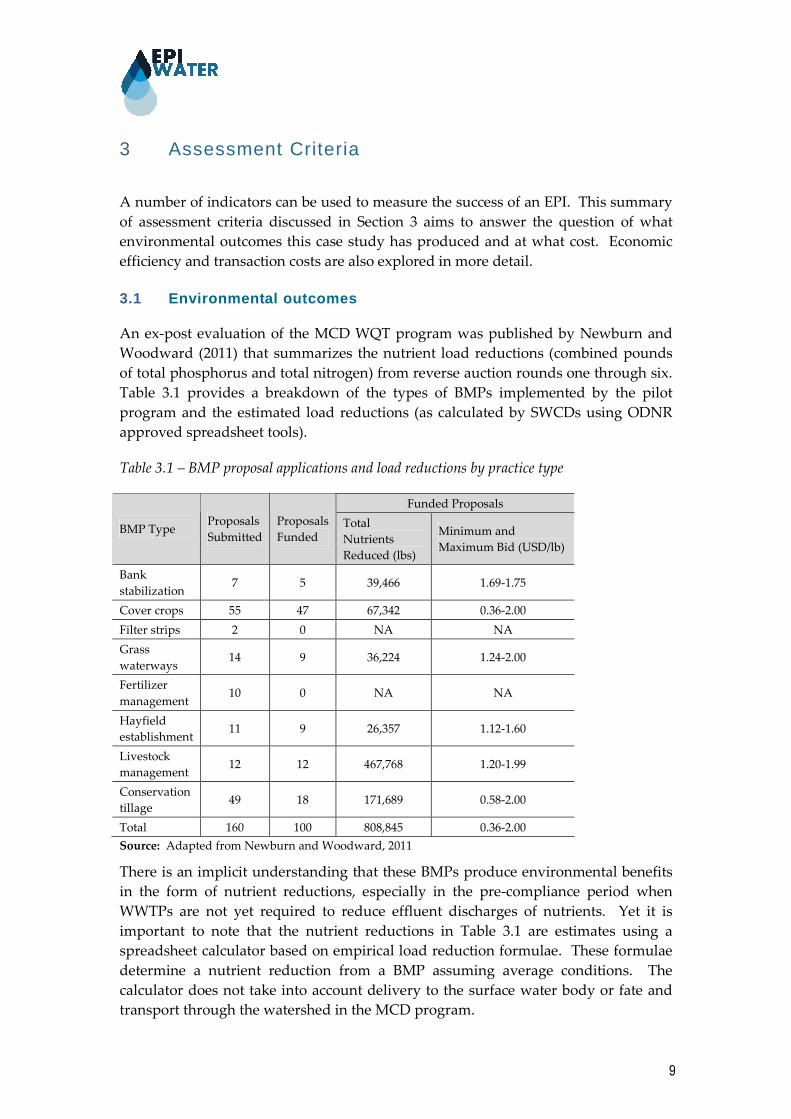
An ex-post evaluation of the MCD WQT program was published by Newburn and
Woodward (2011) that summarizes the nutrient load reductions (combined pounds
of total phosphorus and total nitrogen) from reverse auction rounds one through six.
Table 3.1 provides a breakdown of the types of BMPs implemented by the pilot
program and the estimated load reductions (as calculated by SWCDs using ODNR
approved spreadsheet tools).
Table 3.1 – BMP proposal applications and load reductions by practice type
Funded Proposals
BMP Type Proposals
Submitted
Proposals
Funded Total
Nutrients
Reduced (lbs)
Minimum and
Maximum Bid (USD/lb)
Bank
stabilization 7 5 39,466 1.69-1.75
Cover crops 55 47 67,342 0.36-2.00
Filter strips 2 0 NA NA
Grass
waterways 14 9 36,224 1.24-2.00
Fertilizer
management 10 0 NA NA
Hayfield
establishment 11 9 26,357 1.12-1.60
Livestock
management 12 12 467,768 1.20-1.99
Conservation
tillage 49 18 171,689 0.58-2.00
Total 160 100 808,845 0.36-2.00
Source: Adapted from Newburn and Woodward, 2011
There is an implicit understanding that these BMPs produce environmental benefits
in the form of nutrient reductions, especially in the pre-compliance period when
WWTPs are not yet required to reduce effluent discharges of nutrients. Yet it is
important to note that the nutrient reductions in Table 3.1 are estimates using a
spreadsheet calculator based on empirical load reduction formulae. These formulae
determine a nutrient reduction from a BMP assuming average conditions. The
calculator does not take into account delivery to the surface water body or fate and
transport through the watershed in the MCD program.
10
To better confirm water quality benefits, MCD does annual water quality sampling
throughout the watershed.
In addition to quantitative water quality benefits, the MCD WQT program has
identified several ancillary benefits trading can produce when compared to
technology upgrades at WWTPs alone. Many agricultural BMPs reduce sediment
loading to local streams and rivers that would otherwise not be contributed by or
regulated at a WWTP. Riparian BMPs and other upland BMPs result in improved
riparian and in-stream habitat. Riparian BMPs can also provide canopy that shades
streams and rivers and helps control in-stream temperature. Streambank
stabilization and velocity are also improved through select agricultural BMPs. WQT
also has the potential of increasing the geographic extent of many water quality
benefits when upstream trading in headwater streams is utilized. Instead of
implementing an improvement in water quality at the WWTP effluent discharge
location, this pilot program requires an equivalent or greater reduction in pollution
to occur upstream of the discharge point. In many cases this results in improved
stream conditions and water quality in sensitive headwater tributaries.
3.2 Economic Assessment Criteria
The MCD authorized an economic analysis of WQT in the Great Miami River
watershed in order to make an informed decision on the economic benefits of WQT
before developing a pilot program. K&A (2004) completed this preliminary
economic analysis and reported a substantial cost savings for WWTPs if they were to
purchase nutrient credits rather than upgrade plants to biological nutrient removal
(BNR) technology. Using the best available information at the time of the study and
reasonable assumptions, it was determined that treatment plant upgrades to BNR for
a majority of the WWTPs in the Great Miami River watershed would cost
approximately $422.5 million dollars (based on a 20 year investment and 5% interest
rate using 2003 US$). Assuming the WWTPs would have to meet a 1 mg/L
phosphorus and 10mg/L nitrogen limit, an equivalent amount of nonpoint source
nutrient credits would cost WWTPs approximately $37.8 million (based on no-till
practice costs) (K&A, 2004). This resulted in a projected cost-savings of
approximately $384.7 million.
One way in which the MCD and program decision-makers worked to make WQT
cost-effective was by selecting a reverse auction method for soliciting proposed
BMPs projects. This method has been employed in selecting projects in all ten
rounds of Request for Proposals (RFPs). Once all proposals are submitted, MCD
selects the lowest “bids” for BMP projects until all of the funds for that particular
round are committed. In an ex-post evaluation of the MCD WQT program,
Newburn and Woodward (2011) assessed the cost-efficiency of MCD’s reverse
auction method from the supply side of the market. According to their cost savings
metric, the average cost-savings for agricultural BMPs in round one was 32%. The
cost-savings decreased to 19% when rounds one through six were evaluated (see
Table 3.2). Newburn and Woodward (2011) suggest this was due to SWCDs learning
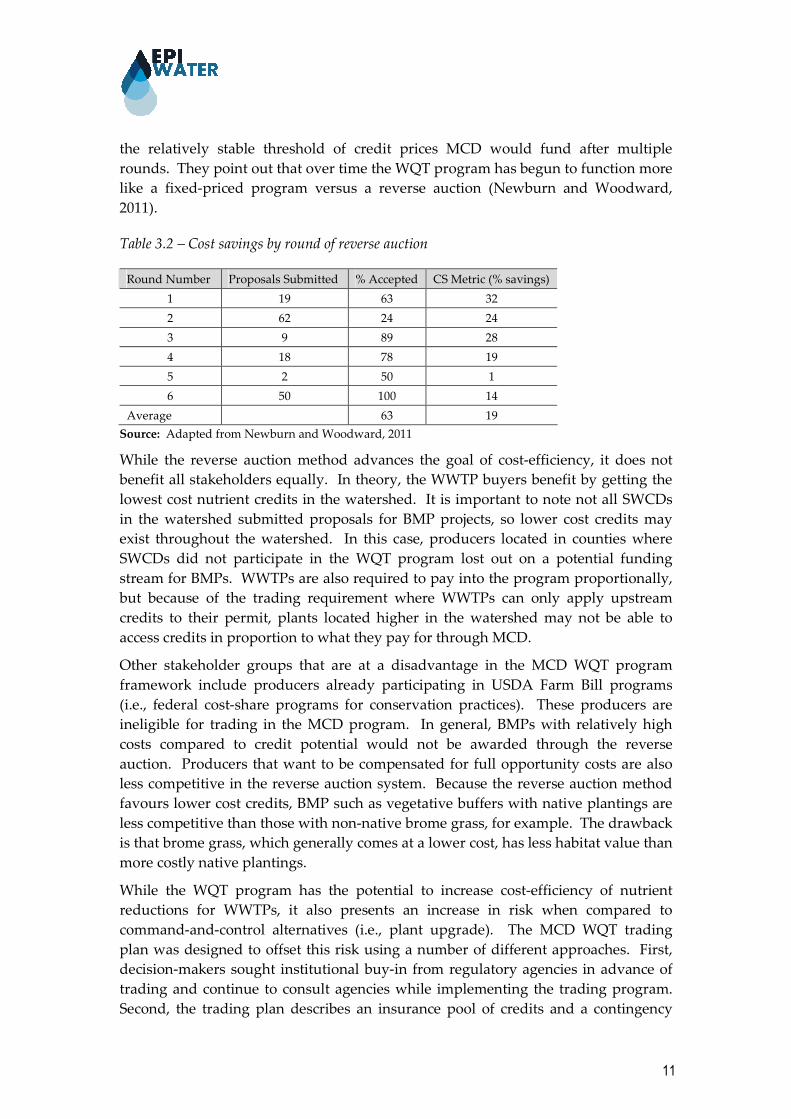
11
the relatively stable threshold of credit prices MCD would fund after multiple
rounds. They point out that over time the WQT program has begun to function more
like a fixed-priced program versus a reverse auction (Newburn and Woodward,
2011).
Table 3.2 – Cost savings by round of reverse auction
Round Number Proposals Submitted % Accepted CS Metric (% savings)
1 19 63 32
2 62 24 24
3 9 89 28
4 18 78 19
5 2 50 1
6 50 100 14
Average 63 19
Source: Adapted from Newburn and Woodward, 2011
While the reverse auction method advances the goal of cost-efficiency, it does not
benefit all stakeholders equally. In theory, the WWTP buyers benefit by getting the
lowest cost nutrient credits in the watershed. It is important to note not all SWCDs
in the watershed submitted proposals for BMP projects, so lower cost credits may
exist throughout the watershed. In this case, producers located in counties where
SWCDs did not participate in the WQT program lost out on a potential funding
stream for BMPs. WWTPs are also required to pay into the program proportionally,
but because of the trading requirement where WWTPs can only apply upstream
credits to their permit, plants located higher in the watershed may not be able to
access credits in proportion to what they pay for through MCD.
Other stakeholder groups that are at a disadvantage in the MCD WQT program
framework include producers already participating in USDA Farm Bill programs
(i.e., federal cost-share programs for conservation practices). These producers are
ineligible for trading in the MCD program. In general, BMPs with relatively high
costs compared to credit potential would not be awarded through the reverse
auction. Producers that want to be compensated for full opportunity costs are also
less competitive in the reverse auction system. Because the reverse auction method
favours lower cost credits, BMP such as vegetative buffers with native plantings are
less competitive than those with non-native brome grass, for example. The drawback
is that brome grass, which generally comes at a lower cost, has less habitat value than
more costly native plantings.
While the WQT program has the potential to increase cost-efficiency of nutrient
reductions for WWTPs, it also presents an increase in risk when compared to
command-and-control alternatives (i.e., plant upgrade). The MCD WQT trading
plan was designed to offset this risk using a number of different approaches. First,
decision-makers sought institutional buy-in from regulatory agencies in advance of
trading and continue to consult agencies while implementing the trading program.
Second, the trading plan describes an insurance pool of credits and a contingency
12
plant that will be operated once WWTPs engage in trading for compliance purposes.
The insurance pool of credits will be managed by MCD, in consultation with OEPA
and ODNR, to replace credits in the event of BMP failure. The contingency plan,
developed by MCD and maintained with input from ODNR, assures a timely,
coordinated and consistent response to BMP failure (MCD, 2011). This contingency
plan and individual BMP contracts include provisions related to recovery of funds
from failed BMPs.
The MCD WQT program provides good incentives to meet two prerequisites of a
successful nutrient credit market. In order to develop a market for nutrient credits,
there must be sufficient buyer demand for credits and a large enough cost margin
between trading and traditional command-and-control alternatives to attract buyers.
Since no definitive drivers were in place in the watershed when MCD initially
develop the WQT program (e.g., numeric water quality standards or restrictive
wasteload allocations), MCD provided buyers with a financial incentive to
participate in early, pre-compliance trading. MCD negotiated with OEPA that
WWTPs that purchased credits prior to a compliance driver would be guaranteed a
better trade ratio when purchasing credits in the future. Early participants are now
locked into a 1:1 trade ratio for buyers discharging to fully attaining waters and a 2:1
trade ratio for buyers discharging to impaired waters (MCD, 2011). For WWTPs that
purchase credits after the pre-compliance period, trade ratios will be 2:1 and 3:1,
respectively. The reverse auction method discussed in this section is the second
incentive MCD developed to attract buyers. By purchasing the lowest cost credits,
MCD is able to keep cost margins high enough to make trading more attractive to
WWTPs than traditional technology upgrades.
Due to the transparency MCD established at the outset of the WQT program,
asymmetric information was not an issue during initial rounds of reverse auctions.
In later rounds in could be argued that some county SWCDs were less astute at
getting the best information to producers on the expected level of payments MCD
would select during the reverse auction. This lack of knowledge on behalf of the
SWCDs and lack of information provided to producers in these counties could be
seen as asymmetric information. Newburn and Woodward (2011) point out that of
the fourteen eligible counties in the watershed, 78% of all proposals submitted in
rounds one through six came from three counties (Darke, Preble and Shelby). They
also note that these counties had a high rate of acceptance of their proposals, which
tended to increase in subsequent bidding rounds.
13
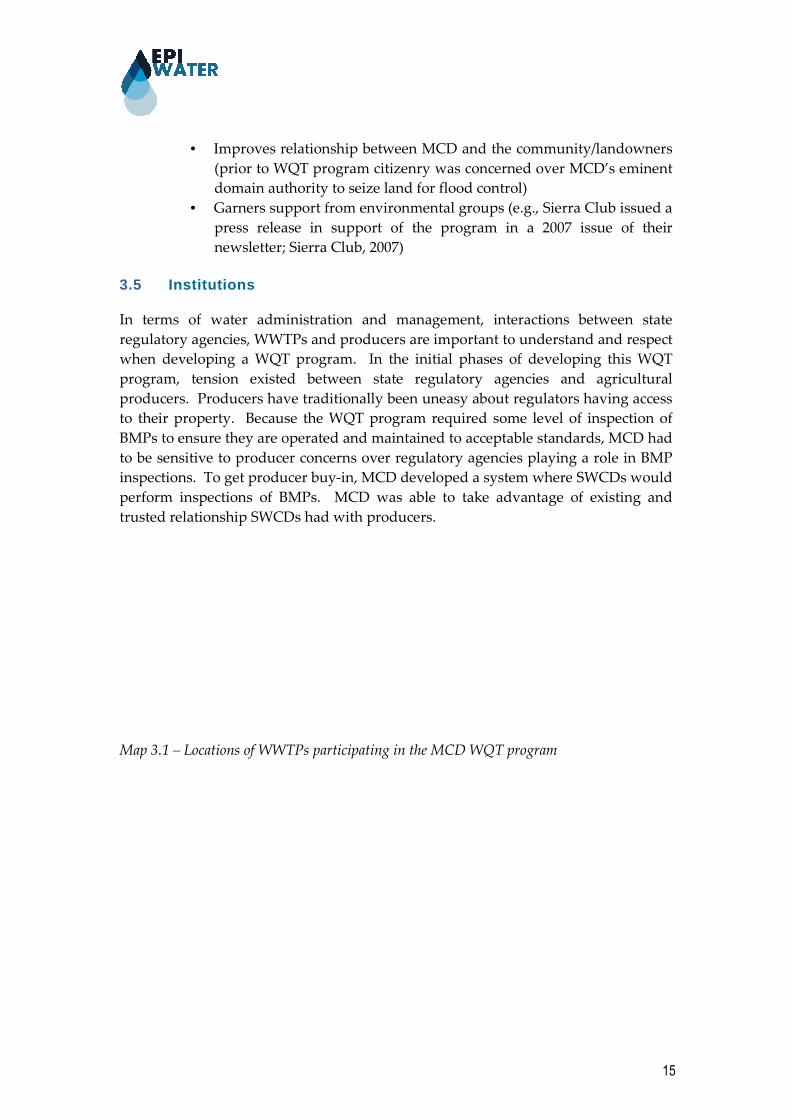
3.3 Distributional Effects and Social Equity
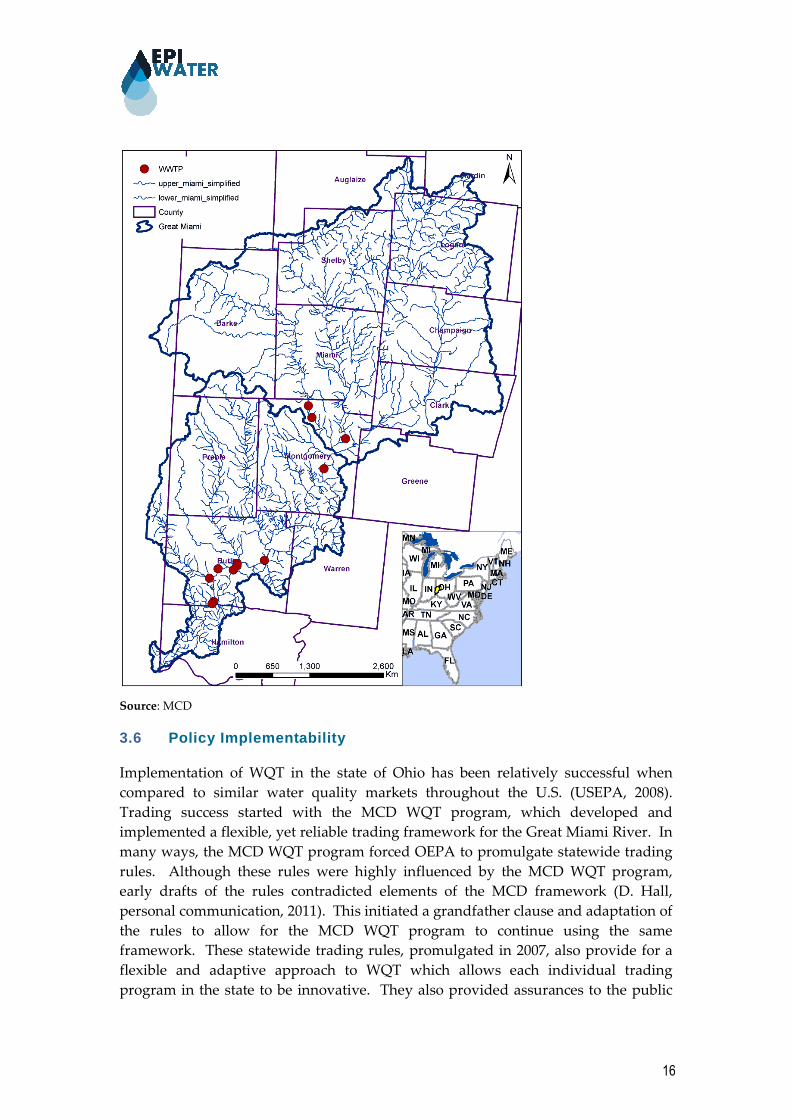
3.4 WQT provides a flexible and innovative means to realizing pollution reductions in a cost-effective manner. Social equity and even distribution of funding are not main tenants of WQT. This case study has already some of the program requirements and features that lead to targeted and uneven distribution of BMP projects. In the MCD WQT program, upstream trading is required of credit buyers (i.e., nonpoint source reductions must be generated upstream of a buyers discharge point). Due to this requirement, producers located below the group of WWTPs participating in the MCD WQT program are ineligible to sell credits in this limited pilot market. The locations of participating WWTPs are shown in Institutions
In terms of water administration and management, interactions between state
regulatory agencies, WWTPs and producers are important to understand and respect
when developing a WQT program. In the initial phases of developing this WQT
program, tension existed between state regulatory agencies and agricultural
producers. Producers have traditionally been uneasy about regulators having access
to their property. Because the WQT program required some level of inspection of
BMPs to ensure they are operated and maintained to acceptable standards, MCD had
to be sensitive to producer concerns over regulatory agencies playing a role in BMP
inspections. To get producer buy-in, MCD developed a system where SWCDs would
perform inspections of BMPs. MCD was able to take advantage of existing and
trusted relationship SWCDs had with producers.
Map 3.1. Another factor that limits producer participation on a spatial basis is the
requirement that county SWCDs must complete proposals on behalf of the producer
and submit them to MCD for the reverse auction. Not all SWCDs participated in the
WQT program. Table 3.3 from Newburn and Woodward (2011) provides a
breakdown of the proposals submitted to MCD during rounds one through six. As
previously mentioned, three of the county SWCDs (Darke, Preble and Shelby)
seemed to have higher success in getting proposals accepted and funded.

14
Table 3.3 – Proposal applications and percent acceptance by county and round number
(percent acceptance in parenthesis)
County Round 1 Round 2 Round 3 Round 4 Round 5 Round 6 Total
Butler 1 (0) 2 (50) 1 (0) 4 (25)
Clark 5 (40) 5 (40)
Darke 7 (100) 2 (100) 6 (100) 5 (100) 1 (100) 16 (100) 37 (100)
Logan 1 (100) 3 (100) 4 (100)
Mercer 1 (100) 9 (100) 10 (100)
Miami 1 (100) 1 (100) 4 (100) 1 (100) 7 (100)
Montgomery 2 (100) 2 (100)
Preble 54 (15) 54 (15)
Shelby 4 (0) 3 (67) 2 (50) 4 (100) 21 (100) 34 (85)
Warren 3 (33) 3 (33)
Total 19 (63) 62 (24) 9 (89) 18 (78) 2 (50) 50 (100) 160 (63)
Note: Five of the 15 eligible counties (Auglaize, Champaign, Hamilton, Hardin and Greene) did not
submit any applications
Source: Newburn and Woodward, 2011
Another factor influencing the sell side of the market (i.e., producers) is whether the
producer wants to be compensated for all of their BMP and opportunity costs. The
MCD WQT program is voluntary and encourages low cost credits from producers. If
a producer wants a particular BMP implemented at their farm because it will
increase quality of life or provide an improvement to their operations, the producer
can under price their BMP proposal to make it more competitive. Another inequality
for individual producers can occur if their local SWCD adds costs to the BMP
proposal to cover the cost of SWCD technical services. The MCD WQT program
allows SWCDs to decide on a case-by-case basis whether they want to add
compensation for technical services to the BMP proposal.
Overall, the EPI has had a very positive effect on the community. In addition to the
environmental outcomes and benefits discussed in Section 3.1, the MCD WQT
program has provided the following benefits to the watershed:
• Provides much needed funding to county SWCDs (which can add
administrative fees to producer bids)
• Provides additional funding to further implement agricultural BMPs
• Provides water quality data to state agencies which contributes to
more accurate development of water body load reduction needs
• WQT leverages funds to undertake watershed management functions
that would not otherwise be spent on nonpoint source nutrient
reductions
• Improves stakeholder interactions between the participating cities
(with WWTPs) and agricultural producers
• Political acceptance with state legislators supporting the program
15
• Improves relationship between MCD and the community/landowners
(prior to WQT program citizenry was concerned over MCD’s eminent
domain authority to seize land for flood control)
• Garners support from environmental groups (e.g., Sierra Club issued a
press release in support of the program in a 2007 issue of their
newsletter; Sierra Club, 2007)
3.5 Institutions
In terms of water administration and management, interactions between state
regulatory agencies, WWTPs and producers are important to understand and respect
when developing a WQT program. In the initial phases of developing this WQT
program, tension existed between state regulatory agencies and agricultural
producers. Producers have traditionally been uneasy about regulators having access
to their property. Because the WQT program required some level of inspection of
BMPs to ensure they are operated and maintained to acceptable standards, MCD had
to be sensitive to producer concerns over regulatory agencies playing a role in BMP
inspections. To get producer buy-in, MCD developed a system where SWCDs would
perform inspections of BMPs. MCD was able to take advantage of existing and
trusted relationship SWCDs had with producers.
Map 3.1 – Locations of WWTPs participating in the MCD WQT program
16
Source: MCD
3.6 Policy Implementability
Implementation of WQT in the state of Ohio has been relatively successful when
compared to similar water quality markets throughout the U.S. (USEPA, 2008).
Trading success started with the MCD WQT program, which developed and
implemented a flexible, yet reliable trading framework for the Great Miami River. In
many ways, the MCD WQT program forced OEPA to promulgate statewide trading
rules. Although these rules were highly influenced by the MCD WQT program,
early drafts of the rules contradicted elements of the MCD framework (D. Hall,
personal communication, 2011). This initiated a grandfather clause and adaptation of
the rules to allow for the MCD WQT program to continue using the same
framework. These statewide trading rules, promulgated in 2007, also provide for a
flexible and adaptive approach to WQT which allows each individual trading
program in the state to be innovative. They also provided assurances to the public
17
that nutrient reductions are real and surplus (beyond what was already required as
applicable to each credit seller).
In addition to influencing statewide trading rules, the MCD WQT program resulted
in cooperation and coordination between OEPA and ODNR, which did not happen
initially. The two state agencies now work collaboratively in overseeing different
aspects of the WQT program. Buy-in and support from OEPA and ODNR did much
to advance the WQT program and helped MCD gain broader buy-in from
stakeholders and credit buyers (D. Hall, personal communication, 2011). In addition
to agency support, MCD held more than 100 stakeholder meetings to engage
municipal buyers, agricultural sellers, federal agencies, environmental groups and
the general public to design a WQT program that would have wide support of
stakeholders. This included groups that might typically be opposed to market-based
approaches to nutrient reductions.
While MCD has experienced success with their WQT program, there are barriers that
have impeded expansion of the program. For instance, there is currently no
definitive driver in the watershed to drive demand for nutrient credits from point
source or other buyers. At the state and regional level numeric nutrient standards
have been lagging. In addition, a TMDL developed by OEPA for a sub-basin of the
Great Miami was determined to be flawed based on early WQT economic modelling
(K&A, 2004) and later on WQT program monitoring. OEPA eventually rescinded
this TMDL. These actions produce uncertainty in the market and work to lower
demand for nutrient credits.
3.7 Transaction Costs
Much of the start-up cost and initial program develop was heavily subsidized
through federal grants (D. Hall, personal communication, 2011). Newburn and
Woodward (2011) assessed the transaction costs for both search and bargaining and
monitoring and enforcement in their ex-post evaluation of the MCD WQT program.
Overall, they concluded that transaction costs do not create a considerable barrier to
market efficiency.
Newburn and Woodward (2011) go on to explain that the institutional framework of
the MCD WQT program is such that MCD acts as a clearinghouse for nutrient trades.
This design lowers the bargaining costs for trading since there is no contract between
buyer and seller that needs to be negotiated. In addition, the clearinghouse model
eliminates the cost to the buyer and seller incurred when searching for trading
partners. The reverse auction method also reduced transaction costs on the supply
side since BMP proposals are accepted or denied based solely on cost and credits
generated (Newburn and Woodward, 2011).
Another aspect of the trading program that Newburn and Woodward (2011) identify
as a way in which MCD gains cost-savings is by using the county SWCD offices to
recruit producers. They point out that SWCDs already have similar duties to provide
18
technical services to producers under larger federal conservation programs, therefore
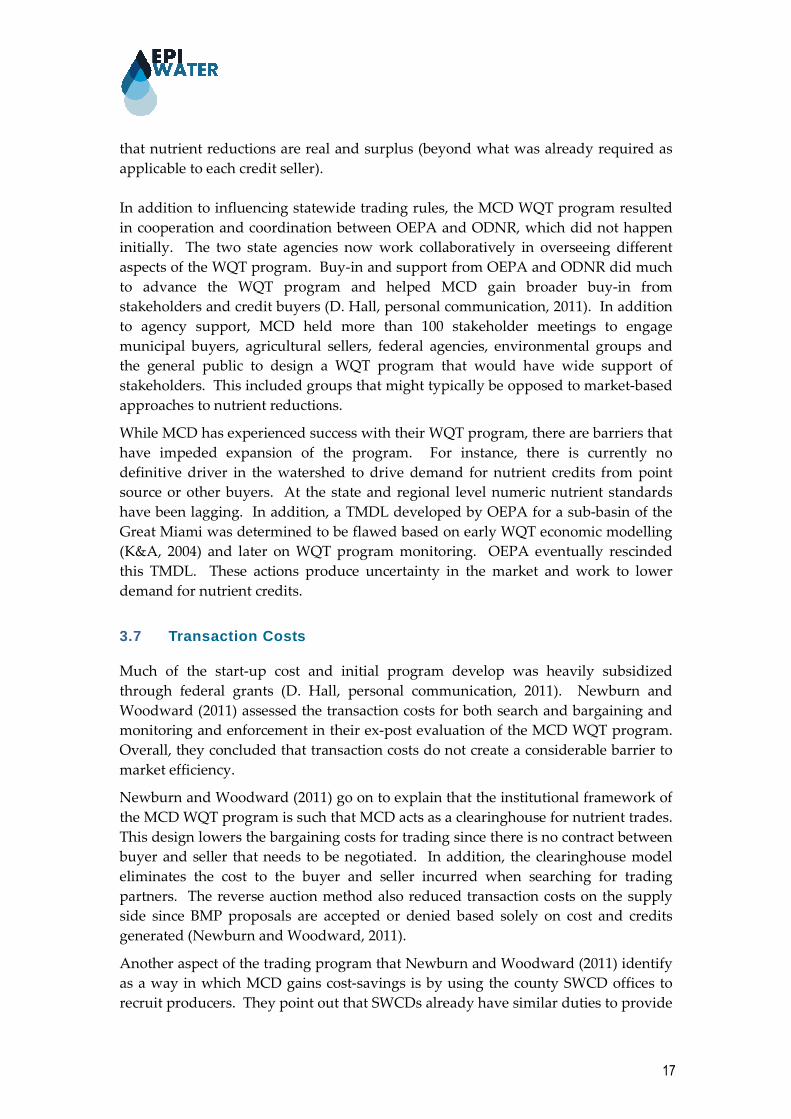
SWCD duties are not greatly expanded by participating in trading. A breakdown of
the costs for producer assistance (including recruitment, design/implementation,
credit calculations, and proposal preparation) and monitoring are presented in Table
3.4 after Newburn and Woodward, 2011. The SWCD cost assistance and monitoring
represent approximately 3.9% and 1.0% (respectively) of the over $1.3 million total
expenditures of the MCD (reported by Newburn and Woodward, 2011 after round
six).
Table 3.4 – Total program funds for producer assistance, BMP monitoring and producer
BMP payments in participating counties
County Funded
Projects
SWCD Initial
Assistance Cost
(USD)
SWCD Monitoring
Cost (USD)
Farmer
Payments
(USD)
Number of
SWCD Staff1
Butler 1 350 0 18,000 3
Clark 2 400 1,000 15,909 4.5
Darke 37 46,475 11,128 790,149 7
Logan 4 1,650 150 20,833 4.5
Mercer 10 0 0 23,927 5.5
Miami 6 1,125 625 57,085 5
Montgomery 2 1,900 100 15,855 6.5
Preble 8 800 1,000 20,329 5
Shelby 29 0 0 262,164 7
Warren 1 0 0 45,260 3
Total 100 52,700 14,003 1,269,511 51
Note: 1SWCD staff numbers were gathered by Newburn and Woodward, 2011 during in-person
interviews in June 2009. All other values are from the bid data provided by the MCD.
Source: Adapted from Newburn and Woodward, 2011
3.8 Uncertainty
In the evaluation of the MCD WQT program there are two forms of uncertainty that
exist. First, there is market uncertainty for potential credit buyers (i.e., point
sources). Second, there is uncertainty in data and credit calculation methods that
must be addressed through programmatic elements.
The regulatory climate in the U.S. is such that permitted point sources do not have
adequate knowledge of how future water quality regulations will affect their
operations. U.S. EPA and states have been working on developing numeric nutrient
criteria for over a decade with little success. This lack of certainty surrounding
future regulatory requirements for point sources results in market uncertainty for the
demand side of a WQT market.
One of the main objectives of WQT is to ensure real and surplus nutrient reductions
are taking place (i.e., water quality benefits). Under the current pilot program
19
setting, quantified nutrient load reductions (from ODNR-approved credit calculation
methods) are relatively imprecise. Nutrient load reductions are calculated using
simple empirical spreadsheet calculations.
Uncertainty increases substantially when trying to quantitatively estimate or
measure precise nutrient load reductions from nonpoint source BMPs when
compared to WWTP effluent monitoring. Because the MCD WQT program is still in
the pre-compliance phase, no credit discounting or modifications to trade ratios have
been employed to address this uncertainty. When WWTPs are under a compliance
regime, a 2:1 trade ratio will become the minimum trade ratio used for WWTPs
discharging to unimpaired waters and 3:1 for those discharging to impaired water
bodies. This will address some of the uncertainty related to estimating nutrient
reductions from BMPs, though only by assumption and not by statistical analysis of
this uncertainty.
4 Conclusions
MCD WQT program implementation has been successful in completing nutrient
credit trading between point sources and nonpoint sources. These trades have taken
place in a pre-compliance setting through a pilot program. Moving from pre-
compliance to post-compliance and increasing trading at scale may present both
benefits and challenges to WQT. The program has succeeded in implementing BMPs
that have explicit water quality benefits as well as other ancillary benefits. The
program has been shown to be cost-efficient due to BMP funding mechanisms and
the program framework. The program has been successful in working with existing
institutions and adapting to preferences of different sectors in order to build trust
between stakeholders (e.g., ensuring producers that site inspections would not be
conducted by regulatory agencies, putting them at higher enforcement risk). In
addition, Newburn and Woodward (2011) found the program transaction costs to be
relatively low. They attributed this to MCD’s ability to work with existing
agricultural technical service providers in the watershed and MCD’s clearinghouse
model which lowered search and bargaining costs.
In terms of economic efficiency, MCD has been successful for a number of reasons.
In an ex post evaluation of rounds one through six of RFPs, Newburn and
Woodward (2011) report that MCD funded BMPs at a substantial cost-savings
averaging 19%. This cost-efficiency is due to the reverse auction method used by
MCD. A study by K&A (2004) indicated that WWTPs have the potential to realize
substantial cost-savings using WQT instead of traditional technology upgrades to
meet more stringent effluent limits in permits in the future. While the MCD WQT
program has been highly subsidized by federal grants, the transaction costs have
been relatively low (Newburn and Woodward, 2011). Program staff anticipate costs
to continue to decrease in the future once the market grows with future demand (D.
Hall, personal communication, 2011).

20
4.1 Lessons learned
The MCD WQT program was designed for post-compliance nutrient credit trading
and was tested prior to this compliance stage using a pilot approach. The pilot
program provided useful insight into the general application of the EPI and its
transferability to other settings. A summary of the lessons learned is provided here
(from program staff, consultants and researcher observations).
Stakeholder collaboration was critical in the initial stages of program development.
This phase was, however, time intensive (D. Hall, personal communication, August
19, 2008). MCD convened more than 100 meetings from 2003-2005 and started a
committee for program decision-making. Stakeholder meetings involved cities and
counties with WWTPs, SWCDs, agricultural producers, OEPA, U.S. EPA, ODNR,
Ohio Farm Bureau, Chamber of Commerce, USDA and the Ohio Environmental
Council.
Minimum new bureaucracy was a strength of the program noted by MCD staff (D.
Hall, personal communication, August 19, 2008). The WQT program incorporated
existing state regulatory agencies and agricultural technical service providers into the
administrative process. In addition to these existing institutions, MCD acted as a
clearinghouse to negotiate and manage trades between point sources and nonpoint
sources. WWTPs typically do not have expertise or staff in these regards.
Partnering with existing agricultural organizations was key to agricultural producer
participation and lower transaction costs (D. Hall, personal communication, 2011;
Newburn and Woodward, 2011). Agricultural producers already had a level of trust
with SWCDs and expressed concerns in the initial program development phase
about state regulatory agencies having access to their private property. Using the
SWCDs resulted in better producer buy-in and helped lower transactions costs MCD
would otherwise incur if their own staff had to recruit producers to implement
BMPs.
In addition to “lessons learned”, MCD experienced a few unintended consequences
that were generally beneficially to the community. First, new relationships have
been formed as an outgrowth of the WQT program. These relationships between
cities and rural landowners have led to a collaborative branding campaign in the
watershed. Ten cities and approximately 100 miles of river are now part of “Ohio’s
Great Corridor”, which has led to rural land preservation and opportunities for new
recreational trails (D. Hall, personal communication, April 7, 2011). A copy of the
Ohio’s Great Corridor brochure is included in Annex I.
A second unintended benefit of WQT in the watershed has been MCD’s ability to
leverage additional funds and resources for general watershed management.
Without WQT it can be argued that many of the BMPs implemented through this
program would not have been implemented. The nutrient and sediment reductions,
21
in addition to other ancillary benefits discussed herein, are the direct result of the
MCD WQT pilot project. In addition, MCD has been collecting water quality
monitoring data throughout the watershed as part of the WQT program. These data
has been able to inform state agencies in developing better TMDLs for impaired
waters.
Even though the MCD WQT program has seen success in implementing WQT in the
Great Miami River Watershed, there are improvements that could be made to the
program, especially when transferring the EPI to different watersheds and local
markets. These include:
• Adoption and application of discount factors for nutrient credits, including
delivery, location and bioavailability factors.
• Independent, third-party oversight/inspection of agricultural BMPs
4.2 Enabling / Disabling Factors
There are a number of factors that helped enable MCD in developing a functioning
WQT pilot program. The factors, listed below are important considerations for other
watersheds interested in developing a point source/nonpoint source credit trading
market:
• MCD acted as a watershed champion to convene stakeholders and a decision-
making committee that was committed to developing a program with broad
buy-in and support. When WQT involves both point sources and nonpoint
sources, broad support is necessary to get participation in the market on both
the supply side and demand side. When regulated entities are involved the
program can get even more scrutiny and may require broader stakeholder
participation.
• WQT that involves agricultural producers has unique challenges in terms of
recruitment, establishing trusted relationships, ensuring BMP performance,
communication and contract negotiation. Taking advantage of existing
relationships between county SWCDs and producers was a key program
success for the MCD WQT program.
A number of factors serve as barriers for trading in the MCD WQT program
example. These disabling factors are also transferable to other settings and should be
considered in other watersheds developing WQT:
• The Great Miami River watershed, like many watersheds in the U.S. lacks
definitive drivers for water quality improvements, especially for point
sources dischargers. U.S. EPA and state agencies have been working towards
numeric nutrient criteria for rivers and lakes for over a decade with little
success. States have been slow to develop TMDLs for impaired waters that
would require point sources to reduce effluent discharges. It was envisioned
that these types of water quality standards would serve as substantial drivers
for WQT.
22
• Lack of numeric water quality criteria have led to a great deal of uncertainty
in the market for credit buyers. Until federal and state regulators can provide
a clear understanding to point sources on what standards and timeline they
will have to meet in the future, point sources will continue to be hesitant to
participate in WQT. This uncertainty makes quantifying economic benefits or
cost-efficiency of WQT versus traditional command-and-control approaches
difficult for point sources.
• For MCD, draft statewide trading rules initially contradicted some elements
of the MCD WQT program. This was overcome through a grandfather clause
included in the Ohio Trading Rules. In other states, lack of trading rules or
rigid, prescriptive rules or policies can serve as a barrier to WQT. WQT often
works best when local stakeholders can be innovative and flexible in drafting
a program framework that best fits their specific watershed setting. This local
flexibility can, however create barriers to broader geographic trading across
watersheds for far-field water quality issues. This is being realized
particularly for multi-state water bodies such as in the Ohio River Basin
where thirteen different states drain to the Ohio River including the Great
Miami.
5 References
Kieser & Associates, LLC (K&A), 2004, Preliminary Economic Analysis of Water
Quality Trading Opportunities in the Great Miami River Watershed, Ohio.
Prepared for the Miami Conservancy District.
Miami Conservancy District (MCD), 2005, Great Miami River Watershed Water
Quality Credit Trading Program Operations Manual. Water Conservation
Subdistrict of the Miami Conservancy District.
Newburn, David A., and Woodward, Richard T., 2011, An Ex Post Evaluation of
Ohio’s Great Miami River Water Quality Trading Program. Journal of the American
Water Resources Association (JAWRA) 1-14. DOI: 10.1111/j.1752.1688.2011.00601.x.
Ohio Department of Development (ODD), 2010, Gross Domestic Product of Ohio.
Policy Research and Strategic Planning, A State Affiliate of the U.S. Census Bureau.
Ohio Environmental Protection Agency (OEPA), 2000. Biological and Water Quality
Study of the Little Miami River Basin, 1998. OEPA Technical Report Number
MAS/1999-12-3.
Sierra Club, 2007, Water Quality Trading in Ohio
(http://ohio.sierraclub.org/central/2007-01_Trading.asp) accessed December 6, 2011.
US Bureau of the Census, 2008, Statistical Abstract of the United States: 2009 (128th
ed.). Washington, D.C.: The Bureau.
23
US Census Tract, 2010, 2010 Census Demographic Profiles
(http://2010.census.gov/2010census/data/) accessed October 27, 2011.
US Congress, 1972, Federal Water Pollution Control Act [as Amended Through P.L.
107-303, November 27.2002]. 33 U.S.C 1251 et seq.
USDA National Agricultural Statistics Service, 2010, 2010 Ohio Cropland Data Layer
and 2010 Indiana Cropland Data Layer (resolution: 30 m)
(http://datagateway.nrcs.usda.gov/) accessed October 25, 2011.
US EPA, 2000, Ambient Water Quality Criteria Recommendations; Information
Supporting the Development of State and Tribal Nutrient Criteria Rivers and
Streams in Nutrient Ecoregion VII, EPA 822-B-00-018, December 2000.
USEPA, 2003, Final Water Quality Trading Policy
(http://water.epa.gov/type/watersheds/trading/finalpolicy2003.cfm) accessed
November 27, 2011.
USEPA, 2008, EPA Water Quality Trading Evaluation Final Report, Promoting
Results through Evaluation. Prepared by Industrial Economics, Inc. for EPA Office
of Policy, Economics and Innovation. Contract EP-W-04-023.
USEPA, 2011, Surf Your Watershed Website (HUCs 05080001 and 05080002)
(http://iaspub.epa.gov/tmdl_waters10/attains_watershed.control?p_huc=05080001&
p_state=OH&p_cycle=&p_report_type=T
http://iaspub.epa.gov/tmdl_waters10/attains_watershed.control?p_huc=05080002&
p_state=OH&p_cycle=&p_report_type=T) accessed October 26, 2011.
24
6 Data Sources
Miami Conservancy District (MCD), 2005, Great Miami River Watershed Water
Quality Credit Trading Program Operations Manual. Water Conservation
Subdistrict of the Miami Conservancy District.
Newburn, David A., and Woodward, Richard T., 2011, An Ex Post Evaluation of
Ohio’s Great Miami River Water Quality Trading Program. Journal of the American
Water Resources Association (JAWRA) 1-14. DOI: 10.1111/j.1752.1688.2011.00601.x.
US Census Tract, 2010, 2010 Census Demographic Profiles
(http://2010.census.gov/2010census/data/) accessed October 27, 2011.
USDA National Agricultural Statistics Service, 2010, 2010 Ohio Cropland Data Layer
and 2010 Indiana Cropland Data Layer (resolution: 30 m)
(http://datagateway.nrcs.usda.gov/) accessed October 25, 2011.
USEPA, 2011, Surf Your Watershed Website (HUCs 05080001 and 05080002)
(http://iaspub.epa.gov/tmdl_waters10/attains_watershed.control?p_huc=05080001&
p_state=OH&p_cycle=&p_report_type=T
http://iaspub.epa.gov/tmdl_waters10/attains_watershed.control?p_huc=05080002&
p_state=OH&p_cycle=&p_report_type=T) accessed October 26, 2011.