delivering our strategy - bt plc · pdf file · 2016-02-12delivering our strategy...
TRANSCRIPT

21The Strategic ReportDelivering our strategy
Deliv
erin
g ou
r str
ateg
y
We assess and e plain the performance of the group and the lines of business using certain alternative performance measures. 57 For further details, see page
Delivering our strategyThis section e plains how we are organised to deliver our strategy. We describe the importance of our people, assets and resources in making this happen. We provide information on the products and services we sell. We e plain the di erent customers and markets we serve, the trends we are seeing in our markets and how each of our lines of business performed this year. We also e plain our human rights policy, the regulatory environment and risks that a ect us.
22 Operating Committee
23 Our business model
24 Our people
26 Our assets and resources26 Brand and reputation26 etworks and platforms27 roperties28 Innovation29 Suppliers
30 Our lines of business30 ow we are organised31 BT Global Services34 BT Business38 BT Consumer41 BT Wholesale44 Openreach46 BT Technology, Service Operations
48 Human rights
48 Regulation48 uropean Union regulation48 UK regulation 49 Overseas regulation
50 Our risks50 rincipal risks and uncertainties50 ow we manage risk51 Our principal risks55 Risk case-studies
Revisions made to line of business resultsective from 1 April 2013 we made a number of changes
that simplify our internal trading and more closely align our line of business results with our regulatory accounts. Comparative
nancial results for each line of business for 2012 13 and 2011 12 have been restated to be on a consistent basis throughout this Annual Report. There was no impact on the group results from these changes. See page 127 for further details.

22 The Strategic ReportDelivering our strategy
Operating Committee
Gavin Pattersona
Chief ExecutiveAppointed Chief ecutive in September 2013. Gavin was formerly C O, BT Retail and prior to that Managing Director, BT Consumer, BT Retail.
Tony Chanmugama Group Finance DirectorAppointed Group Finance Director in December 2008. Tony was formerly CFO, BT Retail and Managing Director, BT nterprises.
Luis Alvarez CEO, BT Global ServicesAppointed C O, BT Global Services in October 2012. uis was formerly president of the urope, Middle ast, Africa and atin America operations of BT Global Services. Before joining BT, uis worked at
ricsson, IBM and Group Santander.
Clare Chapman Group People DirectorAppointed Group eople Director in October 2011. Before joining BT, Clare was director general of workforce for the S and Social Care at the Department of ealth. Clare was also previously group personnel director at Tesco.
John Petter CEO, BT ConsumerAppointed C O, BT Consumer in September 2013. ohn was formerly Managing Director, BT Consumer, BT Retail and prior to that Chief Operating O cer in BT Consumer. Before joining BT, ohn held roles as marketing and commercial director at Telewest (now irgin Media) and brand manager at rocter Gamble. a Directors of BT roup plc. ou will nd their full biographies on pages 78 and 7 .
b ou will nd more information on the ndertakings on page 4 .
Clive Selley CEO, BT Technology, Service & Operations and Group CIOAppointed C O, BT Technology, Service Operations in anuary 2013. Clive was formerly C O, BT Innovate Design and prior to that resident of ortfolio Service Design. Clive joined BT in 1986 and has held positions in most of BT s lines of business.
Nigel Stagg CEO, BT WholesaleAppointed C O, BT Wholesale in September 2011. igel was formerly Managing Director, BT Business, BT Retail and prior to that Managing Director, Customer Service, BT Retail. igel joined BT in 1979 and has held a wide range of roles including C O, BT Conferencing.
Graham Sutherland CEO, BT BusinessAppointed C O, BT Business in September 2013. Graham was formerly Managing Director, BT Business, BT Retail and prior to that C O of BT Ireland. Before joining BT, Graham held a number of senior management positions including managing director of T in the Republic of Ireland.
Joe Garner – InviteeCEO, OpenreachAppointed C O, Openreach in February 2014. Before joining BT, oe was head of the UK bank at SBC. oe has e tensive e perience
in customer service and programme delivery. The C O of Openreach cannot be a member of the Operating Committee under the provisions of the Undertakings.b
The Operating Committee is responsible for running our business and delivering our strategy. It monitors the groups nancial, operational and customer service performance and has cross-business oversight of the lines of business. It also reviews the groups key risks and considers the potential threats to and opportunities for the business. The Operating Committee develops BT s strategy and budgets for the Board s approval recommends to the Board capital e penditure and investment budgets allocates resources across BT within plans
agreed by the Board prepares and delivers major programmes and reviews the senior talent base and succession arrangements. The Operating Committee can approve, up to certain limits which are set by the Board, capital e penditure, disposals of ed assets, investments and divestments. It can, and has, delegated some of these approvals to sub-committees, such as the Design Council, and to senior e ecutives. The Company Secretary attends all meetings of the Operating Committee.
The key management committee is the Operating Committee, which meets weekly and is chaired by the Chief ecutive. Brief details of its members are set out below.
Invitee

23The Strategic ReportDelivering our strategy
Deliv
erin
g ou
r str
ateg
y
Our business model delivers value to shareholders, customers and society while allowing us to reinvest in the business and ful l our purpose.
Our business model
What sets us apartOur business model starts with the things that set us apart from our competitors. We have a uni ue combination of people, technology and networks which we bring together to create and deliver our products and services. And we have the nancial strength to invest in all of these to make sure we stay ahead of the competition.
Our people are key to the success of our business. You can nd more on their skills and capabilities and the investments we are making in them on page 24. The assets and resources that help us deliver our strategy and support our business model are described on page 26.
We make money by selling our products and services in the UK and around the world through our customer-facing lines of business. Our products range from telephony and broadband services for UK households through to managing the networks and communications needs of some of the world s largest multinational companies. We sell through a range of channels including online, contact centres and desk or eld-based account managers. Our revenue is mostly subscription or contract-based. eople, households and SM s pay for standalone or bundled services on a monthly, uarterly or annual basis (typically on 12-24 month contracts). arge corporate and public sector customers usually buy managed networked IT services on contracts spanning several years. Contract durations with our wholesale customers range from just one month for regulated products, to ve years or more for major managed services deals.
Delivering valueThe three foundations of our strategy customer service delivery, cost transformation and investing for the future are central to our business model.
Good customer service helps cost transformation. Reducing the number of times things go wrong means the service we provide to our customers is better and we spend less time and money putting things right. The savings from transforming our costs are used to make long-term investments in the future of our business and in the things that set us apart from our competitors.
The cash we generate from selling our products and services gives us the nancial strength to reward our shareholders. It allows us to reward our
people and ful l our nancial obligations to our pension scheme, our suppliers and our lenders.
But it is not just about the nancial value that we create. What we do matters. We make connections, create new possibilities and deliver value to individuals, families, businesses, our communities, and society in general. We help millions of people communicate, be entertained, do business and generally live their lives. In doing so, we ful l our purpose of using the power of communications to make a better world.
We believe our business model is sustainableWe see more and more demand for our products and services because they play such an integral role in modern life.
owever, communications markets are very competitive, particularly in the UK. We make sure we are on top of market and competitive trends through dedicated insight teams. Our nterprise Risk Management framework (see page 50) helps us identify and mitigate the challenges and risks we face. And we use governance committees to make sure that the investments we make are appropriate and will deliver products and services that are attractive to customers.
We are con dent our business model is sustainable and that we will be able to deliver value both today and in the future.
Customer service delivery
nvesting for the future
Cost transformation
Deliveringvalue
Shareholders
Customers
Society
Financial strength
People
Technology
Networks
Products and
services
Deliv
erin
g ou
r str
ateg
y

24 The Strategic ReportDelivering our strategy
Our peoplevery day our people touch the lives of millions,
providing services that help customers get the most out of their work and personal lives. We invest in our people so they can succeed and contribute to our business.
Believing in what we doA clear purpose guides everyone s contribution in BT. By bringing together the best networks, technology and products and services for our customers, we use the power of communications to make a better world.
During the year we updated our corporate values to re ect what really matters to our people. Teams are increasingly using these values to guide the way they work, creating a culture that encourages everyone to get involved in changing things for the better.
A global workforceAt 31 March 2014, we had 87,800 full-time e uivalent employees in 61 countries 72,200 of them based in the UK. We are the 15th largest employer in the UK, supporting its economy by providing jobs and income.
We recruited around 8,100 people in the year. Of these, around 4,800 were in the UK and include around 1,400 engineers (500 of whom are former armed-forces personnel) and over 600 apprentices. We created over 500 new roles in the UK which were previously undertaken by agency or o shore resources. And outside the UK we insourced a further 2,200 roles. Meanwhile, we have increased our workforce by 60% in the high-growth regions that we are investing in, with around 500 recruited into our global development centres in India and Malaysia.
Overall, the recruitment of new people was o set by reductions as a result of natural attrition, our restructuring programme and e ciencies.
External hires (full-time equivalents)Year ended 31 March
2012 2013 2014
UK Non-UK
0
1
2
3
4
5
6
7
8
9000
We continue to build a pipeline of future talent and plan to recruit around 900 graduates and apprentices in 2014 15. And as part of Movement to Work , a UK employer-led initiative backed by the rince s
Trust and the Government, we are o ering up to 1,500 work placements to 18-24 year-olds.
When a role is no longer needed, our transition centre helps the individual learn new skills and nd alternative roles in the business, rather than being made redundant. This year around 2,500 people were retrained and redeployed in this way.
Diversity at workroactive policies on inclusion and diversity help us deliver against the
needs of a varied customer and supplier base. More than 6,000 of our people belong to internal employee networks that re ect the diversity of our workforce women ethnic minorities disability lesbian, gay, bise ual and transgender Christian Muslim and carers. As a Two Ticks employer (awarded by obcentre lus to UK employers who have made certain commitments), we have well established policies and practices to support the recruitment, development and retention of people with disabilities. Applicants with disabilities or long-term health conditions and who meet the minimum criteria for the vacancy are automatically put through to the rst stage of the recruitment process.
We are rated in the Top 10 private sector organisations for both ethnicity and gender diversi cation as benchmarked by Business in the Community. Our declared disability rate is 5%, with 8% of this year s graduate recruits registered as disabled.
We are listed in The Times Top 50 places for Women to Work. Our gender diversity policy for the BT Board is to aim to have at least 25% female representation. For most of the year we had at least 30% female representation on the Board. At the year-end this had declined to 22% (two female directors out of a Board of nine) following the retirement of
atricia ewitt in March 2014. We will look to address this in line with our diversity policy. We describe the composition of the Board in the Governance section on page 86.
Below Board level, 573 (20%) of our senior e ecutives are female with 2,353 (80%) male. We are focused on appointing more women into operational roles at senior manager level. Across the company, 18,400 (21%) of our people are women and 69,400 (79%) are male in a sector that has traditionally been male-dominated.
TeamWe help each other achieve
more
HonestyWe are
honest and respectful
CustomerWe are here
for our customers
PrideWe are proud
to make a di erence
ChangeWe all
make change happen
25The Strategic ReportDelivering our strategy
Deliv
erin
g ou
r str
ateg
y
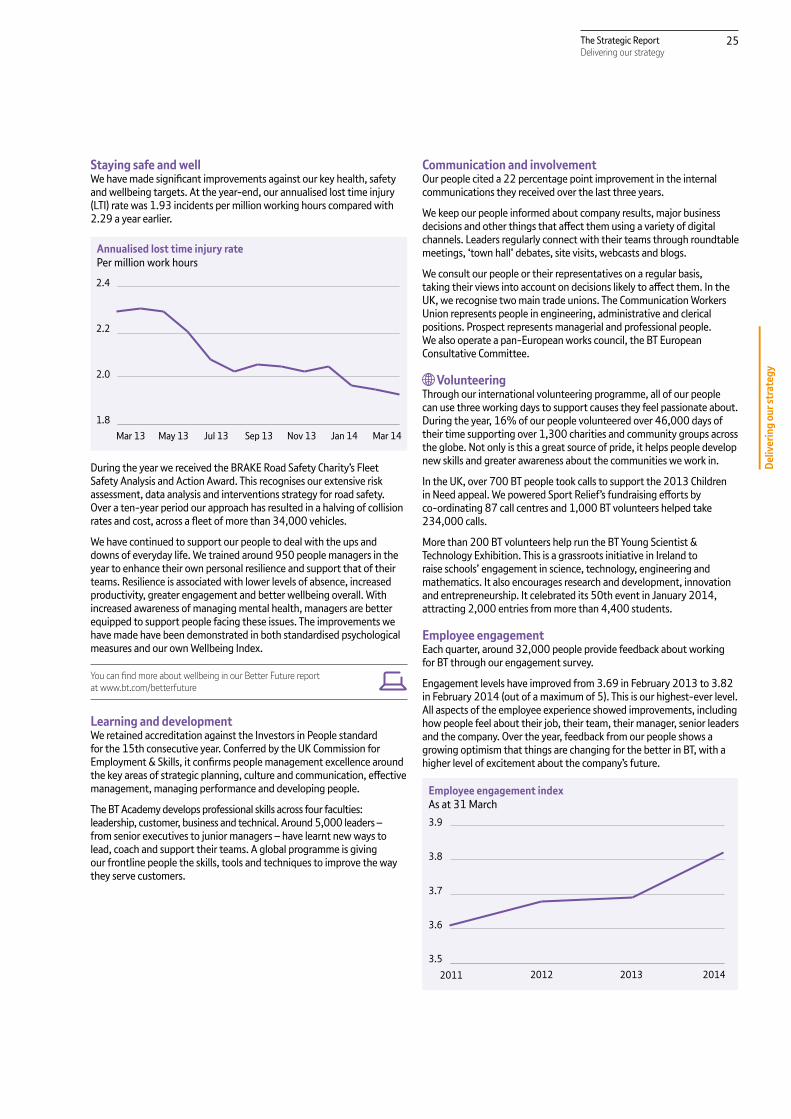
Staying safe and wellWe have made signi cant improvements against our key health, safety and wellbeing targets. At the year-end, our annualised lost time injury ( TI) rate was 1.93 incidents per million working hours compared with 2.29 a year earlier.
Annualised lost time injury ratePer million work hours
May 13 Sep 13Mar 13 Jul 13 Nov 13 Jan 14 Mar 141.8
2.0
2.2
2.4
During the year we received the BRAK Road Safety Charity s Fleet Safety Analysis and Action Award. This recognises our e tensive risk assessment, data analysis and interventions strategy for road safety. Over a ten-year period our approach has resulted in a halving of collision rates and cost, across a eet of more than 34,000 vehicles.
We have continued to support our people to deal with the ups and downs of everyday life. We trained around 950 people managers in the year to enhance their own personal resilience and support that of their teams. Resilience is associated with lower levels of absence, increased productivity, greater engagement and better wellbeing overall. With increased awareness of managing mental health, managers are better e uipped to support people facing these issues. The improvements we have made have been demonstrated in both standardised psychological measures and our own Wellbeing Inde .
ou can nd more about wellbeing in our Better Future report at www.bt.com betterfuture
Learning and developmentWe retained accreditation against the Investors in People standard for the 15th consecutive year. Conferred by the UK Commission for
mployment Skills, it con rms people management e cellence around the key areas of strategic planning, culture and communication, e ective management, managing performance and developing people.
The BT Academy develops professional skills across four faculties leadership, customer, business and technical. Around 5,000 leaders from senior e ecutives to junior managers have learnt new ways to lead, coach and support their teams. A global programme is giving our frontline people the skills, tools and techni ues to improve the way they serve customers.
Communication and involvementOur people cited a 22 percentage point improvement in the internal communications they received over the last three years.
We keep our people informed about company results, major business decisions and other things that a ect them using a variety of digital channels. eaders regularly connect with their teams through roundtable meetings, town hall debates, site visits, webcasts and blogs.
We consult our people or their representatives on a regular basis, taking their views into account on decisions likely to a ect them. In the UK, we recognise two main trade unions. The Communication Workers Union represents people in engineering, administrative and clerical positions. Prospect represents managerial and professional people. We also operate a pan- uropean works council, the BT uropean Consultative Committee.
VolunteeringThrough our international volunteering programme, all of our people can use three working days to support causes they feel passionate about. During the year, 16% of our people volunteered over 46,000 days of their time supporting over 1,300 charities and community groups across the globe. Not only is this a great source of pride, it helps people develop new skills and greater awareness about the communities we work in.
In the UK, over 700 BT people took calls to support the 2013 Children in Need appeal. We powered Sport Relief s fundraising e orts by co-ordinating 87 call centres and 1,000 BT volunteers helped take 234,000 calls.
More than 200 BT volunteers help run the BT Young Scientist Technology hibition. This is a grassroots initiative in Ireland to raise schools engagement in science, technology, engineering and mathematics. It also encourages research and development, innovation and entrepreneurship. It celebrated its 50th event in January 2014, attracting 2,000 entries from more than 4,400 students.
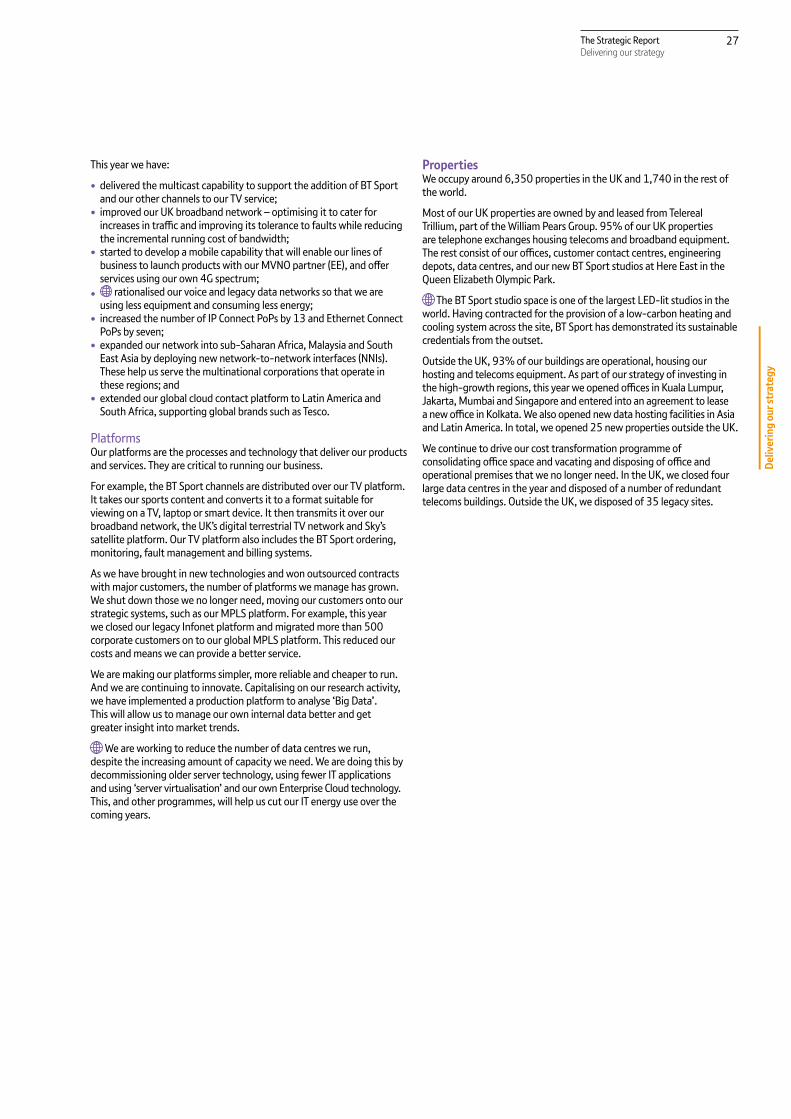
Employee engagementach uarter, around 32,000 people provide feedback about working
for BT through our engagement survey.
ngagement levels have improved from 3.69 in February 2013 to 3.82 in February 2014 (out of a ma imum of 5). This is our highest-ever level. All aspects of the employee e perience showed improvements, including how people feel about their job, their team, their manager, senior leaders and the company. Over the year, feedback from our people shows a growing optimism that things are changing for the better in BT, with a higher level of e citement about the company s future.
Employee engagement indexAs at 31 March
2011 20132012 20143.5
3.6
3.7
3.8
3.9

26 The Strategic ReportDelivering our strategy
We engage with our people in di erent ways to improve the business. For e ample, 783 teams entered our annual Customer Challenge Cup competition working on projects to improve local processes and service for customers. The teams identi ed an £80m bene t from cost reduction, cost avoidance and revenue generation, which will also improve customer satisfaction.
Using employee input, we are transforming the way we provide human resources support. A redesigned online portal will give easy access globally to the services people need, saving administration time.
Pay and bene tsWe compare salaries with other companies in our markets to make sure our packages are competitive. In the UK, pay for the vast majority of our engineering and support people is determined by collective bargaining, with fair terms and conditions for all. Managers pay and bonuses are linked to business performance and their personal contribution.
Our e ecutives are o ered long-term incentives to align their reward with the creation of shareholder value. The amount ultimately received depends on BT s performance over a three-year period. In accordance with our regulatory obligations, incentives for senior leaders in Openreach are tied to its business performance rather than that of the wider group.
We also provide pension and retirement bene ts in addition to statutory retirement arrangements.
ou can nd details of the BT Pension Scheme and other retirement plans on page
69
Sharing in successAround 60% of our people take part in one or more of BT s savings-related share option plans (saveshare), which operate in over 25 countries.
In August 2013, almost 12,000 people bene ted from saveshare, receiving, on average, BT shares worth almost £5,000 a gain of around £2,800. In August 2014, over 22,000 people in our 2009
ve-year plan could each receive shares worth over £48,000 on average (based on the share price as at 31 March 2014). We believe this will be one of the largest ever payouts by a UK plc for an all-employee saveshare scheme.
Our assets and resourcesThese are what we need to help us deliver our strategy. Many of them set us apart from our competitors and give us an advantage in our markets.
Brand and reputationOur brand is one of our most important assets. We have seen further e ternal recognition of this over the last year.
In 2013 we were included for the rst time in the global Brand survey, conducted by WPP. It ranked BT as the seventh most valuable brand in the UK and the 94th most valuable brand in the world. The survey measures customer perception, reputation and future potential and placed the value of our brand at US 9.5bn.
Since then, the value of our brand has grown by 61%. The latest Brand ranking, released in May 2014, puts our brand value at US 15.4bn.
Our partnership with ondon 2012 strengthened our brand, helping people to see BT in a di erent, more positive light. Building on that platform, this year saw further major developments which improved perceptions of our brand. These include the launch of BT Sport and our high pro le and rapid rollout of bre broadband across the UK. Together with our investments in the high-growth regions of the world, many commentators and customers have begun to see BT di erently.
Networks and platformsNetworksOur networks are the foundation of the products and services our customers rely on around the world.
The scale and reach of our global network, which provides service to more than 170 countries, is a key competitive di erentiator. Our major global asset is our multi-protocol label switching (MP S) platform, which is designed to carry di erent network services over one common infrastructure. From this platform we o er our most popular virtual private network ( PN) services to corporate customers.
We continue to e pand our global IP change footprint (GIP ). We have over 400 networks connected globally to it and this year we launched a new node in Miami. IP change now supports D voice services and we plan to add new features such as 4G mobile connectivity and global wi- roaming. This service, which supported over 14bn voice minutes worldwide this year, received the Queen s Award for nterprise 2014 Innovation in April 2014.
We have an e tensive broadband satellite network. This helps us serve our multinational customers when they need connectivity in remote locations. ong-term leased bre and points of presence (PoPs) support additional international services.
Within individual countries, we have e tensive networks in the UK, as well as in Germany, Italy, the Netherlands, the Republic of Ireland and Spain.
We o er our widest range of network services, access technologies and coverage in the UK. Our ed-line network is one of our most valuable assets and our bre broadband investment is key to sustaining its value for the UK. We have over 5m BT Wi- hotspots to which our broadband customers have unlimited access. We are also continuing to grow our thernet footprint in response to strong demand and growing data tra c.
27The Strategic ReportDelivering our strategy
Deliv
erin
g ou
r str
ateg
y
This year we have
delivered the multicast capability to support the addition of BT Sport and our other channels to our T service
improved our UK broadband network optimising it to cater for increases in tra c and improving its tolerance to faults while reducing the incremental running cost of bandwidth
started to develop a mobile capability that will enable our lines of business to launch products with our M NO partner ( ), and o er services using our own 4G spectrum
rationalised our voice and legacy data networks so that we are using less e uipment and consuming less energy
increased the number of IP Connect PoPs by 13 and thernet Connect PoPs by seven
e panded our network into sub-Saharan Africa, Malaysia and South ast Asia by deploying new network-to-network interfaces (NNIs).
These help us serve the multinational corporations that operate in these regions and
e tended our global cloud contact platform to atin America and South Africa, supporting global brands such as Tesco.
PlatformsOur platforms are the processes and technology that deliver our products and services. They are critical to running our business.
For e ample, the BT Sport channels are distributed over our T platform. It takes our sports content and converts it to a format suitable for viewing on a T , laptop or smart device. It then transmits it over our broadband network, the UK s digital terrestrial T network and Sky s satellite platform. Our T platform also includes the BT Sport ordering, monitoring, fault management and billing systems.
As we have brought in new technologies and won outsourced contracts with major customers, the number of platforms we manage has grown. We shut down those we no longer need, moving our customers onto our strategic systems, such as our MP S platform. For e ample, this year we closed our legacy Infonet platform and migrated more than 500 corporate customers on to our global MP S platform. This reduced our costs and means we can provide a better service.
We are making our platforms simpler, more reliable and cheaper to run. And we are continuing to innovate. Capitalising on our research activity, we have implemented a production platform to analyse Big Data . This will allow us to manage our own internal data better and get greater insight into market trends.
We are working to reduce the number of data centres we run, despite the increasing amount of capacity we need. We are doing this by decommissioning older server technology, using fewer IT applications and using server virtualisation and our own nterprise Cloud technology. This, and other programmes, will help us cut our IT energy use over the coming years.
PropertiesWe occupy around 6,350 properties in the UK and 1,740 in the rest of the world.
Most of our UK properties are owned by and leased from Telereal Trillium, part of the William Pears Group. 95% of our UK properties are telephone e changes housing telecoms and broadband e uipment. The rest consist of our o ces, customer contact centres, engineering depots, data centres, and our new BT Sport studios at ere ast in the Queen li abeth Olympic Park.
The BT Sport studio space is one of the largest D-lit studios in the world. aving contracted for the provision of a low-carbon heating and cooling system across the site, BT Sport has demonstrated its sustainable credentials from the outset.
Outside the UK, 93% of our buildings are operational, housing our hosting and telecoms e uipment. As part of our strategy of investing in the high-growth regions, this year we opened o ces in Kuala umpur, Jakarta, Mumbai and Singapore and entered into an agreement to lease a new o ce in Kolkata. We also opened new data hosting facilities in Asia and atin America. In total, we opened 25 new properties outside the UK.
We continue to drive our cost transformation programme of consolidating o ce space and vacating and disposing of o ce and operational premises that we no longer need. In the UK, we closed four large data centres in the year and disposed of a number of redundant telecoms buildings. Outside the UK, we disposed of 35 legacy sites.

28 The Strategic ReportDelivering our strategy
InnovationBT has a long heritage of innovation, from our roots as The lectric Telegraph Company in 1846, as the General Post O ce (GPO) and since privatisation in 1984. We pioneered many of the technologies that our business is now reliant upon. For e ample, in 1926 the world s
rst two-way, trans-Atlantic conversation by radio telephone was established from our wireless station near Rugby. And in 1943, Tommy Flowers, working in the telecommunications division of the GPO, developed the world s rst programmable electronic computer, Colossus. In 1968, we installed the worlds rst digital telephone e change. In 1980, we demonstrated the world s rst optical bre submarine cable. And in 1984, we launched the rst commercial 140Mbps single-mode optical bre link which pioneered the basis of our global and
bre broadband networks.
We were also at the forefront of de ning the global IP and broadband standards which mean our networks are capable of supporting the advanced video, business and internet services we have today. Innovation, supported by our global research and development (R D), enables us to create the new services that customers want. It also helps us nd new ways of doing things that will improve our e ciency and reduce costs.
We are one of the largest investors in R D in the UKa and are the second largest investor in R D in the telecoms sector in the worldb. Since 1990, we have had over 10,000 patents granted. This year we increased our ling rate and have led patent applications for 89 inventions (2012 13 69). We routinely seek patent protection in di erent countries and at 31 March 2014 we had a worldwide portfolio of more than 4,300 patents and applications.c
This year we invested £530m (2012 13 £544m) in R D. Our research, development and testing is done at global development centres. They help us get products and services into the market sooner by drawing together complementary skills and resources more easily (both our own and third-party). Our technology head uarters is Adastral Park which is home to over 50 high-tech companies. It is a world-leading innovation campus, employing around 4,000 people. We have continued to e pand our recently launched development centres in Kuala umpur and Bangalore that give us local technical e pertise. In October, we launched a programme of co-innovation with start-ups in ondon s Tech City.
Our open innovation model gives us access to thinking from outside BT from small, start-up companies, to some of the best universities around the world. We have teams working with customers, partners and universities in the US, Asia, urope and the Middle ast. They help us to identify and track global developments in new technologies, business propositions and market trends. For e ample, we have been working with partners on new ways to get more value from our bre assets. These include bre sensors which detect tampering in the network and techni ues that make sure communication is secure.
We run innovation showcases for our customers, allowing them to discuss applications and solutions with our e perts. In turn, we get to hear rst-hand what they need. Our people also help identify innovative new ways to improve our service to customers. This year our award-winning internal New Ideas Scheme had more than 2,000 submissions, delivering £26m of bene t through revenue generation and lower costs, and delivering a better service to our customers.
This year, our research and development focused on
New technology We are investigating methods for reducing the cost of our networks by using more cost-e ective technology and improving the way networks respond to customer needs or sudden peaks in demand.
We have launched a new service to allow corporate customers to securely manage applications when employees bring their own device to work.
BT Media and Broadcast helped deliver the world s rst live international transmission of a sporting event lmed in 4K ultra-high de nition. ive coverage of the Saracens versus Gloucester rugby game was captured, transmitted and shown at three locations at the International Broadcast Convention in Amsterdam.
Faster networks We have trialled technology which enables speeds of up to 1Gbps over copper lines. Previously these speeds would only have been available over optical connections.
Working with our partners we successfully eld-trialled a 1.4Tbps transmission using an e isting bre connection a world rst.
Improving service to customers We have developed improvements, which are being implemented, to the systems we use to plan engineer visits to our customers. This will improve scheduling and reduce engineer travel time.
Security We are using novel techni ues to analyse social media data to identify hacktivist activity and predict early stages of cyber-attacks. This is a service we use ourselves, and o er to our customers.
a Comparison based on gures for 2012 13 D spend.b Comparison based on total D spend over 2008 to 2012 13.c On average, we le with four member states of The Patent Cooperation Treaty and three member
states of the European Patent Convention.
IP Exchange
14bn400
170
Over 400 networks connected globally
Over 14bn voice minutes annually
Available in over 170 countries
Europe, sia, Americas…
Supports D voice with plans for 4G connectivity and global wi- roaming
3 regional hubs
Queen s Award for nterprise 2014 Innovation
ueens Award

29The Strategic ReportDelivering our strategy
Deliv
erin
g ou
r str
ateg
y
SuppliersOur suppliers from across the world play a vital role in helping us to provide our products and services and deliver our strategy. We spent around £9.8bn with our suppliers this year (2012 13 £9.7bn). The top 100 represent around 61% of our annual spend.
The mi of our suppliers continues to evolve as we move into new markets, such as televised sport.
Our approach to procurement We want to get the most from our suppliers especially from their diversity, skills and innovation.
As part of our cost transformation programmes we have concentrated on leveraging our relationships with our largest suppliers to get even better value. For e ample, we have used forecast volumes of future orders to negotiate better prices or terms with our main suppliers.
We have focused for two years on e tracting value from the tail-end of our supply base by increasing competition between them. This has delivered £40m of savings over this period. In addition, we have deactivated around 16,000 suppliers from our procurement systems.
A revamped strategy to focus on categories of products and services across our lines of business will underpin further cost savings.
We have around 370 people in 30 countries working with suppliers to deliver our procurement strategy.
Supplier selection It is important to us that we know who we are doing business with and who is acting on our behalf. So we choose suppliers using an established set of principles that makes sure both we and the supplier act ethically and responsibly.
We check that the goods and services we buy are made, delivered and disposed of in a socially and environmentally responsible way. We measure factors such as energy use, environmental impact and labour standards.
ou can nd out more at www.selling2bt.bt.com
Supply chain human rightsWe want our suppliers employees to e perience workplace conditions that meet the standards we have developed. We send our suppliers an ethical standards uestionnaire. We follow up with any suppliers identi ed as high or medium risk, and this year we met 97% of our target to achieve 100% follow-up within three months. We also visit supplier sites to make sure they meet our standards. This year we visited 54 sites (2012 13 49 sites) around the world.
Number of on-site supplier assessmentsYear ended 31 March
2012
2014
2013
54
54
49
To comply with the Dodd-Frank Act and our S C obligations, we asked our suppliers whether their products contain certain minerals which may have been sourced from con ict areas such as the Democratic Republic of the Congo. We will le with the S C the re uired report describing our due diligence and re ecting the responses we received.
Payment of suppliers This year the average number of days between invoice date and supplier payment was 62 days (2012 13 60 days).
In the UK, we have re-tendered the supplier nancing scheme that o ers contracted suppliers the chance to be paid early. This reduces
nancing costs to a new lower rate for all participating suppliers, irrespective of their si e. We think this will be particularly attractive for SM s (who make up around 60% of our supply base) and it supports UK Government initiatives to encourage small business growth.
We follow the Better Payment Practice Code.
ou can nd out more about the Better Payment Practice Code at www.payontime.co.uk
30 The Strategic ReportDelivering our strategy
Our lines of businessOur business is built around our customers
serving their needs and delivering value to them.
How we are organisedWe have ve customer-facing Iines of business BT Global Services, BT Business, BT Consumer, BT Wholesale and Openreach. They are supported by our internal service unit, BT Technology, Service Operations.
BT Business
BT Technology, Service & Operations
BT Wholesale
OpenreachBT Global Services
BT Consumer
During the year, we separated BT Retail into two new lines of business BT Business and BT Consumer. We did this to allow us to better serve our SM and consumer customers and to better deliver against our strategic priorities.
BT Retail previously comprised four sub units. These were Consumer, Business, BT nterprises and BT Ireland. BT nterprises (with the e ception of BT Wi- ) and the business and wholesale elements of BT Ireland merged with Business to form the new BT Business line of business. Consumer, BT Wi- and the consumer part of BT Ireland have become BT Consumer.
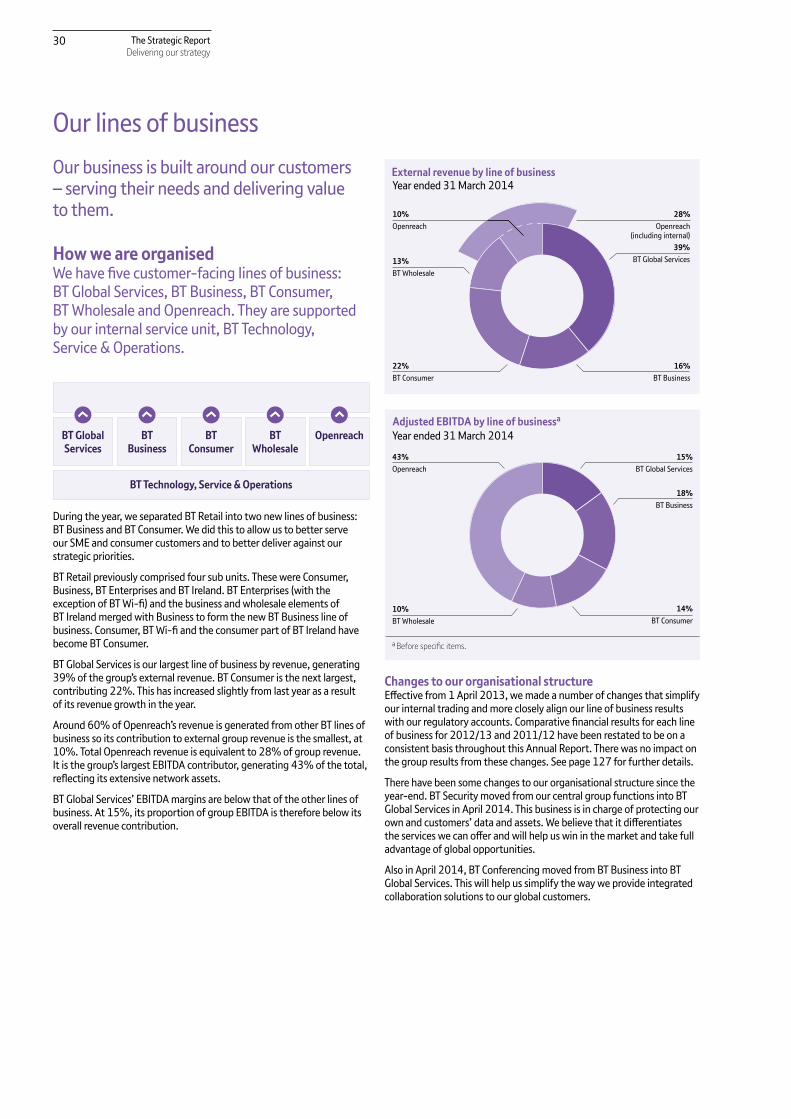
BT Global Services is our largest line of business by revenue, generating 39% of the groups e ternal revenue. BT Consumer is the ne t largest, contributing 22%. This has increased slightly from last year as a result of its revenue growth in the year.
Around 60% of Openreach s revenue is generated from other BT lines of business so its contribution to e ternal group revenue is the smallest, at 10%. Total Openreach revenue is e uivalent to 28% of group revenue. It is the groups largest BITDA contributor, generating 43% of the total, re ecting its e tensive network assets.
BT Global Services BITDA margins are below that of the other lines of business. At 15%, its proportion of group BITDA is therefore below its overall revenue contribution.
10%Openreach
External revenue by line of business
28%Openreach
(including internal)
13%BT Wholesale
22%BT Consumer
16%BT Business
39%BT Global Services
Year ended 31 March 2014
Adjusted EBITDA by line of businessa
15%BT Global Services
18%BT Business
14%BT Consumer
43%Openreach
10%BT Wholesale
Year ended 31 March 2014
ª Before speci c items.
Changes to our organisational structureective from 1 April 2013, we made a number of changes that simplify
our internal trading and more closely align our line of business results with our regulatory accounts. Comparative nancial results for each line of business for 2012 13 and 2011 12 have been restated to be on a consistent basis throughout this Annual Report. There was no impact on the group results from these changes. See page 127 for further details.
There have been some changes to our organisational structure since the year-end. BT Security moved from our central group functions into BT Global Services in April 2014. This business is in charge of protecting our own and customers data and assets. We believe that it di erentiates the services we can o er and will help us win in the market and take full advantage of global opportunities.
Also in April 2014, BT Conferencing moved from BT Business into BT Global Services. This will help us simplify the way we provide integrated collaboration solutions to our global customers.

31The Strategic ReportDelivering our strategy
Deliv
erin
g ou
r str
ateg
y
BT Global ServicesWe are a global leader in managed networked IT services. We serve the needs of more than 6,500 large corporate and public sector customers.
We focus on serving the following key industries and regions.
UK
Continental Europe
US and Canada
High-growth regions – Asia Paci c, Latin America, Turkey, the Middle East and Africa
Global consumer packaged goods
Global health
Global manufacturing
Global pharma chemical
Global telecom markets
Global banking & nancial markets
Global government
Global logistics
Global mining, oil & gas
Global systems integrators
We combine our global reach with local delivery and industry e pertise. 65% of our people are based outside the UK, in 60 countries.
Markets and customersWe work for more than 6,500 large corporate and public sector customers in more than 170 countries worldwide. We serve
100% of the FTS 100 companies 84% of the Fortune 500 companies 86% of Interbrand s top 50 annual ranking of the world s most valuable brands
91% of the world s top 100 nancial institutions and central and local government organisations and other public sector bodies in 24 countries around the world.
BT Global Services revenue by sectorYear ended 31 March 2014
48%
18%Financial institutions
23%UK public sector
6%Transit
5%Other global carriers Corporate customers
(e cluding nancial institutions)
Around two thirds of our revenue is generated from corporate customers. Of these, nancial institutions are our largest customer segment, generating 18% of our revenue in the year.
The UK public sector generated 23% of our revenue. We are a leading supplier to the UK Government s Public Services Network (PSN).
owever, we e pect to face continued declines in local government business, re ecting the ongoing lower levels of e penditure in this sector and our focus on only pursuing business that generates economic value.
We also supply a range of services to other telecoms companies.
BT Global Services revenue by regionYear ended 31 March 2014
44%United Kingdom
32%Continental Europe
12%US and Canada
12%High-growth regions
By region, the UK is our largest in terms of revenue. We serve a wide range of customers, with the nancial, government and healthcare segments being particularly signi cant. Current Analysis ranked us as the number one provider in the UK public sector market, as well as a leader in the UK IP telephony and uni ed communications market.
Continental Europe is our second largest region, but the slow economic recovery makes this a tough market as corporate customers continue to look for ways to make savings. We have a strong presence in this region with national networks and metropolitan bre rings in most major markets. We focus on certain key countries such as Belgium, France, Germany, Italy, the Netherlands and Spain. In Italy, according to the telecoms regulator, we are the leading operator of those dedicated to business-to-business services. In Spain, the telecoms regulator ranked BT as the leading alternative to the incumbent operator in the enterprise data transmission market.
The US and Canada is an important region for us because of the high proportion of multinationals that are head uartered there. Our biggest challenge in the US continues to be ine ective regulation of wholesale access to incumbent operator networks. However, by refreshing our sales model and launching new products, we hope to grow our share of this market.
The high-growth regions of Asia Paci c, atin America, Turkey, the Middle East and Africa are increasingly important for our customers. We are helping multinationals e pand into these areas and supporting local companies in these regions as they grow internationally. We are investing in these markets hiring more people, improving our products and services and building network and IT infrastructure.
Our markets are competitive across our footprint and we continue to face pricing pressure. However, there is good growth potential in the areas where we are investing. For e ample, Gartnera predicts that cloud
a The artner eports described herein, Forecast: T Services, 2012-2018, 1 14 pdate artner, March 2014) and Forecast: nformation Security, Worldwide, 2011-2017, 4 13 pdate artner, January 2014), represent data, research opinion or viewpoints published, as part of a syndicated subscription service, by artner, nc. artner ), and are not representations of fact. Each artner
eport speaks as of its original publication date and not as of the date of this Annual eport) and the opinions e pressed in the artner eports are subject to change without notice.
32 The Strategic ReportDelivering our strategy
computing services will grow at a rate of 36% a year globally over the ne t three years, ranging from 22% in Asia Paci c to 53% in atin America. Gartner also e pects managed security services to grow at a rate of 16% a year globally over the ne t three years. Ovum forecasts Ethernet services to grow at a rate of 14% a year globally over the ne t three years, ranging from 11% in the US and Canada to 31% in
atin America.
Around 90% of our revenue comes from our top 1,000 customers where we see an opportunity to grow our share of their spending.
Products and servicesWe deliver value to our customers by combining our products and services with industry-speci c solutions and consulting e pertise. Our network is at the core of what we provide. We have simple product categories organised around what our customers need. This makes them straightforward to buy and link together. Those categories are
BT AdviseKnowledge that delivers
Industry-speci c solutions
BT AssureSecurity that matters
BT ConnectNetworks that think
BT ComputeServices that
adapt
BT OneCommunications
that unify
BT ContactRelationships that grow
BT ConnectOur network services connect our customers to their people, their own customers and to the world. We o er a range of IP, Ethernet and internet network services. We deliver these in more than 170 countries over a range of access technologies including DS , Ethernet and satellite.
BT AssurePeople and businesses are using more mobile devices, social media and cloud services. Together with the growth in cyber-attacks, this means that customers are prioritising security. We provide a range of security products and services including rewalls, web security, intrusion prevention and threat monitoring.
BT OneBusinesses communicate in a number of di erent ways by phone, SMS, voicemail, instant messaging, email, video conferencing and data-sharing solutions. They want these channels to be integrated and work together. Our collaboration services help customers simplify their communications and transform the way they interact with their customers, colleagues, partners and suppliers.
BT ContactWe provide a range of contact centre services to help our customers build stronger relationships with their customers. Our services provide the option of using email, web chat, social media and the phone either via automated systems or dedicated advisors. Our cloud solution gives customers more e ibility and control over their costs by allowing capacity to change in response to demand.
BT ComputeBusinesses want reliable but e ible IT platforms and services for their applications, data storage and security. We provide IT services over our global network from our 45 data centres around the world.
Industry-speci c solutionsAs every industry has its uni ue needs and challenges, we provide a range of industry-speci c solutions. For e ample, BT Radian links
nancial institutions from around the world, giving them access to hundreds of critical applications. BT for ife Sciences lets research scientists collaborate on a secure platform.
BT AdviseWe have e perts around the world who provide consulting, integration and managed services to our customers. They have a range of specialisms, certi cations and accreditations to make sure our customers get the best out of our products and services.
Performance in the yearWe consolidated our position as a global leader for managed networked IT services. We have focused on improving customer service and investing in our global assets, people and technology. We have made progress towards our aim of being a more predictable business in terms of nancial performance. Our continued focus on cost transformation has contributed to a £177m increase in operating cash ow.
Key facts:
Operating costs down 4%
EBITDA grew 12% supported by cost transformation
Order intake of £6.9bn, up 9%
Double-digit underlying revenue increase in the high-growth regions
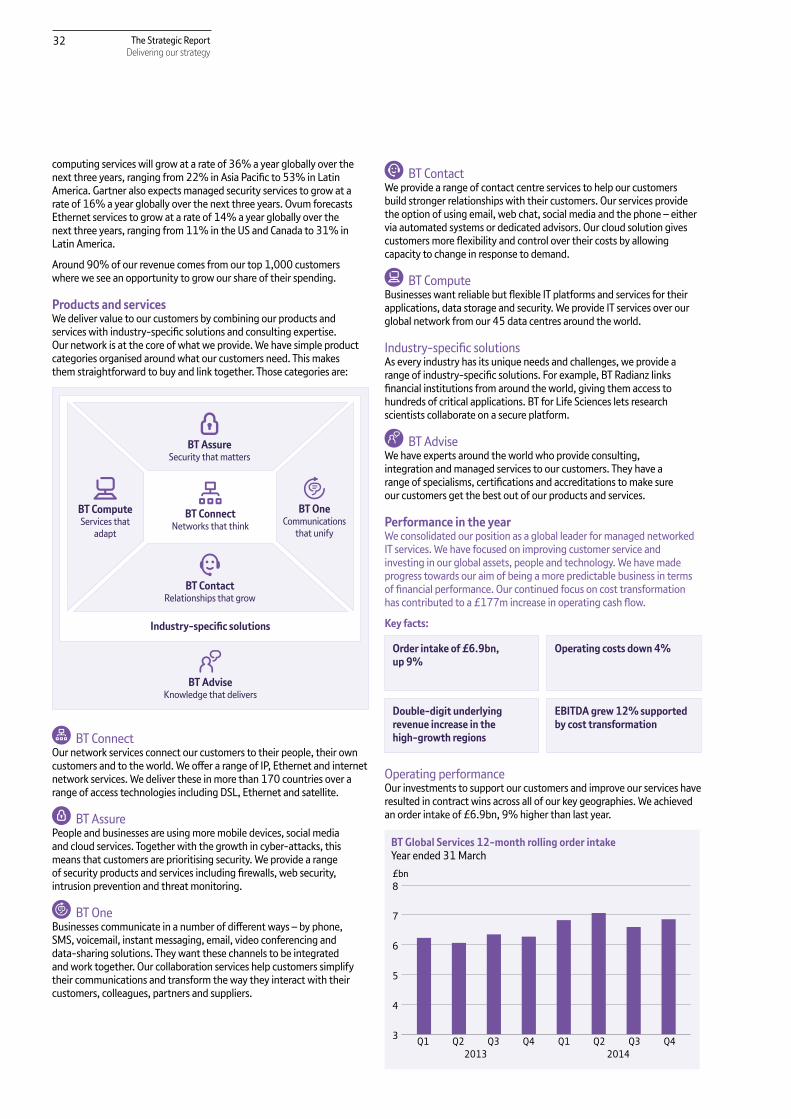
Operating performanceOur investments to support our customers and improve our services have resulted in contract wins across all of our key geographies. We achieved an order intake of £6.9bn, 9% higher than last year.
BT Global Services 12-month rolling order intakeYear ended 31 March
3
4
5
6
7
8
Q1 Q2 Q3 Q4 Q1 Q2 Q3 Q42013 2014
£bn

33The Strategic ReportDelivering our strategy
Deliv
erin
g ou
r str
ateg
y
Contracts we won in the year include
Customer Contract
Alsea (BT Contact) A contact centre solution to improve home delivery from 590 of the restaurants it operates in Me ico.
Credit Suisse (BT Connect)
A renewed global network outsourcing agreement covering a broad range of communications services. Provided jointly with Swisscom, we will support the bank in more than 50 countries.
Elster Group (BT Assure) A contract to supply a managed virtual rewall service.
HeidelbergCement (BT Connect)
A network to connect HeidelbergCement s sites at 1,100 locations in 37 countries across Europe and Africa.
NATO (BT Connect) Centrally-managed internet access and remote network access services to enable highly secure services and information e change to and from the internet.
Unilever (BT One) A global IT outsourcing contract including collaboration services (such as audio conferencing and video conferencing) and a fully integrated network providing voice, data, video and mobility services to the company s 173,000 employees across nearly 100 countries.
Western Power (BT Contact)
A multimedia contact centre in Perth, Australia, to maintain customer satisfaction, meet regulatory re uirements and handle surges in call volumes, for e ample during natural disasters.
Department of Health and the Health and Social Care Information Centre
An agreement to continue to deliver N3, which provides secure national broadband services to the NHS.
Jabil Circuit (BT Connect)
Contract for managed network services at 112 locations in 25 countries across the US, atin America, Asia, Europe and the Middle East and Africa.
In uential analyst rms recognise us as a global leader in the market. This year we improved our position as a leader in Gartner s global network service providers magic uadrant based on our Completeness of ision and Ability to E ecute . We also further improved our position as a leader in Gartner s global communications outsourcing and professional services magic uadrant.a
Customer service deliveryWe continue to focus on improving customer service.
We gather feedback from our customers in lots of di erent ways, including through our global account management teams and surveys. We use this feedback to identify further opportunities to improve our service and increase customer satisfaction. Customer e perience and feedback are an important part of how we reward our people.
This year we
achieved a 5% increase in the number of customer-agreed milestones for our comple contracts that we met on time
introduced internal systems which improve the uality and speed of customer uotes
improved how we manage our relationship with customers by providing a single point of contact for service delivery
improved Ethernet delivery times and increased the number of customer accounts included in our customer e perience dashboards. This increases our visibility of problems and means we can resolve them sooner.
We made some progress in the year and increased our RFT performance 0.6%. But it did not increase by as much as planned, partly as a result of a backlog of orders. We have focused on clearing this backlog which will help support an improvement in our RFT performance in the future.
Our customers can use our products and services to reduce their impact on the environment. For e ample, we are helping the NHS save around 150,000 commuting days a year through providing remote access to its secure national broadband network, N3.
In all the societies where we do business, we try to make a positive di erence. Through our Connecting Africa project, we are working with SOS Children s illages, an international charity that focuses on children at risk. We have connected 19 of the charity s sites in nine African countries using our global satellite network.
Cost transformationWe reduced our operating costs by 4%, largely re ecting the bene t of our cost transformation programmes. We made savings in our network, procurement and processes.
Network we completed the closure of our remaining legacy global data network, migrating the last customers to our strategic global platform which provides improved reliability and service. We have added new points of presence (PoPs) to reduce third-party access costs.
Procurement we have focused on cutting contract delivery costs through negotiating better commercial terms with suppliers and re ning the way we purchase access circuits and customer premises e uipment.
Processes by bringing together teams and clarifying roles, we are boosting e ciency, cutting costs, removing process failures and improving customer service. We are also improving back-o ce e ciency across Continental Europe.
Investing for the futureWe have continued to invest to improve our global capabilities.
High-growth regions we began hiring over 400 new people, improved our infrastructure with ve new IP and Ethernet PoPs, and added new products.
Network we built a new high capacity optical network in South Africa, e tended our depth of coverage in South East Asia with an NNI and added 20 new PoPs in places such as atvia, ithuania and Oman.
Core products and services we e tended the reach of our BT Connect portfolio by opening a city bre network in Paris and its suburbs. We launched BT Cloud Compute which boosts our cloud cover across four continents.
Industry-speci c solutions we have improved BT for ife Sciences by adding powerful scienti c software applications from Schr dinger and more research solutions from Accelrys. We connected a new nancial services customer in New ealand to the BT Radian community.
BT Advise we have improved the centralised knowledge management system which supports the BT Advise Academy. This makes it easier for our people to collaborate across the globe on customer issues and share best practice.
a The artner eports described herein, Magic uadrant for lobal Network Service Providers, Neil ickard, obert F. Mason artner, March 2014) and Magic uadrant for Communications Outsourcing and Professional Services, Eric oodness, Christine Tenneson artner, October 2013) represent data, research opinion or viewpoints published, as part of a syndicated subscription service, by artner, nc. artner ), and are not representations of fact. Each artner eport speaks as of its original publication date and not as of the date of this Annual eport) and the opinions e pressed in the artner eports are subject to change without notice.

34 The Strategic ReportDelivering our strategy
Financial performance
Year ended 31 March2014
£m2013a
£m2012a
£m
Revenue 7,041 7,170 7,812
Underlying revenue e cluding transit (1)% (6)% (1)%
Operating costs 6,109 6,338 6,977
EBITDA 932 832 835
Depreciation and amortisation 606 625 701
Operating pro t 326 207 134
Capital e penditure 495 524 560
Operating cash ow 389 212 391a estated, see note 1 to the consolidated nancial statements.
Revenue decreased 2% (2012 13 8%). We had an £8m negative impact from foreign e change movements and a £40m decline in transit revenue. Our key revenue measure, underlying revenue e cluding transit, decreased 1% (2012 13 6%), an improvement on last year.
Our UK revenue declined 5% (2012 13 8%) re ecting lower public sector business. In part this re ects our focus on only pursuing business in this sector that generates economic value. Underlying revenue e cluding transit in Continental Europe was at while in the US and Canada the decline slowed to 1%. We generated double-digit growth in underlying revenue e cluding transit in our high-growth regions.
Operating costs decreased 4% (2012 13 9%). Underlying operating costs e cluding transit decreased 3% (2012 13 11%) re ecting the bene t of our cost transformation programmes.
EBITDA improved 12% (2012 13 at) and increased 14% on an underlying basis. Depreciation and amortisation decreased 3% (2012 13 11%) as a result of lower capital e penditure in recent years. Operating pro t increased by £119m to £326m.
Capital e penditure decreased 6% (2012 13 6%). EBITDA less capital e penditure increased by £129m to £437m compared with an increase of £33m to £308m in 2012 13.
Operating cash ow was an in ow of £389m (2012 13 £212m). The increase of £177m was due to EBITDA growth, around £60m of early customer receipts and lower capital e penditure.
BT Global Services 12-month rolling operating cash ow
(50)
0
50
100
150
200
250
300
350
400
Q1 Q2 Q3 Q4 Q1 Q2 Q3 Q42013 2014
£m
Year ended 31 March
BT BusinessBT Business serves around 900,000 UK SMEs. It has a leading position in ed-voice, networking and broadband services.
BT Business had ve customer-facing divisions during the year UK SME, UK Corporate, BT Ireland, IT Services and BT Conferencing. BT Conferencing moved into BT Global Services in April 2014.
UK SMEUK SME supplies small businesses in Great Britain (typically up to 50 employees) with ed-voice, broadband, mobility, networking and IT services.
It includes BT Redcare, BT Directories and BT Payphones. BT Redcare sells re and security alarm signalling services, surveillance networks and control room services. BT Directories provides Directory En uiries, The Phone Book, operator services and call handling for the emergency services. BT Payphones provides public, private and managed payphone services.
UK CorporateUK Corporate supplies larger businesses in Great Britain (typically 50-1,000 employees) with ed-voice, broadband, mobility, networking and IT services.
It includes BT Fleet, one of the UK s leading eet management providers.
BT IrelandIn Northern Ireland, we are the leading service provider for SMEs and the public sector. We run the copper access network and have built a
bre broadband network that passes more than 90% of premises.
In the Republic of Ireland, we serve corporate and public sector customers and are one of the country s largest providers of wholesale network services.
IT ServicesWe have ve specialist IT services businesses
BT iNet A networked IT specialist and leading Cisco partner selling infrastructure, security and uni ed communications.
BT Engage IT A leading provider of business-to-business IT e uipment and services.
BT Business Direct An online store providing IT and communications hardware and software, including computing and networking e uipment.
BT Expedite A provider of services to the retail sector.
BT Tikit A provider of IT products and services for legal and accountancy rms.

35The Strategic ReportDelivering our strategy
Deliv
erin
g ou
r str
ateg
y
BT ConferencingBT Conferencing is a leading supplier of audio, video and web conferencing and collaboration services. We sell services to business customers globally through sales teams in the UK, the US, Asia Paci c and atin America. By using our conferencing services, people are able to travel less, reducing carbon emissions.
Markets and customersThere are 4.9m businesses in the UK with up to 1,000 employees (the market addressed by BT Business). Their communications and IT needs vary widely depending on their si e, number of sites, industry and stage of lifecycle.
Small businesses have simpler needs and they sometimes buy services from consumer-orientated providers, including BT Consumer.
We have around 900,000 customers in BT Business. Major customers include retailers such as Fat Face, WHSmith and Pets at Home charities such as Anchor Trust, Barnardos and O fam service organisations such as glh Hotels and Odeon Cinemas nancial organisations such as International Currency E change and educational institutions such as University College
ondon. We serve more than half of FTSE350 companies.
In the UK, there are three markets that we focus on ed-voice and data mobility and IT services.
Market size and BT Business share
£bn
MobilityFixed-voice and data
Addressable ITservices market
40%
1%
6%
BT Business Rest of marketSource: BT Business revenue and IDC custom market-sizing model.
0
2
4
6
8
10
Fixed-voice and dataThere are 8.3m business lines in the UK (2012 13 8.8m), including both SMEs and large corporate businesses. Some of these lines are provided by BT Global Services. There are more lines than the number of individual businesses as many customers have more than one line. BT has a 45% market share of business lines (excluding oIP), down two percentage points in the year.
The SME market for xed-voice has been in decline for several years, with call volumes falling due to substitution by mobile, email and oIP. But the business broadband market continues to grow, and customers are migrating from copper to bre-based services.
The market for data network services is fragmented. We are a leading player with around a uarter of the market. Customer demand for bandwidth continues to grow strongly but competitive pressure on prices means the market si e is growing at a slower pace.
Overall, the xed-voice and data market is worth an estimated £3.7bn and we have around 40% of it.
We compete against more than 300 resellers and xed network operators. Alternative Networks, Colt Group, Daisy Group, KCOM Group, TalkTalk, irgin Media, odafone and N are our main competitors.
MobilityMobile device sales are growing strongly in the market, driven by take-up of smartphones and tablets. Data volumes and revenue continue to increase but calls revenue is declining. Mobile apps, mobile security and machine-to-machine mobile services are growing opportunities.
The mobile market is important to us as around three- uarters of SMEs use both xed and mobile services. The part of the mobile market that we target is worth an estimated £7.4bn, of which our share is around 1%. Our main competitors are EE, O2 (Telefónica) and odafone. They are increasingly o ering xed as well as mobile services.
IT servicesThe IT services market is large with a wide range of products. Competition is fragmented. We typically target businesses with 250 to 5,000 employees. The largest ones are often BT Global Services customers that we also provide services to.
We only target those product markets where we can leverage our assets and capabilities. We estimate that the parts of the market that BT Business serves are worth around £9bn, of which we have around 6% share.
Demand for cloud services, managed hosting, data centres and uni ed communications services is growing as customers look for exible, cost-e ective solutions to help them work more e ciently.
Our main competitors are Computacenter, Dimension Data, Kelway, ogicalis, Phoenix and SCC.
ConferencingWe are the third largest player in Europe for video conferencing services. For audio conferencing, we are the second largest in Europe and the fourth largest worldwide.
Usage of audio conferencing continues to grow strongly. And while unit prices have fallen, overall market revenue is growing steadily. The audio conferencing market is worth around £4bn globally, and we have around 10% share of audio minutes.
The video conferencing market is also expanding. Desktop video conferencing services are growing, but telepresence products and services are in decline.
Our main conferencing competitors are AT T, Intercall, PGi and eri on.
Products and servicesWe o er a wide choice of xed, mobile and IT services. These range from simple standalone products to managed services and complex customised solutions.
Fixed-voice servicesOur xed-voice services range from standard calls and lines to fully-managed o ce phone systems and contact centre solutions. We are increasingly selling oIP services, such as BT Hosted oIP and BT Business Broadband oice (IP voice over the customer s broadband connection).

36 The Strategic ReportDelivering our strategy
Broadband and internetWe provide a range of internet access options including BT Business Broadband over copper, BT In nity for business (over FTTC and FTTP) and BTnet dedicated internet access. We also sell email and hosted Microsoft collaboration services, and web-hosting.
Networking servicesOur voice and data networking services support customers who need to connect di erent sites. Products include Ethernet, IP irtual Private Network services (which connect sites using IP connections), SIP trunking (which transports voice calls over IP networks), leased lines, cabling infrastructure and local area networking solutions.
IT servicesBT iNet and BT Engage IT sell cloud and data centre services, uni ed communications, security solutions, end-user support services, hardware, software and consultancy services.
BT Business Direct sells hardware and software from a wide range of suppliers.
BT Expedite provides the retail sector with store point of sale systems, back-o ce applications, e-commerce platforms and software.
BT Tikit combines its specialist legal and accountancy software products with technologies from multiple partners to o er fully-integrated solutions.
MobilityWe sell mobile voice and data services through a mobile virtual network operator (M NO) agreement. We o er a range of handsets and tablets and a choice of tari s to suit di erent customer segments.
We are developing a new range of mobile services which will use our 4G mobile spectrum.
ConferencingBT MeetMe is our standard audio conferencing service. This is now available with Dolby oice for higher uality sound and a better user experience. We also o er premium audio conferencing services hosted by a conference call coordinator.
We sell video conferencing e uipment and services, ranging from desktop video to large telepresence solutions. We o er Cisco Webex web conferencing and video web-streaming.
Performance in the yearWe have increased EBITDA for the second year running by maintaining our focus on cost transformation. Underlying revenue excluding transit was down 1% due to declines in line and call volumes. We have improved key metrics in customer service delivery and made it easier for our customers to contact us.
Key facts:
EBITDA up 5%Order book up 3% to £2bn
Operating performance Our order intake grew 3% to £2bn. We have achieved a number of customer wins and re-signs this year including
UK SME Crown Estates
UK Corporate (including IT Services)
Adecco, EMR, Oxfam
BT Fleet The Post O ce, Wales West Utilities
BT Redcare Center Parcs
BT Ireland Ardagh Group, NI Water
BT Conferencing Communicloud, Plantronics
Inclusive call packages have proved popular this year and helped us win customers. Business lines reduced 8%, which was higher than last year as more customers migrated to oIP. This has been partly o set by growth in our own oIP base, which is up 12%.
Our mobile customer base has decreased 3% this year. It has increased 4% in our UK SME channel but fallen in UK Corporate, where we have experienced strong competition. We have agreed a new M NO deal with EE which will give us greater exibility to launch competitive propositions next year.
BT Expedite won the 2013 Retail Week award for EPOS (Electronic Point of Sale) Initiative of the Year. BT Fleet won four awards, including one for best use of technology for reducing fuel consumption and emissions.
BT Redcare expanded its re and security services into the Republic of Ireland, gaining over 950 customers this year.
BT Directories became the UK s only 999 call handling agency on behalf of all xed and mobile communications providers, following the seamless migration of three other service providers tra c to BT.
BT Ireland has continued its bre broadband rollout across Northern Ireland. It has been awarded a further £24.5m of funding (announced by the Department of Enterprise, Trade and Investment in February) to extend our reach even further. This investment will deliver faster internet speeds to over 45,000 of the region s most remote rural homes and business premises by December 2015.
BT Conferencing has grown audio and web minutes but average unit prices have declined. In video conferencing, we are focusing on providing services to support the use of mobile devices and tablets, as the market for hardware and telepresence rooms has declined.
Customer service deliveryDespite the challenges from the extreme weather conditions, we have made progress in a number of areas of customer service. BT Business RFT improved 1.5% in 2013 14. The increase this year is largely due to improved repair times and shorter lead times for provision, together with improved service levels in our contact centres.
The number of calls to our service desks is down 2%. Complaints are down 16%. Customer satisfaction with our advisors has increased two percentage points. Our transactional net promoter score (measured after interactions with customers) has increased eight percentage points and the average time to answer calls to our service desks is down 41% (a 68 second reduction).

37The Strategic ReportDelivering our strategy
Deliv
erin
g ou
r str
ateg
y
We have made it easier for our customers to contact us by improving our online chat capability (and extending its opening hours), opening a new Twitter channel and launching online customer self-service on mobile devices.
We have increased the percentage of our customer accounts on paper-free billing to 15%. This reduces our costs and carbon emissions.
Cost transformationOperating costs reduced 2%, re ecting the bene t of our cost transformation initiatives.
We have renegotiated contracts with suppliers which has delivered signi cant savings.
We have realised cost synergies by combining BT Enterprises, the non-consumer parts of BT Ireland and the previous Business unit together into one organisation. This has enabled us to reduce overall BT Business total labour resource by 7%, becoming more e cient in areas such as sales, product delivery and customer service.
Investing for the futureWe have continued to invest in our next generation of oIP services, mobile services and IT systems to improve customer service.
In May we launched new broadband and telephony packages and a 76Mbps bre product under the Plusnet Business brand.
We launched a 330Mbps FTTP service in June and a new managed Wide Area Network (WAN) service in August tailored speci cally to the needs of SMEs.
In the Republic of Ireland we expanded our portfolio of access options for Ethernet services with the launch of our Ethernet First Mile and 10GB Etherway products. We have upgraded our core network to deliver speeds of 100Gbps to cost e ectively support customers growing demand for bandwidth. We have deployed a new performance-reporting and control platform for BT Connect services. We have invested in data centre and telehousing capabilities in Belfast and Dublin to increase capacity and support BT Managed Compute services.
In BT Engage IT we have invested to expand the BT Managed Compute platform. This is a managed Infrastructure as a Service (IaaS) solution for core IT infrastructure, helping businesses migrate their data centre services to the cloud.
BT Tikit has invested in the next generation of Carpe Diem, a desktop time-keeping application for the legal profession.
In BT Conferencing we have invested in the launch of BT MeetMe with Dolby oice. We have expanded our conferencing services into atin America, with investment in local product modi cations, sales and operations teams and a new customer service centre in Peru.
Financial performance
Year ended 31 March2014
£m2013a
£m2012a
£m
Revenue 3,509 3,516 3,594
Underlying revenue excluding transit (1)% (2) % (2)%
Operating costs 2,411 2,469 2,557
EBITDA 1,098 1,047 1,037
Depreciation and amortisation 206 245 248
Operating pro t 892 802 789
Capital expenditure 133 147 196
Operating cash ow 892 907 856a estated, see note 1 to the consolidated nancial statements.
Reported revenue was at (2012 13 2% decline) including a £9m positive impact from foreign exchange movements, a £12m decline in transit revenue and a £20m impact from ac uisitions. Underlying revenue excluding transit decreased 1% (2012 13 2%).
UK SME Corporate voice revenue declined 2% (2012 13 6%) with continuing volume reductions partly o set by an increase in average spend per customer. The volume decline partly re ects migration of customers to oIP services where revenue increased 25% (2012 13 5%).
UK SME Corporate data and networking revenue increased 1% (2012 13 1%) with growth in managed network services and in broadband revenue with more customers choosing to take bre services.
BT Conferencing revenue declined 2% (2012 13 1% increase) due to continued lower hardware sales and lower audio prices, partly o set by growth in the volume of conferencing minutes.
BT Ireland underlying revenue excluding transit increased 4% (2012 13 at) driven by contract wins. Transit revenue declined 24% (2012 13 11% increase).
Excluding the bene t of the ac uisition of Tikit, IT services underlying revenue grew 1% (2012 13 3%).
Revenue declines were seen in BT Directories, BT Redcare and BT Payphones, with these partially o set by growth in BT Fleet.
Operating costs decreased 2% (2012 13 3%). Underlying operating costs excluding transit decreased 3% (2012 13 3%) re ecting the impact of our cost transformation programmes.
EBITDA increased 5% (2012 13 1%) and underlying EBITDA increased 4% (2012 13 1%). Depreciation and amortisation decreased 16% as a result of lower capital expenditure in recent years. Operating pro t increased 11% (2012 13 2%).
Capital expenditure decreased 10% (2012 13 25%). EBITDA less capital expenditure increased by £65m compared with a £59m increase last year.
Operating cash ow was an in ow of £892m (2012 13 £907m). This was lower than the prior year driven by the timing of working capital movements.

38 The Strategic ReportDelivering our strategy
BT ConsumerWe are the largest consumer xed-voice and broadband provider in the UK with a growing base of T and BT Sport customers.
We sell BT-branded xed-voice, broadband and T services directly to UK homes. We also sell BT Sport and BT Wi- to commercial premises and o er a range of consumer devices (such as telephones and baby monitors) through third-party high street retailers.
Our Plusnet brand allows us to grow our market share amongst more price conscious xed-voice and broadband customers.
We have focused on growing revenues from broadband (including bre) and T to o set declines in traditional xed-voice services.
Markets and customersThe market for xed-voice calls, lines and broadband is competitive with at least a do en bundled product suppliers and over 100 xed-line operators. There are several strong players the four largest being BT, Sky, irgin Media and TalkTalk.
Our voice and broadband services are available to almost all of the UK s 26m households. Our T services, which re uire a minimum broadband speed, are available to the majority of them.
Fixed-linesSince 2009, the number of xed-lines in the UK has remained stable at 84% of households. 16% of homes are mobile only . Consumers are using their xed-lines less for making calls as they nd other ways to keep in touch, such as email, SMS, instant messaging and social media. According to the latest data from Ofcom, UK xed-call minutes fell 13% in the uarter to December 2013, compared with the same uarter a year earlier. Despite this trend, demand for xed broadband connections is supporting the overall number of lines in the market. BT has a 38% share of the market for consumer xed-lines. This compares with 41% last year.
Market share of UK consumer lines38%
BT
19%Sky
15%TalkTalk
11%Other
17%Virgin Media
Source: Ofcom Telecommunications Market Data Tables, December 2013, and provider published results.
BroadbandAt 31 March 2014 there were around 22.9m DS , bre and cable broadband connections to homes and businesses in the UK. This is up 4%.
Broadband adoption is being helped by attractive broadband prices, which according to Ofcom are some of the lowest in Europe.
Our rollout of bre broadband is helping to increase broadband speeds across the country. The average broadband download speed in the UK increased by almost 50% to 17.8Mbps in November 2013, up from 12.0Mbps a year earlier.
Take-up of bre broadband has been helped by the growing number of connected devices and greater use of bandwidth-intensive applications such as BBC iPlayer.
Our market share of consumer and business DS and bre broadband connections is 39%, one percentage point above last year.
BT’s retail broadband market shareAt 31 March
20122010 2011 2013 201420
25
30
35
40%
35%
28%
37%
30%
36%
29%
39%38%
31% 32%
Source: BT and market data.Market share of broadband lines (DS bre cable)Market share of broadband lines (DS bre)
TVive channels (as opposed to catch-up or on-demand) are still the most
common way for people to watch television. 37% of UK adults only watch free-to-air digital TV (Freeview). 58% take a pay-TV service with the remaining 5% using other services such as Freesat.
Pay-TV is delivered in one of three ways
satellite (Sky) cable (Virgin Media) or DS or bre (mainly BT and TalkTalk), with the TV service provided over both broadband and free-to-air digital TV.
Satellite has for many years been the dominant pay-TV platform with Sky having exclusivity over much of the UK s premium sports content. We continue to pursue commercial, legal and regulatory avenues to obtain access to Sky s sports channels on a fair basis and particularly on BT TV over the YouView platform. This would increase competition and choice, and bene t UK consumers.
Demand for bre broadband has been supported by the emergence of over-the-top content providers such as Net ix, Ama on Prime Instant Video and Blinkbox.
The proportion of our customers who take a bundle of products that include TV is lower than for some of our major competitors. This gives us an opportunity to drive take-up to increase ARPU.

39The Strategic ReportDelivering our strategy
Deliv
erin
g ou
r str
ateg
y
Products and servicesOur three key product segments are xed-voice, broadband and TV. To win and keep customers we o er competitively priced and di erentiated packages across these areas.
We provide additional services that support our value-for-money positioning including
BT Sport, which provides inclusive premium sports content for BT broadband customers
BT Cloud, which provides on-the-go access and secure online storage for customers data
BT NetProtect Plus security and BT Parental Controls, which give peace of mind to our customers and protect their families and
BT Wi- which o ers unlimited access to over 5m hotspots in the UK.
Most of our sales are through our call centres but our online channels are gaining share.
Fixed-voiceWe provide customers with xed-lines and a choice of calling plans.
We o er our customers exible ways to pay. ine Rental Saver gives a discount on line rental to customers who pay for a year upfront. Our unlimited call packages o er customers peace of mind with the choice of inclusive evening, weekend or daytime calls.
We o er a low cost phone service. BT Basic is available to those on low incomes and in receipt of certain state bene ts (such as income support). We are the only company to o er such a service.
We want to help customers manage nuisance calls. Our BT6500 nuisance call blocking telephone has become the best-selling UK xed-line telephone. We also o er free caller display for customers who take a twelve-month contract with BT.
We help customers to get the most from their services. BT SmartTalk allows customers to make calls from a range of devices using wi- . Calls are then charged to customers bills as if they had been made from their xed-line. This means they can make inclusive or cheap calls when overseas, for example.
BroadbandBT Broadband is our DS service which is delivered over copper lines. BT In nity uses bre to enhance the speed and performance of broadband. BT Broadband and BT In nity come in a range of options with di erent usage limits and speeds and are usually bundled with
xed-voice call plans.
The growing take-up of BT In nity is helping to increase customer loyalty and reduce customer churn.
This year we launched BT Mail alongside a new, single online portal that enables customers to manage their email and all their services through a single website. We expect to move all remaining customers from the existing email service supported by Yahoo to BT Mail during 2014.
When we designed our latest version of the BT Home Hub, we set out to minimise its carbon footprint. We used the latest power supply units and software to reduce its overall power consumption. By ensuring our hub and packaging could t through a standard-si ed letter box, customers no longer need to worry about being at home for their delivery.
TVOur TV business consists of two parts our TV service and propositions (BT TV) and our live sports channels (BT Sport).
BT TV brings together free-to-air channels, additional paid-for channels, catch-up content and on-demand TV shows and movies. It is sold exclusively to our broadband customers.
Our strategic TV platform is YouView, which gives customers standard and high de nition (HD) free-to-air channels and the ability to pause, record and rewind live TV and on-demand content. Its programme guide scrolls back seven days to give customers easy access to catch-up TV from BBC iPlayer, ITV Player, 4oD and Demand 5.
In February 2014, we launched our new YouView set-top box, building on the success of our rst generation award-winning box. It is even smaller and faster and allows customers to store up to 300 hours of TV.
Our Essential TV pack is our entry-level o ering for both BT Broadband and BT In nity customers and includes a YouView set-top box. Our Entertainment TV pack is only available to BT In nity customers. It comes with a free YouView set-top box and access to 20 extra channels (such as Comedy Central, Gold and Discovery) with catch-up services available for many of them. These channels are not available on free-to-air television.
Additional channel packs can also be added, such as HD Extra , Kids Extra (which also includes on-demand) and Sky Movies. In total, we added 38 channels to our TV service this year, including 16 HD channels. We also o er on-demand only packs (giving access to content whenever people want it) including Film and TV Box Sets , Music and Kids .
In August 2013, we launched three live TV sport channels BT Sport 1, BT Sport 2 and ESPN. These channels are on-air 24 7 and are available in both standard and high de nition. BT Sport customers can get our sports channels through our two latest TV platforms with BT In nity over digital terrestrial TV through an online app or over satellite. They are also available to Virgin Media customers and in the Republic of Ireland with Setanta, through our wholesale deals.
BT Sport is free with BT broadband. Non-BT broadband customers can subscribe for £12 a month for standard de nition or £15 for high de nition.
Sports broadcasting rights include:

40 The Strategic ReportDelivering our strategy
Performance in the yearWe have grown revenue 4%, the most in over ten years. Our EBITDA was down 14% this year re ecting our investment in BT Sport which o set the bene t of our cost transformation activities. We have seen good growth in bre broadband and have increased our share of the DS and bre broadband market, adding 69% of market net additions. BT Sport has helped drive broadband take-up and slow line loss. We need to strengthen our customer service to provide a consistent customer experience, underpin our value-for-money positioning and meet changing expectations.
Key facts:
Around 3m direct BT Sport customers
1m BT TV customers
69% of DSL and bre broadband market net additions
Retail bre base grew by 869,000
Operating performanceAt 31 March 2014 we had 9.9m consumer xed-lines, with around 9.7m active voice lines (where a customer buys calls from us as well as paying for the line). Despite the competitive environment, we have managed to signi cantly slow line loss. We reduced our rate of net line loss by over 50% to 314,000 in the year. We lost just 196,000 net active lines, compared with 496,000 last year.
This shows our strategy is delivering. We are winning new customers and retaining existing customers through bundled packages and the appeal of BT Sport. Around 98% of our broadband sales are now bundled with other products and 91% of our broadband customer base takes a bundle of services.
Annual consumer line lossesYear ended 31 March
2012 2013 2014
Net active line losses Net total line losses
000
(478
)
(883
)
(196
)
(314
)
(496
)
(712
)
0
(100)
(200)
(300)
(400)
(500)
(600)
(700)
(800)
(900)
(1,000)
Total consumer and business call minutes fell 12% compared with a 9% decline last year.
As at 31 March 2014 we had 7.3m consumer and business broadband customers, up 9%. We achieved 571,000 broadband net additions. This was 35% more than last year despite slowing growth in the market and represented 69% of DS and bre broadband market net additions.
We now have over 2.1m bre broadband customers, increasing 869,000 in the year. Around 30% of our broadband customers now have bre.
Our consumer ARPU increased to £391 (2012 13 £365) driven mainly by broadband take-up.
We have continued to grow our TV customer base, adding 192,000 customers and reaching the 1m customer milestone.
Around 3m customers now take BT Sport directly from us. Including our wholesale arrangements with Virgin Media in the UK and Setanta in the Republic of Ireland, around 5m households can watch BT Sport.
We are pleased with viewing gures for BT Sport. Of our 33 Barclays Premier eague matches in 2013 14, 27 reached over 1m viewers. Over the Christmas period we achieved our peak viewing audience of over 1.8m during the Manchester City versus iverpool xture.
Customer service deliveryBT Consumer RFT improved 5.4% this year. We had hoped for a greater improvement and are making further investments in our customer service operation, in particular how we respond to increased demand at peak times. For example, we signed up over 1m customers to BT Sport within the rst three months of launch which placed considerable pressure on our contact centre resources, a ecting the levels of service some customers received.
During the year we introduced a new online portal. This enables customers to review their bills, make changes to their account, access their BT services (such as BT Cloud and email) and nd out about other BT products and services using a single user ID and password.
We have also put in place interactive voice recognition software so that customers who prefer to speak to us are able to get through to the right advisor without having to navigate through as many options.
We are also making changes to provide a consistent customer experience at all times and to meet changing customer expectations. There are a number of initiatives we have committed to including
a dedicated case management approach to customers with serious problems and faults
recruiting hundreds of new UK call centre sta most recently in South Shields, on Tyneside, and Accrington, ancashire and
introducing new software that makes sure we call back customers at the correct time.
Even with the challenges in our customer service operation, our customers continue to recommend our products to others. Our advocacy scores improved to an average of 39% in the fourth uarter this year (Q4 2012 13 33%, Q4 2011 12 31%).
Cost transformationOperating costs increased 11% due to our investment in BT Sport and our improved revenue trend. Excluding BT Sport, operating costs declined 5% which is consistent with the prior year.
This re ects the bene ts of our cost transformation activities including
renegotiating supplier contracts and improving our processes installing software into our home hubs which means our customer service advisors can diagnose faults remotely. This helped save around 7,000 engineer visits and reduced calls into our customer service team by over 300,000 and
launching our new YouView set-top box which has a lower unit cost.
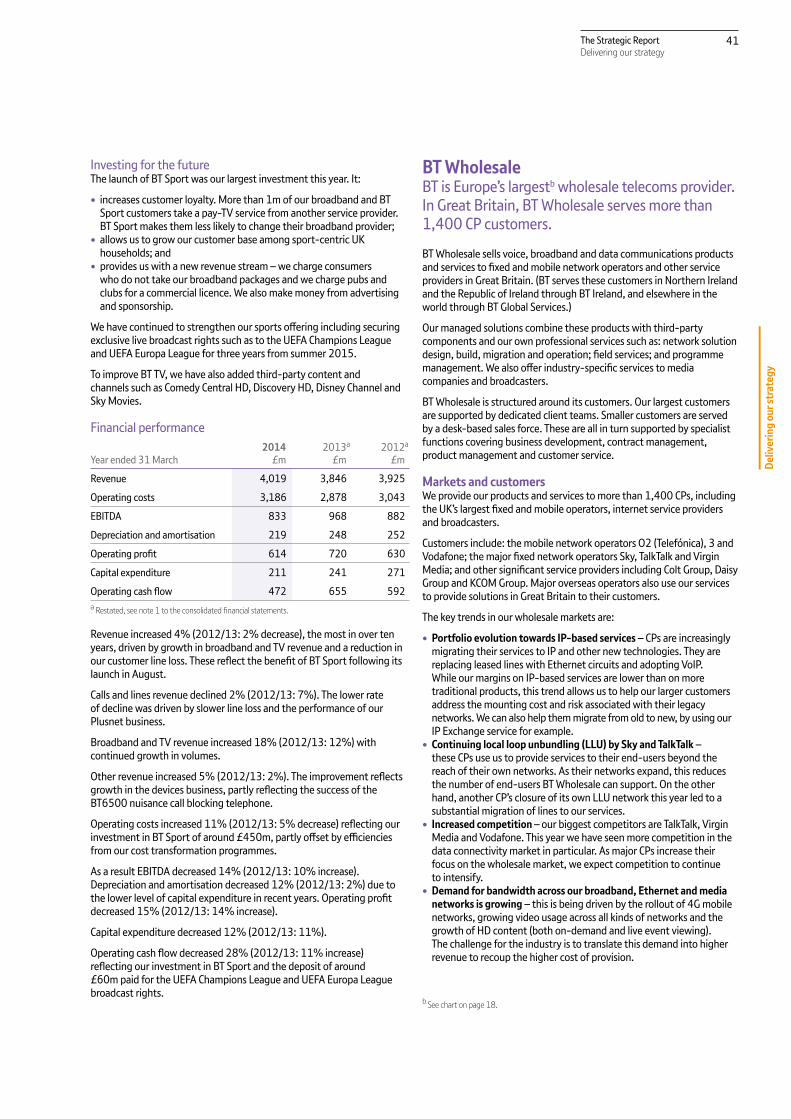
41The Strategic ReportDelivering our strategy
Deliv
erin
g ou
r str
ateg
y
Investing for the futureThe launch of BT Sport was our largest investment this year. It
increases customer loyalty. More than 1m of our broadband and BT Sport customers take a pay-TV service from another service provider. BT Sport makes them less likely to change their broadband provider
allows us to grow our customer base among sport-centric UK households and
provides us with a new revenue stream we charge consumers who do not take our broadband packages and we charge pubs and clubs for a commercial licence. We also make money from advertising and sponsorship.
We have continued to strengthen our sports o ering including securing exclusive live broadcast rights such as to the UEFA Champions eague and UEFA Europa eague for three years from summer 2015.
To improve BT TV, we have also added third-party content and channels such as Comedy Central HD, Discovery HD, Disney Channel and Sky Movies.
Financial performance
Year ended 31 March2014
£m2013a
£m2012a
£m
Revenue 4,019 3,846 3,925
Operating costs 3,186 2,878 3,043
EBITDA 833 968 882
Depreciation and amortisation 219 248 252
Operating pro t 614 720 630
Capital expenditure 211 241 271
Operating cash ow 472 655 592a estated, see note 1 to the consolidated nancial statements.
Revenue increased 4% (2012 13 2% decrease), the most in over ten years, driven by growth in broadband and TV revenue and a reduction in our customer line loss. These re ect the bene t of BT Sport following its launch in August.
Calls and lines revenue declined 2% (2012 13 7%). The lower rate of decline was driven by slower line loss and the performance of our Plusnet business.
Broadband and TV revenue increased 18% (2012 13 12%) with continued growth in volumes.
Other revenue increased 5% (2012 13 2%). The improvement re ects growth in the devices business, partly re ecting the success of the BT6500 nuisance call blocking telephone.
Operating costs increased 11% (2012 13 5% decrease) re ecting our investment in BT Sport of around £450m, partly o set by e ciencies from our cost transformation programmes.
As a result EBITDA decreased 14% (2012 13 10% increase). Depreciation and amortisation decreased 12% (2012 13 2%) due to the lower level of capital expenditure in recent years. Operating pro t decreased 15% (2012 13 14% increase).
Capital expenditure decreased 12% (2012 13 11%).
Operating cash ow decreased 28% (2012 13 11% increase) re ecting our investment in BT Sport and the deposit of around £60m paid for the UEFA Champions eague and UEFA Europa eague broadcast rights.
BT WholesaleBT is Europe s largestb wholesale telecoms provider. In Great Britain, BT Wholesale serves more than 1,400 CP customers.
BT Wholesale sells voice, broadband and data communications products and services to xed and mobile network operators and other service providers in Great Britain. (BT serves these customers in Northern Ireland and the Republic of Ireland through BT Ireland, and elsewhere in the world through BT Global Services.)
Our managed solutions combine these products with third-party components and our own professional services such as network solution design, build, migration and operation eld services and programme management. We also o er industry-speci c services to media companies and broadcasters.
BT Wholesale is structured around its customers. Our largest customers are supported by dedicated client teams. Smaller customers are served by a desk-based sales force. These are all in turn supported by specialist functions covering business development, contract management, product management and customer service.
Markets and customersWe provide our products and services to more than 1,400 CPs, including the UK s largest xed and mobile operators, internet service providers and broadcasters.
Customers include the mobile network operators O2 (Telefónica), 3 and Vodafone the major xed network operators Sky, TalkTalk and Virgin Media and other signi cant service providers including Colt Group, Daisy Group and KCOM Group. Major overseas operators also use our services to provide solutions in Great Britain to their customers.
The key trends in our wholesale markets are
Portfolio evolution towards IP-based services CPs are increasingly migrating their services to IP and other new technologies. They are replacing leased lines with Ethernet circuits and adopting VoIP. While our margins on IP-based services are lower than on more traditional products, this trend allows us to help our larger customers address the mounting cost and risk associated with their legacy networks. We can also help them migrate from old to new, by using our IP Exchange service for example.
Continuing local loop unbundling (LLU) by Sky and TalkTalk these CPs use us to provide services to their end-users beyond the reach of their own networks. As their networks expand, this reduces the number of end-users BT Wholesale can support. On the other hand, another CP s closure of its own U network this year led to a substantial migration of lines to our services.
Increased competition our biggest competitors are TalkTalk, Virgin Media and Vodafone. This year we have seen more competition in the data connectivity market in particular. As major CPs increase their focus on the wholesale market, we expect competition to continue to intensify.
Demand for bandwidth across our broadband, Ethernet and media networks is growing this is being driven by the rollout of 4G mobile networks, growing video usage across all kinds of networks and the growth of HD content (both on-demand and live event viewing). The challenge for the industry is to translate this demand into higher revenue to recoup the higher cost of provision.
b See chart on page 18.

42 The Strategic ReportDelivering our strategy
Products and servicesBroadbandOur next-generation Wholesale Broadband Connect (WBC) network can be used by CPs to o er copper-based broadband services to 92% of UK premises (2012 13 90%) and bre broadband to around two thirds of premises. Our older ADS network brings overall copper-based broadband coverage up to 99.8%. Following consultation with CPs, we have delayed the retirement of this network where it overlaps with our newer WBC network. This retirement process will now be completed by September 2014.
This year we launched new pricing options for additional network capacity. These help our customers stay competitive despite the higher network cost as broadband usage grows.
Data connectivity servicesCPs use our Wholesale Ethernet portfolio to extend the reach of their Ethernet network or, where they have no network of their own, to add Ethernet services to their product range. They may also use it as part of a broader solution, for example, to connect end-users to the Hosted Communications Services we o er.
Our Ethernet portfolio o ers speeds from 2Mbps up to 10Gbps, delivered over the widest choice of access types in the market. This year we expanded our Ethernet network in Great Britain from around 1,170 nodes to over 1,230 and connected it to key data centres and telehouses.
Where traditional leased line connectivity is re uired, we also provide partial private circuits.
Our Mobile Ethernet Access Service connects mobile operators cell sites to their core networks over a single converged backhaul network. We continue to roll out this innovative and market-leading solution to more locations.
Voice servicesOur Wholesale Calls product enables CPs to o er voice calls without having to invest in their own voice network. CPs can present this as their own service while we provide the underlying network and billing capability on a white-labelled basis.
Where CPs have their own voice network, our Transit product connects it to other CPs networks at low cost.
Ofcom s Narrowband Market Review, which came into e ect from January 2014, will signi cantly reduce the price and pro tability of one of our voice products, Direct Conveyance, which enables calls to be made from CPs customers to BT s own end-users.
IP Exchange (IP )Increasingly people and businesses are making calls over their broadband and data connections, using VoIP. But while traditional PSTN calls use a common standard (which ensures that they can be easily carried across multiple networks), many di erent and incompatible technologies are being used for VoIP.
IP translates VoIP calls made using these di erent technologies as well as those sent between IP and PSTN networks. It ensures that calls get to their destination at the intended level of uality. We sell IP through BT Wholesale and, outside Great Britain, through BT Global Services. This year we gave IP the capability to carry voice calls in high de nition.
Hosted Communications ServicesWe launched our Hosted Communications Services portfolio this year. It provides a range of IP voice application services including Hosted Contact Centres, Inbound Call Services, IP Centrex and SIP trunking.
We host and manage these services on behalf of our CP customers. This is intended to save CPs money and to make it simpler for their own customers to run their businesses. CPs may buy the service either on its own or as a complete package which includes any necessary data connectivity and customer premises e uipment.
Managed SolutionsWe have a long and successful track record of designing, building, managing and transforming CPs networks for them. We enable CPs to o er complete voice, data and broadband products. We can extend this to include an end-to-end service wrap, from taking and processing new orders through to customer service and billing the end-user. This year we launched a new white-labelled broadband service and are able to o er signi cant cost savings by sharing the broadband infrastructure across multiple CPs.
These managed solutions give our customers access to our expertise and economies of scale and aim to help them reduce their operating costs and capital expenditure.
Media and Broadcast ServicesAll the UK s digital terrestrial TV is underpinned by our specialist media network. This network also delivers outside broadcast services from over 150 sports and news locations around the UK. Our global media network links all the main locations around the world where broadcast or lm content is created or distributed.
We have a number of global alliances which extend our portfolio and our geographical reach. For example, we have an alliance with Intelsat which improves our ability, and theirs, to deliver content over both satellite and bre connectivity. And we use partners to link TV stations to sports venues in North America.
Performance in the yearBT Wholesale s trading environment was tougher this year as a result of some signi cant customer, competitor and regulatory decisions. Our order intake was slightly lower than last year at £1.9bn and underlying revenue excluding transit declined 3%. But continuing cost transformation meant we improved our EBITDA trend, which was down just 1%. Operating cash ow was an in ow of £372m, up 7% due to the timing of customer receipts. Customer satisfaction was much higher as a result of the investments we have made in our service.
Key facts:
Broadband lines declined by 194,000, driven by moves to customers’ LLU networks
The outcome of Ofcom’s Narrowband Market Review will signi cantly impact pro tability
Ethernet revenue up 32% with volumes up 50%
£1.9bn order intake, compared with £2bn and £750m in the two prior years
Customer satisfaction at 78%, its highest level in recent years
Global IPX minutes up by two thirds, and revenue more than doubled
Operating performanceDespite the challenging trading environment we signed new deals worth £1.9bn. This was slightly less than last year s £2bn but well above the intake of £750m the year before.
These deals show that we continue to o er compelling propositions and that our customers trust in us to deliver.

43The Strategic ReportDelivering our strategy
Deliv
erin
g ou
r str
ateg
y
BT Wholesale 12-month rolling order intakeYear ended 31 March
0
500
1,000
1,500
2,000
2,500
Q1 Q2 Q3 Q4 Q1 Q2 Q3 Q4
£m
2013 2014
The number and mix of deals signed has changed from last year, with a greater contribution from smaller contracts. We have invested in selling and marketing more to our smaller customers, some of whom are achieving strong growth. For example, this year we agreed a contract with Timico Technology Group to manage their broadband, Ethernet and voice estate and migrate their voice tra c to IP . We also became the preferred supplier of Ethernet services to Spit re Technology Group. Other business won this year includes
contracts with two UK mobile operators to migrate their voice tra c to IP
managed data solutions (incorporating leased lines and Ethernet) for two major US telecoms providers
data centre services for a mobile operator and the provision of outdoor wi- network coverage for Brighton, Cardi and Glasgow city centres. We have also been appointed as the preferred supplier for three other cities.
Competition in the market is intense and is putting pressure on prices. This means that some of the contracts we extended and re-signed in the year will have lower margins. One of our large customers, The Post O ce, continued its migration from our white-labelled broadband and voice services, following its decision in 2012 not to renew its contract with us.
IP has continued to grow strongly. This year it carried over 11bn voice minutes within the UK, and over 14bn in total worldwide. Total IP revenues more than doubled. While in the UK these minutes have largely replaced calls previously carried over our non-IP network, we expect the service to boost our long-term position in the market place.
Ethernet performed well too, with the number of circuits sold increasing 50%. Revenues increased 32%, re ecting a highly competitive market for this product.
Customer service deliveryCustomer satisfaction levels rose substantially from 68% at the start of the year to 78% at the end. Customers responded well to having clearer service improvement plans backed by a new team of service improvement managers.
They also appreciated innovations such as a new diagnostic tool that makes it easier to locate faults, halving the average time it takes them to do so. Performance levels in our Ethernet and IP products were also better.
Customer satisfaction (3-month rolling average)Year ended 31 March 2014
65
70
75
80
Q1 Q2 Q3 Q4
%
Source: BT Customer Satisfaction survey. Based on responses from a monthlyrandom sample of BT Wholesale customers.
The delivery times and reliability of our next generation broadband services have continued to improve. In the fourth uarter we
cut the average time to provide WBC over copper by 8% and by 17% over bre (compared with a year ago) by investing in more automation
reduced WBC fault rates by 11% on copper and 21% on bre through better diagnostic tools and
resolved 73% of ueries in one contact with the customer compared with 62% a year earlier.
These improvements were all re ected in our RFT performance which was up 3.3% for the year.
Cost transformationOperating costs reduced 9% (2012 13 13%) or by 3% excluding transit costs (2012 13 1%). We achieved this through a structured programme including
reducing third-party supplier costs through contract renegotiation and making sure we only buy and pay for what we need
achieving e ciencies in selling and general administration costs. These were 13% lower than last year, mainly because of a lower number of employees and a £5m lower bad debt expense and
making more e cient use of our network, by more closely matching the capacity we put in place to the expected demand.
These cost reductions have been partially o set by higher cost of sales due to changes in our product mix (for example, as traditional voice services migrate to lower-margin IP).
Over 80% of our people are actively engaged in BT s drive to reduce energy consumption. This year we continued to remove redundant exchange e uipment from our legacy broadband network. This project is expected to reduce annualised energy costs by around £10m. Next year we will begin to bene t from similar work in our legacy voice and data networks.
A new Ethernet solution means that we can reduce the number of separate circuits needed in some networks. This meant that this year we removed thousands of surplus data circuits from mobile customers sites, with a view to reducing power consumption.

44 The Strategic ReportDelivering our strategy
Investing for the futureIn response to growing demand for cloud-based services, and as we seek to sell more white-labelled products, we launched a new range of Hosted Communications Services. A number of CPs are now selling this range and we will add more products to it next year.
We further expanded our broadband, Ethernet and IP platforms, including a new IP node in North America.
We are introducing Business one, a new online portal through which CPs can manage their orders and faults for products such as broadband, Ethernet and IP . Feedback from trial users this year has been very positive, so next year we will roll it out to all customers. We also plan to add more features and products to it.
We have developed solutions to support mobile operators as they deploy small cell technologies. After successful customer trials, we received the
rst formal re uest for a proposal for a small cell solution. We expect more to follow next year.
Financial performance
Year ended 31 March2014
£m2013a
£m2012a
£m
Revenue 2,422 2,608 2,943
Underlying revenue excluding transit (3)% (3)% (2)%
Operating costs 1,808 1,988 2,276
EBITDA 614 620 667
Depreciation and amortisation 245 254 259
Operating pro t 369 366 408
Capital expenditure 244 233 336
Operating cash ow 372 348 259a estated, see note 1 to the consolidated nancial statements.
Total revenue declined 7% (2012 13 11%, or 10% excluding the impact of ladder pricing, see page 49), mainly due to a £119m (2012 13 £277m) reduction in transit revenue.
Underlying revenue excluding transit declined 3% (2012 13 3%, or 1% excluding the impact of ladder pricing). This was primarily due to a 15% decline in broadband revenues, as lines continue to migrate to U, and a 16% decline in traditional calls and lines revenue which includes the impact of the Narrowband Market Review (NBMR). These e ects were partially o set by strong growth in IP services of 28% as well as 7% growth in managed solutions.
Revenue from managed solutions accounted for 37% of total revenue this year, up from 32% last year.
EBITDA declined 1% (2012 13 7%, or 3% excluding the impact of ladder pricing) as cost transformation helped to o set the impact of lower revenues. Depreciation and amortisation were down 4% (2012 13 2%) contributing to operating pro t increasing 1% (2012 13 10% decline).
Capital expenditure increased 5% (2012 13 31% decrease). This was primarily due to higher spend on the IP platform (to increase capacity to meet growing demand) and investment in systems to drive future e ciencies.
Operating cash ow increased 7% (2012 13 34%) principally due to the timing of customer receipts.
OpenreachWe are delivering the bre broadband rollout on behalf of the group and are playing our part in building Britain s connected future, helping businesses to grow and communities to prosper.
Openreach is responsible for providing services over the local loop (sometimes known as the local access network or the last mile). This is made up of the copper and bre connections between our exchanges, and homes and businesses. We also o er backhaul products to connect exchanges to CPs networks.
BT s Undertakings (more on page 49) commit us to selling our main products and services to all CPs openly and e ually and on the same terms as we do to BT s own lines of business. To make this work properly, Openreach s operational, engineering and systems capabilities are separate from those of the rest of BT. Around 99.7% of Openreach revenue is subject to these Undertakings.
Markets and customersBT serves the wholesale telecoms customer segment in Great Britain through Openreach and BT Wholesale. In Northern Ireland and the Republic of Ireland, BT serves wholesale customers through BT Ireland.
Openreach has around 540 CP customers, the largest of which are other BT lines of business (particularly BT Consumer and BT Business), Sky and TalkTalk. Openreach does not sell directly to end-customers.
Our main competitor for consumer services is Virgin Media, whose network covers just under half of UK homes. We have many competitors in the business market, where the focus is on selling high capacity data connections. Our main competitors are Virgin Media, Colt Group and Vodafone.
Products and servicesOpenreach sells three main products bre broadband, copper-based services and Ethernet.
Fibre broadbandOur wholesale bre broadband product is called Generic Ethernet Access (GEA). The FTTC variant of GEA uses copper for the nal connection to the customer. It o ers speeds of up to 80Mbps. The FTTP variant o ers faster speeds of up to 330Mbps and uses bre all the way to the customer premises.
In April 2013, we launched FTTP-on-Demand. This lets end-customers in FTTC areas get an FTTP connection if they need one we think SMEs will be especially interested in the faster speeds that this supports. We have initially made FTTP-on-Demand available in 42 exchange areas, and plan to make it available across our entire bre broadband footprint.
We have introduced more installation choices for our CP customers. While we continue to o er managed installation of bre broadband (which entails an Openreach engineer visiting a home or business site), we now o er CPs the option of providing the service without an Openreach engineer visit.
We also o er Fibre Voice Access which allows CPs to o er voice services over FTTP that are similar in functionality to copper-based voice services.
Our bre broadband network can also carry broadcast and on-demand internet protocol television (IPTV) services. We provide a multicast service which cuts the cost of delivering broadcast TV over our network and means CPs (generally triple-play providers) can prioritise broadcast TV over other web tra c.

45The Strategic ReportDelivering our strategy
Deliv
erin
g ou
r str
ateg
y
Passive Infrastructure Access (PIA)PIA products allow CPs to rent space in Openreach s ducts or on telephone poles. CPs can use this space for their own bre networks instead of buying bre broadband services directly from us.
Wholesale ine Rental (W R)W R is a copper-based service which lets CPs o er own-branded phone services (with their own pricing and billing) using our e uipment and network. They pay to use the copper lines between our exchanges and customer premises but can avoid investing in extra network e uipment or infrastructure.
ocal oop Unbundling ( U)U is also a copper-based service. It allows CPs to o er broadband
services by installing their own e uipment in our exchanges and renting the copper line to the customer premises. CPs can use our shared metallic path facility (SMPF) product to o er broadband over a W R line or our metallic path facility (MPF) product to o er both phone and broadband services over a copper line using their own e uipment.
EthernetOur Ethernet products o er business-grade, dedicated bre connections. CPs use them in their own networks and to provide high
uality, high bandwidth services to businesses and the public sector.
ou can read more about these services at www.openreach.co.uk
Performance in the yearOur bre broadband network passes more than 19m premises and is being used by 2.7m end-customers. Our physical line base grew by 83,000 in the year. But our service performance was a ected by the extreme weather conditions and widespread ooding across the UK.
Key facts:
Third consecutive year of growth in total physical lines
Ethernet circuits up 14%
Fibre broadband coverage more than 19m premises
1.3m new bre broadband customers
Operating performance During the year we largely nished building bre broadband
infrastructure in areas where the business case is viable without public subsidies. We also started to roll out bre to wider communities, supported by public funding from the Broadband Delivery UK (BDUK) programme. This funding was awarded to us following competitive tenders. We are now in the build phase for each of these contracts.
Total premises passed with breAt 31 Marchmillion
0
12
9
6
3
15
18
21
2010 2011 2012 2013 2014
Take-up of bre broadband is growing strongly, with 1.3m new bre connections during the year and over 2.7m homes and businesses now connected.
There are 18.5m DS and bre broadband users on our network, an increase of 0.8m in the year.
The UK was rst in eight out of twelve measures in Ofcom s 2013 EU Broadband scorecard which assesses factors such as broadband coverage, take-up and usage in the UK, France, Germany, Italy and Spain.
Despite the problems caused by the weather, we managed to grow our physical line base by 83,000 in the year. This is the third consecutive year of growth.
The number of Ethernet circuits we provide grew 14% in the year. This re ects more demand for connections for CPs business customers as well as CPs re uiring greater speeds and capacity within their own networks.
Customer service deliveryPeople are increasingly reliant on their xed-lines for continuous access to the internet. This means customer expectations have risen around the time taken to install, upgrade or repair their line. Ofcom is proposing to introduce minimum service levels around the repair and provision of lines.
Although we have made progress improving some aspects of our service, we have not always kept pace with customers shifting expectations. The main area where we did improve was in providing new lines to homes and businesses. The average time to provide a new line was around ten days, in line with the commitments we had made to industry. We installed 93% of lines on the day agreed with customers, and only 6% of lines developed a fault within 28 days.
But we need to increase the speed and consistency with which we repair faults in our network. We repaired only 70% of faults within the timeframe we had committed to customers. While repair performance was hampered by the extreme weather between December and February, we are committed to increasing investment in the resilience of our network.
For our business customers, our Ethernet provision performance was below our targets. In particular, we missed the agreed customer delivery date for around one in six Ethernet orders. More positively, once provided, our Ethernet services proved robust and less than 12% of circuits re uired a repair during the year.
Our RFT was up on average for the rst three uarters but then declined 1.9% due to widespread storms and ooding across the UK, which led to record fault volumes and meant it took longer than normal to provide our services.

46 The Strategic ReportDelivering our strategy
Cost transformationOperating costs reduced 1% (2012 13 4%) as cost e ciencies o set pay in ation and the additional engineering resource we recruited to support bre provision in rural areas. The weather conditions also impacted our costs in the year.
We are increasing the e ciency of our operations through process improvements, better training, improved tools and e uipment for our engineers, and by recruiting engineers with more exible terms and conditions.
This year we
provided over 13,000 new PCs and mobile devices to our workforce launched 20 bespoke smartphone apps that simplify or automate a large number of engineering tasks and
helped our engineers become more productive.
Investing for the futureWe continue to invest in both our network and our people to improve the service we provide to our customers. This year we
invested £1.0bn (2012 13 £1.1bn) in our copper and bre networks to extend coverage, improve service and increase functionality. This supports our aim to be trusted to deliver reliably and consistently
trialled vectoring technology this could potentially increase our FTTC broadband speeds to above 100Mbps
provided 140,000 hours of training (30% more than last year), to ensure that our people have the right skills for their roles
recruited around 2,000 people into permanent roles, including 500 apprentices and
announced plans to invest £50m in the next three years to improve broadband coverage in UK cities.
Financial performance
Year ended 31 March2014
£m2013a
£m2012a
£m
Revenue 5,061 5,115 5,187
Operating costs 2,460 2,473 2,569
EBITDA 2,601 2,642 2,618
Depreciation and amortisation 1,406 1,428 1,416
Operating pro t 1,195 1,214 1,202
Capital expenditure 1,049 1,144 1,075
Operating cash ow 1,492 1,475 1,514a estated, see note 1 to the consolidated nancial statements.
Revenue declined 1% (2012 13 1%) as regulatory price changes had a negative impact of around £260m, the e uivalent of 5%. This was partly o set by 86% growth in bre broadband revenue and a 4% increase in Ethernet revenue driven by higher volumes.
Operating costs reduced 1% (2012 13 4%). EBITDA and operating pro t decreased 2% (2012 13 1% increase).
Capital expenditure decreased 8% (2012 13 6% increase). While our commercial bre build is nearing completion, we have maintained the same intensity of overall bre rollout through the BDUK programme. We received £110m of funding relating to this programme. Operating cash ow increased 1% (2012 13 3% decrease).
BT Technology, Service & Operations (BT TSO)BT TSO is our internal service unit. It supports our customer-facing lines of business and has 13,500 people.
BT TSO is responsible for the whole lifecycle of our global networks and systems from innovation, design, test and build through to operational management. It is structured to simplify the way we work, help us further transform our cost base and improve delivery to BT customers.
Our goal is to make our processes more e cient with fewer hand-o s between divisions and higher levels of automation. This will reduce cost. It will also eliminate process failure which will give our end-customers a better service. We lead and deliver BT s long-term technology strategy and research and innovation programmes, including managing BT s worldwide patent portfolio (see page 28).
We are responsible for managing the groups energy consumption and for putting strategies in place to cut our carbon footprint.
Products and servicesWe manage the voice, data and TV networks and IT applications which make up the core infrastructure for BT s products and services. Our people also design and deliver the large-scale global managed network services which are used by our lines of business or sold by them to customers in the UK and internationally.
Our teams work to improve the service experience of our customers from consumers through to major corporations and our big UK wholesale customers.
We work end-to-end across the group. We analyse and improve processes that cut across organisational and operational boundaries, to help BT deliver to customers right rst time .
We make sure that BT s networks and systems run e ciently. We close down those systems that are no longer needed and move our customers on to better products and services. We are working to improve the resilience and reliability of our networks so that our customers do not su er network failure or loss of service.
We work with our lines of business to make sure they make the most of technology advances across all customer segments and products.
Performance in the yearWe have reduced our costs at the same time as improving the reliability of our IT systems. We have again reduced the groups energy consumption.
Key facts:
Group-wide energy consumption reduced by 3%
Delivered technology changes to support the launch of BT Sport
Improvement in IT systems reliability for the third consecutive year
Queen’s Award for Enterprise 2014: Innovation for IPX
BT TSO has continued to drive the groups innovation programme and the development of our networks and platforms. You can read more about this on pages 26 to 28.
This year, we reduced our overall managed costs by focusing on Continuous Improvement (see page 16) and simpli cation. We have also delivered cost reductions from insourcing, both by driving productivity gains as we build specialist skills in our global development centres, and by retraining our own people to take on work previously done by third parties.
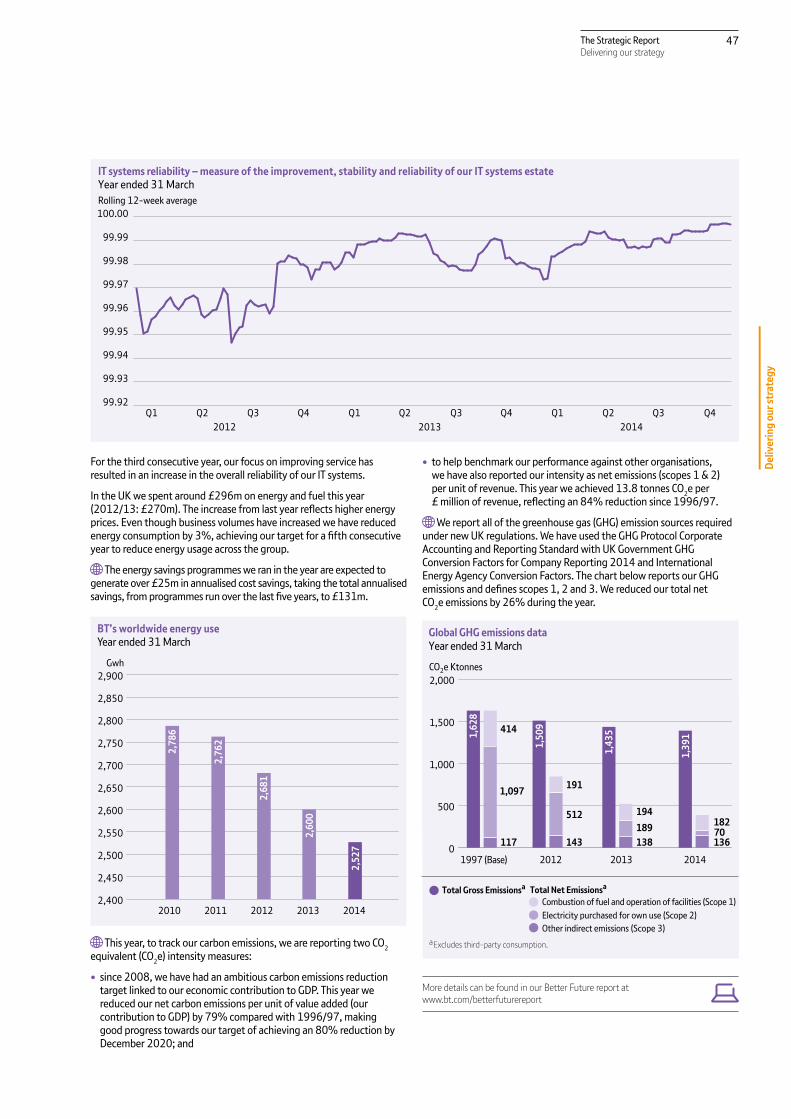
47The Strategic ReportDelivering our strategy
Deliv
erin
g ou
r str
ateg
y
For the third consecutive year, our focus on improving service has resulted in an increase in the overall reliability of our IT systems.
In the UK we spent around £296m on energy and fuel this year (2012 13 £270m). The increase from last year re ects higher energy prices. Even though business volumes have increased we have reduced energy consumption by 3%, achieving our target for a fth consecutive year to reduce energy usage across the group.
The energy savings programmes we ran in the year are expected to generate over £25m in annualised cost savings, taking the total annualised savings, from programmes run over the last ve years, to £131m.
BT’s worldwide energy useYear ended 31 March
Gwh
2012 20132010 2011 20142,400
2,450
2,500
2,550
2,600
2,650
2,700
2,750
2,800
2,850
2,900
2,78
6
2,76
2
2,68
1
2,60
0
2,52
7
This year, to track our carbon emissions, we are reporting two CO2 e uivalent (CO2e) intensity measures
since 2008, we have had an ambitious carbon emissions reduction target linked to our economic contribution to GDP. This year we reduced our net carbon emissions per unit of value added (our contribution to GDP) by 79% compared with 1996 97, making good progress towards our target of achieving an 80% reduction by December 2020 and
to help benchmark our performance against other organisations, we have also reported our intensity as net emissions (scopes 1 2) per unit of revenue. This year we achieved 13.8 tonnes CO2e per £ million of revenue, re ecting an 84% reduction since 1996 97.
We report all of the greenhouse gas (GHG) emission sources re uired under new UK regulations. We have used the GHG Protocol Corporate Accounting and Reporting Standard with UK Government GHG Conversion Factors for Company Reporting 2014 and International Energy Agency Conversion Factors. The chart below reports our GHG emissions and de nes scopes 1, 2 and 3. We reduced our total net CO2e emissions by 26% during the year.
1997 (Base)
CO2e Ktonnes
0
500
1,000
1,500
2,000
Global GHG emissions dataYear ended 31 March
1,6
28
Total Gross Emissionsa Total Net Emissionsa
Combustion of fuel and operation of facilities (Scope 1)Electricity purchased for own use (Scope 2)Other indirect emissions (Scope 3)
a Excludes third-party consumption.
117
1,097
414
2014
1,39
1
18270136
2013
1,43
5
194189138
2012
1,50
9
191
512
143
More details can be found in our Better Future report at www.bt.com betterfuturereport
IT systems reliability – measure of the improvement, stability and reliability of our IT systems estateYear ended 31 MarchRolling 12-week average100.00
99.99
99.98
99.97
99.96
99.95
99.94
99.93
99.92
2012 2013 2014Q4Q1 Q2 Q3 Q4 Q1 Q2 Q3 Q4 Q1 Q2 Q3

48 The Strategic ReportDelivering our strategy
Human rightsBT s human rights policy is set out in The Way We Work , our statement of business practices. It applies to all BT employees, our suppliers and anyone working on behalf of BT.
To cover the most likely areas where BT could negatively impact on human rights, we have clear global policies which cascade from our statement of business practices. These include Anti-Corruption Bribery our Data and Privacy policies the GS18 Sourcing with Human Dignity standard (which applies to all of BT s suppliers) our Con ict Minerals Policy various security policies and a number of our Human Resources policies (covering diversity, inclusion, and health, safety and wellbeing).
We monitor the e ectiveness of these policies on a regular basis with the appropriate Board committee oversight. During the year, the Compliance Programme Panel, a committee of senior commercial representatives from across the business, reviewed our compliance framework for human rights and in March 2014 we reported on our progress to the Operating Committee, Nominating Governance Committee and Audit Risk Committee. We also conducted an initial impact assessment to clarify the areas where our operations are most likely to impact human rights. The main ones relate to workers in our supply chain how we safeguard data about our customers and employees and the way our products and services are used. We will continue with and expand on this work.
We have in place, and have used, escalation processes for issues or non-compliance with these policies. We also have our con dential hotline, for reporting certain types of malpractice or wrongdoing in the work place. We act upon instances of ethical or compliance misconduct and include some information on this area in our Better Future report.
ou can nd our Better Future report at www.bt.com betterfuturereport
Our aims for 2014 15 include further developing our compliance framework in consideration of human rights, including a Board level review of our overarching human rights policy. We will continue to work with our suppliers, customers and partners, along with industry, sector and government bodies to reinforce the message around respect of human rights. Our Better Future strategy and our involvement in local communities drives forward our objective to promote and support human rights.
RegulationIn nearly all our markets, communications services are subject to regulation by governmental and non-governmental bodies. This is to make sure that CPs abide by common standards and rules and that nobody is disadvantaged by those CPs with strong positions in their markets. In this section we explain some of the recent and upcoming decisions taken by regulators and how they a ect us.
European Union (EU) regulationIn EU countries, electronic communications networks and services are governed by a number of European directives and regulations. These create a Europe-wide framework covering services including
xed and mobile voice, broadband, cable and satellite TV.
The directives include rules covering access and interconnection, universal service obligations, and a re uirement for national regulators to review markets for signi cant market power (SMP) every three years. They also cover how regulators set price controls. They re uire regulators to consult with the European Commission (EC) on any price control decisions before they are nalised to make sure they are consistent with European regulations.
In 2014 15 telecoms legislation will be revised to further harmonise rules across member states on access, spectrum and mobile roaming. The EC is also expected to review which markets should be covered by telecoms regulation.
UK regulationThe telecoms industry is regulated primarily by Ofcom (the UK s independent regulator), through various European directives, the Communications Act 2003 (the Communications Act), as well as other regulations and recommendations.
The Communications ActThe Communications Act gives Ofcom legal powers and sets out the re uirements for how electronic communications services should be regulated in the UK. It includes the conditions imposed by the European directives.
In July 2013, the UK Government set out its plans ( Connectivity, Content and Consumers ) to make sure that people and businesses are able to make the most of the digital age. These include a review of broadcasting and pay-TV regulation and aim to give Ofcom a duty to ensure consumers can easily switch bundles of services between suppliers. Any agreed changes may need to be incorporated into the Communications Act.

49The Strategic ReportDelivering our strategy
Deliv
erin
g ou
r str
ateg
y
OfcomOfcom is the independent regulator and competition authority for the whole UK communications market.
Its main duties are
to further the interests of citi ens in relation to communications matters and
to further the interests of consumers in relevant markets, where appropriate by promoting competition.
Under the powers of the Communications Act, Ofcom sets conditions that CPs must comply with. Some conditions, known as General Conditions, apply to all CPs. These mainly deal with protecting consumers general access and interconnection, planning for emergencies, providing information to Ofcom, and allocating and transferring phone numbers.
Other conditions apply to certain individual companies that Ofcom has decided are universal service providers or have SMP in a particular market. Anyone can appeal against Ofcom s decisions through a number of routes, including to the Competition Appeal Tribunal (CAT) or to the High Court.
Following a market review, if Ofcom decides that a CP has SMP, it can put controls in place, typically on the prices which the CP can charge. Ofcom will generally try to set charges that are reasonably based on costs and an appropriate return on the capital invested.
We are the designated universal service provider for the UK (except for the Hull area where it is KCOM Group) and so we have certain universal service obligations. Our main obligation is to make sure that basic xed-line services are available at an a ordable price to all consumers in the UK. We are also obliged to provide public payphones.
Impact of regulationThere were a number of regulatory decisions and outcomes of appeals that a ected us during the year and will impact us in the future. Overall, regulatory price reductions lowered our group revenue and EBITDA by £150m to £200m in the year.
Ofcom completed its review of the Wholesale Narrowband market, which covers calls and interconnection services. New controls came into e ect on 1 January 2014 and will run until 30 September 2016. The main change was to reduce the amount we can charge other CPs for delivering their calls to customers on our network ( xed call termination). The impact of this will be partly o set by an increase in the amount we can charge CPs whose customers make calls on our network ( xed call origination).
During the year Ofcom started a review of both the Fixed Access market (covering W R, U, GEA, ISDN 2 and ISDN 30 products) and the Wholesale Broadband Access market (covering IPstream, Datastream and WBC). This review is not expected to be completed until June 2014. Related to this, Ofcom is expected to publish a consultation on guidance for applying an ex ante margin s uee e test in the summer.
In May 2013, Ofcom opened an investigation following a complaint which alleges that BT has abused its dominant position, such that the margin between the prices BT Consumer charges for some of its bre broadband products, and the wholesale price charged by Openreach for the relevant network inputs, is insu cient to allow other CPs to compete pro tably. We refute this allegation. We expect Ofcom to reach a decision later in 2014.
In August 2011, the CAT decided in favour of our wholesale ladder pricing policy. adder pricing links the amounts that BT charges mobile operators for mobile calls to 0800, 0845 and 0870 numbers terminating on our network to the retail price charged by mobile operators to their customers. In July 2012, the Court of Appeal overturned the CAT s decision. We were granted permission to appeal to the Supreme Court and the hearing took place in February 2014. A decision by the Supreme Court is expected later in 2014.
In June 2010, Sky appealed to the CAT against Ofcom s decision to regulate Sky Sports 1 and 2. In August 2012, the CAT decided in Sky s favour. We successfully appealed the CAT s decision in February 2014, the Court of Appeal published its judgment that the CAT must now reconsider the case. Sky has sought permission to appeal the Court of Appeal judgment from the Supreme Court, which is expected to decide by July 2014 whether or not to grant permission.
We have raised a complaint with Ofcom over the wholesale supply terms Sky is insisting on for Sky Sports 1 and 2 for customers using our YouView set-top box. Ofcom opened a formal investigation in June 2013 and its investigation continues.
In December 2012, Ofcom issued nal determinations on disputes over historic Ethernet pricing. Ofcom concluded that between April 2006 and March 2011 the prices we set for certain Ethernet services were too high resulting in an overcharge of £151m over this period. We recognised this amount as a speci c item charge in 2012 13 (see page 141) but we disagree with the determinations and have appealed to the CAT.
See Ofcoms website at www.ofcom.org.uk for more details on regulation
BT s UndertakingsIn response to Ofcom s 2005 strategic review of telecommunications, we put forward some legally binding undertakings under the Enterprise Act 2002. These Undertakings (which included the creation of Openreach) began in September 2005. They aim to give clarity and certainty to the UK telecoms industry about the way we provide upstream regulated products. This in turn supports e ective and fair competition in related downstream markets.
Our relationship with HM GovernmentWe can be re uired by law to do certain things and provide certain services to government. For example, under the Communications Act, we (and others) can be re uired to provide or restore services during disasters. The Civil Contingencies Act 2004 also says that the Government can impose obligations on us (and others) at times of emergency or in connection with civil contingency planning. The Secretary of State can also re uire us to take certain actions in the interests of national security and international relations.
Overseas regulationThe degree of regulation in international markets varies widely. This can hinder our ability to compete. We are pressing incumbent operators and their national regulatory authorities around the world for fairer, cost-related wholesale access to their networks.
We are in discussions with both the EC and US regulatory authorities over what we believe to be premature deregulation of parts of the US telecoms market. This has made it more di cult for non-US CPs to enter and compete in the US while European telecoms markets remain open to competition from US operators.

650 The Strategic ReportDelivering our strategy
Our risksike all businesses, we are a ected by a number
of risks and uncertainties. These may be impacted by internal and external factors, some of which we cannot control. Many of our risks are akin to those felt by other companies of similar scale and operation.
Principal risks and uncertaintiesThis section features some of the principal risks and uncertainties a ecting us, but it is not exhaustive. These risks have the potential to impact our business, brand, assets, revenue, pro ts, li uidity or capital resources. The principal risks we described last year have evolved, and so has our response to them.
Our Enterprise Risk Management framework provides reasonable (but cannot give absolute) assurance that signi cant risks are identi ed and addressed. There may be some risks which are unknown to us at present. And there may be some that we consider less signi cant now but become more important later.
As in the prior year, external factors present both risks and opportunities, both to our business and to others. Inevitably, there are uncertainties in terms of the impact to BT should Scotland vote in favour of independence in September 2014. We have performed a high-level risk assessment of what those implications may be, and will continue to monitor the issue, seeking clari cation on key uestions from relevant parties where possible.
External factors drive a number of the risks that we face and we focus our e orts on predicting and mitigating these, while at the same time seeking to capitalise on opportunities that may emerge.
In the principal risks section below, we talk about what we are doing to stop our main risks materialising, or to limit their impact. Our principal risks and uncertainties should be considered in conjunction with our risk management process, the forward-looking statements in this document and the cautionary statement regarding forward-looking statements.
ou can read the cautionary statement regarding forward-looking statements on page
192
How we manage riskWe need to manage risk so we can meet our objectives, build shareholder value and promote our stakeholders interests. We have a group-wide risk management process, the four stages of which are shown below.
Identi cation
Business activitiesMonitoring Evaluation
Response
Changes over the yearIn 2012 13, we improved the way we manage risk through applying further scenario planning and war gaming techni ues increasing our assurance over risk management within the lines of business and refreshing our guidance and risk management toolkit. This year we made further improvements including
Enhanced risk management trainingWe have signi cantly refreshed our risk management training and rolled this out across the group, reaching a wide audience of colleagues across 26 countries.
Better linkage between our investments and risksAs well as considering risks within investment cases, we have more formally linked our investments and our principal risks by re uesting that investment case proposals re ect any impact they may have on these risks.
Proactive assessment of emerging risksBuilding on our regular hori on scanning, the Group Risk Panel has commissioned and reviewed speci c analysis of emerging risks from a number of possible future geo-political events. This has improved our understanding of potential impacts and improved our readiness through early mitigation and contingency planning.
Line of business and service unit audit & risk committees
Line of business and service unit leadership teams
Our lines of business and our service unit follow our process for managing risk as part of our Enterprise Risk Management framework. That means identifying and responding to the key risks to their business. They record the risks in a register for their leadership teams to review. Audit risk committees in each line of business, and our service unit, ensure this process is e ective.
Operating Committee
The Operating Committee identi es, evaluates, responds to and monitors risks. Signi cant risks are reported and monitored through the Group Risk Register. The Operating Committee assigns a management owner to take charge of monitoring and managing each risk. It monitors these risks through regular detailed reviews as well as six-monthly reviews of the Group Risk Register.
Group Risk Panel
The Group Risk Panel supports the Board and the Operating Committee. Every three months it reviews the Group Risk Register (which summarises those risks of greatest signi cance across our business), considers the inclusion of new or emerging risks, and recommends ways to tackle them. It also oversees the work of the group risk management function.
Audit & Risk Committee
Board
The Board has overall responsibility for making sure we manage risks appropriately. It regularly reviews either directly, or through the Audit
Risk Committee, how we are doing across the group, in our lines of business and in our service unit.
Enterprise Risk Management framework

51The Strategic ReportDelivering our strategy
Deliv
erin
g ou
r str
ateg
y
Security and resilienceThe volume of tra c through our systems and networks is always growing, and our customers tolerance of service interruption is reducing as the world becomes increasingly dependent on information technology. Expectations are even higher when we stream live action through BT Sport. We have a responsibility to many millions of customers, both business and consumer, to safeguard their electronic information and to maintain the continuity of our services. We also need to safeguard the availability and security of our own data and intellectual property. This all re uires the highest levels of operational resilience and security, which can be threatened at any time by malicious cyber-attacks, damage or theft of copper cable and e uipment, vandalism, sabotage, extreme weather, component overload, loss of power and human error.
ImpactA breach of our security, or compromise of data or resilience a ecting our operations, or those of our customers, could lead to an extended interruption to our services or even a ect national infrastructure. Such failure may lead to a loss of customer con dence, termination of contracts, loss of revenue, and lower cash generation through penalties and unplanned costs of restoration and improvement. Additional reputational damage and nancial loss may arise from a legal or contractual failing such as breaching data protection or handling re uirements. Failure or interruption of data transfer could also have a signi cant adverse e ect on our business.
Changes over the last yearThe external cyber threat continues to rise, as shown by the amount of data tra c blocked by our malware lters and intrusion detection systems, and by the number of attempts to disrupt the websites that we manage. Criminal use of targeted phishing messages and other deception techni ues are seen as the fastest growing risk. Government agencies around the world have raised their threat warning levels for cyber-attacks as larger numbers of credit and debit card records are reported stolen. In response, we have reinforced our cyber defences and automated them wherever possible. We have stepped up campaigns to educate and train our people in security awareness, vigilance and regulatory obligations. Access rights to our premises, systems and data continue to be closely monitored and restricted. The replacement of e uipment that is approaching the end of its service life provides an opportunity to invest in new, more resilient facilities. As new technologies allow us to rationalise our property and systems estate, the need for greater fall-back capacity increases. A comprehensive review of our disaster recovery capability is therefore underway, focusing on our most critical systems, databases and exchanges.
Risk mitigationOur security strategy aims to prevent, deter and minimise the conse uences of attacks. Our defences include physical protection of our assets, encryption of data, control of access rights, real-time analysis and sharing of intelligence, and continuous monitoring for intrusion, modi cations and anomalies. We can rapidly adjust rewalls to automatically block most malicious data tra c. Our resilience stems from a combination of formal business continuity planning, well-tested, rapid and exible responses and a widely distributed network with inherent spare capacity. We have a rolling programme of major incident simulations to test and re ne our crisis management procedures. Together, these measures reduce the likelihood of a major incident and ensure that any potential interruption or damage can be contained and dealt with as uickly as possible.
Major contractsWe have a number of complex and high-value national and multinational contracts. The revenue arising from, and the pro tability of, these contracts are subject to a number of factors including variation in cost achievement of cost reductions anticipated in the contract pricing (both in terms of scale and time) delays in the delivery or achievement of agreed milestones owing to factors either within or outside our control changes in customers re uirements, budgets, strategies or businesses and the performance of our suppliers. Any of these factors could make a contract less pro table or even loss-making.
The degree of risk generally varies depending on the scope and life of the contract and is typically higher in its early stages. Some customer contracts re uire investment in the early stages, which is expected to be recovered over the life of the contract. Major contracts often involve the implementation of new systems and communications networks, transformation of legacy networks and the development of new technologies. The recoverability of these upfront costs may be impacted by delays or failure to meet milestones. Substantial performance risk exists in these contracts.
ImpactFailure to manage or meet our commitments under these contracts, as well as changes in customers re uirements, budgets, strategies or businesses, may lead to a reduction in our expected future revenue, pro tability and cash generation. Unexpectedly high costs associated with the delivery of contracts could also negatively impact pro tability. We may lose revenue due to the merger, ac uisition or business failure of customers, or due to contract termination, and contracts may therefore become loss-making. Failure to replace the revenue and earnings lost from those customers could lead to an overall reduction in group revenue, pro tability and cash ow.
Changes over the last yearTough market conditions and increased competitive pressures continue to persist in many global regions. In some regions we are experiencing higher growth in volume of business due to previous investments. This changes the risk landscape and the focus of risk support and review. In the year, the increasing number of broadband delivery contracts with local authorities through the BDUK programme is of particular note. While these contracts carry a di erent risk pro le from our other major contracts, we are applying our established risk governance and reporting processes to ensure that any risks and mitigation activities are identi ed and reported to management.
Risk mitigationWe have a group-wide risk governance and reporting framework and line of business local governance and risk management processes to track key risks and mitigation activities. This governance has been enhanced through the establishment in BT Global Services of a Contract Centre of Excellence, an additional Contract Compliance Function, and a Contract Bid Governance Board. Assurance is also provided through independent audits and at an individual contract level through an independent review programme. Progress on risks and mitigation actions agreed at such independent reviews are monitored and reported to relevant senior managers to ensure progress can be tracked.
Development programmes are in place to improve our people s skills and ability to identify and manage risk and to ensure learning from previous experience is passed on in training programmes. The scope and availability of training opportunities continues to improve in line with BT-wide learning and development initiatives.
Our principal risks

652 The Strategic ReportDelivering our strategy
PensionsWe have a signi cant funding obligation in relation to our de ned bene t pension schemes and operate a large de ned bene t pension scheme in the UK, the BT Pension Scheme (BTPS).
The BTPS faces similar risks to other de ned bene t schemes. Future low investment returns, high in ation, longer life expectancy and regulatory changes may all result in the cost of funding the BTPS becoming a signi cant burden on our nancial resources.
Following conclusion of the last actuarial funding valuation in May 2012, the valuation documentation was submitted to the Pensions Regulator. The nal Court decision in the Crown Guarantee case, after any appeals, will give greater clarity as to the extent to which the liabilities of the BTPS are covered by a Crown Guarantee. This will inform the Pension Regulator s next steps with regards to the valuation of the Scheme. Accordingly, as matters stand, it is uncertain as to when it will conclude its review.
ImpactAn increase in the pension de cit at the next actuarial valuation as at 30 June 2014 may have an impact on the level of de cit payments we are re uired to make into the Scheme. Indirectly it may also have an adverse impact on our share price and credit rating. Any deterioration in our credit rating would increase our cost of borrowing and may limit the availability or exibility of future funding, thereby a ecting our ability to invest, pay dividends or repay debt as it matures.
Changes over the last yearThe BTPS is a ected by nancial market conditions. When determining expected future returns, di erent factors are taken into account, including yields (or returns) on government bonds. Government bond yields have remained below the levels at the last funding valuation, driven by a number of factors, including the Bank of England s Quantitative Easing programme. If these conditions continue and a lower investment return assumption is adopted at the 30 June 2014 valuation, the liabilities may increase, potentially leading to a higher level of de cit payments.
The European Commission published draft revisions to the current Pensions Directive in March 2014. The proposed changes primarily focus on governance and transparency and are not expected to impact the valuation of pension liabilities.
In the UK, the Pensions Regulator has a new objective to consider the impact on the sustainable growth of an employer when reviewing funding plans. As a result, the Pensions Regulator is revising its Code of Practice which is expected to be nalised later this year.
Risk mitigationThe investment performance and liability experience, as well as the associated risks and any mitigation, are regularly reviewed and monitored by both us and the BTPS Trustee. The BTPS has a well-diversi ed investment strategy, which reduces the impact of adverse movements in the value of individual asset classes and helps ensure that an e cient balance of risk and return is maintained.
Our nancial strength and cash generation provide a level of protection that enables variations in the funding position of the BTPS to be managed without having a material impact on the ongoing performance of our business. The funding liabilities also include a bu er against any future negative experience, as legislation re uires that liabilities are calculated prudently.
We regularly review risk mitigation options and in April 2013, we launched an exercise to allow existing BTPS pensioners to receive a higher upfront pension, by giving up some of their future pension increases. This exercise is now largely complete and is expected to remove the exposure in the scheme to future changes in in ation on around £2.5bn of liabilities.
Growth in a competitive marketWe operate in markets which are characterised by high levels of change strong and new competition declining prices and in some markets declining revenues technology substitution market and product convergence customer churn and regulatory intervention to promote competition and reduce wholesale prices.
A signi cant proportion of our revenue and pro t is generated in the UK where the overall telecoms market has been in decline in real terms, despite strong volume growth in new services. Revenue from our calls and lines services to consumers and businesses has historically been in decline but new broadband and connectivity markets are growing. Our ability to deliver pro table revenue growth in a responsible and sustainable manner depends on us delivering on the strategic investments we are making (see page 17).
ImpactFailure to achieve sustainable, pro table revenue growth could erode our competitive position and reduce our pro tability, cash ow and ability to invest for the future.
Changes over the last yearDespite the slight improvement in the UK economy in the year, customers are still cautious with their spending, especially those small business customers not planning to make technology changes. Regulatory decisions related to charge controls have impacted negatively our revenue and pro ts. Regulation has failed to address imbalances in the competitive playing eld between the heavily regulated xed telecoms sector and other sectors such as mobile and pay-TV. This means that some of our competitors in the consumer space continue to bene t from both limited regulation of their core business and extensive sector-speci c regulation of our UK xed-line business.
The consumer broadband and triple-play markets remain very competitive. Sky ac uired O2 (Telefónica) UK s consumer broadband business and continues to cross-sell broadband and telephony services to its pay-TV customers. Virgin Media (ac uired by iberty Global in the year) remains strong in these markets. In addition, the four main UK mobile operators launched 4G services during the year.
Risk mitigationOur mitigation of this risk centres on successfully executing our strategy. We believe that delivering this strategy, with its focus on delivering superior customer service, transforming our costs, and investing for growth, will together help us deliver sustainable, pro table revenue growth. We are investing in our business, such as in
bre, content and the high-growth regions of the world. Our extensive cost transformation programme is already delivering savings and will continue to support pro tability trends. We also believe we can mitigate this risk by seeking changes in regulation to level the playing
eld so that we can compete e ectively and bene t our customers.

53The Strategic ReportDelivering our strategy
Deliv
erin
g ou
r str
ateg
y
Communications industry regulationOur activities across all the jurisdictions in which we operate can be impacted by regulation. In the UK where, following detailed market analysis, we are found to have signi cant market power, Ofcom can re uire us to provide wholesale services at regulated prices and service levels. It can also re uire us to make retrospective repayments to other CPs where we are found to have set prices outside regulatory re uirements, and can impose nes on us for non-compliance with the regulatory rules, including competition law.
Outside the UK, general licensing re uirements can restrict the extent to which we can enter markets and compete. Regulation will also de ne the terms on which we can purchase key wholesale services from others.
In the UK, risks can come from periodic market reviews (which might introduce tighter regulatory constraints), new charge controls, or CPs disputing or complaining about our pricing, products or services. Outside the UK, regulators can investigate our licensing re uirements and whether our services comply with their rules.
ImpactRegulatory re uirements and constraints can directly impact our ability to compete e ectively and earn revenues. Regulatory risks are highest in the UK. Based on the latest Regulatory Financial Statements for 2012 13, around £5.5bn of our revenue (of which £3.0bn is to downstream parts of BT) is from wholesale markets where we have been found to have signi cant market power and which are currently subject to regulatory charge controls. Most of these controls re uire us to reduce our prices annually. Controls are usually set for three years and will therefore constrain revenues during that period.
Other CPs can ask Ofcom to resolve disputes with us about current or historic prices. Where Ofcom nds that these prices are, or have been, set at levels above those re uired under the regulatory framework, we may need to make retrospective repayments to CPs.
We may from time-to-time be re uired to provide new services, or existing services on improved terms, to wholesale customers on a non-discriminatory basis. This could increase our costs. Regulation outside the UK can impact our revenue by limiting our ability to compete through overly-restrictive licensing re uirements or ine ective regulation of access to other CP networks.
Changes over the last yearOver the last year, we have seen regulatory activity in a number of areas which are summarised in Regulation on page 48. A number of these rulings will reduce our future pricing.
Risk mitigationWe have a team of regulatory specialists (including accountants and economists) who, together with legal experts and external advisors, continuously monitor and review the scope for regulatory changes and potential future disputes. This team maintains a dialogue with regulators and with other key in uencers to ensure our positions are understood and to drive for fair and proportionate regulation. We are also able to appeal any regulatory decisions where we believe errors have been made.
Business integrity and ethicsWe are committed to maintaining high standards of ethical behaviour, and have a ero tolerance approach to bribery and corruption. We have to comply with a wide range of local and international anti-corruption and bribery laws. In particular, the UK Bribery Act and the US Foreign and Corrupt Practices Act (FCPA) provide comprehensive anti-bribery legislation. Both have extraterritorial reach and so cover our global operations. As we expand internationally, we are increasingly operating in countries identi ed as having a higher risk of bribery and corruption. We also have to ensure that we comply with trade sanctions, and import and export controls.
ImpactFailure by our employees or associated persons (such as suppliers or agents) to comply with anti-corruption and bribery and sanctions legislation could result in substantial penalties, criminal prosecution and signi cant damage to our reputation. This could in turn impact our future revenue and cash ow, the extent of which would depend on the nature of the breach, the legislation concerned and any associated penalties. Allegations of corruption or bribery, or violation of sanctions regulations, could also lead to reputational and brand damage with investors, regulators and customers.
Changes over the last yearThe importance of conducting business ethically is becoming increasingly recognised across the globe as more countries introduce anti-corruption and bribery legislation. There have yet to be any signi cant judgments resulting from the UK Bribery Act, but there have been many signi cant enforcement actions brought under the US FCPA.
Comprehensive sanctions remain on Iran, Syria, Cuba, Sudan and North Korea. The European Union adopted additional restrictive measures against the Syrian regime and new sanctions on Russia.
Risk mitigationWe have a number of controls to address risk in this area. These include a comprehensive anti-corruption and bribery programme, and The Way We Work , our statement of business practices, which is available in 14 languages and was refreshed this year to give greater guidance to our people. We ask all our people to sign up to its principles and our anti-corruption and bribery policy. We have speci c policies covering gifts and hospitality, charitable donations and sponsorship. We run a training programme with a particular focus on roles such as procurement and sales.
We regularly assess our business integrity risks to make sure that the appropriate mitigation is in place. We operate a con dential hotline which was externally reviewed during the year. Our internal audit team regularly runs checks on our business. We also use external providers to carry out assessments in areas we believe to be higher risk, to ensure our policies are understood and the controls are functioning. We conduct due diligence checks on third parties including suppliers and agents. Procurement contracts include anti-corruption and bribery clauses.
This year we implemented a policy mandating the use of our internal shipping system to arrange all international exports. The system conducts compliance checks and ags any orders which re uire an export licence.

654 The Strategic ReportDelivering our strategy
Supply chainWe aim to harness the capability, diversity and innovation of the global supply market to add value to our business and customers. The integrity and continuity of our supply chain is critical to our operations and therefore a signi cant risk to our business.
We are committed to ensuring that all dealings with suppliers, from selection and consultation through to contracting and payment, are conducted in accordance with our trading and ethical policies. See Suppliers on page 29.
We have a number of suppliers that we have identi ed as critical. The failure of one of these suppliers to meet its obligations could cause signi cant harm to our business.
ImpactWhile the si e of the impact from a supplier failure can vary, all supplier failures typically result in an increased cost to our business and have the potential to adversely impact customer service and our brand. In many cases, the costs associated with the failure of a critical supplier could be signi cant, particularly if this results in our having to change technology. If we are unable to contract with an alternative supplier, our customer commitments could also be compromised, possibly leading to contractual breach, loss of revenue or penalties.
A failure in our supply chain to meet legal obligations or ethical expectations could adversely impact our reputation or possibly lead to censure, legal action and nancial loss.
Changes over the last yearEconomic conditions in certain markets and geographies continue to challenge some of our suppliers. Recent events in other markets, such as the food supply and clothing industries, have highlighted the need to explore risks further down our supply chain, beyond our immediate suppliers. Protecting our brand from events in the supply chain, such as corrupt practices, the sourcing of con ict minerals or possible human rights abuse, continue to demand a high level of focus.
Risk mitigationWe conduct supplier risk analysis as part of our sourcing strategy, and where possible, take actions to reduce risk, such as through dual-sourcing where appropriate.
We operate a comprehensive in-life risk management programme that recognises the supplier s criticality to BT and checks that the appropriate level of supplier governance is in place across the group. We regularly scan our suppliers for changes in commercial, nancial, ethical, security or performance risks. This enables emerging risks to be addressed before they develop into issues while also ensuring that business continuity plans are in place to prevent repeat events.
This approach has been complemented by controls on our low spend suppliers that ensure we achieve maximum business bene t from them, but at the same time do not contract with too many suppliers which would expose us to unnecessary risk.
By adopting these approaches, we seek to minimise the risk of not meeting our customer and legal commitments, or not complying with our ethical policies. This helps to reduce our exposure to loss of revenue, nancial penalty or any adverse impact on our brand and reputation.

55The Strategic ReportDelivering our strategy
Deliv
erin
g ou
r str
ateg
y
Major Contracts From Risk to OpportunityWhile we have a formal and established process for managing risks in individual contracts, we recognise that we also need to understand those risk themes that can impact across a number of di erent contracts. By identifying the activities that are contributing to those risk themes, and understanding the subse uent impact on our business, we can begin to generate improvements.
One example is the service cease process when customer sites are closed or changed to new locations. We would often stop charging the customer for the site but it would take longer than expected to terminate the services provided to it (such as circuits bought from third parties). This would result in higher than expected costs.
How we managed the riskThrough business process re-engineering and tackling the causes of delays, it was possible to reduce the average time lag to cease services by several days. While this is a small improvement on each contract, given the volume of transactions that typically take place, the net savings across all contracts are worth several million pounds a year.
Outcome and lessons learntWe are applying the same approach to other processes where detailed risk analysis points to possible opportunities to improve performance and customer service. Without our strong emphasis on risk reporting, management and governance, many of the underlying issues might not be readily identi ed or targeted and the opportunity to make e ciency gains would be lost.
Business Continuity for BT SportA consistent and rewarding user experience at all times, whether on a TV, smartphone or tablet computer, is fundamental to the success of BT Sport. Conse uently it was important that we identi ed potential service risks and designed measures into the technology and operational processes to mitigate those risks. We also need to be fully prepared to respond e ectively in the event of a major outage.
How we managed the riskA dedicated Business Continuity project was set up, reporting to the BT Sport Programme Board. Its objective was to analyse the way we deliver BT Sport from sporting venue to customer device and introduce resilience and continuity where there were possibilities for failure, for example in our network. We also needed to con rm service continuity measures were in place in our TV production facility and in the IT systems used to deliver BT Sport, take orders and respond to network faults.
Operational procedures used by our suppliers and ourselves were e ually important. They were walked through by experts and updated where improvements were needed. Emergency command and control processes to be used in crisis situations were checked and tested. Finally, before we launched the service, a number of major simulation exercises took place, to ensure we were ready.
Outcome and lessons learntBT Sport was successfully launched in August 2013. There were a number of lessons learnt that we can now incorporate into our future resilience activities. These include expanding the focus of our business continuity activities to re ect our move into television production the bene t of early e ective internal communications and the value of BT executives being involved in simulation exercises.
Risk case-studies

56 The Strategic ReportGroup performance
Mobility and future voice - changing the way people communicate
Conference calling is an established part of life for businesses and other organisationsFor all that, experiencing the improvement in audio uality made possible by a new collaboration between BT and Dolby can be startling. People s voices simply sound nearer, more real.
Spatial perception is revolutionised dial into a call and you can tell where other call participants are seated. And thanks to a new mobile app, using the new service is becoming easier than ever, whether you re in the o ce or on the move.
Voice of the customer
We have experienced spectacular uality using BT MeetMe with Dolby oice. We wish all our conference
calls could have such a high- uality productive experience. Roopam Jain Industry Director, Frost Sullivan
60%Workers who used the high-
uality Dolby Voice spatial-audio system were almost 60% more e cient than workers who used a conventional conferencing system.
Voice from BT The BT MeetMe with Dolby oice mobile app
strengthens our audio conferencing proposition and reinforces the key advantages our product o ers in the marketplace. BT MeetMe with Dolby oice o ers what we believe to be the best collaboration experience and makes it more cost-e ective for organisations to support mobile workers. Bas Burger President, Americas BT Conferencing
The new Dolby Voice conference phone is the most signi cant innovation in IP telephony devices in years. It was engineered by Dolby to deliver the simplest, most elegant and enjoyable way to experience conference calls that feel like in-person meetings.
Dolby has nearly 50 years of innovation in sight and sound experiences. They are natural partners for BT. The new BT MeetMe with Dolby Voice service restores much of the information the brain needs to make conference calls feel like face-to-face meetings. People s words are much clearer and more distinct. You can hear more than one person speak at a time, allowing the kind of natural interaction that happens face-to-face.
The new Dolby Voice mobile app o ers you the best experience available for joining conference calls from a mobile device. For businesses, it s a simple, cost-e ective way to connect to conference calls.
To nd out more, visit www.btconferencing.com meetme-with-dolby-voice
Source: Comparisons of task e ciency in face-to-face, Dolby® oiceTM Technology, and traditional conference system communications.