delta sbd limited asx announcement for personal use only · 2014-09-03 · overview significant...
TRANSCRIPT

Delta SBD Limited
ASX Announcement
3 September 2014
ASX: DSB
Board of Directors
Gordon Galt – Chairman
Stephen Bizzaca – Managing Director – CEO
Glyn Dawkins – Non Executive Director
Geoff Garside –Executive Director
Company Secretary
Geoff Garside
Principal Contact
Stephen Bizzaca – Managing Director – CEO
Phone: 02 4629 0300
Registered office
Suite 220, Centric
4 Hyde Parade
Campbelltown NSW 2560
Telephone: 02 4629 0300
Facsimile: 02 4629 0399
Website: www.deltasbd.com.au
To : Australian Securities Exchange
Company Announcement
“FY 2014 Annual Results Presentation”.
Please find attached ASX Yearly Results Presentation for the year ended 30 June 2014.
Yours Faithfully
Geoff Garside
Company Secretary
For
per
sona
l use
onl
y

2014 Yearly Results
Presentation
September 2014
Stephen Bizzaca, Managing Director & CEO
Geoff Garside, Finance Director & Company Secretary
For
per
sona
l use
onl
y

1. Overview
2. Financial Review
3. Operational Review
4. Strategy
5. Outlook
2
Agenda
For
per
sona
l use
onl
y

1. Overview
3
For
per
sona
l use
onl
y

Overview
Significant steps taken
to reposition business
Debt reduction achieved
Net debt forecast 1QFY15 $4.9m (-72%)
Equipment debt forecast 1QFY15 $1.0m (-93%)
Maintained top quartile
safety performance
Leading zero harm indicators target 1 per 10 hours achieved
Total recordable injury frequency rate improved by 29%
Maintained OH&S and Environmental international accreditation
Sector downturn
impacting financials
Impairment of $39.6m (goodwill $29.3m, equipment $10.3m)
Underlying NPAT -$1.4m (-117%)
Underlying EBITDA $2.1m (-88%)
Revenue $69.4m (-52%)
2H improvement in all underlying measures
Cash underlying profit after tax positive
Competitiveness
improved
New national enterprise agreement
Maintaining long term work – new contracts awarded
New mines/clients obtained
New type of work obtained
Continue to deliver
operational excellence
Client relationships extended and created
Another eight longwall projects completed
First international longwall project completed
4
Note: Cash Underlying Profit after tax is underlying NPAT adjusted for non cash items
For
per
sona
l use
onl
y

2. Financial Review
5
For
per
sona
l use
onl
y

Financial Review - Summary
6
Change FY2014 FY2013
NPAT (excluding impairment) (146%) ($3.3m) $7.1m
Underlying NPAT (117%) ($1.4m) $8.0m
Revenue (52%) 69.4m $145.1m
EBITDA (100%) 0.0m $16.6m
Underlying EBITDA (88%) 2.1m $18.0m
Intangible assets (goodwill) (100%) $0.1m 29.4m
Cash on hand (82%) $1.1m $5.9m
Net debt (19%) $14.1m $17.5m
Equipment debt (53%) $11.2m $24.0m
Earning per share (121%) (3.8c) 17.8c
Net Tangible Assets per share (47%) 34c 64c
Note: Impairment - $29.3m goodwill and $10.3m assets (PPE). NPAT includes $1.7m in restructuring costs
For
per
sona
l use
onl
y

1H and 2H FY 2014
7
Change 2HFY2014 1HFY2014
NPAT 61% ($12.1m) ($30.7m)
NPAT (excluding impairment) (33%) (1.87m) ($1.4m)
Underlying NPAT 63% ($0.4m) ($1.0m)
Revenue (4%) $34.0m $35.4m
EBITDA (75%) ($0.5m) $0.5m
Underlying EBITDA 226% $1.6m $0.5m
Cash on hand 16% $1.1m $0.9m
Net Debt (2%) $14.1 $14.4m
Debt (27%) $11.2m $15.3m
Impairment (65%) $10.3m $29.3m
Employee benefits 36% $5.3m $3.9m
Note: NPAT impacted by impairment and restructuring costs, some of which will occur in FY15 which is reflected by the increase in Employee benefits
2H improvement
For
per
sona
l use
onl
y

Debt reduction
8
Target achieved
All asset sales proceeds used to reduce debt
Debt reduction has delivered a positive cashflow impact of
$500k per month
0
5
10
15
20
25
30
FY13 1HFY14 FY14 1QFY15F
PPE Debt ($m)
Note: 1QFY15F is based on a likely outcome from confirmed asset sales which occurred in 1QFY15
For
per
sona
l use
onl
y

Financial Trends (underlying)
9
Impacted by sector downturn – 2H improvement on
flat revenue
0.00
20.00
40.00
60.00
80.00
100.00
120.00
140.00
160.00
Revenue ($m)
1H 2H
0.00
2.00
4.00
6.00
8.00
10.00
12.00
14.00
16.00
18.00
20.00
FY10 FY11 FY12 FY13 FY14
EBITDA ($m)
1H 2H
0%
2%
4%
6%
8%
10%
12%
14%
16%
FY10 FY11 FY12 FY13 FY14
EBITDA Margin (%)
1H 2H
-2.00
0.00
2.00
4.00
6.00
8.00
10.00
FY10 FY11 FY12 FY13 FY14
NPAT ($m)
1H 2H
For
per
sona
l use
onl
y

Balance Sheet & Cashflow
Balance Sheet FY14 FY13
Cash ($m) 1.1 5.9
Total Assets ($m) (excluding intangible assets) 42.8 82.6
Total Shareholder funds ($m) (excluding intangible assets) 16.1 29.9
Net Debt ($m) 14.1 17.5
Net Debt to Equity 87% 30%
Cashflow FY14 FY13
Operating activities ($m) (1.12) 12.22
Investing activities ($m) 4.32 (10.12)
Financing activities ($m) (8.09) (1.27)
Net (decrease)/increase in cash ($m) (4.89) 0.83
Cash at beginning of year ($m) 5.93 5.10
Closing cash ($m) 1.05 5.93
10
Note: cashflow affected by $10m in PPE loan repayments
For
per
sona
l use
onl
y

3. Operational Review
11
For
per
sona
l use
onl
y

Diversity – Range of Services
Large spread of services
12
17%
27%
7% 7%
13%
18%
8%
FY2014 - % Distribution by work type
Complete Mine
Development
Longwall Moves
Conveyor
Secondary Support
Supplement Labour
Mine Services
Plant
Consistency of services
range
0%
10%
20%
30%
40%
50%
60%
70%
80%
90%
100%
FY10 FY11 FY12 FY13 FY14
Range of Services
Complete Mine Development Longwall Moves
Conveyor Secondary Support Supplement Labour
Mine Services Plant
For
per
sona
l use
onl
y
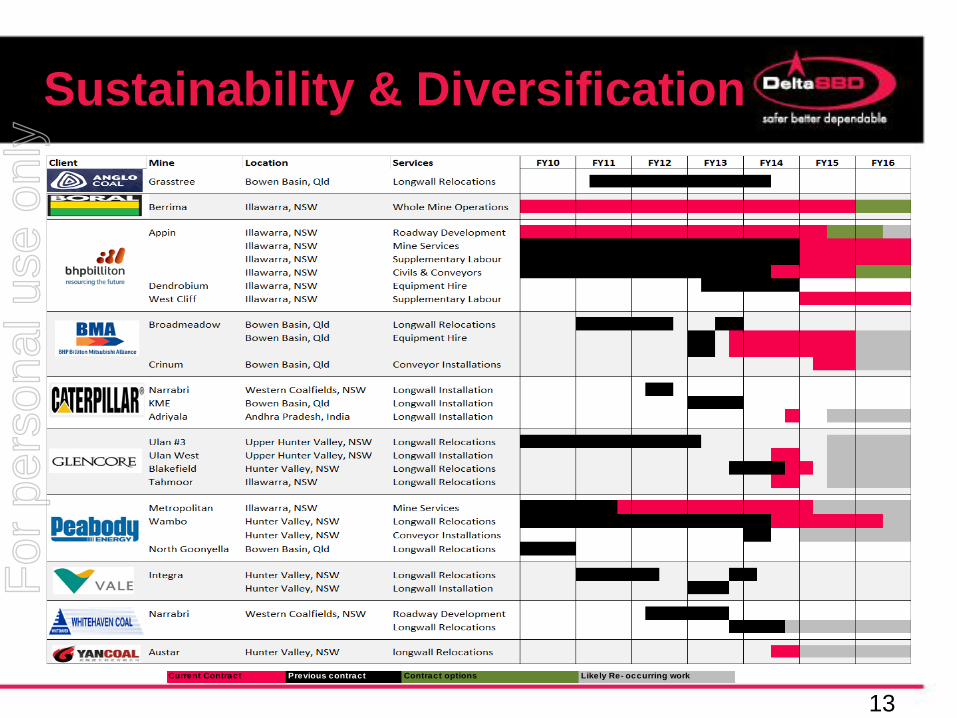
Sustainability & Diversification
13
Current Contract Previous contract Contract options Likely Re- occurring work
For
per
sona
l use
onl
y

Safety
Overall safety performance remains
in top quartile of UG coal mine
operators
Safety performance improved – total
recordable injury frequency rate
decreased by 29%
14
TRIFR FY13
Qld Industry Ave 24
NSW Industry Ave 27
Frequency rates based on 1,000,000 hours For
per
sona
l use
onl
y

People
Worked hours impacted by
sector downturn
15
New national enterprise
agreement (EA) approved by
FWC
74 new starters in 2H, 66%
under new EA
-
5,000
10,000
15,000
20,000
25,000
FY10 FY11 FY12 FY13 FY14
Average Hours Worked per Week
For
per
sona
l use
onl
y

Sustaining work
BHP Billiton’s Appin mine (NSW) - Roadwork development (two
units), secondary support, dyke drill and blast excavation and other
mine services activities
Peabody’s Metropolitan mine (NSW) - Secondary support and other
mine services activities
Boral’s Berrima mine (NSW) - Whole mine operations transitioned to
care and maintenance
16
For
per
sona
l use
onl
y

Re-occurring work
Longwall projects
Whitehaven’s Narrabri mine (NSW)
Peabody’s Wambo mine (NSW)
Glencore’s Blakefield mine (NSW)
Conveyor projects
BHP Billiton’s Appin mine (NSW)
Equipment Hire
Whitehaven’s Narrabri mine (NSW)
BMA’s Broadmeadow mine (Qld)
BHP Billiton’s Appin, Dendrobium and Westcliff mines
(NSW)
17
For
per
sona
l use
onl
y

New work
Longwall projects
Glencore’s new Ulan West mine and Tahmoor mine
(NSW)
Peabody’s Wambo mine (NSW)
Yancoal’s Austar mine (NSW)
Singareni Collieries Company Limited’s new Adriyala
mine (India)
Conveyor projects
Peabody’s Wambo mine (NSW)
Equipment Hire
Glencore’s Ulan West mine (NSW)
Other Major Projects
Drill & blast civil excavations at BHP Billiton’s Appin
mine (NSW)
18
For
per
sona
l use
onl
y

4. Strategy
19
For
per
sona
l use
onl
y

Business Strategy
Proactive Safety Management
Providing competitive value-add services to clients
Forging profitable long term partnerships
Diversity of client base and service/product offerings
Focus on Asset Management
Developing and implementing innovative mining
solutions
Using efficient internal management systems and
controls
Rebuilding shareholder value
20
For
per
sona
l use
onl
y

Industry Downturn Strategy
Update
21
The Plan The Achievements
Higher focus on sustainability of work No contract work lost, replacement
contracts awarded to DSB
Improve value adding to our clients
Reduce cost base & improve
competitiveness
New national enterprise agreement
approved by FWC
Significantly lower costs and
significantly lower prices to clients and
improved competitiveness, resulting in
new contracts awarded
Restructure organisation to reduce
costs
New company based on new EA
Management reduced to match revenue
Continue debt reduction program PPE $24m debt reduced to $1.0m
Increase pipeline options, target all
areas as no labour skills shortage
New conveyor contracts and clients
For
per
sona
l use
onl
y

5. Outlook
22
For
per
sona
l use
onl
y

Sector Outlook
Metallurgical coal (currently DSB’s main client base)
USD spot price of coking coal up 10% from the low point and the
AUD has slightly depreciated
Australian production is actually growing and we believe the
pressure to further increase production from current mines
Australian long-term production is forecast to increase
Steaming coal
Pricing remains subdued
Coal will continue to be a major source of energy
Australian long-term production is forecast to increase
23
For
per
sona
l use
onl
y

Our Outlook
Market conditions will remain challenging
Continued pressure from clients to reduce prices
Extremely competitive environment in the state
Opportunities derived from:
Our new competitiveness
Cheaper outsourcing option for clients
New flexible national EA
Mining innovation
Ability and capacity to pursue appropriate growth opportunities
24
For
per
sona
l use
onl
y

New Contracts commencing in
1QFY15
BHP Billiton’s Appin mine (NSW) – Secondary support and mine
services (2 year term)
BHP Billiton’s Appin and West Cliff mines (NSW) – Supplementary
labour (2 year term)
BMA’s Crinum mine (Qld) – Conveyor salvages and installations (8
month term)
25
For
per
sona
l use
onl
y

Workbook and Pipeline
26
Workbook still impacted by sector
downtown, but remains positive
Workbook excludes uncommitted
“Recurring Work” which also
continues to be positive
Targeted pipeline
significantly
increased
Potential short term
revenue also
significantly
increased
FY15 $51m
FY16 $29m
FY16 $5m
Workbook - $84m
Activity Enquiries,
$306m
Expected Enquiries
FY15, $923m
Future Enquiries,
$11m
Target Pipeline ($1,240m)
FY15, $16m
FY16, $143m
FY17, $332m
Target Pipeline - Potential Revenue by FY
($491m)
For
per
sona
l use
onl
y

Summary
Safety Improved safety performance
Sector Increased metallurgical coal production
Steaming coal production to remain subdued
Market Maintain outsourcing competitiveness
Increased contractor demand expected
Sustainability Maintain our excellent client relationships
Focus on improving adding valuing
Opportunities Targeted all areas of pipeline
Poised for upturn
Profitability Well positioned to return to positive profit and growth
Shareholders Focus on improving returns
27
For
per
sona
l use
onl
y

Contact Details
Gabe Meena Chief Operating Officer 02 4629 0300 [email protected]
Stephen Bizzaca Managing Director & Chief Executive Officer 02 4629 0300 [email protected]
Tony McFadden Chief Financial Officer & Company Secretary 02 4629 0300 [email protected]
Address: Suite 220, 4 Hyde Parade Centric Park, Campbelltown NSW 2560
Appendices
For
per
sona
l use
onl
y

Corporate Overview
Capital structure
Shares on issues 47,367,146
Options 3,437,500
Shareholders – Top five
Stephen Bizzaca entities 36.2%
Glyn Dawkins entities 27.4%
Delta SBD Employee Trust* 7.1%
Gardner entities 2.2%
Nehemine Pty Ltd 2.0%
29
* Excludes Stephen Bizzaca shares, included in “Stephen Bizzaca entities”)
For
per
sona
l use
onl
y

Important Notice and Disclaimer
The following disclaimer applies to this presentation and any information provided regarding the information contained in this presentation (the Information). You are
advised to read this disclaimer carefully before reading or making any other use of this presentation or any information contained in this presentation.
Except as required by law, no representation or warranty, express or implied, is made as to the fairness, accuracy, completeness, reliability or correctness of the
Information, opinions and conclusions, or as to the reasonableness of any assumption contained in this document. By receiving this document and to the extent
permitted by law, you release Delta SBD Limited (“Delta SBD”), and its officers, employees, agents and associates from any liability (including in respect of direct,
indirect or consequential loss or damage or loss or damage arising by negligence) arising as a result of the reliance by you or any other person on anything
contained in or omitted from this document.
Statements contained in this material, particularly those regarding the possible or assumed future performance, costs, dividends, returns, production levels or rates,
prices, reserves, potential growth of Delta SBD, industry growth or other trend projections and any estimated company earnings are or may be forward looking
statements. Such statements relate to future events and expectations and as such involve known and unknown risks and uncertainties, many of which are outside
the control of, and are unknown to, Delta SBD and its officers, employees, agents or associates. In particular, factors such as variable climatic conditions and
regulatory decisions and processes may cause or may affect the future operating and financial performance of Delta SBD. Actual results, performance or
achievement may vary materially from any forward looking statements and the assumptions on which those statements are based. The Information also assumes
the success of Delta SBD’s business strategies. The success of the strategies is subject to uncertainties and contingencies beyond Delta SBD’s control, and no
assurance can be given that the anticipated benefits from the strategies will be realised in the periods for which forecasts have been prepared or otherwise. Given
these uncertainties, you are cautioned to not place undue reliance on any such forward looking statements. Delta SBD undertakes no obligation to revise the
forward looking statements included in this presentation to reflect any future events or circumstances.
In addition, Delta SBD’s results are reported under Australian International Financial Reporting Standards, or AIFRS. This presentation includes
references to EBITDA and NPAT. These references to EBITDA and NPAT should not be viewed in isolation or considered as an indication of, or as an
alternative to, measures AIFRS or as an indicator of operating performance or as an alternative to cash flow as a measure of liquidity.
The distribution of this Information in jurisdictions outside Australia may be restricted by law and you should observe any such restrictions. This Information does not
constitute investment, legal, accounting, regulatory, taxation or other advice and the Information does not take into account any investment objectives or legal,
accounting, regulatory, taxation or financial situation or particular needs. You are solely responsible for forming your own opinions and conclusions on such matters
and the market and for making your own independent assessment of the Information.
You are solely responsible for seeking independent professional advice in relation to the Information and any action taken on the basis of the Information. No
responsibility or liability is accepted by Delta SBD or any of its officers, employees, agents or associates, nor any other person, for any of the
Information or for any action taken by you or any of your officers, employees, agents or associates on the basis of the Information.
30
For
per
sona
l use
onl
y