demand for soybean meal in denmark...1974/10/11 · soybean meal in standard rations to projected...
TRANSCRIPT

DEMAND FOR SOYBEAN
MEAL IN DENMARK
ERS- FOREIGN 368 • ECONOMIC RESEARCH SERVICE • U. S. 0EPARTMENT OF AGRICJ..JL TURE

ABSTRACT
Total use of soybean meal in Denmark is projected to increase to 756,000 tons in 1980, compared to a base period (1969) estimate of 468,000 tons. Much of the increase is expected in the milk and pork sectors, although consumption is also projected to increase in the beef, poultry meat, and egg sectors. These projections are based on applying feed conversion rates from previous studies and estimates of soybean meal in concentrates to projections of production of livestock products.
Alternative projections were undertaken assuming an improvement in feed conversion rates for concentrates and an increase in the percentage of nongrain feeds in rations. Under these assumptions total consumption of soybean meal is projected to reach 814,000 tons in 1980, 8 percent above the original projection.
The projected rise in livestock production reflects the effect of EC membership, which is expected to increase net returns to producers in the long run and boost Danish agricultural exports. Danish agricultural exports had been adversely affected by the Common Agricultural Policy.
Total imports of all vegetable oilcakes and meal have risen significantly in recent years, reflecting increased use of oilcakes and meal in feed rations. The United States has been the major supplier of soybeans to Denmark and in 1973 supplied over 90 percent of the 388,000-ton market.
Keywords: Denmark, feed-livestock, projections, soybeans, soybean cake and meal.
EXPLANATORY NOTES
EC--European Community. The original EC-6 were West Germany, France, Italy, Belgium, the Netherlands, and Luxembourg. The EC expanded to include Denmark, Ireland, and the United Kingdom on January 1, 1973.
CAP--Common Agricultural Policy. Kilograms (kgs.)--1 kg. is equal to 2.2046 lbs. Kroner (kr.)--A unit of Danish currency. The exchange rate in 1972 was 6.85
kr. = 1 U.S. dollar. Metric tons (MT)--1 MT is equal to 2204.6 lbs.
ii

CONTENTS
Summary and Conclusions
Introduction
Production of Oilseeds and Horsebeans
Oilseed Processing and Trade
Trends in the Feed-Livestock Sector . Projections From Other Studies Current Livestock Numbers .••
Feeding Standards for Livestock
Importance of Oilseeds in Feeds
Projections . • Alternative A Alternative B
Literature Cited
Appendix A
Appendix B--Trend Projections
Washington, D.C. 20250
iii
v
1
2
3
5 11 12
13
24
27 28 30
32
35
36
October 1974
Table
1. 2. 3. 4. 5. 6. 7. 8.
9. 10, 11. 12.
13.
14. 15. 16. 17.
18.
19.
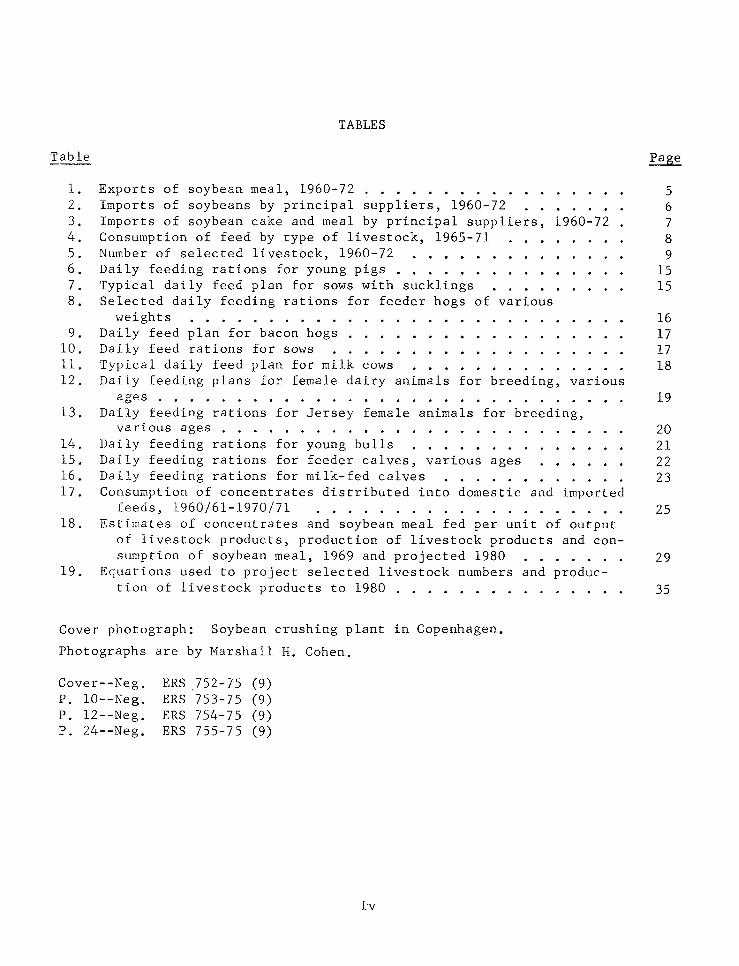
TABLES
Exports of soybean meal, 1960-72 .•...••.......•.• Imports of soybeans by principal suppliers, 1960-72 Imports of soybean cake and meal by principal suppliers, 1960-72 Consumption of feed by type of livestock, 1965-71 Number of selected livestock, 1960-72 ..••.• Daily feeding rations for young pigs .•••... Typical daily feed plan for sows with sucklings Selected daily feeding rations for feeder hogs of various
weights . . . . . . • . . . • •.• Daily feed plan for bacon hogs Daily feed rations for sows Typical daily feed plan for milk cows Daily feeding plans for female dairy animals for breeding, various
ages . . . . . . . . . . • . . . . • . . . . . . • . Daily feeding rations for Jersey female animals for breeding,
various ages . . . . . . . . . . . • . . . • • Daily feeding rations for young bulls .•••• Daily feeding rations for feeder calves, various ages Daily feeding rations for milk-fed calves Consumption of concentrates distributed into domestic and imported
feeds, 1960/61-1970/71 ........•••......... Estimates of concentrates and soybean meal fed per unit of output
of livestock products, production of livestock products and con-sumption of soybean meal, 1969 and projected 1980 •...
Equations used to project selected livestock numbers and produc-tion of livestock products to 1980 . . . . . . . . ..•
Cover photograph: Soybean crushing plant in Copenhagen.
Photographs are by Marshall H. Cohen,
Cover--Neg. P. 10--Neg. P. 12--Neg. P. 24--Neg.
ERS ,7 52-7 5 (9) ERS 753-75 (9) ERS 754-75 (9) ERS 755-75 (9)
iv
5 6 7 8 9
15 15
16 17 17 18
19
20 21 22 23
25
29
35

SUMMARY AND CONCLUSIONS
Although there will probably be little qualitative change in the Danish livestock economy before 1980, increased long-range production of animal products will result fro~ the demand-pull created from the wider EC market. These increases will be translated into a higher demand for protein feeds such &s soybean meal.
Denmark's use of soybean meal is projected at approximately 756,000 tons in 1980, over 60 percent higher than in 1969. This calculation is based on applying feed-livestock production conversion rates and the estimated share of soybean meal in standard rations to projected increases in the output of milk, beef and veal, pork, eggs, and poultry meat. Soybean meal requirements, by product, are expected to increase above 1969 levels as follows: Milk, 107 percent; pork, 67 percent; beef, 36 percent; poultry meat, 30 percent; and eggs, 17 percent.
Strong expansion of the livestock and poultry sectors is projected during Denmark's transition to membership in the European Community. Expansion in the dairy sector would reverse the trend of the 1960's when Danish production was curtailed due to reduced market outlets among the original six members of the EC. Major possible constraints on expansion of these products are capital and labor scarcities and unforeseen declines in export demand.
There is no present strong evidence to suggest specific major changes in animal ration formulations in Denmark by 1980. There may, however, be a tendency to substitute high protein feeds for grain as Denmark adjusts to the relatively high grain prices in the EC. This is particularly likely if price relationships readjust in favor of soybean meal and further improvements occur in feed conversion ratios. Under these circumstances, soybean meal use might approximate 814,000 tons, 74 percent higher than in 1969.
Another speculation is whether new forms of feed or more synthetic proteins will be used in rations. There has been widespread international experimentation using manure and cellulose in certain cattle diets. Research is also underway to improve the efficient use of high protein fishmeals and other sea-based products.
Since Danish production of oilseed crops--flax, rapeseed, mustardseed, poppyseed, and caraway seed--is quite limited, and these crops are largely for industrial application, Denmark will continue to import large quantities of oilseeds. Production of horsebeans--also a source of vegetable protein--has not proven very successful in Denmark. Thus, the United States should continue to be a major supplier of soybeans to Denmark. In 1973, the United States accounted for over 90 percent (388,000 tons) of Denmark's soybean imports. Soybean production in the United States is expected to expand in the 1970's, encouraged by provisions in the Agriculture and Consumer Protection Act of 1973.
v


DEMAND FOR SOYBEAN MEAL IN DENMARK
by Marshall H. Cohen Foreign Demand and Competition Division
Economic Research Service
INTRODUCTION
Several studies (~, 13) 1/ indicate that with Danish membership in the European Community (EC), ~/ livestock numbers and the production of livestock products in Denmark will increase, creating a greater demand for feeds. Increased fee~ demand will probably be satisfied in part by higher utilization of protein-~ich feeds such as soybean cake and meal. In addition, oilcakes may be substituted for higher-priced grains in the long ,·un, a development which characterized some countries in the original EC-6 during the 1960's, particularly the Netherlands.
The major objectives of this study are to estimate soybean meal consumption in Denmark in 1980, provide a concise overview of factors underlying demand (such as trends in the feed-livestock sector and feed standards in Denmark), and summarize some of the conclusions of reports related to likely developments in the Danish livestock sector with Denmark an EC member.
The estimate of soybean meal consumption (cake and meal are used interchangeably in this report) in Denmark in 1980 was made by an examination of feed standards for various livestock classes and the soybean component of concentrates fed per unit of output for the various livestock product categories. Combining this information with projections of animal production by class yielded an estimate or soybean meal consumption in 1980.
Feed conversion rates used in this report were derived in a comprehensive study by experts at Michigan State University exploring the effects of EC membership on agricultural supply and demsnd in the new EC member countries (..!1). 11
lf Underscored figures in parentheses refer to entries listed in the Literature Cited.
2/ Also referred to as the EEC, EC-9, Common Market, and Community. }/ This study is not affiliated in any way with the Michigan State report,
and the author bears full responsibility for any possible errors which may have resulted from applying their material to the analysis.
1

This report does not attempt to survey the entire spectrum of the feedlivestock economy in Denmark, or the demand for other byproducts of soybeans such as soybean oil.
PRODUCTION OF OILSEEDS AND HORSEBEANS
It is unlikely that Denmark will produce sufficient quantities of oilseeds for feed or produce other high protein crops which compete extensively with soybeans. During the last decade, total area planted to oilseed crops averaged only 1-2 percent annually of total agricultural area, Production of oilseed crops in Denmark is largely confined to flaxseed, rapeseed, mustardseed, poppyseed, and caraway seed. These are classified as industrial seed crops and used extensively for nonfeed purposes,
Rapeseed has traditionally been the major oilseed produced in Denmark, In 1972, rapeseed area totaled 30,600 hectares, about 85 percent of oilseed area. This was about double the 1970 acreage, reflecting a sharp improvement in prices. 4/ The rise reversed a downtrend in acreage which characterized the 1960's.-
Small residual quantities of pulp, produced during the processing of rapeseed, are used largely for cattle feed, Rapeseed oil is used primarily in manufacturing, particularly by the paint industry. The "Rapeseed Scheme" policy, under which margarine manufacturers supported the rapeseed growers by a special tax, was terminated in 1967. However, although rapeseed is not generally used in margarine production, in recent years the margarine industry had been obliged under Government regulation to purchase a certain percentage of rapeseed oil; the rapeseed purchased has generally been exported, largely to West Germany.
Experiments are being conducted in Denmark to produce a high-protein feed crop domestically. A feed pulse, horsebeans, has been a popular experimental crop, largely because its protein content is relatively high--approximately 20 percent. Horsebeans could substitute for about 15 percent of the concentrate feeds, according to the Aarhus report (l, p. 266).
Horsebean production in Denmark has been disappointing to date, largely because yields have been unfavorably affected by weather. Other factors such as soil conditions and soil moisture have resulted in wide year-to-year fluctuations in yields. Also, a trade policy liberalizing imports of protein feeds but applying levies to grains (l, p. 22) has encouraged production of feed grains in lieu of protein crops.
Horsebean acreage expanded from about 2,000 hectares in the early 1960's to 16,000 hectares in 1970, when a production subsidy of $27 per hectare was adopted. Despite the subsidy, horsebean area dropped to 13,500 hectares in 1971 and 5,000 hectares in 1972 (~). The subsidy was terminated in 1973.
~/Under the Common Agricultural Policy (CAP), Danish rapeseed prices increased about one-third. Consequently, the Government imposed a special tax on stocks held by manufacturers which was used to support rapeseed production.
2

Earlier long-range projections (l, p. 265) anticipated area in horsebeans to expand to 60,000 hectares by 1980; this appears unlikely. However, in view of the relatively high grain prices under Danish membership in the EC and the high price of nongrain protein feeds on the world market, Danish attempts to develop high protein crops are likely to continue.
OILSEED PROCESSING AND TRADE
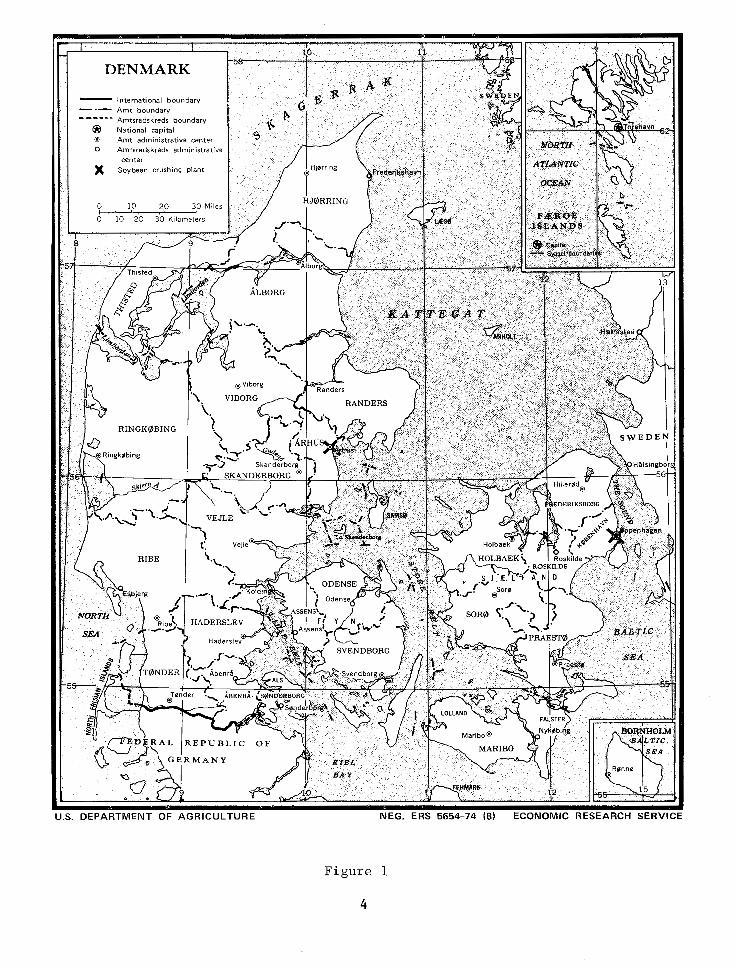
Denmark imports virtually all its oilseed requirements for processing. Soybeans account for the bulk,, about 95 percent of the crush. Danish meal-principally soybean, copra, and palm kernel--is produced in two crushing plants. the Dansk Sojakagefabrik A/S (Danish Soycake Factory) in Copenhagen and the Aarhus Oliefabrik A/S (Aarhus Oil Factory) in Jutland (Fig. 1). The two factories combined produced approximately 460,000 tons of meal in 1970, or over 80 percent of soybean meal utilization.
The farming areas in eastern Denmark are supplied with oilseed meal by the Dansk Sojakagefabrik in Copenhagen. This plant also exports soybean oil and meal to Sweden (table 1). Danish exports of soybean meal to Sweden averaged nearly 100,000 tons annually during 1954-70. The Aarhus plant normally supplies the western peninsula of Jutland with its meal requirements (Jutland, the largest farming region in Denmark, is the center of the dairy industry). However, duringperiods of relatively low market prices in Sweden, the Dansk Sojakagefabrik in Copenhagen sells meal to the Jutland market as well.
The United States has been the principal supplier of soybeans to Denmark since 1960, and virtually the sole supplier since 1963 (table 2). In 1971, the United States supplied almost all of Denmark's 491,000-ton market. In 1972, Denmark imported 520,000 tons of U.S. soybeans, over 95 percent of its total soybean imports. In the early 1960's, the People's Republic of China was a competitive supplier of soybeans to Denmark. In 1960 China supplied about one-third of Danish soybean imports. Brazil, which has increased soybean production in recent years, has emerged as a small supplier of soybeans to Denmark, supplying 13,000 tons in 1972.
In addition to processing imported soybeans for cake and meal, Denmark imports processed cake and meal (table 3). Soybean cake accounts for the highest percentage (over 40 percent in 1972) of total cake and meal imported. West Germany and the Netherlands have supplied Denmark with soybean cake and meal processed from U.S. soybeans.
Total imports of all vegetable oilcakes and meal have been r~s~ng appreciably in recent years. The rise reflects increased use of oilcake and meal in feed rations as well as high prices for substitutes such as fishmeal and meatmeal. In 1972, imports of vegetable oilcake and meal increased nearly 20 percent to approximately 850,000 tons. The major suppliers in 1972 were Turkey, 160,000 tons; West Germany, 147,000 tons; the United States, 90,000 tons; and Brazil, 84,000 tons.
3
DENMARK
- International boundary - ·- Amt boundary ------ Amtsradskreds boundary
® National capital ® Amt administrative center 0 Amtsradskreds administrative
center )(. Soybean crushing plant
0 10 20
RINGK~BING
Figure 1
4

Table 1--Exports of soybean meal, Denmark, 1960-72
Year Sweden Other Total Countries
1,000 Tons
1960 76 2 78
1961 58 7 65
1962 83 5 88
1963 90 20 llO
1964 100 5 105
1965 106 10 ll6
1966 91 13 104
1967 103 26 129
1968 98 4 102
1969 73 3 76
1970 ll2 18 130
1971 96 22 ll8
1972 89 41 130
Sources: (~, l).
TRENDS IN THE FEED-LIVESTOCK SECTOR
Several factors contributed directly or indirectly to the moderate dow~trend in aggregate consumption of feeds prior to Danish membership in the EC. During 1965-71, feed consumption declined from about 15 billion feed units to 14 billion (table 4). 5/ One important contributing cause was the decline in animal numbers (except-for hogs), reflecting reduced export demand in critical markets (table 5).
21 A Scandinavian feed unit on the average is equivalent to the nutritional value of approximately l kilogram of barley.
5
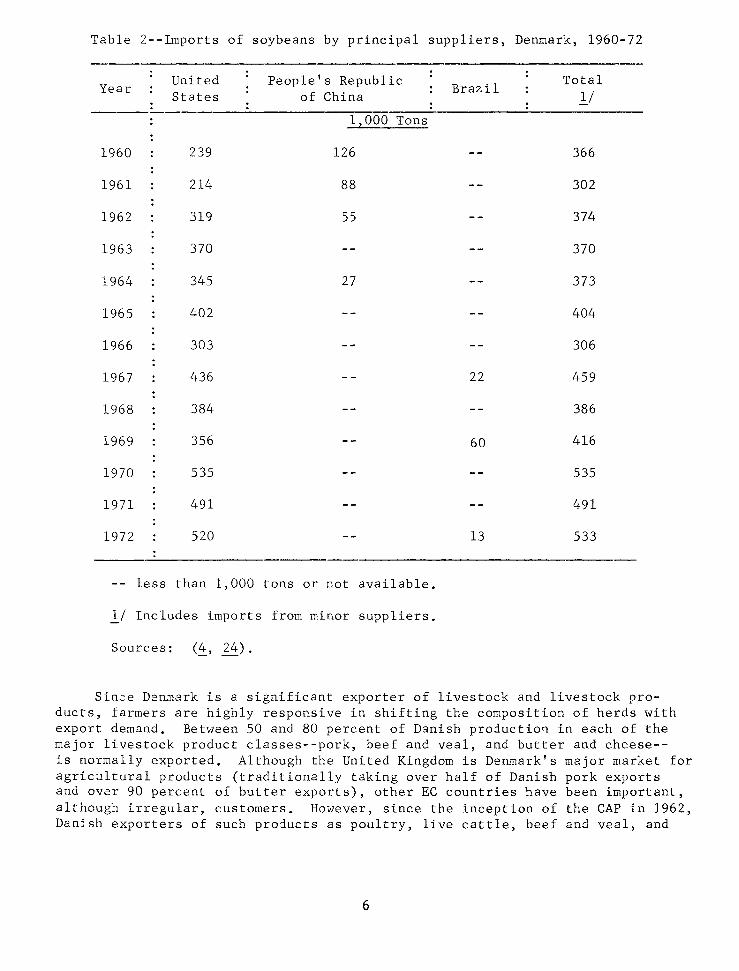
Table 2--Imports of soybeans by principal suppliers, Denmark, 1960-72
Year United People's Republic Brazil
Total States of China ])
1,000 Tons
1960 239 126 366
1961 214 88 302
1962 319 55 374
1963 370 370
1964 345 27 373
1965 402 404
1966 303 306
1967 436 22 459
1968 384 386
1969 356 60 416
1970 535 535
1971 491 491
1972 520 l3 533
less than 1,000 tons or not available.
!/ Includes imports from minor suppliers.
Sources: (~, 24).
Sin~e Den~ark is a significant exporter of livestock and livestock products, farmers are highly responsive in shifting the composition of herds with export demand. Between 50 and 80 percent of Danish productio~ in each of the major livestock product classes--pork, beef and veal, and butter and cheese--is normally exported. Although the United Kingdom is Denmark's major market for agricultural products (traditionally taking over half of Danish pork exports and over 90 percent of butter exports), other EC countries have been important, although irregular, customers. However, since the inception of the CAP in 1962, Danish exporters of such products as poultry, live cattle, beef and veal, and
6
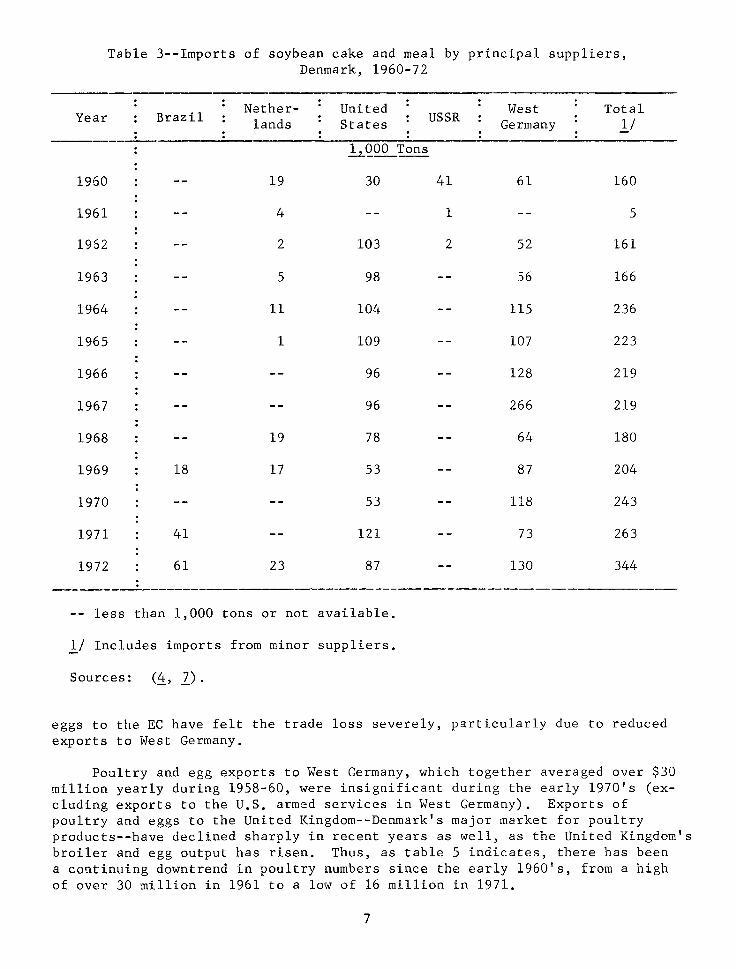
Table 3--lmports of soybean cake and meal by principal suppliers, Denmark, 1960-72
Brazil Nether- United West Total
Year lands States USSR Germany ])
hQ.OO Tons
1960 19 30 41 61 160
1961 4 1 5
1952 2 103 2 52 161
1963 5 98 56 166
1964 11 104 115 236
1965 1 109 107 223
1966 96 128 219
1967 96 266 219
1968 19 78 64 180
1969 18 17 53 87 204
1970 53 118 243
1971 41 121 73 263
1972 61 23 87 130 344
--------------less than 1,000 tons or not available.
]) Includes imports from minor suppliers.
Sources: (~, 1).
eggs to the EC have felt the trade loss severely, particularly due to reduced exports to West Germany.
Poultry and egg exports to West Germany, which together averaged over $30 million yearly during 1958-60, were insignificant during the early 1970's (excluding exports to the U.S. armed services in West Germany). Exports of poultry and eggs to the United Kingdom--Denmark's major market for poultry products--have declined sharply in recent years as well, as the United Kingdom's broiler and egg output has risen. Thus, as table 5 indicates, there has been a continuing downtrend in poultry numbers since the early 1960's, from a high of over 30 million in 1961 to a low of 16 million in 1971.
7
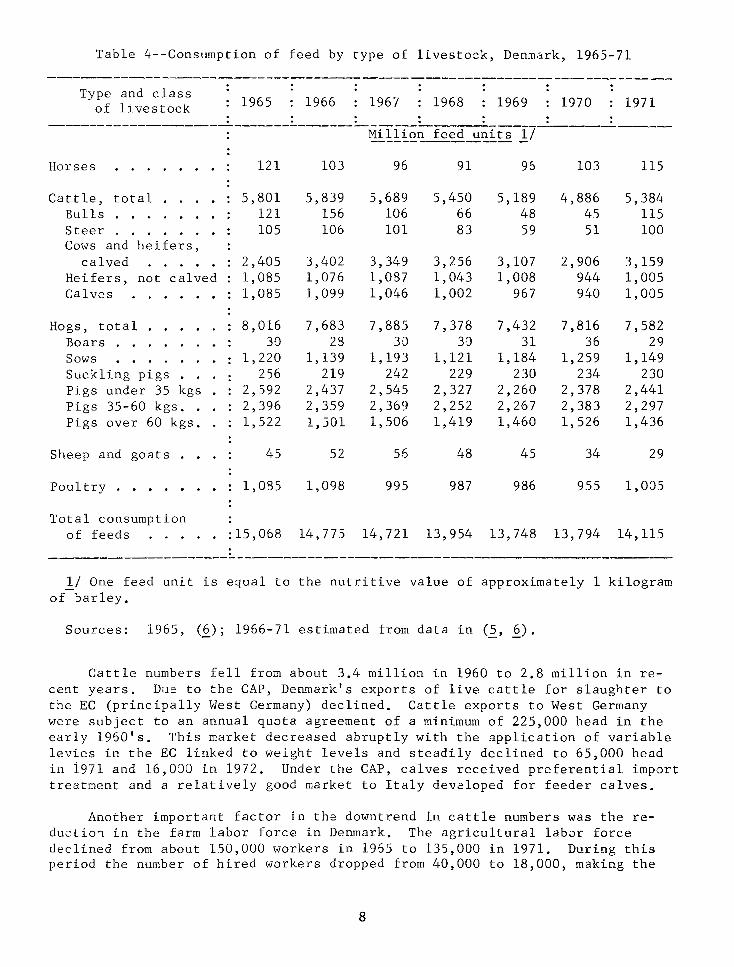
Table 4--Consumption of feed by type of livestock, Denm.Hk, 1965-71
-------------------------------Type and class
of livestock : 1965 : 1966 . . . . . . 1967
-~---------------------------~
Horses
Cattle, total Bulls Steer Cows and heifers,
calved Heifers, not calved Calves
Hogs, total Boars . . Sows Suckling pigs Pigs under 35 kgs Pigs 35-60 kgs .. Pigs over 60 kgs.
Sheep and goats
Poultry .
Total consumption of feeds
121
5,801 121 105
2,405 1,085 1,085
8,016 30
1,220 256
2,592 2,396 1,522
45
1,085
:15,068
103
5,839 156 106
3,402 1,076 1,099
7,683 23
1' 139 219
2,437 2,359 1,501
52
1,098
14,775
96
5,689 106 101
3,349 1,087 1,046
7,885 30
1,193 242
2,545 2,369 1,506
56
995
14,721
1968
91
5,450 66 83
3,256 1,043 1,002
7,378 30
1,121 229
2,327 2,252 1,419
48
987
13' 954
1969
96
5,189 48 59
3,107 1,008
967
7,432 31
1,184 230
2,260 2,267 1,460
45
986
13,748
1970
103
4,886 45 51
2,906 944 940
7,816 36
1,259 234
2,378 2,383 1,526
34
955
13,794
1971
115
5,384 115 100
3,159 1,005 1,005
7,582 29
1,149 230
2,441 2,297 1,436
29
1,085
14,115
ll One feed unit is equal to the nutritive value of approximately 1 kilogram of barley.
Sources: 1965, (~); 1966-71 estimated from data in (~, &_).
Cattle numbers fell from about 3.4 million in 1960 to 2.8 million in recent years. D;le to the CAP, Denmark's exports of live cattle for slaughter to the EC (principally West Germany) declined. Cattle exports to West Germany were subject to an annual quota agreement of a minimum of 225,000 head in the early 1960's. This market decreased abruptly with the application of variable levies in the EC linked to weight levels and steadily declined to 65,000 head in i971 and 16,000 in 1972. Under the CAP, calves received preferential import treatment and a relatively good market to Italy developed for feeder calves.
Another important factor in the downtrend in cattle numbers was the reductio< in the farm labor force in Denmark. The agricultural labor force declined from about 150,000 workers in 1965 to 135,000 in 1971. During this period the number of hired workers dropped from 40,000 to 18,000, making the
8

Table 5--Nurnber of selected livestock, Denmark, 1960-72
Cattle : Hogs : : Poultry Year : 1 : Milk : . f : 1 : Sows and : Breeding and : Sheep : Total :
Tot a HeL ers Tota . 1/ . Layers · Broilers cows : : : gLlts : slaughter hogs : : 1,000
1960 : 3,397 1,438 740 6,147 681 3,835 44 24,484 9,735 5,966 1961 : 3,593 1,493 768 7,095 799 4,416 47 30,575 9,744 10' 872 1962 : 3,504 1,463 772 7,181 801 4,498 52 29,047 9,007 12,507 1963 : 3,343 1,408 726 7,334 807 4,604 61 25,281 7,949 10' 126 1964 : 3,277 1,370 723 8, 011 941 4,824 71 24,982 7,733 11' 7 38
1965 : 3,345 1,350 746 8,591 970 4,156 93 20,264 6,870 8,642 1966 : 3,374 1,350 742 8,120 904 4,998 112 20,527 6,917 9,004 1967 : 3,282 1,329 750 8,486 947 5,095 122 18,594 6,521 7,842 1968 : 3,141 1,292 719 7,963 890 4, 760 110 18,448 6,330 7,710 1969 : 3,000 1,233 695 8,022 940 4,752 90 18,421 6,687 7,127
\0 1970 : 2,842 1,153 651 8,361 999 4,989 70 17,847 6,330 7,809 1971 : 2, 723 1,105 622 8,626 978 5,143 57 16,220 q,483 7,639 1972: 2,788 1,125 628 8,864 1' 019 5,128 -- 18,499 5,738 8,753
: ---11 Includes layers, broilers, turkeys, ducks and geese.
Sources: (2, ~. various issues and June census).
farmer more dependent on his own labor. The labor scarcity in Denmark stimulated a shift to more extensive farming not involving dairy enterprises, especially on soils and in areas of the country where grains can be produced without including grasses and root crops in rotation (such as in Jutland, Denmark's western peninsula).
The decline in total cattle numbers also reflected a dip in brood cow numbers. A larger percentage of brood cows were culled during the early 1970's because of Government policies designed to discourage dairy surpluses, due to relatively low butter prices on the U.K. market.
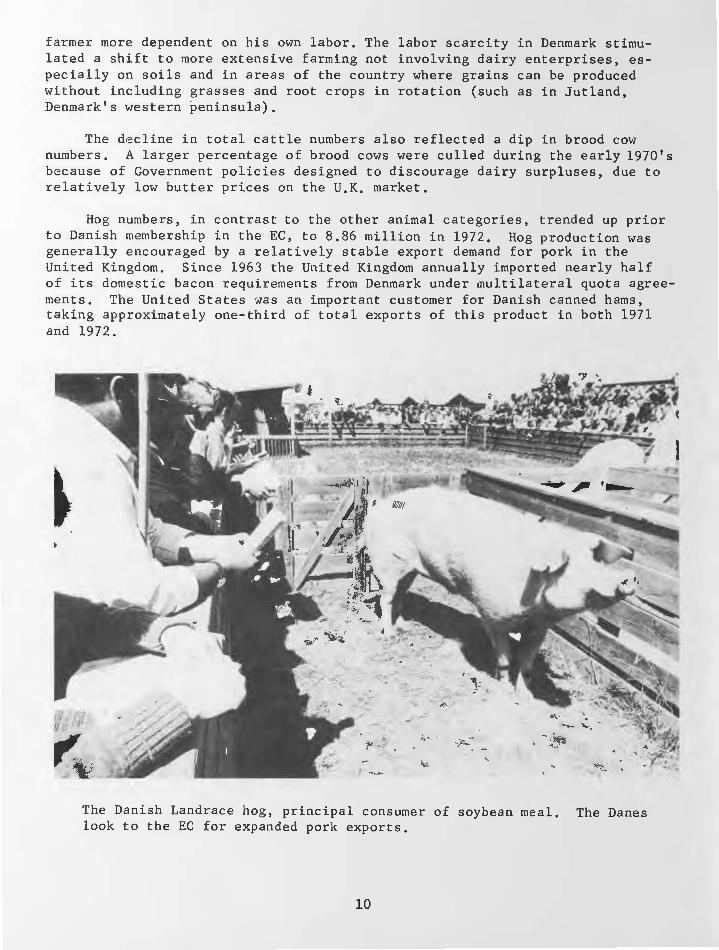
Hog numbers, in contrast to the other animal categories, trended up prior to Danish membership in the EC, to 8.86 million in 1972. Hog production was generally encouraged by a relatively stable export demand for pork in the United Kingdom. Since 1963 the United Kingdom annually imported nearly half of its domestic bacon requirements from Denmark under multilateral quota agreements. The United States was an important customer for Danish canned hams, taking approximately one-third of total exports of this product in both 1971 and 1972.
The Danish Landrace hog, principal consumer of soybean meal. The Danes look to the EC for expanded pork exports.
10

T~e Danish Government encouraged hog production based on ho~e-produced feed grain. During the 1960's, Government price policy encouraged the expansion of barley, an important component in hog rations. Approximately 70 percent of grain area was sown to barley during the early 1970's. Also, the Government, in cooperation with producer associations, designed a domestic subsidy scheme under which pork producers received a levy from domestic sales of pork (16).
Two studies, one by Denmark's Aarhus University (2) and one by Michigan State University (bD, projected animal numbers to 1980 in Denmark. Wh·en the earlier Aarhus study was published in 1959, Danish membership in the EC seemed highly unlikely. Therefore, projections to 1980 assu~ing EC membership were undertaken only for limited livestock and livestock products--milk cows, beef and veal, an4 milk production. The Aarhus projections for these categories assumed that the United Kingdom would join the EC with D•=n~ark, that most of the EC policies in force in 1968/69 ~ould remain unchanged, and that no special transitional arrangements for membership would occur (1, p. 199).
By 1980, milk cow numbers were projected in the Aarhus University model to increase very sharply to 1.8 million, about 90 percent above the projection assuming nonmembership in the EC. The study also concluded that some of the dairy herd would be diverted to beef as a response to high EC beef prices. Reflecting increased demand, beef and v2al output was projected to rise to 417,000 tons by 1930, compared with a nonmembership projection of 186,000 tons. £/ The larger output expected under membership reflects a higher per animal productivity as well as a larger cow herd. With membership, average slaughter weights were projected at 230 ~ilograms per animal compared to a nonmembership projection of 199 kilograms per animal.
Milk output, reflecting both a larger cow population and improved productivity, was projected to increase sharply to 7,2 million tons compared with a nonmembership projection of 4.1 million tons.
The livestock number projections u~dertaken by Michigan State (1971) were used in their models to determine output. Based on an anticipated incre~ae in milk prices and higher net returns, milk cow nuobers were projected to increase to about 1.45 million, up from a 1968 base of 1,3 million. Milk output was projected to reach 6.4 million tons, U? from 5.1 million tons. Beef and veal production was projected to be 349,000 tons-- nearly one-third over the base period. Numbe'rs of sows and gilts were projected to increase to about 1.5 million by 1980, up from 890,000 in 1968, with pork output sharply increasing to 1.2 million tons compared with 772,000 tons in the base period. The rise in hog numbers reflects an increase of 15-20 percent over nonmembership levels,
£/ Unlike several other cou~tries in Western Europe, in Denmark very little veal is produced from milk-fed animals under 4 months ald. Veal is largely
,derived from fatted calves slaughtered at about 1 year of age. Ho:vever, as in most of Western Europe, beef production i~ largely derived fro~ the dairy herd,
11

' --0
Modern dairy farm in Jutland. Availability of capital will be a critical factor in determining whether farms will invest in modern milking equipment.
Poultry meat producer prices were assumed to increase moderately with Denmark in the EC, resulting in a modest increase in both nambers and output, according to the Michigan State analysis. Poultry meat output was projected to increase to 69,000 tons by 1980, up from 65,000 toQs in 1958. The uptrend would, however, be tempered by higher production costs.
Current Livestock Numbers
Although it is pre mature to interpret the developments in the animal sector in 1972/73 as immediately reflecting the effects of Danish membership (or anticipated membership) in the EC, some reversals of past trends in the nu~ber of animals have occurred. For the first time since 1961, cattle numbers increased, from 2 .72 million in 1971 to 2.79 million in 1972. The increase, although small, is likely to c ontinue, as farmers foresee a renaissance in marketing O?portunities for dairy products (particularly cheeses) in the EC and anticipate receiving export subsidies for a variety of milk-based pro3ucts to third countries. However, the rate of expansion will depend upon easing of problems of labor and capital scarcity. Also, since the EC's beef deficit is likely to continue over the longer run, beef output should expand. Danish farmers are likely to expand catt l e numbers and feed calves to heavier weights. Although
12

a slight increase in specialized beef production is possible in Den_rnark, most production will continue to come from dairy herds.
A second "off-trend" development in 1972/73 was a decline in hog numbers. Ho'iJever, this is likely to be a shortrun occurrence. Hog producers experienced low prices relative to feed costs in 1972/73; the hog/b~rley ratio declined from nearly 12 in 1969 to 9.5 in 1972 (a ratio of over 10 is normally necessary to encourage expansioQ) Cl~). Difficulties in the hog industry were not only due to high feed costs but also to high processing costs in the canning industry, which uses about 25 percent of hogs slaughtered. Also, consumption of bacon in the United Kingdom has declin·2d. Other factors which may have adversely affected Danish exports of pork were the U.S. dollar devaluation and the discontinuation of the domestic s~bsidy (home-market) scheme. Under this scheme, exports were financed from the revenues received from domestic sales.
The long-range downtrend in poultry numbers appears to have slowed in 1972/73, despite the uncertainties of future EC markets and the higher prices of feeds. An increasing concentration of broiler production is underway a~i there has been more cooperative purchasing of eggs under contract. Also. in 1973 lower priced domestic wheat was substituted for imported corn in feed. Wheat was the major grain in poultry feed mixes in that year.
FEEDING STANDARDS FOR LIVESTOCK
Although there are no published data on feed use by class of livestock in Denmark, recommended normal feeding rations and typical feeding plans are available in farm management handbooks (11). These recommendations for normal feeding standards are generally based on the performances of various classes of livestock as recorded on demonstration farms and State experiment laboratories. Research relating to modifications of rations from standard recommendations is reported in the autumn reports of the Landolzonomisk Forsogslabo::-ato::-ium Efterarsmode (National Agricultural Experiment Station). The recommended rations are impo::-tant guidelines in maintaining livestock production at a desirable quality standard. This is important in Derunark, where a significant percentage of production is subject to quality control for export. However, actual feeding rations vary considerably among farms :1_nd regions, reflecting the availability of home-produced feeds, the prices of alternative feeds, and other relevant economic and traditional factors.
The handbooks do not recommend specific quantities of soybean meal in rations for all animal classes although they provide norms for total protein in concentrates in the diets for many broad animal groupings. These handbooks were examined along with materials published by the Danish cooperative, Dansk Landbrugs Grovvare-Selskap (Danish Agricultural Farm Supply Cooperative), and the Agricultural University Cl2) in order to make some rough assessments of the average proportion of soybean meal used in concentrates.
Tables 6 to 10 contain rations for the most important hog categories. The approximate percentage of soybean meal in concentrates was largely derived from recommended daily rations. Although results fro~ many Danish demonstration farms for feeder hogs (fattened from 20 kilograms to the normal slaughter
13

WP.ight of 90 kilograms), indicated that required daily feed units may reach as high as 3.56 to 4 per kilogram, recommended plans such as those in table 8 call for a daily feed unit consumption only as high as 3 feed units.
Plans 1 and 2 consist of protein concentrates, whole or crimped barley, a~d skimmed milk (plan 2 only). Protein concentrate reaches 360 grams daily under plan 1 and 280 grams under plan 2; with skimmed milk replacing some of the vegetable protein concentrate. These plans are assumed to be most ap?ropriate for pork production. However, there is likely to be considerable variation in actual practice, due to specific animal requirements and availability and prices of feeds. Also, some rations contain protein concentrates with an abnormally high soybean meal content. One of these rations for bacon hogs, for example, suggests a 77 percent soybean contribution (table 9).
To derive a representative percentage of soybean meal used in the concentrates for pork production, it was necessary to derive typical relationships between daily protein req~irements and estimates of the soybean meal needed to meet these requirements.
The percentage of protein in total daily feed u~it requirements was calculated for all categories of fattened hogs over 50 kilograms live~.,reight from plans 1 and 2 (table 8). ~or example, for animals in the typical slaughter weight category (90 kilograms) in pla~ 1, 3 kilograms of feed units are recommended and the pr:Jt.ein concentrate contribution is 360 grams daily, or 12 percent. About half the protein value of concentrates is derived from soybean rneal (47.9 percent, according to (~)), or 5.7 percent of total feed unit requirements.
This calculation was made for each observation at the various animal weights. The percentage of protein required in daily feed units averaged 6.2 percent. Thus, a 6 percent soybean ~eal percentage i3 rations was considered most representative. This percentage is approximately the same as that recommended by Morrison f~r corn-fattened hogs in this weight range in the United S::at·=s (24, p. 1, 127).
The data presented in table 10 are representative rations for sows at various 5~3ges of pregnancy and during the suckling period. The quantity of protein supplement is increased gradually to 600-725 grams daily during the 4th to 8th week of the post-farrowing period. The protein supplement contains a relatively high proportion of soybean meal--47 percent--during certain periods, with meat and bonameal and fLshrneal composing the balance.
Feed standards for cattle (tables 11 to 16) vary with the weight, class, and ~reed of animal and the use for the animal. (For example, rations may dLffer for the Danish Red, which yields the most milk and is the priacipal milk cow, and the Jersey, which is used largely for cheese since i: produces milk with a high fat content.)
St>1ll fe·eding of cows i:3 pcevalent during the winter (the "stall" period lasts fl:'mn 180 to 210 days). There are approximately 50 feeding plans for stall-fed milk cows, For stall feeding, a typical daily recommended ration consists of roots, silage, hay, straw, and concentrates. During the grazing period (about 180 days), the milk cow feeds on grasses.
14

Table 6--Daily feeding rations for young pigs, Denmark
Age Milk Concentrates
1/
~ Grams
3 weeks Nursing sow 4 II " " 5 " " " 6 " " II
7 II " II
8 II 0.25 450 9 II .50 500
10 " .75 550 11 " 1.00 650 12 II 1.00 700
1/ 4 percent herring meal, 6 percent soybean meal, 1 percent dry yeast, 85.5 percent mixed grains, ~ percent flaxseeds, 1.1 percent minerals, 0.4 percent vitamins A, D, and E.
Sources: (22, 33).
Table 7--Typical daily feed plan for sows with sucklings, Denmark
-·------ Period of
Feed : ___E_E_'=.gna n_c_y..___ :First 3:Last 4 3rd week to
Suckling period
:1st week "2nd week ___ . _______ :months :weeks : end of_E_eriod
Skimmed milk l.O 1.0 1.0 1.0 1.0
Protein concentrate ll .40 .57 .54 .72 .87
Grain ]j 1.1 2.4 2.6 3.4 4.3
Fodder beets 4.0 3.0 2.0 2.0 2.0
--ll Consisting of 17 percent fishmeal, 13 percent meat and bonemeal, 55 per
cent extracted soybeans, and 15 percent minerals and vitamins. 11 Consisting of 80 percent barley, 10 percent oats, and 10 percent wheat.
Source: ill) .
15

Table 8--Selected daily feeding rations for feeder hogs of various weights, Denmark
Daily Plan 1 Plan 2 Liveweight feed Protein :Barley Skimmed: Protein Barley
:units 1/ :concentrate 2/ Milk :concentrate 2/ Number Grams ~ ~ Grams ~ ---
20 kilograms: 0.90 200 0.7 1 120 0.6 30 " 1.25 260 1.0 1 180 .9 40 " 1.60 330 1.3 1 250 1.2 50 " 1. 95 360 1.6 1 280 1.5 60 " 2.25 360 1.9 1 280 1.8 70 " 2.55 360 2.2 1 280 2.1 80 " 2.80 360 2.4 1 280 2.3 90 " 3.00 360 2.6 1 280 2.5
Plan 3 Plan 4 Plan 5 Formulated Formulated Formulated
Skimmed Skimmed milk protein feed milk protein feed protein feed
rations 3/ rations 3/ rations 3/
~
20 kilograms: 1.5 0.7 1 0.7 0.9 30 " 1.5 1.0 1 1.1 1.3 40 " 2.0 1.3 1 1.4 1.6 50 " 2.0 1.6 1 1.8 2.0 60 " 2.0 1.9 .3 2.3 70 " .5 2.5 2.6 2.6 80 " 2.8 2.8 2.8 90 " 3.0 3.0 3.0
ll A feed unit is approximately 1 kg. of barley. 11 Concentrates include minerals, vitamins, and 35 percent digestible (pure)
protein. 11 Protein levels in feed rations vary by plan. There is 12 percent digestible
protein in plan 3, 13 percent in plan 4, and 14 percent in plan 5.
Sou:cce: (ll, p. 35).
Two popular concentrate mixes, the A mix and the C mix, are varied in milk cow rations anq are distinguished by protein content (1, 10). The A mix (about 15 percent digestible protein) contains 10 percent soybean meal and is a preferred feed supplement for high yielding milk cows (producing about 12.5 kilograms of milk daily). Its use in the ration is increased significantly for higher yielding cows (table li). The A mix is also commonly added to the ration for stall feeding during the winter. The C mix is high in fat and grains and although about 33 percent digestible protein, contains no soybean meal (table 11). A typical feed plan calls for a relatively constant use of the C mix in the ration regardless of milk output. Both mixes may be used in the same ration, depending on whether specific nutrients are available from other sources, such as grasses
16

Table 9--Daily feed plan for bac.on hogs, Denmark
----------Age {number of weeks after 20 ki!.£grams)
Feed 0 2 4 6 8 : 10 12 14 : 16 : 18 -------
Kilograms
Protein con-cent rate ]j . :0.21 0.25 0.29 0.33 0.37 0.41 0.41 0.41 0.41 0.41
Grain ]j . : . 7 .8 1.0 1.2 1.4 1.6 1.9 2.2 2.4 2.6
lf Consisting of 77 percent extracted soybeans, 14 percent meat and bonemeal, and 9 percent mine~als and vitamins.
11 Consisting of 90 percent barley and 10 percent oats.
Source: (!2) .
Table 10--Daily feed rations for sows, 1/ Denmark
Period of time
During pregnancy
1-3 months • • 1-4 weeks before
littering
2 days before littering
During suckling period
1 week after litter 2 weeks after litter 3 weeks after litter 4-8 weeks after litter:
Skimmed milk
~
2
2
2
2 2 2 2
Protein supplements
2/ Grams ---
200-400
300-575
200-400
200-300 300-450 500-625 600-725
-
Mixed grain
- - -
1.8
2.9
2.0
1.2-2.0 2.1-2.9 2.9-3.7 3.8-4.5
-
Sugar-beets
-~
6
6
3
3 3 3 3
- - ...
Whey
- -
6
6
6
6 6 6 6
-
1/ There are approximately seven alternative feed plans for SONS, presumably modified with varying conditions such as nutritional values of crops and prices. This table contains "typical" feed plans.
11 42 percent pure protein.
Source: (12_, p. 32) .
17

Table 11--Typical daily feed plan for milk cows, Denmark
· · · ---.--Total-digestihf;--Beet · A Mix · C Mix · · .
sila e : Hay : l/ : 21 : Total : prate~~ -~-: ___ ;_ _ ___-: __ : _ ___-: __ : ____ : __ <;_2_ns~me_t~o~--
Kilograms Feed of milk beets
(4 percent fat): _ - - - Feed units - Grams
Dry 2.5 2.0 1.0 0.0 0.5 6.0 614
2.6 - 5.0 2.5 2.0 1.0 .o 1.0 6.5 754
5.1- 7.5 3.0 2.0 1.0 .0 1.5 7.5 915
7.6- 10.0 3.5 2.0 1.0 .o 2.0 8.5 1,075
10.1 - 12.5 4.0 2.0 1.0 .0 2.5 9.1 1,236
12.6 - 15.0 4.0 2.0 1.0 1.0 2.5 10.5 1,391
15.1 - 17.5 4.0 2.0 1.0 2.0 2.5 ll.5 1,546
17.6- 20.0 4.0 2.0 1.0 3.0 2.5 12.5 1,701
20.1 - 22.5 4.0 2.0 1.0 4.0 2.5 13.5 1,856
22.6 - 25.0 4.0 2.0 1.0 5.0 2.5 14.5 2,0ll
25.1 - 27.5 4.0 2.0 1.0 6.0 2.5 15.5 2,166
27.6 - 30.0 4.0 2.0 1.0 7.0 2.5 16.5 2,321
30.1 - 32.5 4.0 2.0 1.0 8.0 2.5 17.5 2' 476 .
32.6 - 35.0 4.0 2.0 1.0 9.0 2.5 18.5 2,631
ll Concentrate mix contains 3.2 percent cottonseed cake, 9.6 percent extracted cottonseed, 3.5 percent sunflower cake, approximately 10 percent soybean meal, 1.6 percent linseed, 1.6 percent animal fat, 5.0 percent wheat bran, 40 percent barley, 21.6 percent oats, 1.0 percent molasses, and 2.3 percent minerals'and vitamins. The mix largely contains, per kilogram, 0.99 feed unit, 153 grams of digestible protein, and 60 grams of raw fat. II Concentrate mix largely contains, per kilogram, 1.13 feed units, 316 grams
digestible protein, and 100 grams of raw fat. Soybeans are not normally included in this mixture, which is composed largely of grains and high protein supplements
)(largely cottonseed and sunflowerseed cake and meal). Farmers may alternate using the A and C mix depending on requirements, or may use both mixes in the same ration (see pp. 16, 21).
Source: (12.) •
18

1-' 1.0
Age
0-4 days !:_/ 5-21 days !:_/ • . . :
22-30 days !:_/ • . : 31-40 days !:_/ • . : 41-60 days !:_/ • . . :
2-3 months . . . : 3-4 months . . . : 4-6 months . . . : 6-9 months . . : 9-12 months . . . :
12-15 months . . . : 15-18 months . . . : 18-24 months . . : over 24 months . . :
Table 12--Daily feeding plans for female dairy animals for breeding, various ages, Denmark ll
Whole Skimmed · Concen-
Sugar-milk : milk : trates : beets : Hay : Silage
2/ : : : -~------ - - - Feed units 11
5 4 2 0.2 3 3 0.6 0.1 0.1
-- 6 0.8 0.2 0,2 -- 6 1.0 0.5 0.5 -- 3 1.0 1.0 0.5 -- 3 0.8 1.5 1.0 -- -- 0.2 2.0 1.0 0.3 -- -- 0.2 2.3 0.7 0.5 -- -- 0.2 2.6 0.5 0.5 -- -- 0.2 3.0 0.5 0.5 -- -- 0.2 3.5 0.5 0.5 -- -- 1.5 3.5 0.5 1.0
------------------------------------------
Feed units
required
1.7 1.7 1.7 1.8 2.2 2.5 3.0 3.3 3.5 3.7 3.8 4.2 4.7 6.5
Total
Grams of .12.ro~~in_
155 185 220 300 340 320 330 270 280 280 270 280 290 500
ll Red Danish cattle (RD~) are approximately 55 percent of the total, black and white breeds are 30 percent, and Jersey cattle compose the balance or about 15 percent.
2/ Concentrates after 9 months contain bone and fishmeal. 3! A feed unit is the equivalent of about 1 kg. of barley. ~/ Raw milk is fed during the period,
Source: (_;?_, p. 24).

N 0
Age
0-4 days 2:../ 5-41 days 2,../ • . . . :
22-30 days J) . . . . : 31-40 days Jj . . . . : 41-60 days 1:_/ • . . :
2-3 months . . . : 3-4 months . . . . : 4-6 months . . . . : 6-9 months . . . : 9-12 months . . . :
12-15 months . . . . : 15-18 months . . . . : 18-21 months . . . . : over 21 months . . . :
: 2 months be-
fore calving . . . ---
Table 13--Daily feeding rations for Jersey female animals for breeding, various ages, Denmark
Whole milk
1.5 1.5 1.0 --------------------
--
Skimmed milk
-~
1.5 2,0 2.5 t+. 0 4.0 3.0 2.0 ------------
--
Concentrates
--0.1 0.3 0.4 0.5 0.6 0,8 0.8 0.2 0.2 0.2 0.2 0.2
1.0
Sugarbeets Hay Silage
- - - Feed units 11
-- -- ---- -- ---- -- --
0,1 0.1 --0,2 0.2 --0.4 0.3 --0.6 0.4 --1.0 0.4 0.1 1.5 0.4 0,3 1.7 0,3 0.4 1.9 0.3 0,5 2.2 0,3 0.5 2.5 0.3 0.5
3.0 0.3 1.0
ll A feed unit is the equivalent of about 1 kg. of barley. ~/ Raw milk is fed during this period.
Source: (22, p. 24).
Feed units
required
1.0 1.2 1.3 1.3 1.6 1,.8 2.1 2.3 2.4 2.6 2.9 3.2 3,5
5.3
Total
Grams of protein
110 130 160 190 220 240 230 220 220 230 240 258 250
430
Age (months)
3-4 4-5 5-6 6-7 7-8 8-9 9-10
10-11 11-12 12-13 13-14 14-15
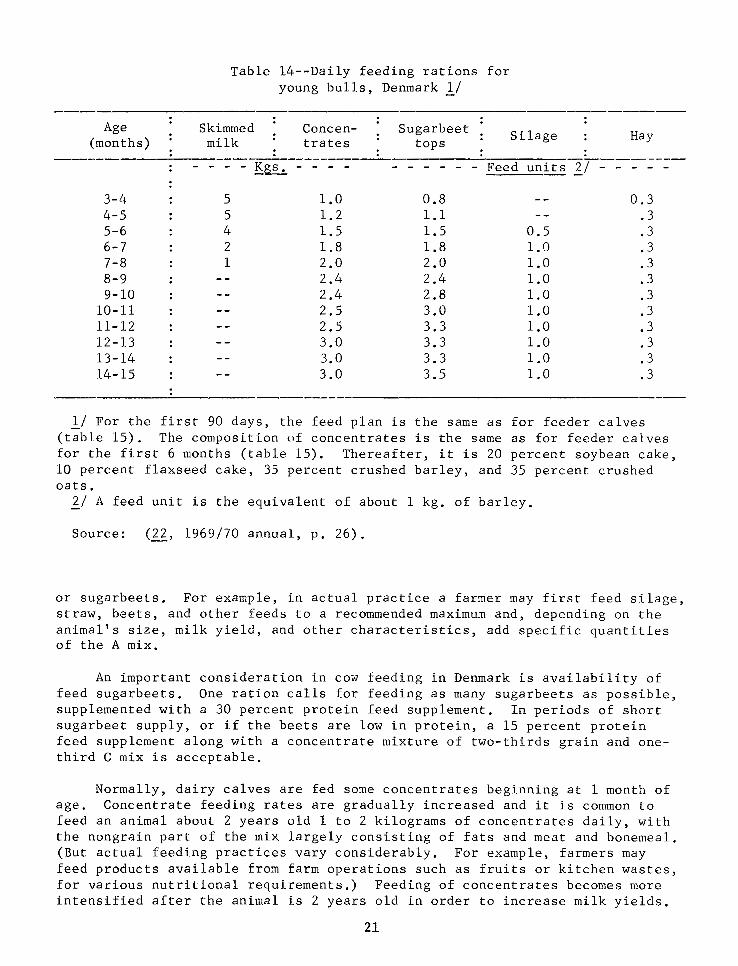
Table 14--Daily feeding rations for young bulls, Denmark lf
Skimmed milk
Concentrates
Sugar beet tops
Silage
- - - - !~ - - - Feed units lf
5 1.0 5 1.2 4 1.5 2 1.8 1 2.0
2.4 2.4 2.5 2.5 3.0 3.0 3.0
0.8 1.1 1.5 1.8 2.0 2.4 2.8 3.0 3.3 3.3 3.3 3.5
0.5 1.0 1.0 1.0 1.0 1.0 1.0 1.0 1.0 1.0
Hay
0.3 .3 • 3 .3 .3 .3 • 3 .3 .3 .3 .3 .3
lf For the first 90 days, the feed plan is the same as for feeder calves (table 15). The composition ~,f concentrates is the same as for feeder calves for the first 6 months (table 15). Thereafter, it is 20 percent soybean cake, 10 percent flaxseed cake, 35 percent crushed barley, and 35 percent crushed oats. lf A feed unit is the equivalent of about 1 kg. of barley.
Source: (22, 1969/70 annual, p. 26).
or sugarbeets. For example, in actual practice a farmer may first feed silage, straw, beets, and other feeds to a recommended maximu11 and, depending on the animal's size, milk yield, and other characteristics, add specific quantities of the A mix.
An important consideration in cow feeding in Denmark is availability of feed sugarbeets. One ration calls for feeding as many sugarbeets as possible, supplemented with a 30 percent protein feed supplement. In periods of short sugarbeet supply, or if the beets are low in protein, a 15 percent protein feed supplement along with a concentrate mixture of two-thirds grain and onethird C mix is acceptable.
Normally, dairy calves are fed some concentrates beginning at 1 month of age. Concentrate feeding rates are gradually increased and it is common to feed an animal about 2 years old 1 to 2 kilograms of concentrates daily, with the nongrain part of the mix largely consisting of fats and meat and bonemeal. (But actual feeding practices vary considerably. For example, farmers may feed products available from farm operations such as fruits or kitchen wastes, for various nutritional requirements.) Feeding of concentrates becomes more intensified after the animal is 2 years old in order to increase milk yields.
21

Age (days)
14-28 29-35 36-42 43-49 50-56 57-63 64-70 71-84 85-112
113-140 141-168 169-196 197-224
Table 15--Daily feeding rations for feeder calves, various ages, Denmark
Whole Skimmed Hay
Concen- Beet milk milk trates ]) tops
- - - - - -~ - - - - -
5 4 1 0.3 2 3 .4 0.5 0.1
6 .5 .6 .1 6 .5 .8 .2 6 .5 1.1 .3 6 .5 1.4 .4 6 .s 1.8 .5 6 .5 2.2 .6 6 .5 2.7 .6 6 .5 3.1 . 7 6 .5 3.5 .8 6 .5 3.9 .9
Total feed units ])
1.7 1.8 1.9 2.0 2.2 2.6 3.0 3.5 4.0 4.5 5.0 5.5 6.0
_y 15 percent flaxseed cake, 10 percent soybean cake, and 75 percent mixed grain.
]) A feed unit is the equivalent of about 1 kg. of barley.
Source: (22, 1969/70 annua 1, p. 26).
The results of the demonstration farms indicate that for stall-fed lactating milk cows with an average weight of about 525 kilograms, the total dailj feed unit requirement is 11.2 feed units. This amounts to 1.07 feed units daily for each kilogram of (4 percent butterfat) milk produced. The recommended percentage of concentrates is one-third of total feed requirements.
As indicated earlier, about 20 to 30 percent of the milk cow ration is concentrates. A typical concentrate mix may contain about 16 percent protein although some may contain over 30 percent. For example, a typical concentrate mix could be 3 feed units of protein supplement and 7 feed units of grains to produce 10 kilograms of milk (4 percent butterfat).
For the 1980 soybean meal estimation used in the projections, a conservative estimate is that soybean meal will constitute 8 percent of the concentrates used for milk production, which is slightly below the maximum level in the A mix, and a recommended percentage in various concentrates for milk production (10, 22).
Several alternative feed plans are recommended for feeder calves. 21 Most of the rations include skimmed milk, concentrates, hay, and various roots
21 Young cattle and breeders not being fattened are largely grass and silage fed.
22

Table 16--Daily feeding rations for milk-fed calves, Den~arK
Age Milk Artificial Other
feeds 1/ : milk : whole milk ____ -:__: _£'2_wder _]J_ __ : ___ supplements Grams Liters Grams ------ ----- ---
1-2 days 300 3.0 100 3-4 days 400 4.0 100 5-7 days 550 5.0 110
2 weeks 660 6.0 110 3 weeks 840 7.0 120 4 weeks 1,000 8.0 125 5 weeks 1,170 9.0 130 6 weeks 1,300 10.0 130 7 weeks 1,540 11.0 140 8 weeks 1,740 12.0 145 9 weeks 1,950 13.0 150
10 weeks 2,240 14.0 160 11 weeks 2,520 14.0 180 12 weeks 2,660 14.0 190 13 weeks 2,800 14.0 200 14 weeks 2,800 14.0 208
---------- ---------------------11 Largely composed of skim~ed ~ilk with protein supple
ments. It has the same nutrient value as whole milk. ll Nondairy ingredients.
Source: (22, 1969/70 annual, p. 27).
(table 15). A typical high protein concentrate formula might include a mixture of 25 percent flaxseed cake, 15 percent soybean meal, and 60 percent grains (barley and oats are the most common grains in mixed feeds). A ration with a lower protein composition is also widely used. It includes 15 percent flaxseed cake, 10 percent soybean meal, and 75 percent grains (22). During the main growing period (from birth to 550 days), total feed req~irements range from 3.43 to 4.80 units ?er kilogram of added weight. The percentage of concentrates to total feed increases with animal weight.
A ration for milk-fed calves, up through 14 weeks of age, is shown in table 16.
The percentage rate of soybean meal in concentrates for dairy heifers raised for beef is estimated at the recommended 10 percent. Heifers, like feeder calves, normally consume a smaller percentage of soybean meal than do steer and bulls. The comparable percentage for stPer and for young and old bulls raised for beef output is estimated at 20 percent (l~).
23

A Danish bull is herded for slaughter at an export slaughterhouse in Kolding, Jutland. Most beef will continue to be derived from milk cows in Denmark.
Concentrates fed to poultry are largely grain mixtures. Corn and barley are normally the most important ingredients in most poultry feeds, but in 1973 an above-average percentage of domestic wheat wa s substituted for imported corn. For broilers, a typicnl ration would include, in addition to grains, about 20-25 percent soybean meal (this percentage is used in various manufactured compound feeds). For the projections in this paper, the amount of soybean meal in rations used for both broilers and eggs is assumed to be 19 percent, or an average of recommended levels of soybean meal in several typical feed comp~unds (~). Poultry rations are generally based on protein requirements ranging between 125 and 180 grams of digestible protein daily for layers. For broilers, the reco~mended daily intake of digestible protein is near 180 grams.
IMPORTANCE OF OILSEEDS IN FEEDS
Feeds are subdivided into three major categories. Concentrate feeds inc lude grains, grain byproducts, oilcakes, and meat and fishmeals. Roughage feeds include vegetables and vegetable roots and hay, straw, and grasses. The third group includes Ptilk and milk powders.
24

Table 17--Consumption o£ concentrates distributed into domestic and imported feeds, Denmark, 1960/61-1970/71
·--------------------------· Type of concentrate :1960/61:1961/62:1962/63:1963/64:1964/65:1965/66:1966/67:1967/6~:1968/69:1969/70:1970/71 . . . ------ -----· ----·----·----
Million feed units l/ :
Grains Domestic • . . . . . . : 3,441 3,582 3,850 4,058 4,485 4,655 4,678 4, 735 7,934 5,290 4,961 Imported . . . . : 778 993 607 780 724 581 667 558 226 251 623
Feed meals ]) Domestic . . . . : 60 73 65 69 76 69 65 65 66 69 70 Imported . . . . : 74 68 47 101 218 145 93 86 79 48 143
Oilcakes Domestic . . . . . . : 1 3 4 4 4 4 5 0 5 4 2 Imported • . . . . . . : 1,127 1,021 1,025 1,215 1,240 1,265 1,246 1,180 1,068 1,221 1,210
Meat and fishmeal Domestic . . . . . . . . : 70 78 121 139 142 128 145 153 146 166 166 Imported • . . : 41 36 30 33 36 46 20 20 41 43 30
: Total concentrates • . . . : 5,592 5,845 5,749 6,399 6, 925 6,893 6,919 6,797 6,565 7,102 7,205
Percent imported . . : 36 36 30 33 32 30 29 27 22 22 28
N Concentrates as a \J1 percent of total feed : 39 40 41 44 44 46 45 46 46 45 45
Oilcakes as a percent of concentrates . . : 20 17 18 19 18 18 18 17 16 17 17
----------------------------- -----ll A feed unit is the equivalent of about 1 kg. of barley. ~/ Largely bran, but contains molasses and yeast.
Sources: (18, 1970;_2).

Of these major categories, concentrates have dominated in recent years. In 1970/71, total consumption of concentrates was about 7.2 billion feed units (table 17), about 1.6 billion feed units higher than the previous decade. In terms of feed units, consumption of concentrates increased fro~ 39 percent of total feeds in 1960/61 to 45 percent in 1970/71. This percentage increased to about 60 percent in 1970/71 when measured on a protein basis. In 1970/71 total grain concentrate consumption, including imported grains, was over 5.6 billion feed units. Home-grown barley contributed about 80 percent of this total.
Roughage has fallen behind concentrates in recent years due largely to the availability of relatively low-priced home-produced grain. In 1970/71, consumption of concentrates was 1 billion feed units above that of roughage. Milk and milk powder accounted for only 463 tnillion feed units in 1970/71, doNn from 636 million in 1960/61. This group has declined in importance as a feed largely due to declining use in the hog sector.
Oilseeds have become more important in concentrates since 1950 as demand for protein has risen, although they h~2 remained a relatively small percentage of the total. In 1970/71, oilcakes consu~ed were under 10 percent of total feeds and 17 percent of concentrates. However, oilcakes contributed about 25 percent of the EE£te~~ requirements in total feeds in 1970/71. ~/
The importance of the two major oilseed co~ponents, soybeans and cottonseed, has been rising. Together they account for nearly 90 percent of all oilseeds used in concentrates.
Nearly all soybean meal is fed in manufactured compound feeds. On some large farms soybean meal may be purchased separately and made into pellets, which are sold to neighboring farms. Also, some farmers may purchase soybean meal separately for on-farm mixing. However, it is not unusual for farmers operating grain-livestock farms to ieliver their grain to the feed mill for mixing with protein supplements and other ingredients. This alternative generally depends on whether the farmer has a price advantage in delivering
\
his own grain. Normally, the mixture is prepared according to recommended standards.
~/ Based on average consumption of protein in a base period of 1963/64-·1964/65, and applying this percentage rate to projections of livestock to 1980, the total protein intake rises sharply. Total protein consumption is estimated at 2.2 million tons in 1980, compared with 1.5 million tons in the base period. The rise is strongest for cows and hogs, with increases in protein consumption of over 50 percent for both categories in 1980 compared with the base period. This rise in protein consumption is not directly convertible into co~sumption of soybean meal, but is an indication of tha expected trend. The implication is a rise in demand for sojbean meal, a major source of protein (1, 2, ~).
26

Economic as well as nutritional advantages underlie the increased use of soybean ~eal. Soybean meal contains 400 grams of digestible protein per kilogram, the highest level of digestible protein of the major oilseeds used in D·2n.11ark with the elCception of peanuts, which are consumed in relatively s:nall quantities. This compares with 360 grams of digestible protein per kilogram for cottonseed meal, 262 grams for sunflowerseed meal, and 182 grams for cocoaseed m·2al (_?1, 1969/70, p. 81).
Other high protein feeds are used extensively but their costs are consideral:lly higher than for soybean meal. For example, m·2at and bonemeal contains 400 grams of digestible protein per kilogram, but its average price per 100 kilograms in 1971 was 9~.6 kroner compared with the soybean meal price of 84.2 kroner. Fishmeal, whose protein content is hi6her thaa soybean cake at 525 grams per kilogram, cost 164.2 kroner per 100 kilograms in 1971 (j, 1971, p. 223).
By October 1973, average prices of all these co~~oaities, as well as grains, increased sharply. The increases reflected--among other things--the transition to higher EC prices and abnormally high world prices. Meat anj bonemeal rose to 165.4 kroner per 100 kilograms, while s~ybean meal and fishmeal increased to abnormally high levels of 134.7 and 343.0 kroner per 100 kilograms, respectively. Nevertheless, a price/protein ratio for these relatively competitive high protein feeds (in~luding cottonseed cake and meal) indicated that soybean meal was the least expensive source of high l'rotein in both 1972 and 1973. These prices resulted in some shifting to home-grown grains in the rations in 1973.
PROJECTIONS
The following basic assumptions a?ply to the 1980 projections of Denmark's use of soybean meal:
• No significant longrun shifts in animal rations, with the percentage of soybean meal in concentrates remaining constant. Shortrun fluctuations in various feed ingredient supplies and prices are considered likely.
• No significant change in the percentage of other high protein feeds (such as cottonseed, sunfloNerseed, and meat and fishmeal), which complement s~ybean meal in animal rations. Total use will increase with higher output of livestock products.
• No significant trade effects from import restrictions imposed on soybeans or soybean meal in the EC. 21
2/~CAP £;;-soybeans has been approved and is expected to be implemented in 1974.
27
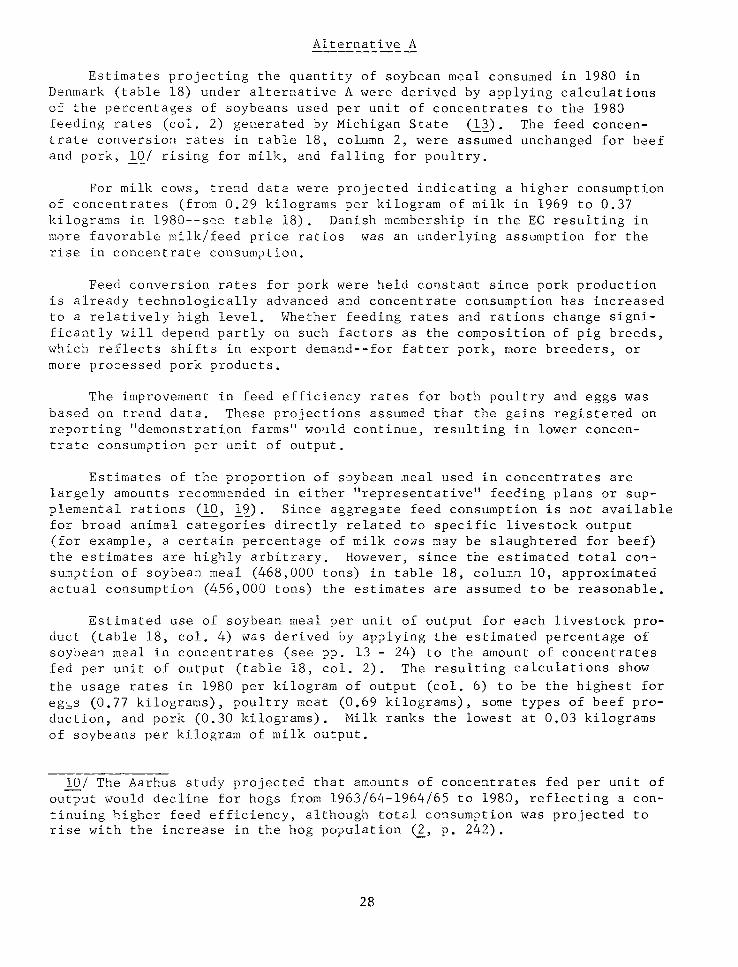
Alternative A
Estimates projecting the quantity of soybean meal consumed in 1980 in Denmark (table 18) under alternative A were derived by applying calculations of the percentages of soybeans used per unit of concentrates to the 1988 feeding rates (col. 2) generated by Michigan State (ld). The feed concentrate conversion rates in table 18, coLumn 2, were assumed unchanged for beef and pork, lQ/ rising for milk, and falling for poultry.
For milk cows, trend data were projected indicating a higher consumption of concentrates (from 0.29 kilograms per kilogram of milk in 1969 to 0.37 kilograms in 1980--see table 18). Danish membership in the EC resulting in more favorable milk/feed price ratios was an underlying assumption for the rise in concentrate consum?tion.
Feed conversion rates for pork were held co~stant since pork production is already technologically advanced and concentrate consumption has increased to a relatively high level. Whether feeding rates and rations change significantly will depend partly on such factors as the composition of pig breeds, which reflects shifts in export demand--for fatter pork, more breeders, or more pro:essed pork products.
The improvement in feed efficiency rates for both poultry and eggs was based on trend data. These projections assumed that the gains registered on reporting "demonstration farms" would continue, resulting in lower concentrate consumptio~ per unit of output.
Estimates of the pro?ortion of s~ybean meal used in concentrates are largely amounts reco~m.ended in either "representative" feeding plans or supplemental rations (lQ, 1:_~). Since aggregste feed consumption is not available for broad animal categories directly related to specific livesto:k output (for example, a certain percentage of milk CONS may be slaughtered for beef) the estimates are highly arbitrary. However, since the estimated total co~SUill?tion of soybean meal (468,000 tons) in table 18, column 10, approximated actual consumptio~ (456,000 tons) the estimates are assumed to be reasonable.
Estimsted use of soybean meal per unit of output for each livestock product (table 18, col. 4) was derived by ap?lying the estimated percentage of soybea~ meal in concentrates (see pp. 13 - 24) to the amount of concentrates fed per unit of output (table 18, col. 2). The resulting calculations show
the usage rates in 1980 per kilogram of output (col. 6) to be the highest for eg::,s (0. 77 kilograms), poultry meat (0. 69 kilogra:ns), some types of beef production, and pork (0.30 kilograms). Milk ranks the lowest at 0.03 kilograms of soybeans per kilogram of milk output.
10/ The Aarhus study projected that amounts of concentrates fed per unit of output \vould decline for hogs from 1963/64-1964/65 to 1988, reflecting a continuing higher feed efficiency, although total consumption was projected to rise with the increase in the hog population (..?_, p. 242).
28
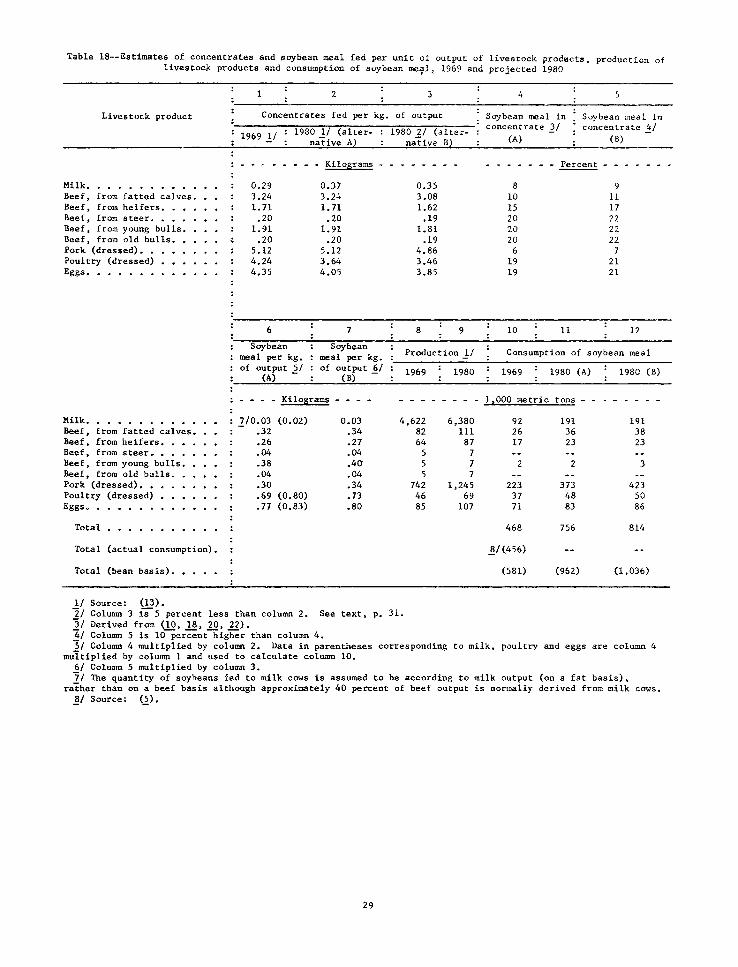
Table 18--Estimates of concentrates and soybean meal fed per unit of output of livestock products, production of livestock products and consumption of soybean me'!l, 1969 and projected 1980
2 3 -
Livestock product Concentrates fed per kg. of output
1969 J) 1980 1/ (alter- 1980 2/ (alter-native Al native Bl
- Kiloflrams
Milk. 0.29 0.37 0.35 Beef, from fatted calves. 3.24 3.2~ 3.08 Beef, from heifers. 1.71 1.71 1.62 Beef, from steer. .20 .20 .19 Beef, from young bulls. 1.91 1.91 1.81 Beef, from old bulls. .20 .20 .19 Pork (dressed). 5.12 5.12 4.86 Poultry (dressed) 4.24 3.64 3.46 Eggs. . 4.35 4.05 3.85
6 7 8 9
Soybean Soybean Production _!/ meal per kg. meal per kg.
of output 5/ of output~/ 1969 1980 (A) - (B)
Kilograms
Milk. . . . 1/0.03 (0.02) 0.03 4,622 6,380 Beef, from fatted calves. .32 .34 82 Ill Beef, from heifers. .26 .27 64 87 Beef, from steer .. . .04 .04 5 7 Beef, from young bulls. .38 .40 5 7 Beef, from old bulls. .04 .04 5 7 Pork (dressed). .30 .34 742 1,245 Poultry (dressed) .69 (0.80) .73 46 69 Eggs. . .77 (0.83) .80 85 107
Total
Total (actual consumption).
Total (bean basis). .
1/ Source: (13). 2/ Column 3 i~S percent less than column 2. See text, p. 31. J/ Derived from (10, 18, 20, 22).
~
Soybean meal in s ... ,ybean meal in concentrate }_/ concentrate !:!_/
(A) (B)
~- - - - - - -8 9
10 11 15 17 20 22 20 22 20 22
6 7 19 21 19 21
10 11 12
Consumption of soybean meal
1969 1980 (A) 1980 (B)
t,ooo metric tons
92 191 191 26 36 38 17 23 23
2 2 3
223 373 423 37 48 so 71 83 86
468 756 814
!if (456)
(581) (962) (1,036)
4/ Column 5 is 10-per~nt~igher than column 4. S/ Column 4 multiplied by column 2. Data in parentheses corresponding to milk, poultry and eggs are column 4
multiplied by column l and used to calculate column 10. 6/ Column 5 multiplied by column 3. 71 The quantity of soybeans fed to milk cows is assumed to be according to milk output (on a fat basis),
rather than on a beef basis although approximately 40 percent of beef output is normally derived from milk cmoJs. !}_/ Source: (2).
29

T~e base period (1969) and 1980 commodity production projections (table 18,
cols. 8 and 9) were generated in the Michigan State model (13). Projections of livesto:k numbers were multiplied by projections of production per unit to yield total output. The projection technique was a recursive model in which the coefficients in most of the individual equations were estimated via ordinary least squares. 111 Several examples of these equations are shown in table 19 (App. A).
The Michigan State projections indicated a sharp rise in milk, pork, beef, and egg output. Milk production, at 6.4 million tons in 1980, is 38 percent above the base period. Pork output is projected to increase to 1.2 million tons in 1980, or 68 percent above base period levels. Beef from fatted calves at 111,000 tons represents half of total projected beef and veal output, and is 35 percent higher than the base period. Poultry meat production is projected to increase 50 percent and egg production, 25 percent.
Estimates of the consumption of soybean meal in both the base period and in 1980 (cols. 10 and 11) were derived by applying the rate of soybean neal use per unit of output (col. 6) to the production data. The estimates derived indicate a strong increase in consumption of soybean meal by 1980 to 756,000 tons--over 60 percent above the base period estimate of 468,000 tons. The actual quantity of soybean meal consumed in the base period was slightly below this estimate, or 456,000 tons. Together, milk and pork account for about 75 percent of the projected 1980 soybean meal consumption. Use of soybean meal is projected at 191,000 tons for milk, 107 percent above the base period, and 373,000 tons for pork, 67 percent above the base period. If production of beef from fatted calves increases as projected, the soybean meal consumed in 1980 is estimated at 36,000 tons--10,000 tons above the 1969 level •. Meal consumption for poultry meat production would rise to 48,000 tons, 30 percent above the base period.
Alternative B
There was a relatively strong substitution of nongrain feeds (such as soybean meal, corn gluten, and tapioca) in the Netherlands from 1962, when the Common Agricultural Policy was established in the EC, until 1970/71. The percentage of grains used in compound feeds in the Netherlands declined from approximately 66 percent in 1958/59-1961/62 to 34.2 percent in 1970/71 (l£). On a livestock unit basis, grain consumption declined from a high of 1,080 kilograms in 1960/61 to 655 kilograms in 1968/69. In contrast to this development in the Netherlands, grain consumption per livestock unit increased in Den
mark during this period, from 1,000 kilograms in 1960/61 to 1,222 kilograms in 1968/69.
Although the substitution of nongrain feeds for grains was much more pronounced in the Netherlands than in other EC-6 members, similar developments
11/ Production of some livestock products was derived without benefit of projection equations due to data limitations. Also, in so~e cases, results of equations projecting slaughter of some categories of calves, hogs, and poultry were modified to reflect more realistic developments (11, pp. 146-173). In addition, some of the feeding rates were drawn from accounts of demonstration farms-farms which are normally above-average performers.
30

could occur in Denmark. However, it is unlikely that the pattern of substitution of nongrain feeds for grains will be as strong in Denmark as in the Netherlands. In the Netherlands--an important producer of commercially processed concentrate feeds--greater use has been made of feed formulation through linear programming. Furthermore, the price gap between grain and nongrain feeds has narrowed in recent years and may not be as wide during the 1970's as during the decade following the creation of the EC. ~lso, in contrast to the Netherlands, Danish availability of homegrown grains (particularly barley) has encouraged high grain consumption per unit of livestock.
Assuming that 1980 feed conversion rates for concentrates are likely to show more improvement than assu~ed in assumption A and that Denmark, now an EC partner, will increase the percentage of nongrain feeds in rations, an alternative set of projections (B) was made. These projections assume a 5-percent conversion improvement (table 18, col. 3) over those used in alternative A and approximately a 10 percent increase in the percentage of soybean meal used in concentrates (table 18, col, 5) over those used in alternative A. Total consumption of soybean meal is calculated at 814,000 tons in 1980 (table 18, col. 12), 8 percent higher than under alternative A. This converts to an import requirement of over 1 million tons of soybeans, 78 percent above the base period.
31
LITERATURE CITED
(1) Agricultural Council. 1967. Denmark. Agriculture in Denmark, a Survey of Structure and
Development. Copenhagen.
(2) Andersen, Palle Schelde , and others. 1969. Projections of Supply and Demand for Agricultural Products in
Denmark (1970-1980). Aarhus University's Economic Institute, Aarhus.
(3) Beretning fra Fors~gslaboratoriet, Helarsfors~g med Kvaeg. Various annual reports by the State Animal Research Institute. Copenhagen.
(4) Central Statistics Dept.
(5)
(6)
(7)
(8)
Denmark: Handelsstatistiske MeddelPlser, Annual Trade Statistics. December issues.
Denmark: Landbrugsstatistik (Agricultural Statistics). Copenhagen. Various annuals.
1959. Denmark: Landbrugsstatistik 1900-1965, Vol. II. (A survey of agricultural statistics of animal numbers and livestock production). Copenhagen.
Denmark: Vareindforsel (Import trade statistics). Copenhagen. Various annuals.
Denmark: Statistisk Efterretninger. tical reports. Copenhagen.
Various weekly statis-
(9) Cohen, Marshall H. 1971. "Common Market Benefits Lure Danish Farmers Toward EC Membership,"
Foreign Agriculture, U.S. Dept. Agr. Sept. 6.
(10) Dansk Landbrugs Grovvareselskab, (DLG).
(11) Denmark 1970.
Various recommended supplement rations for different animal categories. Copenhagen.
og De Europaeiske Faellesskaber. Report on D:~nmark and the Common Market (part 2), by a Committee of Experts. Copenhagen.
(12) Dirks, Harlan. 1972. 11 Danish Farmers Welcome EC Membership," Foreign Agriculture,
U.S. Dept. Agr. Nov. 27.
32

(13)
(14)
(15)
(16)
Ferris, 1971.
John , and others. The Impact on U.S. Agricultural Trade of the Accession of the United Kingdom, Ireland, Denmark, and Norway to the European Econo~ic Co~munity. Research Report No. 11. Institute of International Agriculture, Michigan State University. East Lansing.
Food and Agriculture Organization of the United Nations. 1966. European Breeds of Cattle, Vol. I. Rome.
1955. Problems of Animsl Feeding in Europe, June. Rome.
Foreign 1970.
Agricultural Service. Office of the Agricultural Attache, Unpublished reports particularly NT0847, June 23, 1970; NT0025, March 13, 1970. American Embassy, Copenhagen and the Netherlands.
(17) Horst, James. 1972. Compound Feeds in the United Kingdom Effects of Support Policies
on Use of Ingredients. ERS-Foreign - 324, Econ. Res. Serv., U.S. Dept. Agr.
(18) Krogstrup, Erik , Director, and a committee of experts. 1970. Betaenkning Afgivet af Udvalget Vedr¢rende Landbrugsordningerne,
No. 561. (Report on Agriculture and the Common Market.) Copenhagen,
(19) Landbrugshjoskolen (The Agricultural College). 1972. Denmark. Unpublished typical feeding plans for cattle and hogs.
Copenhagen.
(20) Land¢konomiske Driftsbureau.
(21)
1963. Denmark, Unders¢gelser over Landbrugets Driftsforhold (Survey of agricultural farm management). Copenhagen.
1973. Landbrugets Prisforhold 1972-73 (Agricultural Prices 1972-73), Bulletin No. 14. Copenhagen.
(22) Ministry of Agriculture. Denmark. Handbag for Driftsplanlaegning (Handbook of Farm Management). Copenhagen. Various annuals.
(23) Ministry of Foreign Affairs. 1970. Denmark and the European Communities. Secretariat for European
Market Relations. Copenhagen.
(24) Morrison, Frank B. 1959. Feeds and Feeding, 22nd Edition. Iowa.
(25) United Nations. Trade Runs, (unpublished) New York. Annual.
33
(26) Weightman, Paul W.H. 1969. Concentrated Feeding Stuffs for Livestock in Denmark, 1960-61
to_l965-66. Agr. Econ. Res. 287. Cornell Univ., Dept. Agr. Econ., Ithaca. May.
34

APPENDIX A
Table 19--Equations used to project selected livesto~k numbers and production of livestock products to 1980, Denmark
Milk
(a) Number of cows on farms (l,OOO)t = 591 + .6665 Number of cows on farms (l,OOO)t
(.1808) + .1384 Net returns over variable costs (Kroner per cow)t-1
(.1370) -110.7 Price of cull cows (Kroner per kilogram)t-l
(37.4)
-2 R = .81 Standard error (S.E.)
(b) Milk production per cow (Kg)t = 3285 +34.11 Time (1949 = 1) (3.71)
-2 R = .81 S.E. 96
Beef
(a) Production of heifer beef in t per cow on farms t-2 (Kg) + .7660 Production of heifer beef in t-1 per cow on farms
(.0818) +1.662 (Price of heifers ~ Price of milk)t-1
(. 779) -2 R = .91 S.E. = 3.24
(a) Sows including gilts, on farms, July 1 (l,OOO)t -126 + .9567 Sows on farms, July l (l,OOO)t-1
(.0572)
.0160
+3.509 Net returns over variable costs per 90 kg., farm accountst-1 (1.109)
(a)
-2 R = .% S.E. 54
Hens, 6 months + . 9965 Hens,
and over, on farms July l (l,OOO)t = -506
(.1259) +34.94
(73 .17)
6 months and over, on farms July 1 (l,OOO)t-l
Net returns over concentrate farm accounts (Kr.)t-1 -2 R = .77 S.E. = 778
costs per hen,
Source: (!], pp. 146-148). 35

APPENDIX B
Trend Projections
An alternative set of projections, based on a linear trend (1960-72) for principal livestock proiucts, was undertaken for comparative purposes. Production of beef and veal, pork, poultry meat, milk, and eggs was projected to 1980 using the feed conversion rates and share of soybean meal shown in alternative A in table 18. Output of most products unre;Jl.istically trended lower since the effect of EC membership--that is, higher net returns for livestock products and enlarged export markets--is not accounted for in the trend projections.
Based on past trends, 1980 ~ilk output would decline to 4.2 million tons reflecting the reduction in cow numbers which chara:terized the 1960's. At this level of output, total consumption of soybean meal would be 83,000 tons (applying the non-EC estimate of 0.02 kilograms of soybean meal per kilogram of output from table 18, col. 6).
Largely reflecting a declining trend of cow numbers, beef production would decline by an average annual rate of approximately 4,000 tons to 199,00J tons in 1980 compared with 219,000 tons (table 18). Production of beef and veal in 1980 was distributed among the principal classes of cattle as follows: 35 percent from cull cows (70,000 tons), 30 percent from feeder calves (60,000 tons), 25 percent from heifers (50,000 tons), and 10 percent from bulls and steer (20, 000 tons) (percentage distribution based 011 (lJ, p. 164)).
T~e trends indicate a drop in total soybean meal consumption for beef to 40,000 tons in 1980. This compares ~ith a base period (1969) consumption of 45,000 tons and is significantly below the 1980 A and B alternative projections.
Pork output is projected to trend higher at an average annual rate of over 10,000 tons from 1972 to 1980 and reach only 896,000 tons, sharply below the "in-EC" projection of 1.2 million (table 18). This level of output may be translated into an estimated soybean meal consumption of about 178,000 tons, about 195,0J0 tons less than the 1980 alternative A projection in table 18.
A trend for poultry meat and eggs was also calculated to derive an estimate of soybean meal consumJtion. The output derived for poultry meat was 9~,000 tons by 1980 (sharply above the projection in table 18), reflecting the influence of a sizable 1972 increase. Output for eggs is estimated to fall to 32,000 by 1980, a level approximately equal to domestic consumption in 1973. This is a sharp, unrealistic decline in output compared to the projection in table 18 of 107,000 tons. At these low levels of output, consumption of soybean meal in 1980 would be 75,000 tons and 26,000 tons for poultry meat and eggs, respectively.
Total consumption of soybean meal, based on this analysis, would decline to 402,000 tons by 1980--approximately 46 percent below the 1980 projection under alternative A.
36


UNITED STATES DEPARTMENT OF AGRICULTURE WASHINGTON, D.C. 20250
OFFICIAL BUSINESS
PENALTY FOR PRIVATE USE, $300
POSTAGE AND FEES PAID U.S. DEPARTMENT OF
AGRICULTURE
AGR 101
FIRST CLASS