department of science, information technology and ... · information technology and innovation....
TRANSCRIPT
Land cover change in the Cape York region 2012–14
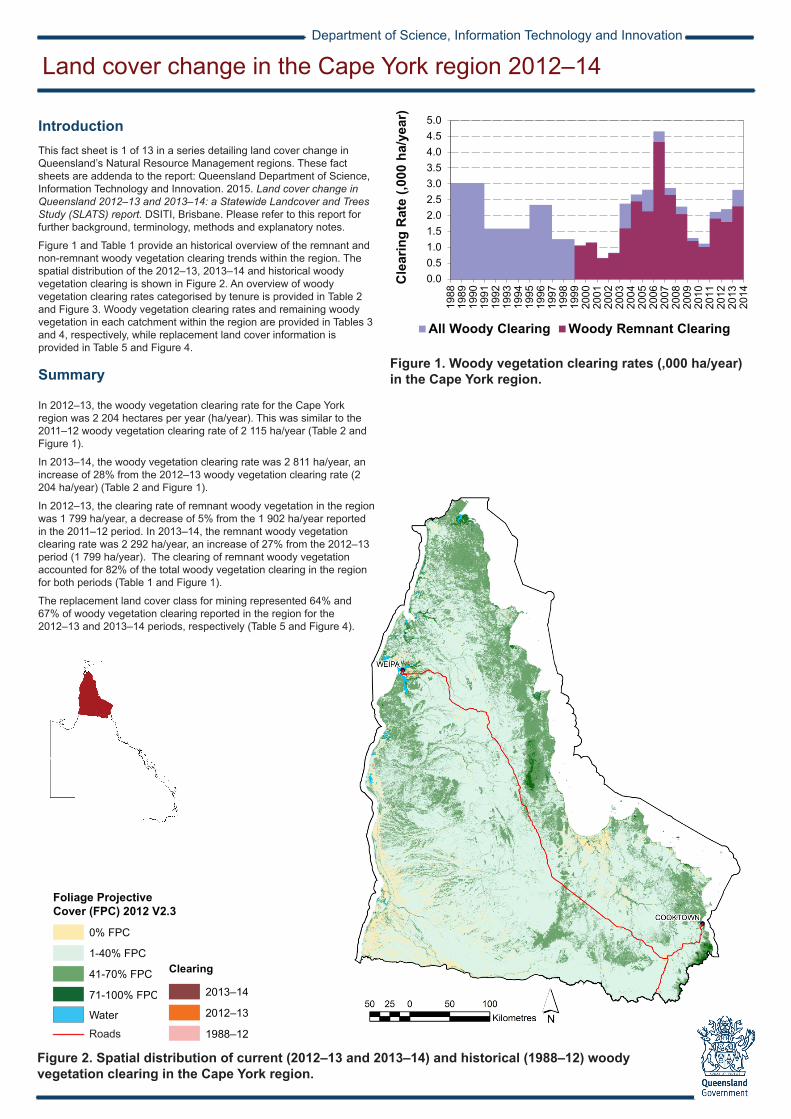
Figure 1. Woody vegetation clearing rates (,000 ha/year) in the Cape York region.
0.00.51.01.52.02.53.03.54.04.55.0
1988
1989
1990
1991
1992
1993
1994
1995
1996
1997
1998
1999
2000
2001
2002
2003
2004
2005
2006
2007
2008
2009
2010
2011
2012
2013
2014
Cle
arin
g R
ate
(,000
ha/
year
)
All Woody Clearing Woody Remnant Clearing
Department of Science, Information Technology and Innovation
IntroductionThis fact sheet is 1 of 13 in a series detailing land cover change in Queensland’s Natural Resource Management regions. These fact sheets are addenda to the report: Queensland Department of Science, Information Technology and Innovation. 2015. Land cover change in Queensland 2012–13 and 2013–14: a Statewide Landcover and Trees Study (SLATS) report. DSITI, Brisbane. Please refer to this report for further background, terminology, methods and explanatory notes..Figure 1 and Table 1 provide an historical overview of the remnant and non-remnant woody vegetation clearing trends within the region. The spatial distribution of the 2012–13, 2013–14 and historical woody vegetation clearing is shown in Figure 2. An overview of woody vegetation clearing rates categorised by tenure is provided in Table 2 and Figure 3. Woody vegetation clearing rates and remaining woody vegetation in each catchment within the region are provided in Tables 3 and 4, respectively, while replacement land cover information is provided in Table 5 and Figure 4.
Summary In 2012–13, the woody vegetation clearing rate for the Cape York region was 2 204 hectares per year (ha/year). This was similar to the 2011–12 woody vegetation clearing rate of 2 115 ha/year (Table 2 and Figure 1).
In 2013–14, the woody vegetation clearing rate was 2 811 ha/year, an increase of 28% from the 2012–13 woody vegetation clearing rate (2 204 ha/year) (Table 2 and Figure 1).
In 2012–13, the clearing rate of remnant woody vegetation in the region was 1 799 ha/year, a decrease of 5% from the 1 902 ha/year reported in the 2011–12 period. In 2013–14, the remnant woody vegetation clearing rate was 2 292 ha/year, an increase of 27% from the 2012–13 period (1 799 ha/year). The clearing of remnant woody vegetation accounted for 82% of the total woody vegetation clearing in the region for both periods (Table 1 and Figure 1).
The replacement land cover class for mining represented 64% and 67% of woody vegetation clearing reported in the region for the 2012–13 and 2013–14 periods, respectively (Table 5 and Figure 4).
Figure 2. Spatial distribution of current (2012–13 and 2013–14) and historical (1988–12) woody vegetation clearing in the Cape York region.
Clearing
2013–14
2012–13
1988–12
LegendWater
0% FPC
1-40% FPC
41-70% FPC
71-100% FPC
Foliage Projective Cover (FPC) 2012 V2.3
Roads
LegendWater
0% FPC
1-40% FPC
41-70% FPC
71-100% FPC

Land cover change in the Cape York region 2012–14
Woody vegetation clearing by remnant status
Table 1. Remnant and non-remnant woody vegetation clearing rates (,000 ha/year) in the Cape York region.
Woody vegetation clearing by tenure
Table 2. Woody vegetation clearing rates (,000 ha/year) in the Cape York region by tenure.
Figure 3. Woody vegetation clearing rates (,000 ha/year) in the Cape York region by tenure.
0.0
0.5
1.0
1.5
2.0
2.5
3.0
3.5
4.0
4.5
5.0
1988
–91
1991
–95
1995
–97
1997
–99
1999
–00
2000
–01
2001
–02
2002
–03
2003
–04
2004
–05
2005
–06
2006
–07
2007
–08
2008
–09
2009
–10
2010
–11
2011
–12
2012
–13
2013
–14
Cle
arin
g R
ate
(,000
ha/
year
)
Freehold Leasehold Other tenures Other reserves
Period Non-remnant woody
Remnant woody
Total woody clearing
1999–00 0.002 1.053 1.055
2000–01 0.000 1.147 1.147
2001–02 0.012 0.654 0.666
2002–03 0.013 0.816 0.828
2003–04 0.778 1.598 2.376
2004–05 0.218 2.448 2.666
2005–06 0.682 2.133 2.814
2006–07 0.337 4.319 4.656
2007–08 0.220 2.649 2.870
2008–09 0.234 2.047 2.281
2009–10 0.093 1.200 1.294
2010–11 0.104 1.010 1.114
2011–12 0.213 1.902 2.115
2012–13 0.404 1.799 2.204
2013–14 0.519 2.292 2.811
Period Freehold Leasehold Other tenures
Other reserves Total
1988–91 0.408 1.528 1.018 0.073 3.027
1991–95 0.282 1.061 0.284 0.005 1.632
1995–97 0.525 0.888 0.892 0.034 2.339
1997–99 0.105 0.484 0.654 0.016 1.259
1999–00 0.181 0.214 0.658 0.002 1.055
2000–01 0.134 0.323 0.682 0.009 1.147
2001–02 0.168 0.480 0.016 0.002 0.666
2002–03 0.190 0.444 0.164 0.030 0.828
2003–04 0.888 0.659 0.756 0.072 2.375
2004–05 0.428 1.380 0.814 0.043 2.665
2005–06 0.139 1.595 1.015 0.066 2.814
2006–07 0.148 2.442 1.944 0.121 4.656
2007–08 0.023 0.942 1.896 0.008 2.870
2008–09 0.124 1.104 1.020 0.033 2.281
2009–10 0.075 0.577 0.622 0.02 1.294
2010–11 0.167 0.588 0.319 0.041 1.114
2011–12 0.142 0.399 1.518 0.057 2.115
2012–13 0.135 0.664 1.380 0.024 2.204
2013–14 0.186 0.641 1.885 0.100 2.811

Woody vegetation clearing by catchment
Table 3. Woody vegetation clearing rates (,000 ha/year) in the Cape York region by catchment.
Remaining woody vegetation Table 4. Remaining woody vegetation in the Cape York region by catchment.
Land cover change in the Cape York region 2012–14
Catchments
2009
–10
2010
–11
2011
–12
2012
–13
2013
–14
Alice River 0.064 0.072 0.009 0.080 0.031
Archer River 0.004 0.095 0.079 0.007 0.022
Coen River 0.031 0.072 0.000 0.012 0.022
Coleman River 0.054 0.059 0.018 0.008 0.012
Ducie River 0.000 0.008 0.001 0.015 0.012
Edward River 0.019 0.040 0.031 0.024 0.030
Embley River 0.040 0.047 0.158 0.261 0.118
Endeavour River 0.019 0.038 0.129 0.099 0.067
Hann River 0.006 0.053 0.089 0.070 0.053
Holroyd River 0.005 0.003 0.006 0.010 0.051
Jacky Jacky Creek 0.000 0.000 0.001 0.002 0.010
Jardine River 0.000 0.000 0.012 0.002 0.029
Jeannie river 0.014 0.115 0.012 0.028 0.076
Kendall River 0.001 0.009 0.002 0.019 0.012
Lockhart River 0.003 0.001 0.000 0.000 0.009
McDonald River 0.000 0.000 0.000 0.000 0.000
Mission River 0.583 0.283 1.272 1.134 1.777
Mitchell River 0.172 0.046 0.004 0.000 0.002
Normanby River 0.137 0.118 0.043 0.282 0.346
Olive River 0.000 0.000 0.000 0.011 0.000
Palmer River 0.125 0.031 0.097 0.091 0.061
Pascoe River 0.003 0.008 0.000 0.002 0.000
Skardon River 0.000 0.000 0.000 0.000 0.000
Stewart River 0.000 0.014 0.000 0.006 0.017
Watson River 0.006 0.001 0.144 0.002 0.016
Wenlock River 0.007 0.003 0.010 0.038 0.037
Total 1.294 1.115 2.115 2.204 2.811
Catchments Area (,000 ha)
2012 wooded vegetation
cover (,000 ha)
% wooded vegetation
cover
Alice River 1294 1163 90
Archer River 1061 1001 94
Coen River 321 309 96
Coleman River 534 497 93
Ducie River 358 347 97
Edward River 751 644 86
Embley River 192 182 94
Endeavour River 210 205 97
Hann River 956 839 88
Holroyd River 544 526 97
Jacky Jacky Creek 296 284 96
Jardine River 328 319 97
Jeannie river 363 341 94
Kendall River 485 480 99
Lockhart River 288 282 98
McDonald River 271 262 97
Mission River 268 243 91
Mitchell River 860 612 71
Normanby River 1484 1402 95
Olive River 205 201 98
Palmer River 812 782 96
Pascoe River 212 211 99
Skardon River 44 41 93
Stewart River 274 263 96
Watson River 468 455 97
Wenlock River 752 728 97
Total 13631 12619 93

Land cover change in the Cape York region 2012–14
Land cover change in the Cape York region 2012–14 Land cover change in the Cape York region 2012–14
Woody vegetation clearing by replacement land coverTable 5. Woody vegetation clearing rates (,000 ha/year) in the Burnett Mary region by replacement land cover.
0.0
0.5
1.0
1.5
2.0
2.5
1988
–91
1991
–95
1995
–97
1997
–99
1999
–00
2000
–01
2001
–02
2002
–03
2003
–04
2004
–05
2005
–06
2006
–07
2007
–08
2008
–09
2009
–10
2010
–11
2011
–12
2012
–13
2013
–14
Cle
arin
g R
ate
(,000
ha/
year
)
Pasture Crop Forestry Mining Infrastructure Settlement
Figure 4. Woody vegetation clearing rates (,000 ha/year) in the Cape York region by replacement land cover.
.The Queensland Government supports and encourages the dissemination and exchange of information. However, copyright protects this document. The State of Queensland has no objection to this material being reproduced, made available online or electronically, provided it is for your personal, non-commercial use, or use within your organisation; the material remains unaltered; and the State of Queensland is recognised as the owner.© The State of Queensland 2015.
The Queensland Government supports and encourages the dissemination and exchange of its information. The copyright in this publication is licensed under a Creative Commons Attribution 3.0 Australia (CC BY) licence
Under this licence you are free, without having to seek permission from DSITI, to use this publication in accordance with the licence terms. You must keep intact the copyright notice and attribute the State of Queensland, Department of Science, Information Technology and Innovation as the source of the publication. For more information on this licence visit http://creativecommons.org/licens-es/by/3.0/au/deed.en
Prepared by Remote Sensing Centre Science Division Department of Science, Information Technology and Innovation PO Box 5078 Brisbane Queensland 4001 Phone: 13 QGOV (13 74 68)
Period Pasture Crop Forestry Mining Infrastructure Settlement Total
1988–91 1.090 0.000 0.000 0.597 1.339 0.002 3.027
1991–95 0.520 0.608 0.000 0.368 0.089 0.001 1.587
1995–97 0.044 0.599 0.000 0.697 0.991 0.007 2.338
1997–99 0.154 0.655 0.000 0.018 0.431 0.002 1.260
1999–00 0.810 0.004 0.002 0.000 0.235 0.003 1.055
2000–01 0.918 0.000 0.000 0.000 0.229 0.000 1.147
2001–02 0.488 0.000 0.000 0.000 0.176 0.003 0.666
2002–03 0.718 0.000 0.000 0.005 0.105 0.000 0.828
2003–04 1.360 0.000 0.000 0.634 0.379 0.003 2.376
2004–05 0.735 0.000 0.000 0.833 1.086 0.012 2.666
2005–06 1.382 0.000 0.000 0.979 0.450 0.003 2.814
2006–07 2.309 0.000 0.000 1.841 0.491 0.015 4.656
2007–08 0.915 0.000 0.000 1.918 0.033 0.004 2.870
2008–09 0.891 0.000 0.000 0.732 0.656 0.002 2.281
2009–10 0.479 0.000 0.000 0.616 0.190 0.008 1.294
2010–11 0.535 0.000 0.000 0.328 0.248 0.003 1.114
2011–12 0.469 0.000 0.000 1.394 0.250 0.002 2.115
2012–13 0.501 0.002 0.000 1.400 0.292 0.009 2.204
2013–14 0.683 0.000 0.000 1.892 0.217 0.019 2.811