design and development of a target-costing model for machining
TRANSCRIPT

Graduate Theses, Dissertations, and Problem Reports
2004
Design and development of a target-costing model for machining Design and development of a target-costing model for machining
Ameet Kokatnur West Virginia University
Follow this and additional works at: https://researchrepository.wvu.edu/etd
Recommended Citation Recommended Citation Kokatnur, Ameet, "Design and development of a target-costing model for machining" (2004). Graduate Theses, Dissertations, and Problem Reports. 1546. https://researchrepository.wvu.edu/etd/1546
This Thesis is protected by copyright and/or related rights. It has been brought to you by the The Research Repository @ WVU with permission from the rights-holder(s). You are free to use this Thesis in any way that is permitted by the copyright and related rights legislation that applies to your use. For other uses you must obtain permission from the rights-holder(s) directly, unless additional rights are indicated by a Creative Commons license in the record and/ or on the work itself. This Thesis has been accepted for inclusion in WVU Graduate Theses, Dissertations, and Problem Reports collection by an authorized administrator of The Research Repository @ WVU. For more information, please contact [email protected].

Design and Development of a Target-Costing Model for Machining
Ameet Kokatnur
Thesis submitted to the
College of Engineering and Mineral Resources
at West Virginia University
in partial fulfillment of the requirements for the degree of
Master of Science
in
Industrial Engineering
Bhaskaran Gopalakrishnan, Ph.D., Chair.
Jack Byrd Jr., Ph.D.
Robert Creese, Ph.D.
Department of Industrial and Management Systems Engineering
Morgantown, West Virginia
2004
Keywords: Target-costing, Machining, Turning, Geometric Programming
ABSTRACT
In today’s intensely competitive and highly volatile business environment, consistent
development of low cost and high quality products meeting the functionality
requirements is a key to a company’s survival. Companies continuously strive to reduce
the costs while still producing quality products to stay ahead in the competition. Many
companies have turned to target costing to achieve this objective. Target costing is a
structured approach to determine the cost at which a proposed product, meeting the
quality and functionality requirements, must be produced in order to generate the desired
profits. It subtracts the desired profit margin from the company’s selling price to establish
the manufacturing cost of the product. Extensive literature review revealed that
companies in automotive, electronic and process industries have reaped the benefits of
target costing. However target costing approach has not been applied in the machining
industry, but other techniques based on Geometric Programming, Goal Programming,
and Lagrange Multiplier have been proposed for application in this industry. These
models follow a forward approach, by first selecting a set of machining parameters, and
then determining the machining cost. Hence in this study we have developed an
algorithm to apply the concepts of target costing, which is a backward approach that
selects the machining parameters based on the required machining costs, and is therefore
more suitable for practical applications in process improvement and cost reduction. A
target costing model was developed for turning operation and was successfully validated
using practical data.

iii
ACKNOWLEDGEMENTS
I wish to express my sincere gratitude and appreciation to my research advisor and
committee chair Dr. Bhaskaran Gopalakrishnan for his continued support, encouragement
and insightful guidance which led me throughout the course of my studies at West
Virginia University. I would like to thank my committee member and IMSE Dept.
graduate program coordinator Dr. Robert Creese for his valuable guidance towards the
completion of this research. I would also like to thank Dr. Jack Byrd Jr. for accepting to
serve on my thesis committee.
My sincere appreciation goes to Mr. Jim Williams of Devall Brothers, Morgantown, for
his tremendous support and guidance in the research validation process. Validation of this
model would not have been possible without his cooperation in providing us with the
necessary data from one of his projects.
I would also like to acknowledge Mr. James Dalton’s support and guidance during the
entire period of my studies at West Virginia University. Working with him in the
manufacturing lab was an invaluable learning experience and has contributed towards the
development of good work ethics. Finally I would also like to thank my dearest friend
Mr. Deepak Gupta for his constructive inputs during the course of this study.

iv
TABLE OF CONTENTS
ABSTRACT...................................................................................................................... II
ACKNOWLEDGEMENTS ...........................................................................................III
TABLE OF CONTENTS ............................................................................................... IV
LIST OF FIGURES .......................................................................................................VII
LIST OF TABLES .......................................................................................................VIII
LIST OF TABLES .......................................................................................................VIII
INTRODUCTION............................................................................................................. 1
1.1 NEED FOR TARGET-COSTING...................................................................................... 1 1.2 TARGET-COSTING METHODOLOGY............................................................................. 2 1.3 TARGET-COSTING IN MACHINING .............................................................................. 3 1.4 TURNING.................................................................................................................... 3 1.5 PRIMARY VARIABLES IN TURNING............................................................................. 4
1.5.1 Cutting Speed..................................................................................................... 5 1.5.2 Feed.................................................................................................................... 5 1.5.3 Depth Of Cut ...................................................................................................... 5
1.6 NOTATIONS USED IN THE TARGET-COSTING ALGORITHM ......................................... 5 1.7 MACHINING COST ...................................................................................................... 7
1.7.1 Feeding Cost ...................................................................................................... 7 1.7.2 Rapid Traverse cost ........................................................................................... 7 1.7.3 Loading/Unloading Cost .................................................................................... 8 1.7.4 Setup Cost .......................................................................................................... 8 1.7.5 Tool Changing Cost ........................................................................................... 8 1.7.6 Re-Sharpening Cost ........................................................................................... 8 1.7.7 Re-Brazing Cost ................................................................................................. 9 1.7.8 Carbide Insert Cost ............................................................................................ 9 1.7.9 Grinding Wheel Cost.......................................................................................... 9 1.7.10 Material Cost ................................................................................................. 10 1.7.11 Rework Cost ................................................................................................... 10
1.8 NEED FOR RESEARCH .............................................................................................. 10 1.9 RESEARCH OBJECTIVES ............................................................................................ 11 1.10 ASSUMPTIONS ........................................................................................................ 12 1.11SYSTEM DIAGRAM.................................................................................................. 12 1.12 CONCLUSION .......................................................................................................... 16
LITERATURE REVIEW .............................................................................................. 17
2.1 TARGET-COSTING HISTORY...................................................................................... 17 2.2 TARGET-COSTING DEFINITIONS................................................................................ 17 2.3 APPROACH TO TARGET-COSTING............................................................................. 18 2.4 TARGET-COSTING IN INDUSTRY ............................................................................... 19 2.5 MACHINING ECONOMICS.......................................................................................... 19 2.6 CONCLUSION ............................................................................................................ 21

v
SYSTEM DEVELOPMENT.......................................................................................... 22
3.1 DESIGN AND DEVELOPMENT OF THE ALGORITHM .................................................. 22 3.2 GEOMETRIC PROGRAMMING MODEL BACKGROUND ................................................ 23 3.3 GEOMETRIC PROGRAMMING MODEL NOMENCLATURE............................................ 24 3.4 THE ALGORITHM ...................................................................................................... 24 3.5 SCOPE OF THE TARGET-COSTING PROGRAM............................................................ 26 3.6 CODE DEVELOPMENT ............................................................................................... 38 3.7 DATABASE DESIGN .................................................................................................. 39 3.8 CONCLUSION ............................................................................................................ 40
SYSTEM BEHAVIOR ANALYSIS .............................................................................. 41
4.1 BASE CASE............................................................................................................... 49 4.2 ITERATION 1: HSS CUTTING TOOL........................................................................... 52 4.3 ITERATION 2: BRAZED CARBIDE TIP CUTTING TOOL ............................................... 55 4.4 ITERATION 3: CARBIDE INSERT II ............................................................................. 57 4.5 ITERATION 4: MATERIAL COST REDUCTION ............................................................. 59 4.6 CONCLUSION ............................................................................................................ 59
SYSTEM VALIDATION ............................................................................................... 60
5.1 DATA ....................................................................................................................... 60 5.2 CASE 1: 2% COST REDUCTION ................................................................................. 62 5.3 CASE 2: 2.9% COST REDUCTION .............................................................................. 64 5.4 CONCLUSION ............................................................................................................ 66
CONCLUSION AND FUTURE WORK ...................................................................... 67
6.1 CONCLUSION ............................................................................................................ 67 6.2 FUTURE WORK ......................................................................................................... 68
REFERENCES................................................................................................................ 69
APPENDIX A.................................................................................................................. 74
SENSITIVITY ANALYSIS TABLES .................................................................................... 74
APPENDIX B .................................................................................................................. 90
PROGRAM TO CONTROL THE INPUT FORM 1................................................................... 90
APPENDIX C .................................................................................................................. 93
PROGRAM TO CONTROL THE INPUT FORM 2................................................................... 93
APPENDIX D.................................................................................................................. 99
PROGRAM TO CONTROL FORM 3 .................................................................................... 99
APPENDIX E ................................................................................................................ 101
PROGRAM TO CONTROL FORM 4 .................................................................................. 101
APPENDIX F................................................................................................................. 108
PROGRAM TO CONTROL FORM 5 .................................................................................. 108

vi
APPENDIX G................................................................................................................ 109
PROGRAM TO CONTROL FORM 6 .................................................................................. 109
APPENDIX I ................................................................................................................. 122
PROGRAM TO CONTROL FORM 7 .................................................................................. 122
APPENDIX H................................................................................................................ 123
MODULE CONTAINING SUBPROGRAMS......................................................................... 123

vii
LIST OF FIGURES
FIGURE 1. UNSTRUCTURED APPROACH TO ACHIEVE TARGET COST ............................ 14
FIGURE 2. STRUCTURED APPROACH TO ACHIEVE TARGET COST................................. 15
FIGURE 3. PROGRAM LOGIC ........................................................................................... 28
FIGURE 4. FEEDING COST MODULE ................................................................................ 29
FIGURE 5. RAPID TRAVERSE COST MODULE.................................................................. 30
FIGURE 6. SETUP COST MODULE..................................................................................... 31
FIGURE 7. LOADING AND UNLOADING COST MODULE................................................... 32
FIGURE 8. REBRAZING COST MODULE............................................................................ 33
FIGURE 9. RESHARPENING COST MODULE ..................................................................... 34
FIGURE 10. CARBIDE INSERT COST MODULE ................................................................. 35
FIGURE 11. MATERIAL COST MODULE........................................................................... 36
FIGURE 12. REWORK COST MODULE.............................................................................. 37
FIGURE 13. INPUT SCREEN 1 ........................................................................................... 44
FIGURE 14. INPUT SCREEN 2 ............................................................................................ 45
FIGURE 15. CURRENT PROCESS OUTPUT ........................................................................ 46
FIGURE 16. COST COMPONENT CONTRIBUTION ............................................................. 47
FIGURE 17. COST COMPONENTS BEFORE AND AFTER TARGET-COSTING..................... 48
FIGURE 18. VARIATION OF UNIT COST OVER FOUR ITERATIONS.................................. 49
FIGURE 19. VALIDATION EXAMPLE 1................................................................................ 63
FIGURE 20. VALIDATION EXAMPLE 2................................................................................ 65

viii
LIST OF TABLES
TABLE 1: DATABASE TABLE FOR COLD DRAWN MATERIAL CONDITION ...................... 39
TABLE 2: CHANGE IN DATA BETWEEN BASE CASE AND ITERATION 1. .......................... 52
TABLE 3: COMPARISON OF RESULTS BETWEEN BASE CASE AND ITERATION 1. ............ 54
TABLE 4: COMPARISON OF RESULTS BETWEEN BASE CASE AND ITERATION 2. ............ 56
TABLE 5: COMPARISON OF RESULTS BETWEEN BASE CASE AND ITERATION 3. ............ 58
TABLE 6. SYSTEM VALIDATION CASE 1: 2% COST REDUCTION.................................... 62
TABLE 7. SYSTEM VALIDATION CASE 2: 2.9% COST REDUCTION................................. 64

1
CHAPTER 1
INTRODUCTION
1.1 Need For Target-costing
In an era of intensely competitive and ever changing business environment, consistent
development of low cost and high quality products meeting the functionality
requirements is a key to a company’s survival. Companies continuously look forward to
cut down costs while still producing quality products and stay ahead in the competition.
Many companies have adopted a process known as target-costing for controlling both
manufacturing and non-manufacturing costs. The following example illustrates the role
played by target-costing in redesigning and reengineering the business process of one of
the largest camera manufacturer.
In the 1980s, five Japanese companies dominated the world’s 35mm camera market:
Asahi Pentax, Canon, Minolta, Nikon and Olympus. Olympus was the third major player
with 10% market share. There were two major types of 35mm cameras: Single Lens
Reflex (SLR) and Lens Shutters (LS) or compact cameras. SLR cameras allowed the
photographer to see exactly what a picture would look like before it was taken. Because
of this feature SLR cameras rapidly gained a dominant share of the professional
photographic market. Compact cameras, as suggested by their name, were smaller than
SLR cameras. They were relatively unsophisticated and posed little challenge to the SLR
market. However as advances in electronic control systems allowed auto-focus and
automatic exposure features to be added at relatively low prices, the compact camera
began to be viewed as a serious alternative to SLR cameras. Sales of SLR cameras

2
plummeted. The shift in consumer preference to compact cameras adversely affected
Olympus in particular, because the company historically had relied heavily on SLR sales
and had failed to develop a leadership position in the compact camera arena. In the mid-
1980s, Olympus’ camera business began to lose money and by 1987 Olympus suffered
considerable losses. Top management reacted to the losses by introducing an ambitions
three-year program to “reconstruct” the camera business. At the core of this program
were three objectives: first, to recapture lost market share; second, to dramatically
improve product quality; and third, to reduce production costs via an aggressive set of
cost reduction programs. At the heart of the cost reduction program was the company’s
target-costing system (Cooper & Slagmulder 1999).
1.2 Target-costing Methodology
The first step in determining the target cost of a product is to establish the selling price
and the company’s desired profit margin for a product. The desired profit is subtracted
from the selling price to determine the product- level target cost. The product- level target
cost is then decomposed to component- level so that the purchase price of the components
can be determined. This also enables in making “make vs buy” decisions. The critical
factor that distinguishes target-costing is the intensity with which the cardinal rule is
applied: the target cost can never be exceeded (Cooper & Slagmulder 1999). By setting
the target cost in this way, the company assures itself that when the product’s target cost
and the market price are realized, the product will generate its anticipated returns. If the
actual cost exceeds its target cost, actions must be taken to reduce the product
manufacturing cost. Manufacturing costs can be reduced by taking different actions.

3
One option to achieve the target cost is to reengineer the manufacturing process.
Manufacturing is a very broad term consisting of different processes like casting, forging,
machining, bending, drawing, extrusion etc that strive to impart the desired shape to a
work-piece. The next section gives an overview about machining operation.
1.3 Target-costing In Machining
Machining is one of the major manufacturing processes. It aims to generate the shape of
a work-piece from a solid body or improve the tolerances and surface finish of a
previously formed work-piece. A very high percentage of parts used in the automotive
industry, aircraft industry, pumps, turbines etc have machined components forming a
major part of the final product. Machining cost therefore forms a significant portion of
the total cost of the final product. The machining cost depends upon the machining
process, cutting tools, labor, type of machine, material and several other factors and
hence significant cost reduction can be obtained by proper design and selection of these
parameters. Different machining operations such as turning, milling, drilling, tapping
and grinding are widely used, of which the turning operation and the cost of turning will
be the focus of this research. Subsequent sections will be dedicated to an overview of the
turning operation and its associated costs, and the application of target-costing in
machining for the turning operation
1.4 Turning
Turning is probably the most widely used of all the machining processes. It is a
continuous machining process governed by various parameters. The work-piece is held

4
in the chuck that rotates and a single point cutting tool is used to remove the metal from
the work-piece. Different parameters which govern the turning process are cutting speed,
feed depth of cut, tool life, tool angles and so on. The cost per piece in turning can be
divided into two components: machine time cost and tool cost. The total machine time
cost can be subdivided into feeding cost, rapid traverse cost, tool-changing cost,
loading/unloading cost and setup cost. The total tool cost is made up of tool depreciation
cost, tool re-sharpening cost, re-brazing cost, carbide insert cost and grinding wheel cost.
Some components of the total tool cost may be zero depending upon the type of tool
selected.
1.5 Primary Variables In Turning
The primary variables in turning operation are cutting speed, the feed and the depth of
cut. The product of these three variables results in the metal removal rate, and generally a
high metal removal rate is desirable. However, the tool costs and tool changing costs
increase as the three variables increase, so there is an optimal set of parameter levels for
the three variables. The general situation is to first select the depth of cut, then the feed
and finally the cutting speed [7]. The depth of cut is determined by the part dimensions,
machine power and also the surface finish requirements. The feed is mainly controlled by
surface finish requirements or machine power and the cutting speed is controlled by the
economical or production requirements.

5
1.5.1 Cutting Speed
The cutting speed is the rate at which the workpiece surface moves past the cutting edge
of the tool. It is expressed in surface feet per minute or meters per second and denoted by
“V” in various machining calcula tions.
1.5.2 Feed
The feed rate is defined as the displacement of the tool along the workpiece in the
direction of the feed motion. It is expressed inches per minute denoted by “F” or inches
per revolution denoted by “fr”.
1.5.3 Depth Of Cut
The depth of cut is defined as the undeformed chip thickness. It is the distance between
the surface of material formed by the previous cut to the new workpiece surface. It is
measured in inches or millimeters and is denoted by “d”.
All three variables depend upon the cutting tool material, workpiece material, cutting
fluids if used, the machining capabilities and the surface finish desired. These variables
are important for determining the machining times as well as for estimating the power
requirements.
1.6 Notations Used In The Target-costing Algorithm
a approach of tool to work-piece; in
e over-travel of tool past work-piece; in
L length of work-piece; in

6
ID initial diameter of work-piece; in
Dfin final diameter of workpiece; in
D Average diameter of workpiece; in
fr feed per revolution; in/rev
V cutting speed; sfpm
d depth of cut; in
Nl batch size
R rapid traverse rate of tool; in/min
tL time to load and unload work-piece; min
tc time to change tool; min
t0 time to setup machine tool for operation; min
ts time to re-sharpen the tool; min
tb time to re-braze the carbide tip; min
Cp purchase cost of tool shank; $
K2 number of parts machined after which the carbide tip is re-brazed.
Cw cost of grinding wheel for re-sharpening the tool;$/tool.
G labor + overhead on tool grinder; $/min
P labor + overhead on brazing machine; $/min
M labor + overhead on lathe; $/min
Cc purchase cost carbide insert; $
K3 number of parts machined after which the carbide insert is
discarded.
T tool life in minutes

7
Mp Material Price
Wt Weight of material
Mc Material cost
rwc Rework cost
ubs updated batch size
rew-rate rework rate
no_parts_reworked number of parts reworked.
1.7 Machining Cost
The machining cost comprises of costs associated with the machine time, cutting tools,
work-piece material and costs associated with rejection and rework. The total machine
time cost and the total tool costs can be divided into their respective components.
1.7.1 Feeding Cost
Feeding time is the time during which the tool actually cuts the metal. The feeding cost
is calculated as the feeding time multiplied by the labor and overhead cost.
Feeding Cost = M [(D x (L + a + e))/(3.82 x fr x V)]
1.7.2 Rapid Traverse cost
When the tool finishes the cut and clears the work-piece, it comes back rapidly to the
start point. The time taken for this motion is called rapid traverse time and the cost
associated with this time is called rapid traverse cost. It is given as:
Rapid Traverse Cost = M [(a + L + e)/R]

8
1.7.3 Loading/Unloading Cost
The time taken to load and unload the work-piece on the lathe is called loading/unloading
time. The cost associated with this time is called loading/unloading cost, given as:
Loading/Unloading Cost = M x tL
1.7.4 Setup Cost
Before actually starting the machining operation, the machine has to be setup for the
operation. Work-holding device like a chuck has to be loaded. The cutting tool has to be
held in the tool holder and the line of cutting has to be adjusted. The time required for
such activities is called setup time. The cost of setting up the machine is called setup
cost. It is a one-time cost for a batch. It is given as :
Setup Cost = M ( t0 / NL)
1.7.5 Tool Changing Cost
Whenever the tool breaks during machining a part, it has to be replaced and the new tool
has to be readjusted in the tool holder. The time required to change the tool and readjust
it in the tool holder is called tool change time. The cost associated with the tool changing
time is called tool change cost which is given as:
Tool Change Cost = M [(D x L x tc)/(3.82 x fr x V x T)]
1.7.6 Re-Sharpening Cost
This component of tool cost depends upon the number of times the tool fails. Every time
a tool fails i.e. the cutting edge becomes blunt or the cutting edge breaks, it has to be re-
9
sharpened. The cost associated with re-sharpening the tool is called the re-sharpening
cost. If carbide inserts are used, this component is zero as carbide inserts are not re-
sharpened. The re-sharpening cost is given as:
Re-sharpening Cost = [(D x L )/(3.82 x fr x V x T)] x (G x ts)
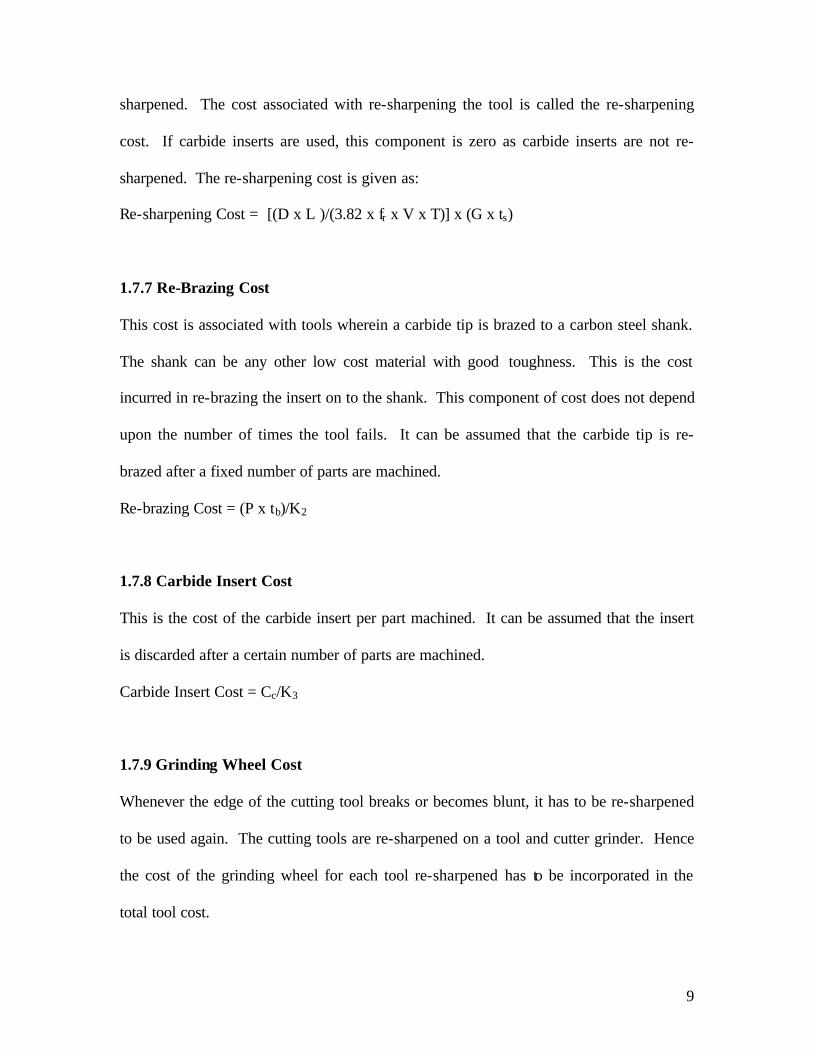
1.7.7 Re-Brazing Cost
This cost is associated with tools wherein a carbide tip is brazed to a carbon steel shank.
The shank can be any other low cost material with good toughness. This is the cost
incurred in re-brazing the insert on to the shank. This component of cost does not depend
upon the number of times the tool fails. It can be assumed that the carbide tip is re-
brazed after a fixed number of parts are machined.
Re-brazing Cost = (P x tb)/K2
1.7.8 Carbide Insert Cost
This is the cost of the carbide insert per part machined. It can be assumed that the insert
is discarded after a certain number of parts are machined.
Carbide Insert Cost = Cc/K3
1.7.9 Grinding Wheel Cost
Whenever the edge of the cutting tool breaks or becomes blunt, it has to be re-sharpened
to be used again. The cutting tools are re-sharpened on a tool and cutter grinder. Hence
the cost of the grinding wheel for each tool re-sharpened has to be incorporated in the
total tool cost.

10
Grinding Wheel Cost = [(D x L )/(3.82 x fr x V x T)] x Cw
1.7.10 Material Cost
The amount of dollars spent on the material to make a part is the material cost per part.
The material cost is given by the expression:
Mc = (Wt) x (Mp)
1.7.11 Rework Cost
After machining, parts are subjected to a quality check where some parts may be rejected
due to non-conformance of quality or design specifications. These parts are either
rejected or reworked. The cost associated with reworking the parts to meet the
specifications is called rework cost. This rework cost is spread over the entire batch.
Rework Cost = (Number of parts reworked x Rework rate) / updated batch size.
1.8 Need For Research
Since the turning cost is comprised of many cost components, there is a huge opportunity
for cost reduction through process improvement. Much of the research work done in
machining economics area is based on forward approach wherein the process parameters
are determined and cost is calculated for this set of parameters. This is the optimum cost.
If there arises a situation where the machining cost of a product has to be cut down, to
achieve a target cost so that the product realizes its desired profit, the machining process
plan has to be changed or a new process plan has to be developed. The machining
parameters, cutting tool, the raw material, labor or even the machine may have to be

11
changed and all alternatives have to be assessed to obtain the target cost. Several trials
have to be carried out with different combinations of tools, cutting parameters, labor and
machine to achieve this objective. The general procedure is as shown in Figure 1.
On the other hand if there existed a structured approach to obtain a good set of feasible
process parameters, which could satisfy the target cost, it could result in considerable
saving of time and resources. This emphasizes the need to develop a structured target-
costing model to obtain a good process plan that realizes the target cost.
Many researchers have reported cases where target-costing has been applied during the
early stages of product development. This concept has been seldom applied at later
stages of product life cycle. According to Shank & Fisher [21], target-costing seems to
be applied mostly at the early stages of product development, but the target-costing
principle can also be applied at a later stage of the product life cycle. They report a case,
which shows how a paper mill reaped the benefits by applying target-costing in
manufacturing and regained market share. Extensive literature review revealed that this
concept has not been applied in the machining arena.
A need was felt to analyze the machining operations, and hence an attempt is made in this
study to apply the concept of target-costing in machining in general and turning in
particular. The study reveals a structured approach to achieve the target cost in turning.
The turning operation was selected, as it is one of the most widely used machining
operations.
1.9 Research Objectives
1. Apply the concept of target-costing in machining.

12
2. Develop a target-costing model for turning operation to determine the machining
process parameters and obtain the target cost.
3. Verify and validate the model over a range of cutting tools, labor and machines.
4. Develop a software program to handle the complexity of the iterative process.
5. Sensitivity Analysis of the system.
1.10 Assumptions
1. Taylor’s extended tool life equation VTnfmdp = C to determine the optimum
cutting speed and feed rate for specific machining conditions.
2. Geometric programming model for determining optimum cutting speed and feed
for a given depth of cut and cutting tool.
3. Availability of organizational databases of tools, labor and machines.
4. Tools database consists of tool life constant and exponents for different tools.
5. Machine database consists of rapid traverse rates for different machines.
6. Labor database consists of setup times, loading and unloading times and tool
changing times for different categories of labor.
7. Carbide insert is discarded after a certain number of parts are machined.
8. The tool shank is discarded after a certain number of parts are machined.
1.11System Diagram
The current and the proposed system diagrams are shown in Figure 1 and Figure 2
respectively. The current system diagram shows an unstructured approach to cost
reduction. Several trials are conducted and various parameters are tweaked to reduce the

13
machining cost, based on the experience and expertise of the person handling the
problem. In such cases trade offs between two or more outcomes are often given more
importance. Since the problem solving technique is based upon the “feel” of the person,
the result obtained may not give the desired results or considerable efforts may be
required to achieve the target cost. This type of approach is common on shop floor where
the operator may increase or decrease the speed of the machine depending upon the
workload.
Figure 2 shows a structured approach to cost reduction to meet the target cost. The user
inputs the current process and the program calculates the unit cost for the process. The
user then inputs the target cost in the form of percentage reduction in the unit cost
required. The current process unit cost is compared to the target cost and if the target is
reached, the program ends. If the target cost is not achieved, the target-costing algorithm
examines different alternatives based upon their relative importance and their potential to
achieve the target cost. The programs ends after achieving the target cost or after all
alternatives are examined.

14
FIGURE 1. UNSTRUCTURED APPROACH TO ACHIEVE TARGET COST
Yes
Show results
Calculate unit cost of current process
What is percentage reduction required?
Calculate target cost
Change process parameters
Target cost
reached?
No
Recalculate unit cost
User input the current process
Stop
Yes
Achieved cost
acceptable?

15
FIGURE 2. STRUCTURED APPROACH TO ACHIEVE TARGET COST
User input current process
Calculate unit cost
What is percentage reduction required?
Calculate target cost
Call algorithm
Target cost
reached?
Show results Target cost could not be reached
All options examined?
No
No
Yes Yes
16
1.12 Conclusion
Target-costing philosophy is widely used for achieving cost reduction during the design
and development of a new product or the cost reduction of an existing product by
combining various techniques like value engineering, quality function deployment or
simple functionality analysis. This enables a company to generate more profits by
reducing the manufacturing cost or reduce the product price to increase market share.
This research aims at exploring the benefits of target-costing in turning operation.

17
CHAPTER 2
LITERATURE REVIEW
In competitive markets, prices of the product are decided by the market. Large number of
competitors can offer similar products at keen prices and consumers will expect greater
value for their money. Hence it is the job of the producer to sell their products at a price
that the market expects and is prepared to pay. To ensure the continuing survival and
growth, the company needs to make a financial return on the products sold. They must be
made at a cost that meets the market’s expectations on price and make a profit. Many
companies have turned to target-costing to achieve these objectives.
2.1 Target-costing History
Target-costing has a history of more than 40 years in Japanese industry. In 1959 Toyota
invented target-costing as it has developed in Japan. Although many manufacturers in
Japan use target-costing, the system used at Toyota Motor Corporation is the oldest and
considered by many the most technically advanced. While the idea of systematic cost
reduction had existed at Toyota since it was founded, the process was first codified in the
mid-1960s, when the firm set itself the objective of producing a $1000 car [5].
2.2 Target-costing Definitions
Target-costing (Genkakikaku in Japanese) is defined in many ways, but its goal is cost
reduction. It is a system to support the cost reduction process in the development and

18
designing phase of an entirely new model, a full model change or a minor model change
[16]. Target-costing is not actually a form of costing. Rather it is a comprehensive
program to reduce costs [12]. It is a process for ensuring that products and services are
designed such that the company can sell them cheaply and still makes a fair profit [31].
Target-costing is a strategic cost management concept for reducing cost over the entire
life cycle of a product [11]. Target-costing is a structured approach to determine the cost
at which a proposed product with specified functionality and quality must be produced in
order to generate the desired level of profitability over its life cycle at its anticipated
selling price [5]. Accordingly target-costing has multiple objectives of cost reduction,
quality assurance, timely introduction of new products into the market and product
development to attract customers.
2.3 Approach To Target-costing
Different authors present varied ways to achieve the target cost. Target-costing can be
achieved by taking various types of actions. The first category includes those actions that
achieve target costs by increasing production. The second category of actions includes
those that decrease the product’s fixed or variable costs by increasing some other
component of cost. Finally, the third category of actions includes those that reduce the
product’s variable or fixed costs [31]. Target-costing projects can pursue the routes of
total cost management, cost cutting and cost shifting to reach their goals [1].

19
2.4 Target-costing In Industry
Target-costing has been successfully applied in process industries as well as in assembly
industries. It produces much better results when combined with simultaneous
engineering. Target cost management together with simultaneous engineering helps
generate unique ideas for product development and cost reduction [26]. Nissan Motor
Corporation’s approach to total cost control entails a strategic approach, utilizing target-
costing principles [3]. At Lucent Technologies, target-costing has been applied on both
existing and new products ranging from business telephones, to wireless mini-cells and
more. The phrase “Set the target; achieve the target; maintain the target” is used at Lucent
Technologies to summarize target-costing [5]. Motor Division, Goldstar Company Ltd.,
in South Korea uses target-costing in conjunction with value engineering to obtain the
target costs of the final products [24]. Target-costing has been adopted by many
successful market leaders such as Mercedes, Kodak, Boeing, Chrysler and Goodyear [6],
[18], [12] and [26].
2.5 Machining Economics
The machining economics problem, with respect to the turning operation has been
investigated to no end. Considerable research has been done to determine the constrained
machining parameters. Taylor [28] focused on investigating the efficient range of
machining parameters through experimental studies; over a period of 26 years, he
conducted numerous experiments at Midvale Steel Company to achieve metal cutting
efficiency. Ever since, many mathematical models have been developed to determine the
optimum cutting conditions for either single pass or multi-pass turning. Extensive

20
literature review revealed that Geometric Programming [18], [29] and [30]; Lagrange
multiplier [2]; a combination of linear and geometric programming [8]; and Goal
programming [9] and [23] were some of the optimization techniques used by researchers
in this area. An analytical approach to select machining parameters for turning with
constraints was developed by Gopalakrishnan and Al-Khayyal [10] based on geometric
programming; F.P. Tan and R. C. Creese [25] developed a generalized multi-pass
machining model based on sequential linearization optimization. Variable flow stress
machining theory has been used to predict cutting forces and stress to check process
constraints depending upon which, optimum cutting conditions have been determined
[14]. A knowledge-based expert system has been developed to automate the process
planning functions and determine the machining parameters by R. V. Narang and G. W.
Fischer [17].
The main objective of these process planning systems has been either to minimize the
cost or to maximize the production rate. Some authors have also considered a
combination of three criteria simultaneously: minimum unit production cost, minimum
unit production time and minimum number of passes [15]. The objective function to
minimize the machining cost has traditionally consisted of cutting costs and tool costs.
Some researchers have also considered including the “other” costs such as in-process
inventory costs and penalty costs for not meeting the demand [21], non-productive costs
of loading, unloading and inspection [20], and costs due to loss of quality when the
quality characteristic of the part deviates from its target value [13], even though they may
not be directly related to machining economics. All these models strive to select an
optimum set of machining parameters, which are then utilized to obtain the machining
21
cost. These models follow a forward approach; by first selecting a set of machining
parameters, and then determining the machining cost.
2.6 Conclusion
In this chapter, the target-costing history and its development were discussed. Various
definitions of target-costing as proposed by different authors and industry leaders and its
applications in industry were cited. Some methods of achieving the target cost were
stated. The later part of the chapter was dedicated to the machining economics problem.
Various methods of achieving the optimum cutting conditions and machining cost as
published by several authors were mentioned.

22
CHAPTER 3
SYSTEM DEVELOPMENT
3.1 Design And Development Of The Algorithm
The algorithm developed in the present study was designed after reviewing the turning
process and the associated costs. The machining cost comprises of costs pertaining to the
machine time, cutting tools, work-piece material and costs associated with rejection and
rework. The total machine time cost and the total tool costs can be divided into their
respective components. Depending upon the cutting parameters selected, the percentage
of each cost component in the unit cost changes. Hence the reduction in the highest cost
component will have the largest effect in reducing the unit cost of the product. The
algorithm was developed based on the “Pareto Principle” where the causes of a problem
are arranged in descending order of severity and efforts are directed at resolving the cause
with highest effect first. The cost components are arranged according to their
percentages in the unit cost from highest to lowest and the cost component with highest
percentage is targeted for reduction. The algorithm takes the current process and the
current costs as a base case and then tries to make improvements in the process thereby
reducing the cost components. It is shown graphically in Figures 3 to 12. A Geometric
Programming model [9] was used to calculate optimum cutting speed, and feed for a
given depth of cut and cutting tool, thus satisfying the surface finish, and machine power
constraints.
The algorithm tries to minimize the cost components with maximum contribution to the
unit cost in a sequential order after arranging the cost components in decreasing order and
23
the component with maximum contribution is targeted for reduction. The parameters
involved in the calculation of that cost component are replaced with values either from
the database or from the user input. The unit cost is calculated and compared with the
target cost. If the target cost is reached, the algorithm stops and shows the results.
Otherwise, the process is repeated until all the combinations from the database are
exhausted or there is no scope for any further improvements.
Different cutting tools are analyzed for reduction in feeding cost and different machines
are examined to reduce the rapid traverse cost. If these combinations do not result in
satisfying the target cost, the user is prompted to improve some other parameters based
on which the unit cost is recalculated.
3.2 Geometric Programming Model Background
The geometric programming model developed by Gopalakrishnan and Al-Khayyal was
used in the development of this algorithm. The setting of the machine parameters in
turning operation determines the cost of the machining process. The rate and cost of
production depend on the cutting speed, feed and the depth of cut. The depth of cut is
usually fixed for a particular pass in turning operation and in this case the cutting speed
and the feed are the only variables in the minimization of the production cost or the
maximization of production rate. The major constraints affecting the turning process are
related to the required surface finish of the product being machined, and the maximum
power, which the machine tool can provide for the operation. The geometric
programming model developed by Gopalakrishnan and Al-Khayyal uses Taylor’s
24
extended tool life equation, VTnfmdp = C to determine the costs due to losses in tool life,
and due to the time incurred in removing a defective tool and replacing it.
In the above equation, T is the tool life in minutes, V is the cutting speed in
inches/minute, f is the feed in inches/rev, and m,n,p,C are constants based on the tool
material and workpiece material.
3.3 Geometric Programming Model Nomenclature
HPmax maximum horse power available
Sfmax surface finish acceptable
Cm coefficient in machine power constraint
Cs coefficient in surface finish constraint
n,m,p coefficients in tool life equation
b,c,e exponents in machine power constraint
g,h,i exponents in surface finish constraint
3.4 The Algorithm
The algorithm shown in a graphical format in figure 3 is described in the following seven
steps.
1. Read the current process and calculate current unit cost.
2. Calculate the target cost based on the percentage reduction required.
3. Select the first cutting tool from the database and calculate the unit cost. If the target
cost is reached, then go to step 6. If the target cost is not reached and the new unit
cost is less than the current unit cost, then retain the new cutting tool, else reject it.

25
Select the next cutting tool and repeat the process till target cost is reached or all
cutting tools are explored.
4. Sort the cost components in descending order. If the highest cost component is rapid
traverse cost, then chose the first machine from the database and calculate the new
unit cost. If the target cost is reached, then go to step 6. If the target cost is not
reached and the new unit cost is less than the current unit cost, then accept the new
machine else reject it. Repeat the process till target cost is reached or all machines are
explored.
5. If the highest cost component in step 4 is not rapid traverse cost, then prompt the user
for improvements. If the target cost is reached, then go to step 6, else prompt user for
further improvements till all options are explored.
6. If target cost is reached then print, “ Target cost achieved” else print, “Target cost
could not be achieved”.
7. Show the details of the process.
Figure 3 shows the program logic, which epitomizes the algorithm. The program acquires
the current process details from the user and calculates the unit cost of machining. The
user is then prompted to enter a target percentage reduction based upon which the target
cost is calculated. The program then selects the highest cost component for cost reduction
and prompts the user to enter the percentage improvement that could be achieved in the
factors affecting that cost component, so that the unit cost of the product can be reduced
to meet the target cost. The user can enter “0” if improvements are practically infeasible.
The unit machining cost is recalculated and compared to the target cost. The program
stops further calculations if the target cost is reached; else the next highest cost

26
component is selected for cost reduction and the process is repeated. After the target-
costing process is completed the program enables the user to view the information in
graphical as well as tabular format. The graphical format shows the user, the number of
iterations required to achieve the target cost and how the cost varied between iterations.
The tabular format gives the details of the changes that occurred between iterations.
3.5 Scope Of The Target-costing Program
The program is interactive in nature and elicits responses from the user. It presumes that
the user has knowledge about the process and knows the feasibility of performing the
improvements suggested to achieve the target cost. The program arranges the cost
components sequentially from highest to lowest and prompts the user to improve upon
the factors affecting these cost components. If improvements cannot be made for some
factors, the user can enter “0” when prompted. The user also has to understand that the
improvements suggested by the program involve implementation costs to bring about
necessary process changes. Deciding whether the cost component can be reduced or not
and its implementation cost depends upon the user and is out of scope of this program
and this research work.
When the target-costing program prompts the user to enter percentage by which the setup
time can be reduced, it assumes that the user knows if and how the reduction can be
made, what changes are required in the process to bring about this improvement and has a
fair idea about the cost involved in performing the improvement. The user has to perform
a cost benefit analysis about the improvement in setup time and the monetary gain
achieved. This program prioritizes the cost components and provides the user with

27
opportunities to direct resources towards those cost components that have a high effect on
the unit cost of the product. The program does not suggest what is required to implement
the changes in the process parameters and their implementation costs as this is outside the
scope of this research work.
The program comprises of a main program and consists of modules for each cost
component, which will be discussed in the upcoming pages.

28
FIGURE 3. PROGRAM LOGIC
A
Analyze the highest cost component Target cost < unit cost
All components examined?
Show Results
Target cost could not be achieved
Analyze next cost component
Yes
Yes
No
No
User input current process
Calculate current process unit cost
Prompt user for percentage reduction
Calculate the target cost
29
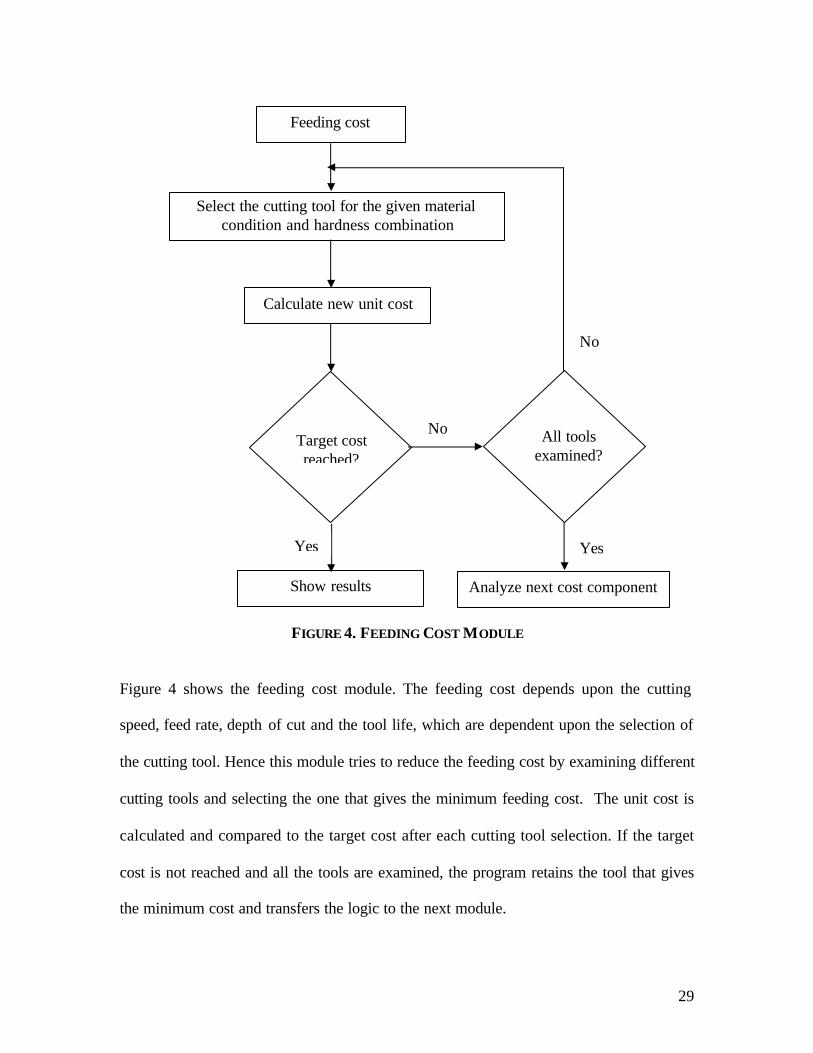
FIGURE 4. FEEDING COST MODULE
Figure 4 shows the feeding cost module. The feeding cost depends upon the cutting
speed, feed rate, depth of cut and the tool life, which are dependent upon the selection of
the cutting tool. Hence this module tries to reduce the feeding cost by examining different
cutting tools and selecting the one that gives the minimum feeding cost. The unit cost is
calculated and compared to the target cost after each cutting tool selection. If the target
cost is not reached and all the tools are examined, the program retains the tool that gives
the minimum cost and transfers the logic to the next module.
Select the cutting tool for the given material condition and hardness combination
Calculate new unit cost
Show results
Target cost reached?
All tools examined?
Feeding cost
Yes Yes
No
Analyze next cost component
No

30
FIGURE 5. RAPID TRAVERSE COST MODULE
The rapid traverse cost module is shown in figure 5. The rapid traverse rate is dependent
upon the machine and therefore this module tries to reduce the rapid traverse cost by
examining different machines and selecting the one that gives the minimum rapid
traverse cost. The unit cost is calculated and compared to the target cost after each
iteration till the target cost is reached or till all machines are examined. If the target cost
is not reached and all the machines are examined, the program retains the machine that
gives the minimum cost and transfers the logic to the next module.
Select the machines available in sequential order
Calculate new unit cost
Show results
Target cost reached?
All machines examined?
Rapid traverse cost
Yes Yes
No
Analyze next cost component
No

31
FIGURE 6. SETUP COST MODULE
Setup cost
Enter percentage reduction in setup time
Calculate new unit cost
Target cost
reached?
Show results
No
Yes
Analyze next cost component

32
FIGURE 7. LOADING AND UNLOADING COST MODULE
Loading and unloading cost
Enter percentage reduction in loading/unloading time
Calculate new unit cost
Target cost
reached?
Show results
No
Yes
Analyze next cost component
33
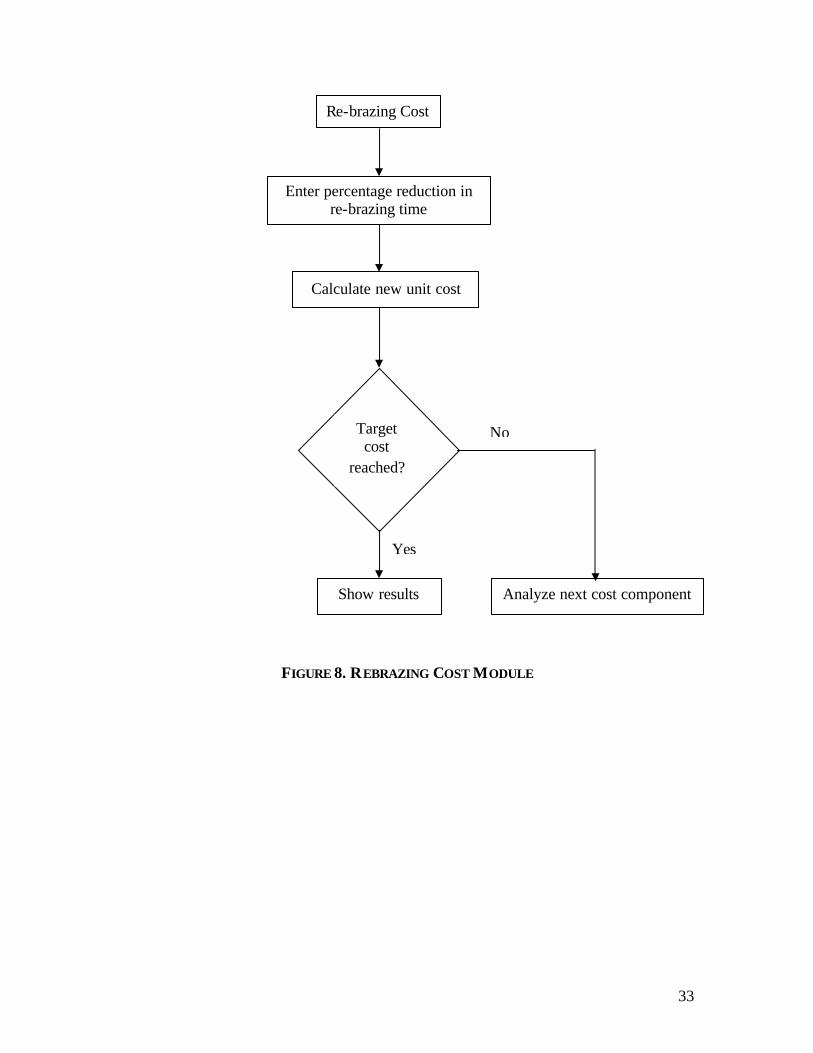
FIGURE 8. REBRAZING COST MODULE
Analyze next cost component
Re-brazing Cost
Enter percentage reduction in re-brazing time
Calculate new unit cost
Target cost
reached?
Show results
No
Yes

34
FIGURE 9. RESHARPENING COST MODULE
Re-sharpening Cost
Enter percentage reduction in re-sharpening time
Calculate new unit cost
Target cost
reached?
Show results
No
Yes
Analyze next cost component

35
FIGURE 10. CARBIDE INSERT COST MODULE
Carbide insert cost
Enter percentage reduction in carbide insert price
Calculate new unit cost
Target cost
reached?
Show results
Yes
Analyze next cost component

36
FIGURE 11. MATERIAL COST MODULE
Material cost
Enter percentage reduction in material price
Calculate new unit cost
Target cost
reached?
Show results
Yes
No
Analyze next cost component

37
FIGURE 12. REWORK COST MODULE
Rework cost
Enter percentage reduction in Rework rate
Calculate new unit cost
Target cost
reached?
Show results
No
Yes
Enter percentage reduction in percentage rework
Target cost
reached?
Target cost
reached?
Enter percentage reduction in rejection rate Show results
Show results
No
No
Yes
Yes
Analyze next cost component

38
3.6 Code Development
The user interface was developed using Microsoft Visual Basic version 6.0. Visual Basic
is an object oriented programming language, which is used to design the user interface.
The various objects are forms, textboxes, list-boxes, labels, grids and many others. Forms
are the basic objects or the background on which various controls such as text boxes,
buttons, list-boxes, labels etc are arranged. A source code or a program to perform
specific tasks then ties up these controls. The tasks may be simply reading an input or
performing a calculation or showing an output. The user interface consists 7 forms and a
module. A module is a program space consisting of subprograms, subroutines and
variable declarations that are called by the main programs repeatedly. The input screen
shown in figure 13 allows the user to enter the data for the current process. This data
consists of the design requirements for the product, the machining parameters and
constraints on machine power and surface finish. The program checks if all the data was
entered and prompts the user if any data fields are left blank. The second input screen
shown in figure 14 prompts the user to select the cutting tool and its related parameters
for the current process. The program then calculates the unit cost and the current process
output screen in figure 15 details the cost components. It also provides the user with an
option to enter the percentage reduction required in the unit cost. This percentage
reduction is required to calculate the target cost. After determining the target cost, the
cost component contribution screen in Figure 16 arranges the cost components of the
current process according to their contribution to the unit cost starting from highest to
lowest. It also shows the percentage contribution of each cost component. After clicking
on the “Achieve Target Cost” button, the algorithm is called which prompts the user for

39
improvements in the current process. A note is displayed suggesting the user if the target
cost was achieved or not. Figure 17 shows a comparison between the cost components
before and after the target-costing process. The program also allows the user to see the
variation of the unit cost for different iterations in a graphical format as shown in figure
18.
3.7 Database Design
The information pertaining to different work materials, cutting tools, machines and labor
are stored in a database. The database, which is designed in Microsoft Access, forms the
back end and the user interface forms the front end. The database is in the form of tables
and the tables consist of several fields and records. The columns are called fields and the
rows are referred to as records. A table consisting of several machines will have a record
for each machine and each record will have several fields. Each field may represent a
particular characteristic for a machine.
The database in this model consists of several tables for different material conditions.
Table 1shows data for a cold drawn material condition.
Table 1: Database table for Cold Drawn Material Condition
ID Condition Hardness C m n p Type Cost dmax G Cw ts Lrb tb k2 k311 Cold
Drawn 175 - 200 1200.25 0.290.35 HSS 2 0.1 30 0.5 15 0 0 0 0
12 Cold Drawn
175 - 200 1400.27 0.310.4 Carbide tip
3 0.3 30 0.5 15 30 15 50 0
13 Cold Drawn
175 - 200 1600.29 0.350.43 Carbide insert
4 0.5 0 0 0 0 0 0 4

40
The table consists the hardness of the material, different tools that can be used for
machining this material, tool life coefficient and the tool life exponents for each tool and
material combination. The table consists of other data like cost of the tool, labor and
overhead on the tool grinder, cost of grinding wheel for re-sharpening the tool, tool re-
sharpening time. A brazed tip carbide tool also has other data like re-brazing time and
labor and overhead for brazing the carbide tip. The database consists of similar tables for
different material conditions.
The database also consists of a machine table which contains the type of machine, the
labor and overhead for each machine, the rapid traverse rate, maximum horse power
available, exponents and coefficients in machine power and surface finish constraint and
the tool handling times for each machine.
The database can be easily updated by inserting new information in the tables. The
information entered in the database will have a significant effect on the results. Hence the
database should be updated with realistic values in order to prevent inaccurate results.
3.8 Conclusion
The design and development of the target-costing algorithm was presented in this
chapter. The steps involved in developing the algorithm were discussed and an analogy
was made to the Pareto principle. The algorithm and the programming logic were
elucidated in detail with the help of flowcharts. The later part of the chapter was
dedicated to the development of the user interface using Microsoft Visual Basic
programming language and the database design in Microsoft Access.

41
CHAPTER 4
SYSTEM BEHAVIOR ANALYSIS
This chapter analyses the dynamics of the target-costing model and its application to
turning process. The turning process consists of numerous parameters that are interrelated
and the turning cost depends upon the selection of these parameters. The turning cost is
made up of components like machine time cost, tool cost and material cost. The selection
of process parameters affects the cost components and hence the turning cost. Since the
process parameters are interdependent and their selection is a complex process, they have
to be selected such that they meet the target cost. The target-costing model uses a
structured approach to select these process parameters to comply with the target cost. The
program is very interactive and elicits responses from the user. The path taken to achieve
the target cost depends upon the behavior of all the parameters involved in the machining
process. The system behavior will be explained with the help of an example.
The values of the tool life exponents, exponents in surface finish and horsepower
constraint, and other coefficients used to verify the model were taken from the examples
published by Gopalakrishnan et al.
The target-costing program starts with an input screen. The input parameters are
categorized into four types. The first category is design parameters, which consist data
like initial diameter, final diameter, work material, batch size, material condition and
hardness, acceptable surface finish and the material price. These parameters are design
requirements except the batch size and the material price, and hence cannot be changed.
The batch size and the material price though are not design requirements and hence can
be varied to achieve cost improvements. The second type of input requirement is

42
machining parameters. This consists of machine related data like labor and overhead rate,
tool-handling times, rejection rate and rapid traverse rate of the machine. These
parameters are machine dependent and hence vary with the type of machine. The third
category of input data consists of exponents and coefficients of the geometric
programming model. Since the geometric programming model forms the part of the
target-costing model, these parameters are required to be furnished by the user. The last
category of input data is related to the cutting tools. The target-costing program consists
of a tools base, which has three different types of cutting tools: high speed steel (HSS),
brazed carbide tip and carbide insert. HSS is the lowest quality cutting tool in comparison
to the other two. The cutting speeds at which it can be used are lower than the tools with
carbide tip or carbide insert. It possesses lower hot hardness and hence cannot be used for
machining applications where very high heat is generated. But its main advantage is low
cost and hence can be used for low cost machining applications. The cutting edge can be
ground repeatedly and hence it may prove economical in some cases. The brazed carbide
tip cutting tool consists of a carbide tip that is brazed to a mild steel shank. This type of
tool can achieve higher cutting speeds and the cutting edge can be machined to regain its
sharpness. The carbide insert cutting tool consists of a carbide insert that is screwed in
place on a tool holder. The carbide insert has more than one cutting edge and generally
has a higher tool life compared to HSS or a brazed tip tool. When one edge breaks, the
orientation of the insert is changed to expose a fresh cutting edge. It can be used at very
high cutting speeds and possesses good hot hardness.
The first input screen is shown in Figure 13. This is the first step in the target-costing
model. The input data is as shown.

43
Work-piece Parameters:
Initial Diameter 6 inches
Final Diameter 5 inches
Batch Size 250
Material Condition Hot Rolled or Annealed
Hardness 100 – 125 BHn
Machining Parameters:
d 0.1 inches
M 60 $/hr
t0 25 minutes
tch 5 minutes
tl 1 minute
R 60 inches/min
Rejection 10 %
Rework 10 %
Rework Rate 30 $/hr

44
FIGURE 13. INPUT SCREEN 1
As described in the previous section, this screen has three parts. The user is required to
enter all the information in the text boxes. The material condition and hardness can be
selected from the drop down list. The user is also required to enter information related to
the maximum horsepower available and the exponents and coefficients in the machine
power and surface finish constraint. If the information is incomplete, the program gives a
message on the screen that a particular data point is missing and instructs the user to enter
data in that particular text box. Once all the information is complete, the user clicks on
the “next” button to invoke the second input screen, which is shown in Figure 14.

45
FIGURE 14. INPUT SCREEN 2
The second step in the target-costing process is tool selection. The second input screen
allows the user to enter information about the cutting tool being used for the current
process. The user selects a cutting tool from the three options and enters values for
exponents in tool life equation, cost of the cutting tool and tool life constant. If the
selected cutting tool is HSS then the user is prompted for labor and overhead on the tool
grinder. The user also has to enter the labor and overhead for brazing if the cutting tool
selected is a brazed carbide tip.
The tool data is as shown.
Cutting Tool Carbide Insert

46
Cost of Tool 3 $/insert
Number of edges 4
C (Tool life constant) 250
After entering all the information the user then clicks on “calculate” button. This screen
invokes the third screen, which is shown in Figure 15. This screen details the cost
components in turning operation. All the cost components discussed in chapter 1 are
displayed on the screen, which enables the user to see the breakdown of the total cost of
turning operation. The screen also shows the unit cost for turning that product. The model
uses the equations shown in chapter 1 to calculate the cost components and the unit cost.
At the bottom of the screen the program asks the user to enter the target cost in the form
of percentage reduction in the unit cost. This percentage has to be realistic and the user
has to have fair knowledge of the amount of cost reduction that is feasible with the
available machines, labor and tools.
FIGURE 15. CURRENT PROCESS OUTPUT

47
After entering the percentage reduction required, the user then clicks on the “Next”
button to bring up the screen shown in Figure 16. This screen shows the contribution of
different cost components towards the unit cost and also the target cost. This user can
recognize those cost component s that have a major effect on the unit cost and hence
identify those process parameters that are critical. The target-costing algorithm is
designed in such a way that cost components with higher contributions are targeted first
for improvement. The user clicks on “Achieve Target Cost” button to invoke the target-
costing algorithm, which tries to achieve a unit cost that is less than or equal to this target
cost. The program identifies the critical parameters for improvement and prompts the
user to enter a percentage by which that particular parameter can be improved. The
program continues till the target cost is reached or all selected parameters are examined.
FIGURE 16. COST COMPONENT CONTRIBUTION

48
A message is displayed on the screen informing the user if the algorithm was successful
in achieving the target cost. The user then clicks the “Next” button to invoke the screen
shown in Figure 17. This screen shows a comparison between the cost components, the
unit cost and the total cost, before and after the target costing process. The unit turning
cost for the base case was $22.58 and a cost reduction of 10% was desired in this unit
cost. Based upon this reduction the target cost was calculated to be $20.32.
FIGURE 17. COST COMPONENTS BEFORE AND AFTER TARGET-COSTING
The unit cost after the target-costing process was $19.93, which was less than the target
cost of $20.32. This cost reduction was achieved after four iterations as shown in Figure

49
18. The steps described in section 3.1 are applied sequentially to achieve the target cost.
The following section shows the calculations for each iteration.
FIGURE 18. VARIATION OF UNIT COST OVER FOUR ITERATIONS
4.1 Base Case
The cutting speed and the feed per revolution were calculated to be
V = 878.97 feet per minute
fr = 0.0014 inches per revolution
Tool Life T = C / (frm dp v)1/n
= 250 / (0.0014 0.25 0.10.3 878.87)1/0.19
= 60.35 minutes.
Number of passes = ((ID – Dfin)/2) / depth of cut
= ((6 – 5) / 2) / 0.1

50
= 5.
Rapid Traverse Cost = M [(a + L + e)/R]
= 60 [(0.3 + 8 + 0.3) / 60]
= $ 0.72
Feeding Cost = M [(D x (L + a + e))/(3.82 x fr x V)]
= 60 [(D x (8 + 0.3 + 0.3)) / 3.82 x 0.0014 x 878.87)]
Since D is average diameter, its value changes after every pass. The feeding cost was
calculated for each pass and the total feeding cost was $ 4.97.
Loading/Unloading Cost = M x tL
= (60x 1)/60
= $1
Setup Cost = M (t0 / NL)
= 60 (25 / 60)/ 250
= $0.1
Tool Change Cost = M [(ID x L x tc)/(3.82 x fr x V x T/60)]
= 60 [(6 x 8 x 5)/(3.82 x 0.0014 x 878.87 x 60.35/60)]
= $0.009
Re-sharpening Cost = [(ID x L)/(3.82 x fr x V x T)] x (G x ts)
As the cutting tool was carbide insert, there was no re-sharpening cost as the carbide
insert cannot be re-sharpened. The insert has to be indexed if it breaks.
Re-brazing Cost = (P x tb)/K2
Since the cutting tool for the base case was a carbide insert, there was no re-brazing cost,
as a carbide insert cutting tool cannot be brazed.

51
Carbide Insert Cost = (Cc/T) x total cutting time
= (3 / 60.35) x 4.97
= $0.25
Grinding Wheel Cost = [(D x L)/(3.82 x fr x V x T)] x Cw
The grinding wheel cost was zero as the tool was carbide insert.
Material Cost = (Wt) x (Mp)
= 0.029 x 440
= $12.80
Rework Cost = (Number of parts reworked x Rework rate) / updated batch size
= (2.9 x 30)/279
= $0.31
Total Machine Time Cost = Feeding Cost + Rapid Traverse Cost + Setup Cost +
Loading/Unloading Cost + Tool Changing Cost
= 4.97 + 0.72 + 0.1 + 1 + 0.009
= $6.87
Total Tool Cost = Carbide Insert Cost + Re-brazing Cost + Re-sharpening
Cost + Grinding Wheel Cost
= 0.25 + 0.00 + 0.00 + 0.00
= $0.25
Total Cost = ubs x (Total Machine Time Cost + Total Tool Cost +
Material Cost + Rework Cost)
= 279 x (6.87 + 0.25 + 12.80 + 0.31)
= $5643.88

52
Unit Cost = Total Cost / Nl
= 5643 / 250
= $22.58
A 10% reduction was desired in the unit cost based upon which the target cost was
calculated to be $20.32.
4.2 Iteration 1: HSS Cutting Tool
The cutting tool was changed from carbide insert to HSS. The notion behind this change
is that the cost of HSS cutting tool is less than carbide insert. The following parameters
changed from the base case.
Table 2: Change in Data between Base Case and Iteration 1.
Parameter Base Case Iteration 1
Cutting Tool Carbide Insert HSS
Cost Of Cutting Tool $3.00 $2.00
C 250 150
N 0.19 0.29
P 0.30 0.35
As seen from the table above the cost of HSS cutting tool was less than carbide insert
cutting tool. Also the tool life coefficient was significantly lower than that of the carbide
insert. The results obtained after the cutting tool was changed from carbide insert to HSS
are shown in Table 3 and are compared to the results of the base case. The unit cost
increased by 49% from $22.58 to $33.71. The increase in unit cost was due to the

53
increased machine time cost and tool cost. The rework cost did not change because the
rework rate and the rejection rate remained constant. The number of parts rejected and
the number of parts reworked also did not change resulting in the updated batch size of
279, which was equal to the updated batch size in the base case.
The amount of material required is influenced by the updated batch size. The updated
batch size depends upon the rework and rejection rate and hence 279 parts have to be
machined in order to produce 250 acceptable parts. Since the updated batch size did not
change the material cost remained constant at $12.80.
The unit cost increased by 49% even though the cost of cutting tool decreased by
33.33%. This signifies that by reducing only the cost of the cutting tool, the unit cost of
machining cannot be reduced. There are other parameters involved in the process that
have to be analyzed. Nevertheless the selection of the right cutting tool is still an
important step in obtaining the desired machining cost. HSS was rejected and the next
cutting tool, brazed carbide tip was selected for analysis in the second iteration, the
results of which are shown in the next section.

54
Table 3: Comparison of Results between Base Case and Iteration 1.
Parameter Base: Carbide Insert Iteration 1: HSS Cutting Tool
D 0.1 inches 0.1 inches
V 878.97 feet per minute 652.36 feet per minute
fr 0.0014 inches per rev. 0.0084 inches per rev.
Number Of Passes 5 5
Updated Batch Size 279 279
Feeding Time 4.97 minutes 10.51 minutes
Feeding Cost $4.97 $10.51
Rapid Traverse Cost $0.72 $0.72
Setup Cost $0.10 $0.10
Load/Unload Cost $1.00 $1.00
Tool Changing Cost $0.009 $1.84
Total Machine Time Cost $6.87 $14.16
Re-sharpening Cost $0.00 $2.76
Re-brazing Cost $0.00 $0.00
Carbide Insert Cost $0.25 $0.00
Grinding Wheel Cost $0.00 $0.18
Total Tool Cost $0.25 $2.94
Material Cost $12.80 $12.80
Rework Cost $0.31 $0.31
Total Cost $5643.88 $8428.59
Unit Cost $22.58 $33.71

55
4.3 Iteration 2: Brazed Carbide Tip Cutting Tool
The target-costing algorithm was not able to achieve the target cost of $20.32 by
changing the cutting tool from carbide insert to HSS. Instead the unit cost increased by
49% from $22.58 to $33.71 due to which HSS was rejected and the original carbide insert
was retained. The algorithm is designed such that it analyzes all the available cutting
tools sequentially. Hence the next cutting tool examined was a brazed carbide tip tool.
The results obtained with brazed carbide tip cutting tool are shown in Table 4 and are
compared to the initial carbide insert.
As can be seen from Table 4, the brazed carbide tip cutting tool yielded a unit turning
cost of $34.42, which was 52.4% more than the unit cost of current process using a
carbide insert cutting tool. This increase was more than the increase in unit cost using
HSS cutting tool. By comparing to iteration 1 where HSS cutting tool was used, it can be
seen that the total machine time cost decreased by $0.78 but the total tool cost increased
by $1.41 resulting in a net increase of $0.63. This increase in cost applies to 279 parts.
Hence the effective unit cost for a batch size of 250 increased by $0.71 when the cutting
tool was changed from HSS to brazed carbide tip. The brazed carbide tip cutting tool was
rejected, as it was not successful in lowering the unit cost below $22.58. The algorithm
then analyzes the next cutting tool in the database.

56
Table 4: Comparison of Results between Base Case and Iteration 2.
Parameter Base: Carbide Insert Iteration 2: Brazed Carbide Tip
D 0.1 inches 0.3 inches
V 878.97 feet per minute 617.51 feet per minute
fr 0.0014 inches per rev. 0.0059 inches per rev.
Number Of Passes 5 3
Updated Batch Size 279 279
Feeding Time 4.97 minutes 9.17 minutes
Feeding Cost $4.97 $9.17
Rapid Traverse Cost $0.72 $0.43
Setup Cost $0.10 $0.10
Load/Unload Cost $1.00 $1.00
Tool Changing Cost $0.009 $2.68
Total Machine Time Cost $6.87 $13.38
Re-sharpening Cost $0.00 $4.02
Re-brazing Cost $0.00 $0.08
Carbide Insert Cost $0.25 $0.00
Grinding Wheel Cost $0.00 $0.27
Total Tool Cost $0.25 $4.35
Material Cost $12.80 $12.80
Rework Cost $0.31 $0.31
Total Cost $5643.88 $8605.39
Unit Cost $22.58 $34.42

57
4.4 Iteration 3: Carbide Insert II
The database consists of three types of cutting tools with different characteristics and
costs. The target-costing algorithm analyzed the first two cutting tools and rejected them,
as they were not successful in achieving the target cost. The current process unit cost was
$22.58 and the target cost was $20.32. After rejecting HSS and brazed carbide tip cutting
tools, the target-costing algorithm selected carbide insert type cutting tool. The carbide
insert cutting tool selected was different from the original carbide insert and hence it is
referred as carbide insert II. The results of this iteration are shown in Table 5.
The application of carbide insert II cutting tool resulted in unit turning cost of $21.36,
which was lower than the current process unit cost by $1.22. This reduction in the unit
cost was mainly due to the decrease in feeding cost by 32% over the current process
feeding cost even though the tool changing cost increased. It can be seen from the Table
5 that the cutting speed decreased and the feed per revolution increased. Hence each pass
is completed at a faster rate. The number of passes were reduced from 5 to 1 because
carbide insert II achieved a higher depth of cut of 0.5 inches compared to 0.1 inches that
the original carbide insert achieved. The number of passes also influences the rapid
traverse cost as the machine had to travel rapidly only once compared to 5 times in the
current process. Since the unit cost was less than the current process unit cost, the target-
costing algorithm replaced the original carbide insert cutting tool by the carbide insert II
cutting tool. But the target cost o $20.32 or less was still not achieved. Since all the
cutting tools were examined, the target-costing algorithm focused on the parameters
influencing the highest cost component.
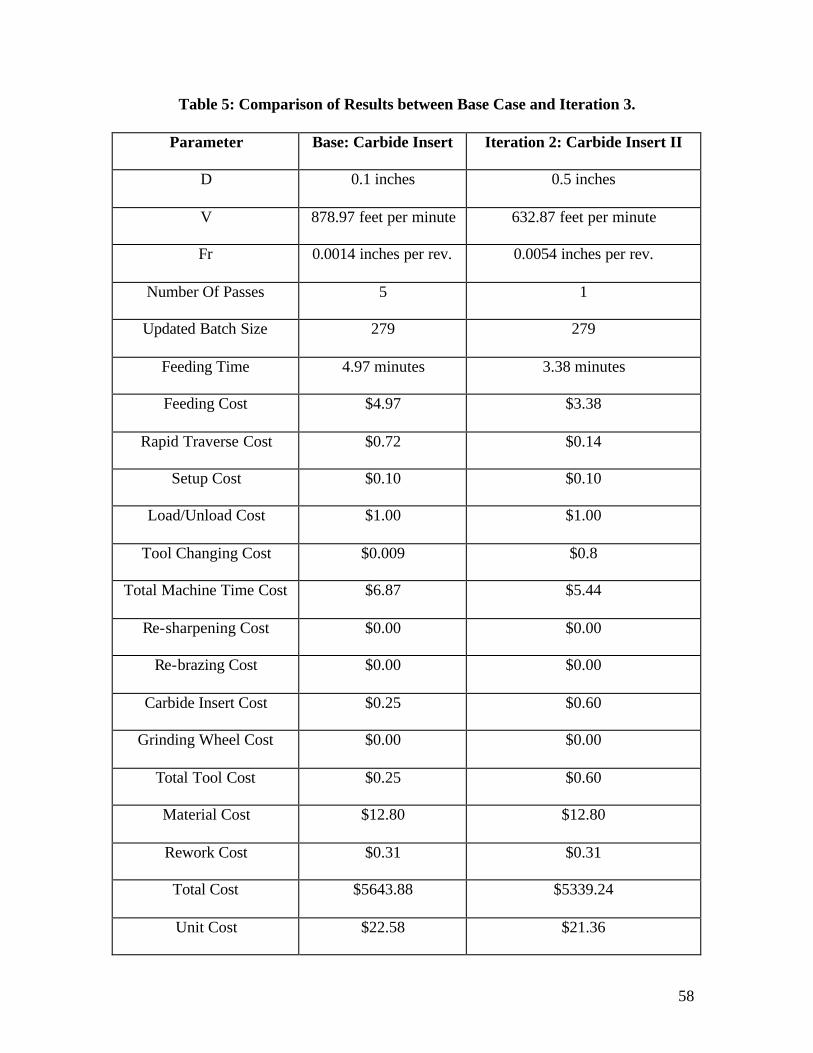
58
Table 5: Comparison of Results between Base Case and Iteration 3.
Parameter Base: Carbide Insert Iteration 2: Carbide Insert II
D 0.1 inches 0.5 inches
V 878.97 feet per minute 632.87 feet per minute
Fr 0.0014 inches per rev. 0.0054 inches per rev.
Number Of Passes 5 1
Updated Batch Size 279 279
Feeding Time 4.97 minutes 3.38 minutes
Feeding Cost $4.97 $3.38
Rapid Traverse Cost $0.72 $0.14
Setup Cost $0.10 $0.10
Load/Unload Cost $1.00 $1.00
Tool Changing Cost $0.009 $0.8
Total Machine Time Cost $6.87 $5.44
Re-sharpening Cost $0.00 $0.00
Re-brazing Cost $0.00 $0.00
Carbide Insert Cost $0.25 $0.60
Grinding Wheel Cost $0.00 $0.00
Total Tool Cost $0.25 $0.60
Material Cost $12.80 $12.80
Rework Cost $0.31 $0.31
Total Cost $5643.88 $5339.24
Unit Cost $22.58 $21.36

59
4.5 Iteration 4: Material Cost Reduction
The material cost of $12.80 was 56.67% of the current process unit cost and was the
highest cost component in the unit cost. The basis of the target-costing algorithm is to
focus on the cost components that have high contribution towards the unit cost starting
from highest to lowest. The parameters that affect the material cost are material price and
weight of material. The rework and rejection rate were not changed and hence 279 parts
were required to be machined to achieve a batch of 250 acceptable parts. As a result the
weight of material remained constant. The only parameter affecting the material cost was
material price. The material price was reduced by 10%. The total machine time cost and
the tool cost did not change, as the material price did not affect those cost components.
The material cost decreased by 10% from $12.80 to $11.52 resulting in a unit cost of
$19.93 which was lower than the target cost of $20.32. Since the target cost was reached,
the algorithm did not resume any further iterations.
4.6 Conclusion
The target-costing program is very interactive and depends upon the type of response
given by the user. All cost components are sequentially analyzed for reduction from
highest to lowest after all cutting tools in the database are examined. When the program
prompts the user to enter a percentage by which a certain factor can be reduced, the user
should enter a percentage that could be achieved practically. The algorithm is based on
the assumption that the user has good knowledge of the turning process. The information
provided to the program influences its behavior. A sensitivity analysis was performed
over five parameters and the results are shown in the appendix A.

60
CHAPTER 5
SYSTEM VALIDATION
The system validation forms the final part of this research work. It was deemed necessary
to validate the model to test its suitability to practical conditions. The data was obtained
from De Vall Brothers Inc. in Morgantown, WV. The results are discussed in the
upcoming sections.
5.1 Data
Work-piece Parameters:
Part Thermowell Pin
Initial Diameter 2 inches
Final Diameter 1.5 inches
Length 8 inches
Batch Size 4
Material 4140 Heat Treated
Hardness 25 – 250 BHn
Material Price $1800/ton
Machining Parameters:
d 0.12 inches
M 60 $/hr
t0 15 minutes
tch 0.11 minutes
tl 0.25 minute

61
R 120 inches/min
Rejection 0 %
Rework 0 %
Rework Rate 0 $/hr
Cutting Tool Carbide Insert
Cost of Tool 9 $/insert
Number of edges 6
C (Tool life constant) 250
Machine Parameters:
Machine Capacity 20 HP
Surface Finish 32 micro inches
The manufacturing cost per part determined by the target-costing model was $14.40,
which was very close to the actual manufacturing cost of $15 per part. The higher actual
manufacturing cost is due to the chamfering operation performed on the ends of the pin,
which is not considered in the model. The tool life data and the different exponents in the
horsepower and surface finish constraint were not available and hence the data discussed
in the previous sections was used. Several trials were conducted to determine the
percentage cost reduction that could be achieved by the model. The model successfully
achieved a target cost of $14.11, which was a cost reduction of 2% and $13.98 or a cost
reduction of 2.9%.

62
5.2 Case 1: 2% Cost Reduction
The details for this case are as follows:
Current Process Unit Cost $14.40
Desired Cost Reduction 2%
Target Cost $14.11
Achieved Cost $14.04
Iterations 5
The iterations are explained in table 43.
Table 6. System Validation Case 1: 2% Cost Reduction
It. No. Unit Cost Achieved Description
1 14.40 21.85 Cutting tool was changed from carbide insert to hss.
2 14.40 22.46 Hss was replaced by carbide tip cutting tool.
3 14.40 14.48 Carbide tip was replaced by carbide insert.
4 14.40 14.19 Purchase price of material was reduced by 3%.
5 14.19 14.04 Setup time was reduced by 3%.
The material cost contributed 40% towards the unit cost and the setup cost was the
second highest with 26% contribution. The material price was $1800/ton and hence was
the highest cost component. The setup time was 15 minutes, which was low, compared to
the hypothetical examples, but was absorbed by a very small batch size compared to the
batch size of 250 in the previous examples. This emphasizes the necessity of having a
large batch size to offset the effect of high setup time. The target-costing process is
shown in Figure 28. All the tools were examined and carbide insert was finally selected.

63
A further reduction in material price and setup time by 3% each was required to achieve
the required target cost.
FIGURE 19. VALIDATION EXAMPLE 1
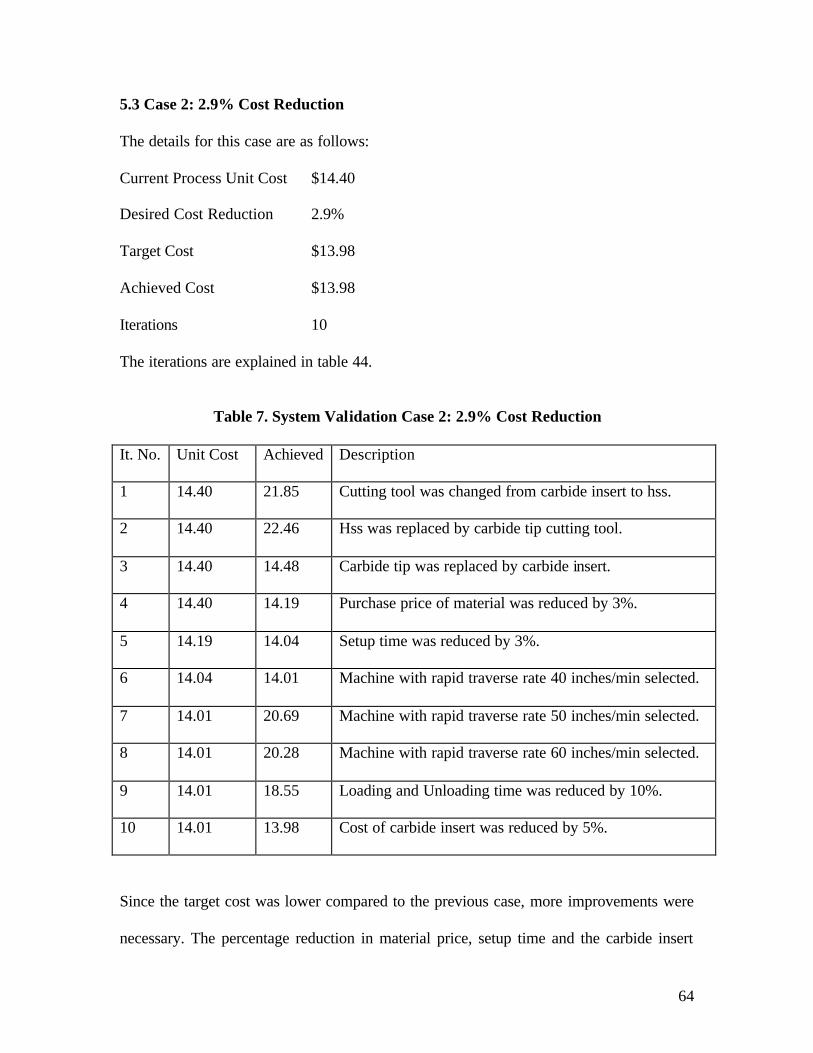
64
5.3 Case 2: 2.9% Cost Reduction
The details for this case are as follows:
Current Process Unit Cost $14.40
Desired Cost Reduction 2.9%
Target Cost $13.98
Achieved Cost $13.98
Iterations 10
The iterations are explained in table 44.
Table 7. System Validation Case 2: 2.9% Cost Reduction
It. No. Unit Cost Achieved Description
1 14.40 21.85 Cutting tool was changed from carbide insert to hss.
2 14.40 22.46 Hss was replaced by carbide tip cutting tool.
3 14.40 14.48 Carbide tip was replaced by carbide insert.
4 14.40 14.19 Purchase price of material was reduced by 3%.
5 14.19 14.04 Setup time was reduced by 3%.
6 14.04 14.01 Machine with rapid traverse rate 40 inches/min selected.
7 14.01 20.69 Machine with rapid traverse rate 50 inches/min selected.
8 14.01 20.28 Machine with rapid traverse rate 60 inches/min selected.
9 14.01 18.55 Loading and Unloading time was reduced by 10%.
10 14.01 13.98 Cost of carbide insert was reduced by 5%.
Since the target cost was lower compared to the previous case, more improvements were
necessary. The percentage reduction in material price, setup time and the carbide insert

65
cost show more realistic values, which can be achieved in the real world. The results are
shown in table 44 and Figure 29.
FIGURE 20. VALIDATION EXAMPLE 2
During iterations 7, 8 and nine, different machines were evaluated to reduce the rapid
traverse cost. The machines with lower rapid traverse rate had lower labor, but the higher
unit cost is justified by higher handling times.

66
5.4 Conclusion
The system validation formed the most important part of this research work. Two real life
examples were solved using the target-costing model, the process and results of which
were presented in this chapter. The model provided good results as illustrated by the
examples and the accuracy of the results could be improved by populating the databases
with more realistic and practical data. The examples also demonstrated that the material
cost and the setup time constituted the major portion of the unit cost, which is consistent
with real life applications. The examples provided in this chapter and the earlier chapters
suggest that the effect of high setup time can be offset by larger batch sizes.

67
CHAPTER 6
CONCLUSION AND FUTURE WORK
6.1 Conclusion
The field of target-costing is emerging fast as the solution to future product development
and cost reduction. Target-Costing, Value Chain Analysis, Value Chain Improvement,
Quality Function Deployment etc are different names which try to achieve the same
objective: to produce a product at the lowest cost with all the required features with
adherence to quality conformance and aesthetics. All the above mentioned are different
techniques of process improvement but try to achieve the same objective. Target-costing
has been widely applied in product development and process improvement by companies
such as Toyota Motor Corporation, Nissan Motor Corporation, Boeing, Chrysler, Kodak,
Lucent Technologies, Sony Corporation, and many others. Target-costing can be applied
in the design of a new product as well as improvement of an existing process.
Machining is one of the most widely used manufacturing operations and hence there is a
huge potential for cost reduction using the target-costing technique. In this research, a
target-costing model was developed for turning operation, which uses a structured
approach to reduce the machining costs. The user interface was designed in Microsoft
Visual Basic and the database was developed using Microsoft Access. The model was
tested using real time data and the results obtained were comparable to the actual values.
This model can be utilized as a starting point in the development of an integrated target-
costing system for all machining operations.

68
6.2 Future Work
The target-costing model was developed for the turning operation to evaluate its
feasibility. Since the tests produced good results, this model can be further enhanced to
incorporate more machining operations like milling, drilling, grinding, tapping and other
finishing operations. The user can be given more choices regarding the materials and
their respective hardness. By incorporating all machining operations, a good process
planning system can be developed which can be used very well for instructional
purposes. The program can also be made smart by incorporating user input data analysis
feature, which screens the user input data before using it in the program.
Features such as implementation costs and opportunity costs can be incorporated to
enhance the model and its usefulness.
69
REFERENCES
1. Bayou, M., and Reinstein, A., 1998, Three routes for target-costing. Managerial
Finance, 24, 28-45.
2. Bhattacharyya, A., Faria-Gonzalez, R., and Ham, I., 1970, Regression analysis for
predicting surface finish and its application in the determination of optimum
machining conditions. Transactions of ASME, Journal of Engineering for
Industry, 92, 711-714.
3. Carr, C., and Ng, J., 1995, Total cost control: Nissan and its U.K. supplier
partnerships. Management Accounting Research, 6, 347-365.
4. Clifton, B., and Townsend, W., 1998, Inputs for successful target-costing.
Applications of Design for Manufacturing ASME, DE-Vol. 99/MED-Vol. 7, 21-
27.
5. Cooper, R., 2002, Target-costing for new-product development. Journal of Cost
Management, May-June, 5-12.
6. Cooper, R., and Slagmulder, R., 1999, Target-costing and value engineering.
Productivity Press, Portland, UK.
7. Creese. R, Adithan, M, and Pabla, B. S., 1992, Estimating and costing for metal
manufacturing industries. Marcel Dekker, New York, USA.
8. Ermer, D. S., and Kromodihardjo, S., 1981, Optimization of multipass turning
with constraints. Transactions of ASME, Journal of Engineering for Industry,
103, 462-469.

70
9. Fischer, G. W., Wei, Y., and Dontamsetti, S., 1989, Process-controlled machining
of gray cast iron. Journal of Mechanical Working Technology, 20, 47-57.
10. Gopalakrishnan, B., and Al-Khayyal, F., 1991, Machine parameter selection for
turning with constraints: an analytical approach based on geometric programming.
International Journal of Production Research, 29, 9, 1897-1908.
11. Horvath, P., Gleich, R., and Schmidt, S., 1998, Linking target-costing to ABC at a
US automotive supplier. Journal of Cost Management, Mar-Apr, 16-24.
12. Kato, Y., 1993, Target-costing support systems: lessons from leading Japanese
companies. Management Accounting Research, 4, 33-47.
13. Liang, M., Mgwatu, M., and Zuo, M., 2001, Integration of cutting parameter
selection and tool adjustment decisions for multipass turning. International
Journal of Manufacturing Technology, 17, 861-869.
14. Meng, Q., Arsecularatne, J., and Mathew, P., 2000, Calculation of optimum
cutting conditions for turning operations using a machining theory. International
Journal of Machine Tools and Manufacture, 40, 1709-1733.
15. Mesquita, R., Krasteva, E., and Doytchinov, S., 1995, Computer-aided selection
of optimum machining parameters in multipass turning. International Journal of
Advanced Manufacturing Technology, 10, 19-26.
16. Monden, Y., and Hamada, K., 1991, Target-costing and kaizen costing in
Japanese automobile companies. Journal of Management Accounting Research,
3, Fall, 16-34.

71
17. Narang, R.V., and Fischer, G.W., 1993, Development of a framework to automate
process-planning functions and to determine machining parameters. International
Journal of Production Research, 31, 1921-1942.
18. Nicolini, D., Tomkins, C., Holti, R., Oldman, A., and Smalley, M., 2000, Can
target-costing and whole life costing be applied in the construction industry?:
Evidence from two case studies. British Journal of Management, 11, 303-324.
19. Philips, D. T., and Beightler, C. S., 1970, Optimization in tool engineering using
geometric programming. AIIE Transactions, 2, 355-360.
20. Philipson, R. H., and Ravindran, A., 1979 Application of mathematical
programming to metal cutting. Mathematical Programming Study, 11, 116-134.
21. Ramaswamy, K. V., and Lambert, B. K., 1974, Cost optimization for a single pass
turning operation including inventory and penalty costs. International Journal of
Production Research, 12, 331-334.
22. Shank, J.K, and Fisher, J., 1999, Case study-target-costing as a strategic tool.
Sloan Management Review, Fall, 73-82.
23. Sundaram, R. M., 1978, An application of goal programming technique in metal
cutting. International Journal of Production Research, 16, 375-382.
24. Sung, N., 1991, Target cost allocation technique in development designing. SAVE
Proceedings, 204-205.
25. Tan, F.P., and Creese, R.C., 1995, A generalized multi-pass machining model for
machining parameter selection in turning. International Journal of Production
Research, 33, 1467-1487.

72
26. Tani, T., 1995, Interactive control in target cost management. Management
Accounting Research, 6, 399-414.
27. Tani, T., Okano, H., Shimizu, N., Iwabuchi, Y., Fukuda, J., and Cooray, S., 1994,
Target cost management in Japanese companies: current state of art. Management
Accounting Research, 5, 67-81.
28. Taylor, F. W., 1907, On the art of cutting metals. ASME transactions, 29, 31-279.
29. Tsai, P., 1986, An optimization algorithm and economic analysis for a constrained
machining model. Ph.D dissertation, West Virginia University.
30. Walvekar, A. G., and Lambert, B. K., 1970, An application of geometric
programming to machining variable selection. International Journal of
Production Research, 8, 241-245.
31. Williamson, A., 1997, Target and kaizen costing. Manufacturing Engineer, Feb,
22-24.

73
APPENDIX
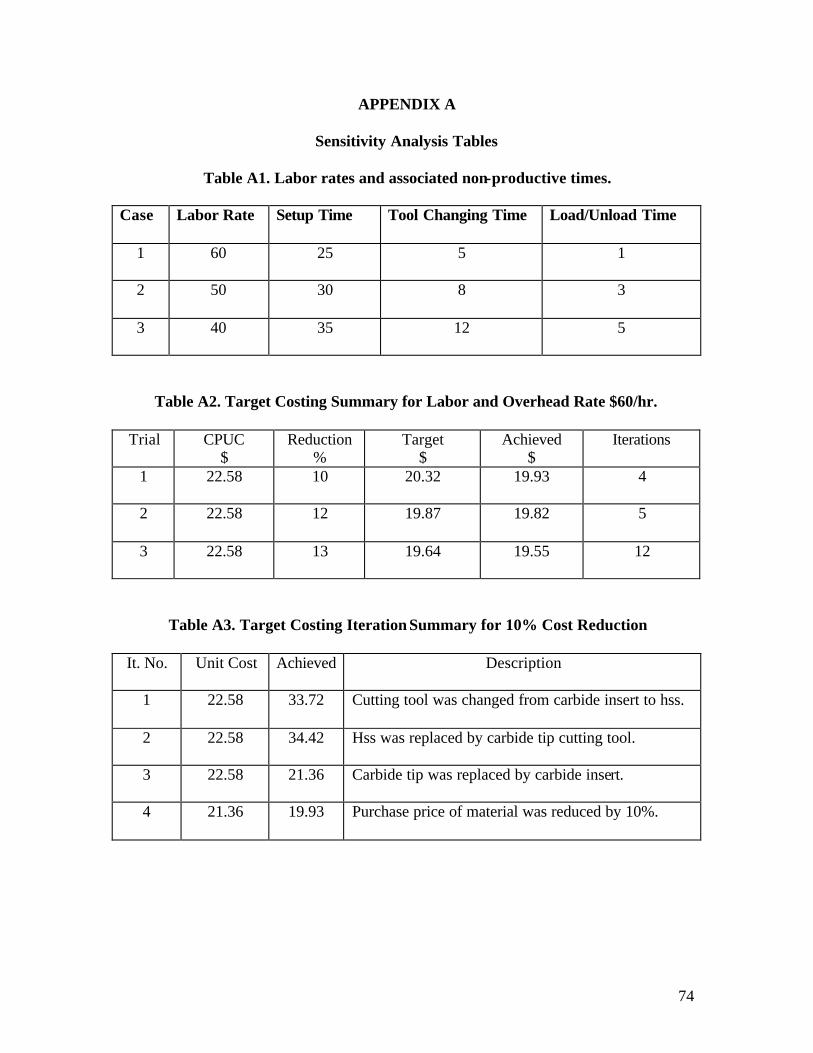
74
APPENDIX A
Sensitivity Analysis Tables
Table A1. Labor rates and associated non-productive times.
Case Labor Rate Setup Time Tool Changing Time Load/Unload Time
1 60 25 5 1
2 50 30 8 3
3 40 35 12 5
Table A2. Target Costing Summary for Labor and Overhead Rate $60/hr.
Trial CPUC $
Reduction %
Target $
Achieved $
Iterations
1 22.58 10 20.32 19.93 4
2 22.58 12 19.87 19.82 5
3 22.58 13 19.64 19.55 12
Table A3. Target Costing Iteration Summary for 10% Cost Reduction
It. No. Unit Cost Achieved Description
1 22.58 33.72 Cutting tool was changed from carbide insert to hss.
2 22.58 34.42 Hss was replaced by carbide tip cutting tool.
3 22.58 21.36 Carbide tip was replaced by carbide insert.
4 21.36 19.93 Purchase price of material was reduced by 10%.

75
Table A4. Target Costing Iteration Summary for 12% Cost Reduction
It. No. Unit Cost Achieved Description
1 22.58 33.72 Cutting tool was changed from carbide insert to hss.
2 22.58 34.42 Hss was replaced by carbide tip cutting tool.
3 22.58 21.36 Carbide tip was replaced by carbide insert.
4 21.36 19.93 Purchase price of material was reduced by 10%.
5 19.93 19.82 Loading and Unloading time was reduced by 10%.
Table A5. Target Costing Iteration Summary for 13% Cost Reduction
It. No. Unit Cost
Achieved Description
1 22.58 33.72 Cutting tool was changed from carbide insert to hss.
2 22.58 34.42 Hss was replaced by carbide tip cutting tool.
3 22.58 21.36 Carbide tip was replaced by carbide insert.
4 21.36 19.93 Purchase price of material was reduced by 10%.
5 19.93 19.82 Loading and Unloading time was reduced by 10%.
6 19.82 21.81 Machine with rapid traverse rate 40 inches/min selected.
7 19.82 21.4 Machine with rapid traverse rate 50 inches/min selected.
8 19.82 19.93 Machine with rapid traverse rate 60 inches/min selected.
9 19.82 19.89 Rework rate was reduced by 10%
10 19.82 19.75 Cost of carbide insert was reduced by 10%
11 19.75 19.74 Setup time was reduced by 10%
12 19.74 19.55 Tool changing time was reduced by 10%

76
Figure A1. Target Costing Iteration Summary for 13% Cost Reduction
Table A11. Target Costing Summary for Batch Size 500 Units
Trial CPUC $
Reduction %
Target $
Achieved $
Iterations
1 22.47 10 20.22 19.83 4
2 22.47 12 19.77 19.72 5
3 22.47 13 19.55 19.47 11

77
Table A12. Target Costing Iteration Summary for 10% Cost Reduction
It. No. Unit Cost Achieved Description
1 22.47 33.6 Cutting tool was changed from carbide insert to hss.
2 22.47 34.3 Hss was replaced by carbide tip cutting tool.
3 22.47 21.26 Carbide tip was replaced by carbide insert.
4 21.26 19.83 Purchase price of material was reduced by 10%.
Table A13. Target Costing Iteration Summary for 12% Cost Reduction
It. No. Unit Cost Achieved Description
1 22.47 33.6 Cutting tool was changed from carbide insert to hss.
2 22.47 34.3 Hss was replaced by carbide tip cutting tool.
3 22.47 21.26 Carbide tip was replaced by carbide insert.
4 21.26 19.83 Purchase price of material was reduced by 10%.
5 19.83 19.72 Loading and Unloading time was reduced by 10%.
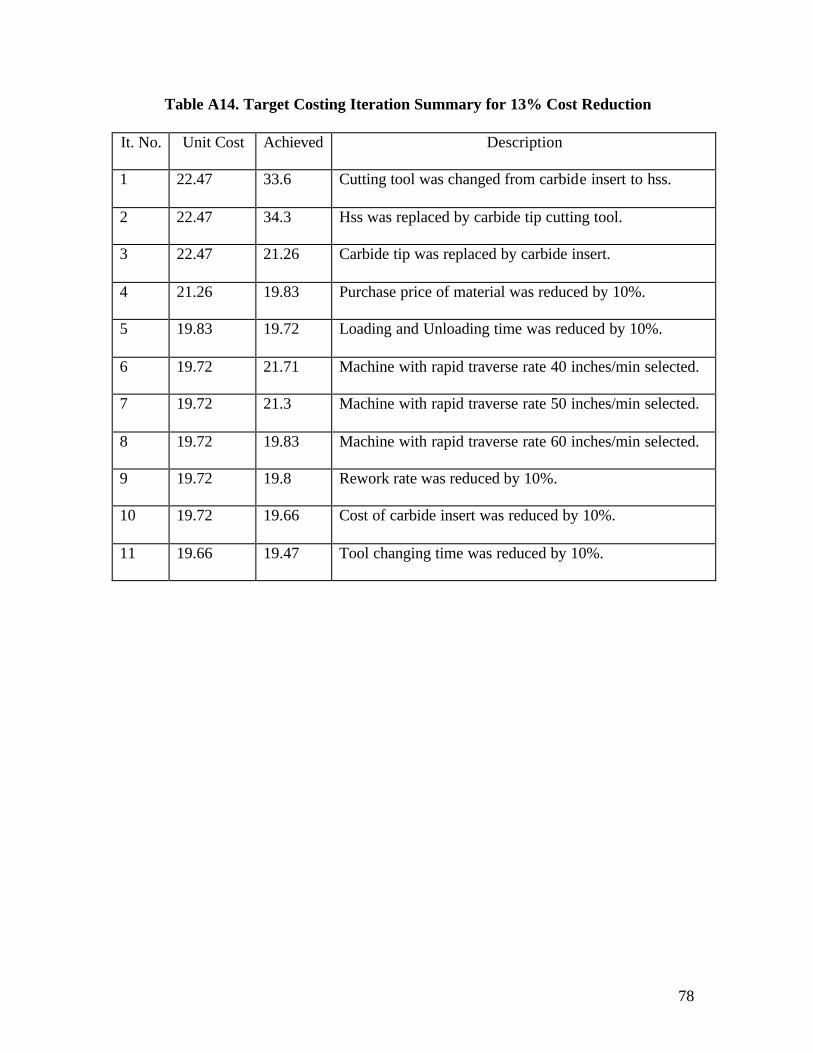
78
Table A14. Target Costing Iteration Summary for 13% Cost Reduction
It. No. Unit Cost Achieved Description
1 22.47 33.6 Cutting tool was changed from carbide insert to hss.
2 22.47 34.3 Hss was replaced by carbide tip cutting tool.
3 22.47 21.26 Carbide tip was replaced by carbide insert.
4 21.26 19.83 Purchase price of material was reduced by 10%.
5 19.83 19.72 Loading and Unloading time was reduced by 10%.
6 19.72 21.71 Machine with rapid traverse rate 40 inches/min selected.
7 19.72 21.3 Machine with rapid traverse rate 50 inches/min selected.
8 19.72 19.83 Machine with rapid traverse rate 60 inches/min selected.
9 19.72 19.8 Rework rate was reduced by 10%.
10 19.72 19.66 Cost of carbide insert was reduced by 10%.
11 19.66 19.47 Tool changing time was reduced by 10%.

79
Figure A2. Target Costing Iteration Summary for 13% Cost Reduction
Table A19. Target Costing Summary for Material Condition Hot Rolled and
Annealed and Hardness 125 – 150 BHn.
Trial CPUC $
Reduction %
Target $
Achieved $
Iterations
1 22.58 10 20.32 20.27 10
2 22.58 11 20.10 20.05 12
3 22.58 13 19.87 20.05 13

80
Table A20. Target Costing Iteration Summary for 10% Cost Reduction
It. No. Unit Cost Achieved Description
1 22.58 36 Cutting tool was changed from carbide insert to hss.
2 22.58 36.5 Hss was replaced by carbide tip cutting tool.
3 22.58 21.89 Carbide tip was replaced by carbide insert.
4 21.89 20.46 Purchase price of material was reduced by 10%.
5 20.46 20.35 Loading and unloading time was reduced by 10%.
6 20.35 22.26 Machine with rapid traverse rate 40 inches/min selected.
7 20.35 21.91 Machine with rapid traverse rate 50 inches/min selected.
8 20.35 20.46 Machine with rapid traverse rate 60 inches/min selected.
9 20.35 20.42 Rework rate was reduced by 10%.
10 20.35 20.27 Cost of carbide insert was reduced by 10%.

81
Figure A3. Target Cost Achieved in 10 iterations

82
Table A21. Target Costing Iteration Summary for 12% Cost Reduction
It. No. Unit Cost Achieved Description
1 22.58 36 Cutting tool was changed from carbide insert to hss.
2 22.58 36.5 Hss was replaced by carbide tip cutting tool.
3 22.58 21.89 Carbide tip was replaced by carbide insert.
4 21.89 20.46 Purchase price of material was reduced by 10%.
5 20.46 20.35 Loading and unloading time was reduced by 10%.
6 20.35 22.26 Machine with rapid traverse rate 40 inches/min selected.
7 20.35 21.91 Machine with rapid traverse rate 50 inches/min selected.
8 20.35 20.46 Machine with rapid traverse rate 60 inches/min selected.
9 20.35 20.42 Rework rate was reduced by 10%.
10 20.35 20.27 Cost of carbide insert was reduced by 10%.
11 20.27 20.25 Setup time was reduced by 10%.
12 20.25 20.05 Tool changing time was reduced by 10%.

83
Table A22. Target Costing Iteration Summary for 13% Cost Reduction
It. No. Unit Cost Achieved Description
1 22.58 36 Cutting tool was changed from carbide insert to hss.
2 22.58 36.5 Hss was replaced by carbide tip cutting tool.
3 22.58 21.89 Carbide tip was replaced by carbide insert.
4 21.89 20.46 Purchase price of material was reduced by 10%.
5 20.46 20.35 Loading and unloading time was reduced by 10%.
6 20.35 22.26 Machine with rapid traverse rate 40 inches/min selected.
7 20.35 21.91 Machine with rapid traverse rate 50 inches/min selected.
8 20.35 20.46 Machine with rapid traverse rate 60 inches/min selected.
9 20.35 20.42 Rework rate was reduced by 10%.
10 20.35 20.27 Cost of carbide insert was reduced by 10%.
11 20.27 20.25 Setup time was reduced by 10%.
12 20.25 20.05 Tool changing time was reduced by 10%.
13 20.05 20.05 Resharpening time was reduced by 10%.

84
Table A27. Target Costing Summary for Percentage Rejection 5%.
Trial CPUC $
Reduction %
Target $
Achieved $
Iterations
1 21.2 10 19.08 18.7 4
2 21.2 12 18.66 18.59 5
3 21.2 13 18.44 18.35 12
Table A28. Target Costing Iteration Summary for 10% Cost Reduction
It. No. Unit Cost Achieved Description
1 21.2 31.74 Cutting tool was changed from carbide insert to hss.
2 21.2 32.41 Hss was replaced by carbide tip cutting tool.
3 21.2 20.05 Carbide tip was replaced by carbide insert.
4 20.05 18.7 Purchase price of material was reduced by 10%.
Table A29. Target Costing Iteration Summary for 12% Cost Reduction
It. No. Unit Cost Achieved Description
1 21.2 31.74 Cutting tool was changed from carbide insert to hss.
2 21.2 32.41 Hss was replaced by carbide tip cutting tool.
3 21.2 20.05 Carbide tip was replaced by carbide insert.
4 20.05 18.7 Purchase price of material was reduced by 10%.
5 18.7 18.59 Loading and unloading time was reduced by 10%.
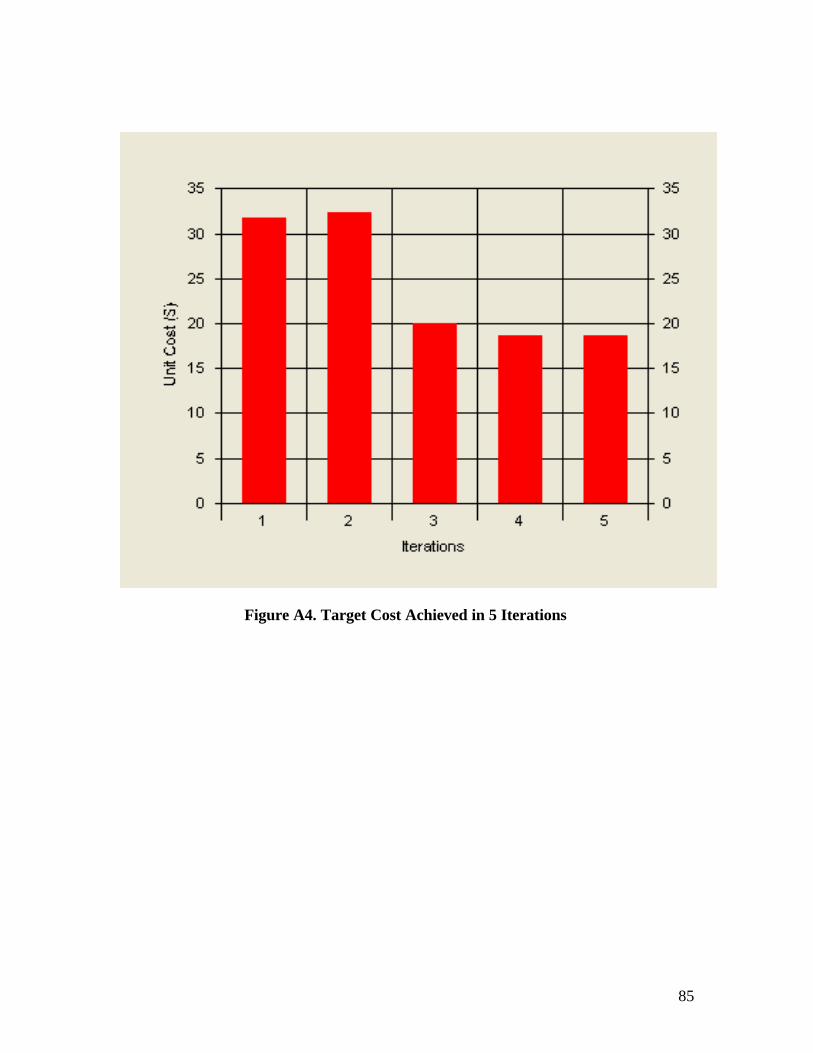
85
Figure A4. Target Cost Achieved in 5 Iterations

86
Table A30. Target Costing Iteration Summary for 13% Cost Reduction
It. No. Unit Cost Achieved Description
1 21.2 31.74 Cutting tool was changed from carbide insert to hss.
2 21.2 32.41 Hss was replaced by carbide tip cutting tool.
3 21.2 20.05 Carbide tip was replaced by carbide insert.
4 20.05 18.7 Purchase price of material was reduced by 10%.
5 18.7 18.59 Loading and unloading time was reduced by 10%.
6 18.59 20.47 Machine with rapid traverse rate 40 inches/min selected.
7 18.59 20.09 Machine with rapid traverse rate 50 inches/min selected.
8 18.59 18.7 Machine with rapid traverse rate 60 inches/min selected.
9 18.59 18.56 Cost of carbide insert was reduced by 10%.
10 18.56 18.54 Rework rate was reduced by 10%.
11 18.54 18.53 Setup time was reduced by 10%.
12 18.53 18.35 Tool changing time was reduced by 10%.
Table A39. Target Costing Summary for Material Price $200/ton
Trial CPUC $
Reduction %
Target $
Achieved $
Iterations
1 16.41 10 14.77 22.72 4
2 16.41 13 14.28 22.6 5
3 16.41 14 14.11 14.00 12

87
Table A40. Target Costing Iteration Summary for 10% Cost Reduction
It. No. Unit Cost Achieved Description
1 16.41 27.55 Cutting tool was changed from carbide insert to hss.
2 16.41 28.25 Hss was replaced by carbide tip cutting tool.
3 16.41 15.19 Carbide tip was replaced by carbide insert.
4 15.19 14.38 Purchase price of material was reduced by 10%.

88
Figure A5. Target Cost Achieved in 4 Iterations
Table A41. Target Costing Iteration Summary for 13% Cost Reduction
It. No. Unit Cost Achieved Description
1 16.41 27.55 Cutting tool was changed from carbide insert to hss.
2 16.41 28.25 Hss was replaced by carbide tip cutting tool.
3 16.41 15.19 Carbide tip was replaced by carbide insert.
4 15.19 14.38 Purchase price of material was reduced by 10%.
5 14.38 14.27 Loading and unloading time was reduced by 10%.

89
Table A42. Target Costing Iteration Summary for 14% Cost Reduction
It. No. Unit Cost Achieved Description
1 16.41 27.55 Cutting tool was changed from carbide insert to hss.
2 16.41 28.25 Hss was replaced by carbide tip cutting tool.
3 16.41 15.19 Carbide tip was replaced by carbide insert.
4 15.19 14.38 Purchase price of material was reduced by 10%.
5 14.38 14.27 Loading and unloading time was reduced by 10%.
6 14.27 16.26 Machine with rapid traverse rate 40 inches/min selected.
7 14.27 15.85 Machine with rapid traverse rate 50 inches/min selected.
8 14.27 14.38 Machine with rapid traverse rate 60 inches/min selected.
9 14.27 14.34 Rework rate was reduced by 10%.
10 14.27 14.2 Cost of carbide insert was reduced by 10%.
11 14.2 14.19 Setup time was reduced by 10%.
12 14.19 14.00 Tool changing time was reduced by 10%.
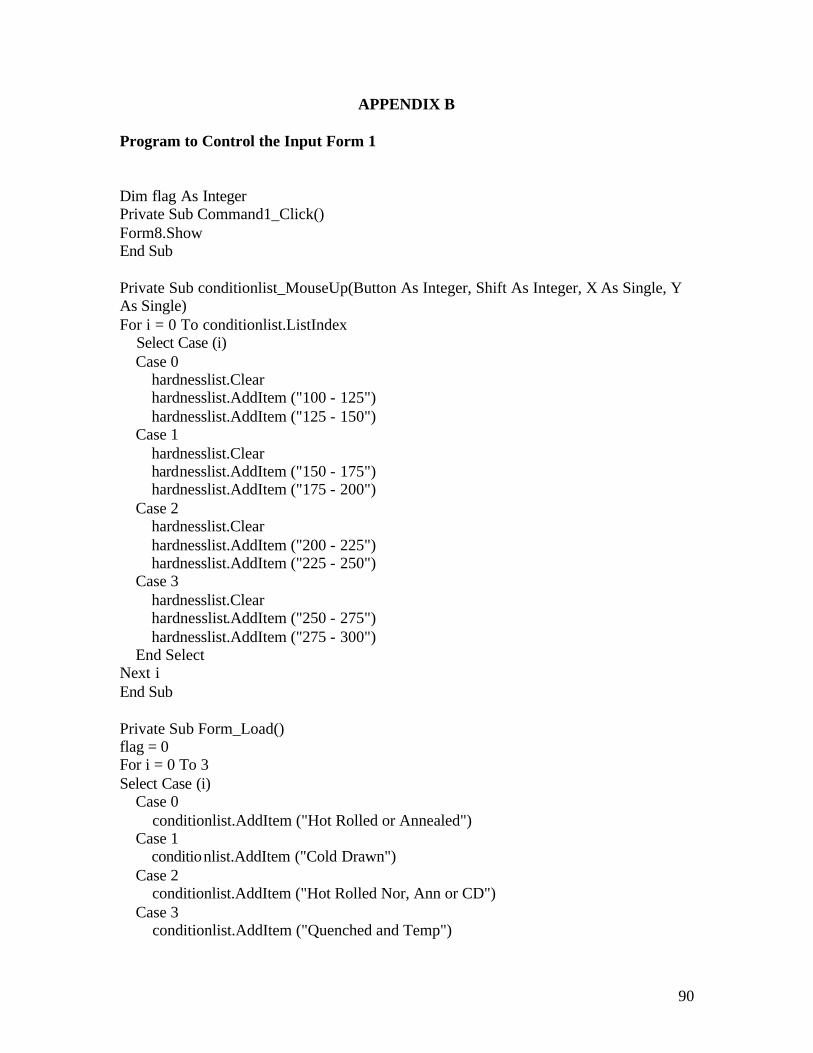
90
APPENDIX B
Program to Control the Input Form 1
Dim flag As Integer Private Sub Command1_Click() Form8.Show End Sub Private Sub conditionlist_MouseUp(Button As Integer, Shift As Integer, X As Single, Y As Single) For i = 0 To conditionlist.ListIndex Select Case (i) Case 0 hardnesslist.Clear hardnesslist.AddItem ("100 - 125") hardnesslist.AddItem ("125 - 150") Case 1 hardnesslist.Clear hardnesslist.AddItem ("150 - 175") hardnesslist.AddItem ("175 - 200") Case 2 hardnesslist.Clear hardnesslist.AddItem ("200 - 225") hardnesslist.AddItem ("225 - 250") Case 3 hardnesslist.Clear hardnesslist.AddItem ("250 - 275") hardnesslist.AddItem ("275 - 300") End Select Next i End Sub Private Sub Form_Load() flag = 0 For i = 0 To 3 Select Case (i) Case 0 conditionlist.AddItem ("Hot Rolled or Annealed") Case 1 conditionlist.AddItem ("Cold Drawn") Case 2 conditionlist.AddItem ("Hot Rolled Nor, Ann or CD") Case 3 conditionlist.AddItem ("Quenched and Temp")
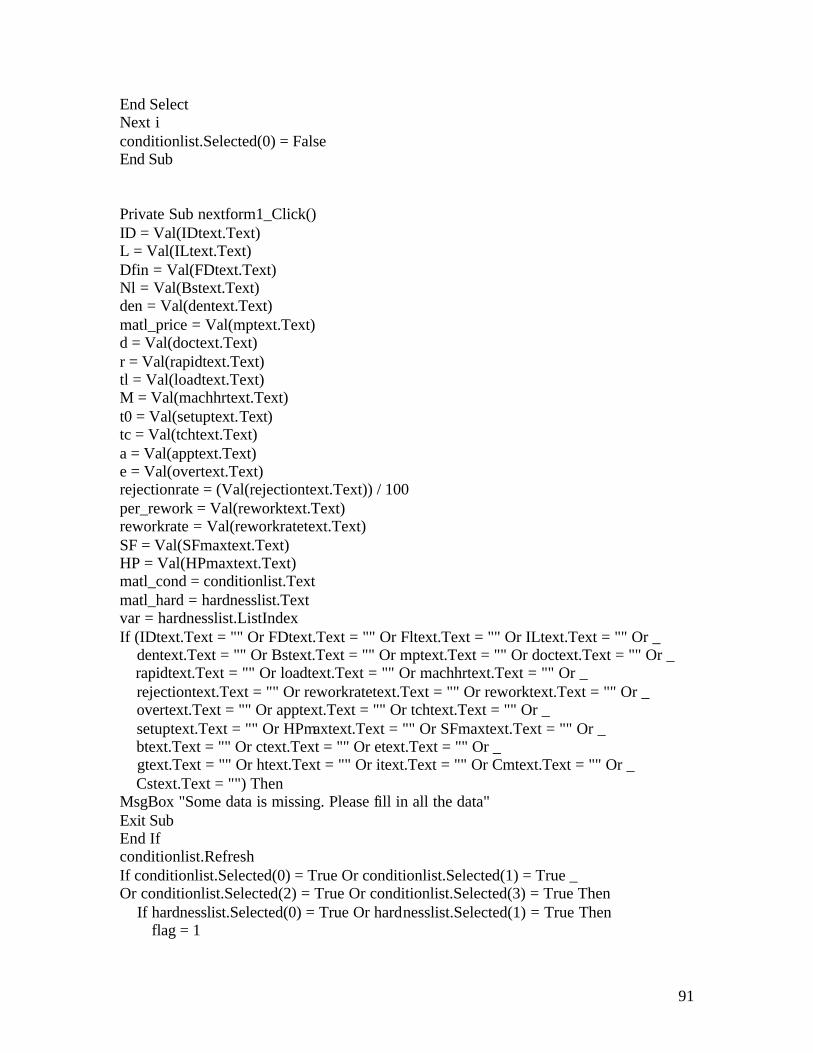
91
End Select Next i conditionlist.Selected(0) = False End Sub Private Sub nextform1_Click() ID = Val(IDtext.Text) L = Val(ILtext.Text) Dfin = Val(FDtext.Text) Nl = Val(Bstext.Text) den = Val(dentext.Text) matl_price = Val(mptext.Text) d = Val(doctext.Text) r = Val(rapidtext.Text) tl = Val(loadtext.Text) M = Val(machhrtext.Text) t0 = Val(setuptext.Text) tc = Val(tchtext.Text) a = Val(apptext.Text) e = Val(overtext.Text) rejectionrate = (Val(rejectiontext.Text)) / 100 per_rework = Val(reworktext.Text) reworkrate = Val(reworkratetext.Text) SF = Val(SFmaxtext.Text) HP = Val(HPmaxtext.Text) matl_cond = conditionlist.Text matl_hard = hardnesslist.Text var = hardnesslist.ListIndex If (IDtext.Text = "" Or FDtext.Text = "" Or Fltext.Text = "" Or ILtext.Text = "" Or _ dentext.Text = "" Or Bstext.Text = "" Or mptext.Text = "" Or doctext.Text = "" Or _ rapidtext.Text = "" Or loadtext.Text = "" Or machhrtext.Text = "" Or _ rejectiontext.Text = "" Or reworkratetext.Text = "" Or reworktext.Text = "" Or _ overtext.Text = "" Or apptext.Text = "" Or tchtext.Text = "" Or _ setuptext.Text = "" Or HPmaxtext.Text = "" Or SFmaxtext.Text = "" Or _ btext.Text = "" Or ctext.Text = "" Or etext.Text = "" Or _ gtext.Text = "" Or htext.Text = "" Or itext.Text = "" Or Cmtext.Text = "" Or _ Cstext.Text = "") Then MsgBox "Some data is missing. Please fill in all the data" Exit Sub End If conditionlist.Refresh If conditionlist.Selected(0) = True Or conditionlist.Selected(1) = True _ Or conditionlist.Selected(2) = True Or conditionlist.Selected(3) = True Then If hardnesslist.Selected(0) = True Or hardnesslist.Selected(1) = True Then flag = 1

92
Else MsgBox " Please select the material hardness" End If Else MsgBox " Please select the material condition" End If If flag = 1 Then Form2.Show Form1.Hide End If End Sub

93
APPENDIX C
Program to Control the Input Form 2
Dim D1, D2, D3, D4 As Double Dim X1, X2, X3, X5, X6, X7, X8, X9, X10, X11, X12, X13 As Double Dim flag As Integer Private Sub backform2_Click() Form1.Show Form2.Hide resultsform2.Enabled = False calculate.Enabled = True End Sub Private Sub calculate_Click() flag = 0 If ((hss.Value = False) And (carbidetip.Value = False) And (carbideinsert.Value = False)) Then MsgBox " Please Select the Tool Type" Exit Sub End If If (mtext.Text = "" Or ntext.Text = "" Or ptext.Text = "") Then MsgBox " Please enter all Tool Life Exponents " Exit Sub End If If hss.Value = True Then If Gwctext.Text = "" Or Tstext.Text = "" Or Lrgtext.Text = "" Or _ toolprice.Text = "" Or Toollifeconsttext.Text = "" Then MsgBox "Please fill in all data" Else flag = 1 End If ElseIf carbidetip.Value = True Then If Gwctext.Text = "" Or Tstext.Text = "" Or Lrgtext.Text = "" Or _ toolprice.Text = "" Or Lrbtext.Text = "" Or k2text.Text = "" Or _ Toollifeconsttext.Text = "" Then MsgBox "Please fill in all data" Else flag = 1 End If ElseIf carbideinsert.Value = True Then If Cictext.Text = "" Or k3text.Text = "" Or Toollifeconsttext.Text = "" Then MsgBox "Please fill in all data" Else

94
flag = 1 End If End If If flag = 1 Then X1 = Val(Form1.btext.Text) X2 = Val(Form1.ctext.Text) X3 = Val(Form1.etext.Text) X4 = Val(Form1.gtext.Text) X5 = Val(Form1.htext.Text) X6 = Val(Form1.itext.Text) X7 = Val(mtext.Text) X8 = Val(ntext.Text) X9 = Val(ptext.Text) X10 = Val(Form1.Cstext.Text) X11 = Val(Form1.Cmtext.Text) D3 = 0 D4 = (1 - X7) / (X5 - X4 * X7) D2 = (X8 * (X5 - X4)) / (X5 - X4 * X7) D1 = 1 - D2 Csdash = X10 * (Val(Form1.doctext.Text) ^ X6) / SF Cmdash = X11 * (Val(Form1.doctext.Text) ^ X3) / HP C1dash = (3.14 * ID * L * M) / (12 * 60) X12 = (C1dash * (d ^ (X9 / X8))) / (Val(Toollifeconsttext.Text) ^ (1 / X8)) If (hss.Value = True Or carbidetip.Value = True) Then X13 = ((M * tc / 60) + Val(toolprice.Text)) * 60 / M Else X13 = ((M * tc / 60) + Val(Cictext.Text)) * 60 / M End If C2dash = X12 * X13 If (D2 >= 0 And D2 <= 1 And D4 >= 0) Then Dual_D2 = D2 Else Dual_D2 = "Not feasible" End If If (D2 >= 0 And D2 <= 1 And D4 >= 0) Then Dual_D4 = D4 Else Dual_D4 = "Not feasible" End If fr = (Csdash ^ (1 / (X7 * X4 - X5))) * (C1dash * (1 - D1) / (C2dash * D1)) ^ (X8 * X4 / (X7 * X4 - X5)) v = 1 / (Csdash * (fr ^ X5)) ^ (1 / X4) If (Dual_D2 = "Not feasible" Or Dual_D4 = "Not feasible") Then z1 = "not feasible" ' case 1

95
Else z1 = "ok" End If If z1 = "not feasible" Then D4 = 0 D3 = X1 / X9 If (D2 >= 0 And D2 <= 1 And D3 >= 0) Then Dual_D2 = "ok" Else Dual_D2 = " not feasible" End If If (D2 >= 0 And D2 <= 1 And D3 >= 0) Then Dual_D4 = "ok" Else Dual_D4 = " not feasible" End If If (Dual_D2 = "not feasible" Or Dual_D4 = " not feasible") Then z2 = "not feasible" ' case 2 Else z2 = "ok" End If fr = (Cmdash ^ (1 / (X7 * X1 - X2))) * (C1dash * (1 - D1) / (C2dash * D1)) ^ (X8 * X1 / (X7 * X1 - X2)) v = 1 / (Cmdash * (fr ^ X2)) ^ (1 / X1) End If If (z1 = "not feasible" And z2 = "not feasible") Then ' case 1 and case 2 are not feasible v = Exp((X5 * Log(Cmdash) - X2 * Log(Csdash)) / (X4 * X2 - X1 * X5)) fr = Exp((X1 * Log(Csdash) - X4 * Log(Cmdash)) / (X4 * X2 - X1 * X5)) End If If hss.Value = True Then G = Lrgtext.Text Cw = Gwctext.Text ts = Tstext.Text tooltype1 = "hss" ElseIf carbidetip.Value = True Then k2 = k2text.Text Lrb = Lrbtext.Text tb = Tbtext.Text G = Lrgtext.Text Cw = Gwctext.Text ts = Tstext.Text tooltype1 = "carbide tip" Else 'carbideinsert.Value = True Then Cost = Cictext.Text k3 = k3text.Text

96
tooltype1 = "carbide insert" End If m1 = Val(mtext.Text) n = Val(ntext.Text) p = Val(ptext.Text) C = Val(Toollifeconsttext.Text) T = Toollife(v, fr, d, m1, n, p, C, tooltype1, k3) Call feeding(d, rejectionrate, M, v, fr) feedcost = Fc rtc = (a + L + e) * No_passes(d) * M / (r * 60) stc = setup(t0, M) tcc = Tool_change(fr, v, T, tc, M) lcc = tl * M / 60 tmtc = feedcost + rtc + stc + tcc + lcc rsc = Resharpening(fr, v, T, G, ts, k2, tooltype1) grc = Grinding(frnew, vnew, T, Cwnew, tooltype1) rbc = Rebrazing(Lrb, tb, k2, tooltype1) cic = Carbide(Cost, Ft, T, tooltype1) rwc = reworkcost() Form3.feedcost = Format(Fc, "####0.00") Form3.rtc = Format(rtc, "####0.00") Form3.stc = Format(stc, "####0.00") Form3.tcc = Format(tcc, "####0.00") Form3.lc = Format(lcc, "####0.00") Form3.tmtc = Format(tmtc, "####0.00") Form3.rwc = Format(rwc, "####0.00") toolcost = rbc + rsc + cic + grc matlcost = Material(matl_price, den) totalcost = ubs * (tmtc + toolcost + matlcost + rwc) unitcost = totalcost / Nl Form3.rbc = Format(rbc, "####0.00") Form3.rsc = Format(rsc, "####0.00") Form3.cic = Format(cic, "##,##0.00") Form3.grc = Format(grc, "####0.00") Form3.toolcost = Format(toolcost, "####0.00") Form3.matlcost = Format(matlcost, "####0.00") Form3.totalcost = Format(totalcost, "####0.00") Form3.unitcost = Format(unitcost, "####0.00") calculate.Enabled = False resultsform2.Enabled = True Else Exit Sub End If End Sub Private Sub hss_Click()

97
lrglabel.Visible = True Lrgtext.Visible = True gwclabel.Visible = True Gwctext.Visible = True tslabel.Visible = True Tstext.Visible = True tblabel.Visible = False Tbtext.Visible = False lrblabel.Visible = False Lrbtext.Visible = False ciclabel.Visible = False Cictext.Visible = False k2label.Visible = False k2text.Visible = False k3label.Visible = False k3text.Visible = False Tclabel.Visible = True toolprice.Visible = True Label6.Visible = True Label5.Visible = False Label2.Visible = False Label3.Visible = True Label4.Visible = True Label7.Visible = False Label8.Visible = True End Sub Private Sub carbidetip_Click() lrglabel.Visible = True Lrgtext.Vis ible = True gwclabel.Visible = True Gwctext.Visible = True tslabel.Visible = True Tstext.Visible = True tblabel.Visible = True Tbtext.Visible = True lrblabel.Visible = True Lrbtext.Visible = True k2label.Visible = True k2text.Visible = True k3label.Visible = False k3text.Visible = False ciclabel.Visible = False Cictext.Visible = False Tclabel.Visible = True toolprice.Visible = True Label6.Visible = True

98
Label5.Visible = False Label2.Visible = True Label3.Visible = True Label4.Visible = True Label7.Visible = True Label8.Visible = True End Sub Private Sub carbideinsert_Click() lrglabel.Visible = False Lrgtext.Visible = False gwclabel.Visible = False Gwctext.Visible = False tslabel.Visible = False Tstext.Visible = False tblabel.Visible = False Tbtext.Visible = False lrblabel.Visible = False Lrbtext.Visible = False ciclabel.Visible = True Cictext.Visible = True k2label.Visible = False k2text.Visible = False k3label.Visible = True k3text.Visible = True Tclabel.Visible = False toolprice.Visible = False Label5.Visible = True Label6.Visible = False Label2.Visible = False Label3.Visible = False Label4.Visible = False Label7.Visible = False Label8.Visible = False End Sub Private Sub resultsform2_Click() Form2.Hide Form3.Show End Sub

99
APPENDIX D
Program to Control Form 3
Dim cn As Connection Dim rs As Recordset Private Sub Command1_Click() If targettext.Text = "" Then MsgBox " Please enter the Percentage Reduction Required" Exit Sub End If Call sort Form4.Text1 = Format(Arr1(0), "##,##0.00") Form4.Text2 = Format(Arr1(1), "##,##0.00") Form4.Text3 = Format(Arr1(2), "##,##0.00") Form4.Text4 = Format(Arr1(3), "##,##0.00") Form4.Text5 = Format(Arr1(4), "##,##0.00") Form4.Text7 = Format(Arr1(5), "##,##0.00") Form4.Text8 = Format(Arr1(6), "##,##0.00") Form4.Text9 = Format(Arr1(7), "##,##0.00") Form4.Text10 = Format(Arr1(8), "##,##0.00") Form4.Label2.Caption = Arr2(0) Form4.Label3.Caption = Arr2(1) Form4.Label4.Caption = Arr2(2) Form4.Label5.Caption = Arr2(3) Form4.Label6.Caption = Arr2(4) Form4.Label19.Caption = Arr2(5) Form4.Label20.Caption = Arr2(6) Form4.Label21.Caption = Arr2(7) Form4.Label22.Caption = Arr2(8) Form4.Label8.Caption = Format(Val(Arr1(0) / unitcost.Text) * 100, "##,##0.00") Form4.Label9.Caption = Format(Val(Arr1(1) / unitcost.Text) * 100, "##,##0.00") Form4.Label10.Caption = Format(Val(Arr1(2) / unitcost.Text) * 100, "##,##0.00") Form4.Label11.Caption = Format(Val(Arr1(3) / unitcost.Text) * 100, "##,##0.00") Form4.Label12.Caption = Format(Val(Arr1(4) / unitcost.Text) * 100, "##,##0.00") Form4.Label23.Caption = Format(Val(Arr1(5) / unitcost.Text) * 100, "##,##0.00") Form4.Label24.Caption = Format(Val(Arr1(6) / unitcost.Text) * 100, "##,##0.00") Form4.Label25.Caption = Format(Val(Arr1(7) / unitcost.Text) * 100, "##,##0.00") Form4.Label26.Caption = Format(Val(Arr1(8) / unitcost.Text) * 100, "##,##0.00") targetcost = Val(unitcost.Text) * (1 - (Val(targettext.Text) / 100)) Form4.Text6.Text = Format(targetcost, "##,##0.00") Form4.Show Form3.Hide

100
End Sub Private Sub Command2_Click() Form3.Hide Form2.Show End Sub

101
APPENDIX E
Program to Control Form 4
Private Sub Achieve_Click() Dim con As New ADODB.Connection Dim cmd As New ADODB.Command Dim rs As New ADODB.Recordset Dim unitcost1 As Single con.Open "Provider=Microsoft.Jet.OLEDB.4.0;" & _ "Data Source= C:\Documents and Settings\ameet\My Documents\research\vbcode\target.mdb;" & _ "User Id=Admin;" & _ "Password" unitcost1 = 1000 Achieve.Enabled = False 'For j = 0 To 10 'Select Case (Arr2(j)) '----------------------------------------------------------------------- 'Case "Feeding Cost" 'stri = "select * from tools where Condition = '" & matl_cond & "' and Hardness = '" & matl_hard & "'" 'stri = "select * from HRA1 " 'rs.Open "select * from tools where Condition = '" & matl_cond & "' and Hardness = '" & matl_hard & "'", con, adOpenStatic, adLockPessimistic If matl_cond = "Hot Rolled or Annealed" And matl_hard = "100 - 125" Then rs.Open "select * from HRAlo ", con, adOpenStatic, adLockPessimistic End If If matl_cond = "Hot Rolled or Annealed" And matl_hard = "125 - 150" Then rs.Open "select * from HRAhi ", con, adOpenStatic, adLockPessimistic End If If matl_cond = "Cold Drawn" And matl_hard = "150 - 175" Then rs.Open "select * from CDlo ", con, adOpenStatic, adLockPessimistic End If If matl_cond = "Cold Drawn" And matl_hard = "175 - 200" Then rs.Open "select * from CDhi ", con, adOpenStatic, adLockPessimistic End If If matl_cond = "Hot Rolled Nor, Ann or CD" And matl_hard = "200 - 225" Then rs.Open "select * from HRNACDlo ", con, adOpenStatic, adLockPessimistic End If If matl_cond = "Hot Rolled Nor, Ann or CD" And matl_hard = "225 - 250" Then rs.Open "select * from HRNACDhi ", con, adOpenStatic, adLockPessimistic End If If matl_cond = "Quenched and Temp" And matl_hard = "250 - 275" Then rs.Open "select * from QTlo ", con, adOpenStatic, adLockPessimistic

102
End If If matl_cond = "Quenched and Temp" And matl_hard = "275 - 300" Then rs.Open "select * from QThi ", con, adOpenStatic, adLockPessimistic End If rs.Move (Start) Do While Not rs.EOF d22 = rs("dmax") m2 = rs("m") n2 = rs("n") p2 = rs("p") C2 = rs("C") Cost2 = rs("cost") tooltype2 = rs("type") G2 = rs("G") Cw2 = rs("Cw") ts2 = rs("ts") Lrb2 = rs("Lrb") tb2 = rs("tb") k22 = rs("k2") k32 = rs("k3") Call calculate(d22, m2, n2, p2, C2, Cost2, M, tooltype2, G2, Cw2, ts2, Lrb2, tb2, k22, k32, r, tc, tl, t0) If (unitcost < unitcost1) Then If (unitcost < Val(Form3.unitcost.Text)) Then d = d22 m1 = m2 n = n2 p = p2 C = C2 tooltype1 = tooltype2 k2 = k22 k3 = k32 tb = tb2 ts = ts2 G = G2 Cost = Cost2 Cw = Cw2 Lrb = Lrb2 unitcost1 = unitcost End If End If If (unitcost <= targetcost) Then Exit Do End If rs.MoveNext Loop

103
rs.Close 'If (unitcost <= targetcost) Then ''targetlabel.Visible = True ' Exit For 'End If '-------------------------------------------------------------------------------- 'Call sort For j = 1 To 10 If (unitcost <= targetcost) Then Exit For End If Select Case (Arr2(j)) '-------------------------------------------------------------------------------- Case "Rapid Traverse Cost" mcexplore = yes rs.Open "select * from machine ", con, adOpenForwardOnly, adLockReadOnly Do While Not rs.EOF M3 = rs("Machinehourrate") r3 = rs("Rapidtraverserate") t03 = rs("Settime") tl3 = rs("Loadunloadtime") tc3 = rs("Toolchtime") mctype3 = rs("Name") Call calculate(d, m1, n, p, C, Cost, M3, tooltype1, G, Cw, ts, Lrb, tb, k2, k3, r3, tc3, tl3, t03) If (unitcost < unitcost1) Then If (unitcost < Val(Form3.unitcost.Text)) Then M = M3 r = r3 t0 = t03 tl = tl3 tc = tc3 mctype = mctype3 unitcost1 = unitcost End If End If If (unitcost <= targetcost) Then Exit Do End If rs.MoveNext Loop rs.Close If (unitcost <= targetcost) Then 'targetlabel.Visible = True Exit For End If
104
'------------------------------------------------------------------------------- Case "Setup Cost" response = InputBox("Can you reduce the Setup time? Please enter the percentage") t0 = t0 * ((100 - Val(response)) / 100) Call calculate(d, m1, n, p, C, Cost, M, tooltype1, G, Cw, ts, Lrb, tb, k2, k3, r, tc, tl, t0) If (unitcost <= targetcost) Then 'targetlabel.Visible = True Exit For End If '------------------------------------------------------------------------------- Case "Loading and Unloading Cost" response = InputBox("Can you reduce the Loading and Unloading Time? Please enter the percentage") tl = tl * ((100 - Val(response)) / 100) Call calculate(d, m1, n, p, C, Cost, M, tooltype1, G, Cw, ts, Lrb, tb, k2, k3, r, tc, tl, t0) If (unitcost <= targetcost) Then 'targetlabel.Visible = True Exit For End If '------------------------------------------------------------------------------- Case "Tool Changing Cost" response = InputBox("Can you reduce the Tool Changing Time? Please enter the percentage") tc = tc * ((100 - Val(response)) / 100) Call calculate(d, m1, n, p, C, Cost, M, tooltype1, G, Cw, ts, Lrb, tb, k2, k3, r, tc, tl, t0) If (unitcost <= targetcost) Then 'targetlabel.Visible = True Exit For End If '------------------------------------------------------------------------------- Case "Rebrazing Cost" response = InputBox("Can you reduce the Rebrazing Time? Please enter the percentage") tb = tb * ((100 - Val(response)) / 100) Call calculate(d, m1, n, p, C, Cost, M, tooltype1, G, Cw, ts, Lrb, tb, k2, k3, r, tc, tl, t0) If (unitcost <= targetcost) Then 'targetlabel.Visible = True Exit For End If '------------------------------------------------------------------------------- Case "Resharpening Cost" response = InputBox("Can you reduce the Resharpening Time? Please enter the percentage") ts = ts * ((100 - Val(response)) / 100) Call calculate(d, m1, n, p, C, Cost, M, tooltype1, G, Cw, ts, Lrb, tb, k2, k3, r, tc, tl, t0) If (unitcost <= targetcost) Then

105
'targetlabel.Visible = True Exit For End If '------------------------------------------------------------------------------- Case "Carbide Insert Cost" response = InputBox("Can you reduce the Cost per carbide insert? Please enter the percentage") Cost = Cost * ((100 - Val(response)) / 100) Call calculate(d, m1, n, p, C, Cost, M, tooltype1, G, Cw, ts, Lrb, tb, k2, k3, r, tc, tl, t0) If (unitcost <= targetcost) Then 'targetlabel.Visible = True Exit For End If '------------------------------------------------------------------------------- Case "Material Cost" response = InputBox("Can you reduce the Material Price? Please enter the percentage", "Material_Cost", 0) matl_price = matl_price * ((100 - Val(response)) / 100) Call calculate(d, m1, n, p, C, Cost, M, tooltype1, G, Cw, ts, Lrb, tb, k2, k3, r, tc, tl, t0) If (unitcost <= targetcost) Then 'targetlabel.Visible = True Exit For End If '------------------------------------------------------------------------------- Case "Rework Cost" response = InputBox("Can you reduce the Rework Rate? Please enter the percentage", "Material_Cost", 0) reworkrate = reworkrate * ((100 - Val(response)) / 100) Call calculate(d, m1, n, p, C, Cost, M, tooltype1, G, Cw, ts, Lrb, tb, k2, k3, r, tc, tl, t0) If (unitcost <= targetcost) Then 'targetlabel.Visible = True Exit For End If '----------------------------------------------------------------------------------- End Select Next j '=============================================================================== If (unitcost <= targetcost) Then targetlabel.Visible = True Else Notarget.Visible = True End If con.Close Set con = Nothing 'If (unitcost > targetcost) Then

106
' Label17.Visible = True 'Else Command2.Enabled = True 'End If End Sub Private Sub Command1_Click() Form4.Hide Form3.Show Achieve.Enabled = True targetlabel.Visible = False Notarget.Visible = False End Sub Private Sub Command2_Click() Form5.feedcosttgt = Format(feedcost, "####0.00") Form5.rtctgt = Format(rtc, "####0.00") Form5.stctgt = Format(stc, "####0.00") Form5.tcctgt = Format(tcc, "####0.00") Form5.lctgt = Format(lcc, "####0.00") Form5.tmtctgt = Format(tmtc, "####0.00") Form5.rsctgt = Format(rsc, "####0.00") Form5.rbctgt = Format(rbc, "####0.00") Form5.grctgt = Format(grc, "####0.00") Form5.cictgt = Format(cic, "####0.00") Form5.toolcosttgt = Format(toolcost, "####0.00") Form5.matlcosttgt = Format(matlcost, "####0.00") Form5.reworktgt = Format(rwc, "####0.00") Form5.totalcosttgt = Format(totalcost, "####0.00") Form5.unitcosttgt = Format(unitcost, "####0.00") Form5.fcpre = Val(Form3.feedcost) Form5.stcpre = Val(Form3.stc) Form5.rtcpre = Val(Form3.rtc) Form5.tccpre = Val(Form3.tcc) Form5.lccpre = Val(Form3.lc) Form5.rbcpre = Val(Form3.rbc) Form5.grcpre = Val(Form3.grc) Form5.cicpre = Val(Form3.cic) Form5.rscpre = Val(Form3.rsc) Form5.tmtcpre = Val(Form3.tmtc) Form5.reworkpre = Val(Form3.rwc) Form5.toolcostpre = Val(Form3.toolcost) Form5.matlcostpre = Val(Form3.matlcost) Form5.unitcostpre = Val(Form3.unitcost) Form5.totalcostpre = Format(Val(Form3.totalcost.Text), "##,##0.00") Form4.Hide

107
Form5.Show End Sub

108
APPENDIX F
Program to Control Form 5
Private Sub Command1_Click() Form4.Show Form5.Hide End Sub Private Sub Command2_Click() Form6.Show Unload Me End Sub

109
APPENDIX G
Program to Control Form 6
Private Sub Command1_Click() Dim i As Integer Dim Xaxis As Object Show 'MSChart1.Column = 1 MSChart1.RowCount = Module1.count 'Number of X Values For i = 0 To Module1.count - 1 MSChart1.Row = i + 1 'X Coordinate MSChart1.Data = unit(i) MSChart1.RowLabel = i + 1 MSChart1.Plot.Axis(VtChAxisIdX, 1).AxisTitle.Text = "Iterations" MSChart1.Plot.Axis(VtChAxisIdY, 1).AxisTitle.Text = "Unit Cost ($)" Next i For i = 0 To 10 Select Case (i) Case 0 List1.AddItem ("Feeding Cost") Case 1 List1.AddItem ("Rapid Traverse Cost") Case 2 List1.AddItem ("Load/Unload Cost") Case 3 List1.AddItem ("Tool Change Cost") Case 4 List1.AddItem ("Setup Cost") Case 5 List1.AddItem ("Rebrazing Cost") Case 6 List1.AddItem ("Resharpening Cost") Case 7 List1.AddItem ("Carbide Insert Cost") Case 8 List1.AddItem ("Grinding Cost") Case 9 List1.AddItem ("Material Cost") Case 10 List1.AddItem ("Rework Cost") End Select Next i End Sub

110
Private Sub Command2_Click() num = 0 Form7.MSFlexGrid1.Col = 0 ' Setting the column number = 0 '===============Naming the Rows in the Grid==============================' Form7.MSFlexGrid1.Row = 1 'Form7.MSFlexGrid1.CellWidth = 10 Form7.MSFlexGrid1.AllowUserResizing = flexResizeColumns Form7.MSFlexGrid1.Text = "Cutting Speed" Form7.MSFlexGrid1.Row = 2 Form7.MSFlexGrid1.Text = "Feed" Form7.MSFlexGrid1.Row = 3 Form7.MSFlexGrid1.Text = "Depth of Cut" Form7.MSFlexGrid1.Row = 4 Form7.MSFlexGrid1.Text = "Tool Life" Form7.MSFlexGrid1.Row = 5 Form7.MSFlexGrid1.Text = "Machine Hour Rate" Form7.MSFlexGrid1.Row = 6 Form7.MSFlexGrid1.Text = "Number of Passes" Form7.MSFlexGrid1.Row = 7 Form7.MSFlexGrid1.Text = "Rapid Traverse Rate" Form7.MSFlexGrid1.Row = 8 Form7.MSFlexGrid1.Text = "Setup Time" Form7.MSFlexGrid1.Row = 9 Form7.MSFlexGrid1.Text = "Tool Change Time" Form7.MSFlexGrid1.Row = 10 Form7.MSFlexGrid1.Text = "Load/Unload Time" Form7.MSFlexGrid1.Row = 11 Form7.MSFlexGrid1.Text = "Rebrazing Time" Form7.MSFlexGrid1.Row = 12 Form7.MSFlexGrid1.Text = "Resharpening Time" Form7.MSFlexGrid1.Row = 13 Form7.MSFlexGrid1.Text = "Unit Cost" Form7.MSFlexGrid1.Row = 14 Form7.MSFlexGrid1.Text = "Feeding Cost" Form7.MSFlexGrid1.Row = 15 Form7.MSFlexGrid1.Text = "Setup Cost" Form7.MSFlexGrid1.Row = 16 Form7.MSFlexGrid1.Text = "Rapid Traverse Cost" Form7.MSFlexGrid1.Row = 17 Form7.MSFlexGrid1.Text = "Resharpening Cost" Form7.MSFlexGrid1.Row = 18 Form7.MSFlexGrid1.Text = "Rebrazing Cost" Form7.MSFlexGrid1.Row = 19 Form7.MSFlexGrid1.Text = "Carbide Insert Cost" Form7.MSFlexGrid1.Row = 20

111
Form7.MSFlexGrid1.Text = "Grinding Cost" Form7.MSFlexGrid1.Row = 21 Form7.MSFlexGrid1.Text = "Load/Unload Cost" Form7.MSFlexGrid1.Row = 22 Form7.MSFlexGrid1.Text = "Tool Change Cost" Form7.MSFlexGrid1.Row = 23 Form7.MSFlexGrid1.Text = "Rework Cost" Form7.MSFlexGrid1.Row = 24 Form7.MSFlexGrid1.Text = "Tool Type" Form7.MSFlexGrid1.Row = 0 For i = 1 To Module1.count Form7.MSFlexGrid1.Col = i Form7.MSFlexGrid1.Text = "Iter" & i Next i For j = 1 To Module1.count Form7.MSFlexGrid1.Col = j For i = 1 To 24 'k = i + 1 Form7.MSFlexGrid1.Row = i Select Case (i) Case 1 Form7.MSFlexGrid1.Text = speed(num) Case 2 Form7.MSFlexGrid1.Text = feed(num) Case 3 Form7.MSFlexGrid1.Text = depth(num + 1) Case 4 Form7.MSFlexGrid1.Text = life(num + 1) Case 5 Form7.MSFlexGrid1.Text = mc_hr_rate(num + 1) Case 6 Form7.MSFlexGrid1.Text = passes(num + 1) Case 7 Form7.MSFlexGrid1.Text = rapidrate(num) Case 8 Form7.MSFlexGrid1.Text = setuptime(num + 1) Case 9 Form7.MSFlexGrid1.Text = toolchangetime(num + 1) Case 10 Form7.MSFlexGrid1.Text = loadunloadtime(num) Case 11 Form7.MSFlexGrid1.Text = rebtime(num) Case 12 Form7.MSFlexGrid1.Text = restime(num + 1) Case 13 Form7.MSFlexGrid1.Text = unit(num)

112
Case 14 Form7.MSFlexGrid1.Text = feedingcost(num) Case 15 Form7.MSFlexGrid1.Text = setupcost(num) Case 16 Form7.MSFlexGrid1.Text = rapidcost(num) Case 17 Form7.MSFlexGrid1.Text = rescost(num) Case 18 Form7.MSFlexGrid1.Text = rebcost(num) Case 19 Form7.MSFlexGrid1.Text = carbidecost(num) Case 20 Form7.MSFlexGrid1.Text = grindcost(num) Case 21 Form7.MSFlexGrid1.Text = loadcost(num) Case 22 Form7.MSFlexGrid1.Text = toolchcost(num) Case 23 Form7.MSFlexGrid1.Text = rew(num) Case 24 Form7.MSFlexGrid1.Text = tool_type(num + 1) End Select Next i num = num + 1 Next j Unload Me Form7.Show End Sub Private Sub Command3_Click() Dim flag As Integer flag = 0 If List1.Selected(0) = True Or List1.Selected(1) = True _ Or List1.Selected(2) = True Or List1.Selected(3) = True Or List1.Selected(4) = True _ Or List1.Selected(5) = True Or List1.Selected(6) = True Or List1.Selected(7) = True _ Or List1.Selected(8) = True Or List1.Selected(9) = True Or List1.Selected(10) = True Then flag = 1 Else MsgBox " Please select the Cost Component and the Parameter" Exit Sub End If MSChart2.Column = 1 MSChart2.RowCount = Module1.count Select Case (List1.ListIndex)

113
'================== FEED COST ====================================== Case 0 Select Case (List2.ListIndex) Case 0 For i = 0 To Module1.count - 1 MSChart2.Row = i + 1 'X Coordinate MSChart2.Data = feedingcost(i) MSChart2.RowLabel = feed(i) MSChart2.Plot.Axis(VtChAxisIdX, 1).AxisTitle.Text = "feed (inches/rev)" MSChart2.Plot.Axis(VtChAxisIdY, 1).AxisTitle.Text = "feeding Cost ($)" Next i Case 1 For i = 0 To Module1.count - 1 MSChart2.Row = i + 1 'X Coordinate MSChart2.Data = feedingcost(i) MSChart2.RowLabel = speed(i) MSChart2.Plot.Axis(VtChAxisIdX, 1).AxisTitle.Text = "speed (SFPM)" MSChart2.Plot.Axis(VtChAxisIdY, 1).AxisTitle.Text = "feeding Cost ($)" Next i Case 2 For i = 0 To Module1.count - 1 MSChart2.Row = i + 1 'X Coordinate MSChart2.Data = feedingcost(i) MSChart2.RowLabel = depth(i + 1) MSChart2.Plot.Axis(VtChAxisIdX, 1).AxisTitle.Text = "depth of cut (inches)" MSChart2.Plot.Axis(VtChAxisIdY, 1).AxisTitle.Text = "feeding Cost ($)" Next i Case 3 For i = 0 To Module1.count - 1 MSChart2.Row = i + 1 'X Coordinate MSChart2.Data = feedingcost(i) MSChart2.RowLabel = passes(i + 1) MSChart2.Plot.Axis(VtChAxisIdX, 1).AxisTitle.Text = "Number of Passes" MSChart2.Plot.Axis(VtChAxisIdY, 1).AxisTitle.Text = "feeding Cost ($)" Next i Case 4 For i = 0 To Module1.count - 1 MSChart2.Row = i + 1 'X Coordinate MSChart2.Data = feedingcost(i) MSChart2.RowLabel = mc_hr_rate(i) MSChart2.Plot.Axis(VtChAxisIdX, 1).AxisTitle.Text = "Machine Hour Rate ($/hr)" MSChart2.Plot.Axis(VtChAxisIdY, 1).AxisTitle.Text = "feeding Cost ($)" Next i End Select

114
'===================== RAPID TRAVERSE COST ====================================== Case 1 Select Case (List2.ListIndex) Case 0 For i = 0 To Module1.count - 1 MSChart2.Row = i + 1 'X Coordinate MSChart2.Data = rapidcost(i) MSChart2.RowLabel = rapidrate(i) MSChart2.Plot.Axis(VtChAxisIdX, 1).AxisTitle.Text = "Rapid Traverse Rate (inches/min)" MSChart2.Plot.Axis(VtChAxisIdY, 1).AxisTitle.Text = "Rapid Traverse Cost ($)" Next i Case 1 For i = 0 To Module1.count - 1 MSChart2.Row = i + 1 'X Coordinate MSChart2.Data = rapidcost(i) MSChart2.RowLabel = mc_hr_rate(i) MSChart2.Plot.Axis(VtChAxisIdX, 1).AxisTitle.Text = "Machine Hour Rate ($/hr)" MSChart2.Plot.Axis(VtChAxisIdY, 1).AxisTitle.Text = "Rapid Traverse Cost ($)" Next i Case 2 For i = 0 To Module1.count - 1 MSChart2.Row = i + 1 'X Coordinate MSChart2.Data = rapidcost(i) MSChart2.RowLabel = passes(i + 1) MSChart2.Plot.Axis(VtChAxisIdX, 1).AxisTitle.Text = "Number of Passes" MSChart2.Plot.Axis(VtChAxisIdY, 1).AxisTitle.Text = "Rapid Traverse Cost ($)" Next i End Select '===================== LOAD UNLOAD COST ========================================= Case 2 Select Case (List2.ListIndex) Case 0 For i = 0 To Module1.count - 1 MSChart2.Row = i + 1 'X Coordinate MSChart2.Data = loadcost(i) MSChart2.RowLabel = loadunloadtime(i) MSChart2.Plot.Axis(VtChAxisIdX, 1).AxisTitle.Text = "Loading/Unloading Time (min)"

115
MSChart2.Plot.Axis(VtChAxisIdY, 1).AxisTitle.Text = "Loading/Unloading Cost ($)" Next i Case 1 For i = 0 To Module1.count - 1 MSChart2.Row = i + 1 'X Coordinate MSChart2.Data = loadcost(i) MSChart2.RowLabel = mc_hr_rate(i) MSChart2.Plot.Axis(VtChAxisIdX, 1).AxisTitle.Text = "Machine Hour Rate ($/hr)" MSChart2.Plot.Axis(VtChAxisIdY, 1).AxisTitle.Text = "Loading/Unloading Cost ($)" Next i End Select '===================== TOOL CHANGE COST ========================================== Case 3 Select Case (List2.ListIndex) Case 0 For i = 0 To Module1.count - 1 MSChart2.Row = i + 1 'X Coordinate MSChart2.Data = toolchcost(i) MSChart2.RowLabel = toolchangetime(i) MSChart2.Plot.Axis(VtChAxisIdX, 1).AxisTitle.Text = "Tool Change time (min)" MSChart2.Plot.Axis(VtChAxisIdY, 1).AxisTitle.Text = "Tool Change Cost ($)" Next i Case 1 For i = 0 To Module1.count - 1 MSChart2.Row = i + 1 'X Coordinate MSChart2.Data = toolchcost(i) MSChart2.RowLabel = feed(i) MSChart2.Plot.Axis(VtChAxisIdX, 1).AxisTitle.Text = "feed (inches/rev)" MSChart2.Plot.Axis(VtChAxisIdY, 1).AxisTitle.Text = "Tool Change Cost ($)" Next i Case 2 For i = 0 To Module1.count - 1 MSChart2.Row = i + 1 'X Coordinate MSChart2.Data = toolchcost(i) MSChart2.RowLabel = speed(i) MSChart2.Plot.Axis(VtChAxisIdX, 1).AxisTitle.Text = "speed (SFPM)" MSChart2.Plot.Axis(VtChAxisIdY, 1).AxisTitle.Text = "Tool Change Cost ($)" Next i Case 3 For i = 0 To Module1.count - 1

116
MSChart2.Row = i + 1 'X Coordinate MSChart2.Data = toolchcost(i) MSChart2.RowLabel = life(i + 1) MSChart2.Plot.Axis(VtChAxisIdX, 1).AxisTitle.Text = "Tool Life (min)" MSChart2.Plot.Axis(VtChAxisIdY, 1).AxisTitle.Text = "Tool Change Cost ($)" Next i Case 4 For i = 0 To Module1.count - 1 MSChart2.Row = i + 1 'X Coordinate MSChart2.Data = toolchcost(i) MSChart2.RowLabel = mc_hr_rate(i) MSChart2.Plot.Axis(VtChAxisIdX, 1).AxisTitle.Text = "Machine Hour Rate ($/hr)" MSChart2.Plo t.Axis(VtChAxisIdY, 1).AxisTitle.Text = "Tool Change Cost ($)" Next i End Select '===================== SETUP COST ========================================== Case 4 Select Case (List2.ListIndex) Case 0 For i = 0 To Module1.count - 1 MSChart2.Row = i + 1 'X Coordinate MSChart2.Data = setupcost(i) MSChart2.RowLabel = setuptime(i) MSChart2.Plot.Axis(VtChAxisIdX, 1).AxisTitle.Text = "Setup Time (min)" MSChart2.Plot.Axis(VtChAxisIdY, 1).AxisTitle.Text = "Setup Cost ($)" Next i Case 1 For i = 0 To Module1.count - 1 MSChart2.Row = i + 1 'X Coordinate MSChart2.Data = setupcost(i) MSChart2.RowLabel = mc_hr_rate(i) MSChart2.Plot.Axis(VtChAxisIdX, 1).AxisTitle.Text = "Machine Hour Rate ($/hr)" MSChart2.Plot.Axis(VtChAxisIdY, 1).AxisTitle.Text = "Setup Cost v" Next i End Select '===================== REBRAZING COST ======================================= Case 5 For i = 0 To Module1.count - 1 MSChart2.Row = i + 1 'X Coordinate MSChart2.Data = rebcost(i) MSChart2.RowLabel = rebtime(i)

117
MSChart2.Plot.Axis(VtChAxisIdX, 1).AxisTitle.Text = "Rebrazing Time (min)" MSChart2.Plot.Axis(VtChAxisIdY, 1).AxisTitle.Text = "Rebrazing Cost ($)" Next i '===================== RESHARPENING COST ===================================== Case 6 Select Case (List2.ListIndex) Case 0 For i = 0 To Module1.count - 1 MSChart2.Row = i + 1 'X Coordinate MSChart2.Data = rescost(i) MSChart2.RowLabel = restime(i + 1) MSChart2.Plot.Axis(VtChAxisIdX, 1).AxisTitle.Text = "Resharpening Time (min)" MSChart2.Plot.Axis(VtChAxisIdY, 1).AxisTitle.Text = "Resharpening Cost ($)" Next i Case 1 For i = 0 To Module1.count - 1 MSChart2.Row = i + 1 'X Coordinate MSChart2.Data = rescost(i) MSChart2.RowLabel = feed(i) MSChart2.Plot.Axis(VtChAxisIdX, 1).AxisTitle.Text = "feed (inches/rev)" MSChart2.Plot.Axis(VtChAxisIdY, 1).AxisTitle.Text = "Resharpening Cost ($)" Next i Case 2 For i = 0 To Module1.count - 1 MSChart2.Row = i + 1 'X Coordinate MSChart2.Data = rescost(i) MSChart2.RowLabel = speed(i) MSChart2.Plot.Axis(VtChAxisIdX, 1).AxisTitle.Text = "speed (SFPM)" MSChart2.Plot.Axis(VtChAxisIdY, 1).AxisTitle.Text = "Resharpening Cost ($)" Next i Case 3 For i = 0 To Module1.count - 1 MSChart2.Row = i + 1 'X Coordinate MSChart2.Data = rescost(i) MSChart2.RowLabel = life(i + 1) MSChart2.Plot.Axis(VtChAxisIdX, 1).AxisTitle.Text = "Tool Life (min)" MSChart2.Plot.Axis(VtChAxisIdY, 1).AxisTitle.Text = "Resharpening Cost ($)" Next i End Select
118
'===================== CARBIDE INSERT COST ===================================== Case 7 Select Case (List2.ListIndex) Case 0 For i = 0 To Module1.count - 1 MSChart2.Row = i + 1 'X Coordinate MSChart2.Data = carbidecost(i) MSChart2.RowLabel = feedtime(i) MSChart2.Plot.Axis(VtChAxisIdX, 1).AxisTitle.Text = "Feeding Time (min)" MSChart2.Plot.Axis(VtChAxisIdY, 1).AxisTitle.Text = "Carbide Insert Cost ($)" Next i Case 1 For i = 0 To Module1.count - 1 MSChart2.Row = i + 1 'X Coordinate MSChart2.Data = carbidecost(i) MSChart2.RowLabel = life(i + 1) MSChart2.Plot.Axis(VtChAxisIdX, 1).AxisTitle.Text = "Tool Life (min)" MSChart2.Plot.Axis(VtChAxisIdY, 1).AxisTitle.Text = "Carbide Insert Cost ($)" Next i End Select '===================== GRINDING COST ===================================== Case 8 Select Case (List2.ListIndex) Case 0 For i = 0 To Module1.count - 1 MSChart2.Row = i + 1 'X Coordinate MSChart2.Data = grindcost(i) MSChart2.RowLabel = feed(i) MSChart2.Plot.Axis(VtChAxisIdX, 1).AxisTitle.Text = "feed (inches/rev)" MSChart2.Plot.Axis(VtChAxisIdY, 1).AxisTitle.Text = "Grinding Cost ($)" Next i Case 1 For i = 0 To Module1.count - 1 MSChart2.Row = i + 1 'X Coordinate MSChart2.Data = grindcost(i) MSChart2.RowLabel = speed(i) MSChart2.Plot.Axis(VtChAxisIdX, 1).AxisTitle.Text = "speed (SFPM)" MSChart2.Plot.Axis(VtChAxisIdY, 1).AxisTitle.Text = "Grinding Cost ($)" Next i Case 2
119
For i = 0 To Module1.count - 1 MSChart2.Row = i + 1 'X Coordinate MSChart2.Data = grindcost(i) MSChart2.RowLabel = life(i + 1) MSChart2.Plot.Axis(VtChAxisIdX, 1).AxisTitle.Text = "Tool Life (min)" MSChart2.Plot.Axis(VtChAxisIdY, 1).AxisTitle.Text = "Grinding Cost ($)" Next i End Select '===================== MATERIAL COST ===================================== Case 9 For i = 0 To Module1.count - 1 MSChart2.Row = i + 1 'X Coordinate MSChart2.Data = materialcost(i) MSChart2.RowLabel = matprice(i + 1) MSChart2.Plot.Axis(VtChAxisIdX, 1).AxisTitle.Text = "Material Price ($/tonne)" MSChart2.Plot.Axis(VtChAxisIdY, 1).AxisTitle.Text = "Material Cost ($)" Next i '===================== REWORK COST ===================================== Case 10 Select Case (List2.ListIndex) Case 0 For i = 0 To Module1.count - 1 MSChart2.Row = i + 1 'X Coordinate MSChart2.Data = rew(i) MSChart2.RowLabel = rewper(i) MSChart2.Plot.Axis(VtChAxisIdX, 1).AxisTitle.Text = "Percentage Rework" MSChart2.Plot.Axis(VtChAxisIdY, 1).AxisTitle.Text = "Rework Cost ($)" Next i Case 1 For i = 0 To Module1.count - 1 MSChart2.Row = i + 1 'X Coordinate MSChart2.Data = rew(i) MSChart2.RowLabel = rewrate(i) MSChart2.Plot.Axis(VtChAxisIdX, 1).AxisTitle.Text = "Rework Rate" MSChart2.Plot.Axis(VtChAxisIdY, 1).AxisTitle.Text = "Rework Cost ($)" Next i Case 2 For i = 0 To Module1.count - 1 MSChart2.Row = i + 1 'X Coordinate MSChart2.Data = rew(i) MSChart2.RowLabel = rewquant(i) MSChart2.Plot.Axis(VtChAxisIdX, 1).AxisTitle.Text = "Rework Quantity"

120
MSChart2.Plot.Axis(VtChAxisIdY, 1).AxisTitle.Text = "Rework Cost ($)" Next i End Select '========================================================================== End Select 'End If End Sub Private Sub Command4_Click() Form5.Show Form6.Hide End Sub Private Sub List1_MouseUp(Button As Integer, Shift As Integer, X As Single, Y As Single) For i = 0 To List1.ListIndex Select Case (i) Case 0 List2.Clear List2.AddItem ("Feed Per Rev") List2.AddItem ("Cutting Speed") List2.AddItem ("Depth of Cut") List2.AddItem ("No of Passes") List2.AddItem ("Machine Hour Rate") Case 1 List2.Clear List2.AddItem ("Rapid Traverse Rate") List2.AddItem ("Machine Hour Rate") List2.AddItem ("No of Passes") List2.AddItem ("Tool Approach") List2.AddItem ("Tool Overtravel") Case 2 List2.Clear List2.AddItem ("Load/Unload Time") List2.AddItem ("Machine Hour Rate") Case 3 List2.Clear List2.AddItem ("Tool Change Time") List2.AddItem ("Feed Per Rev") List2.AddItem ("Cutting Speed") List2.AddItem ("Tool Life") List2.AddItem ("Machine Hour Rate") Case 4 List2.Clear

121
List2.AddItem ("Setup Time") List2.AddItem ("Machine Hour Rate") Case 5 List2.Clear List2.AddItem ("Rebrazing Time") List2.AddItem ("Brazing Labor Rate") List2.AddItem ("Rebrazing Frequency") Case 6 List2.Clear List2.AddItem ("Resharpening Time") List2.AddItem ("Feed Per Rev") List2.AddItem ("Cutting Speed") List2.AddItem ("Tool Life") List2.AddItem ("Grinding Labor Rate") Case 7 List2.Clear List2.AddItem ("Feeding Time") List2.AddItem ("Tool Life") Case 8 List2.Clear List2.AddItem ("Feed Per Rev") List2.AddItem ("Cutting Speed") List2.AddItem ("Tool Life") Case 9 List2.Clear List2.AddItem ("Material Price") Case 10 List2.Clear List2.AddItem ("Percentage Rework") List2.AddItem ("Rework Rate") List2.AddItem ("Rework Quantity") End Select Next i End Sub

122
APPENDIX I
Program to Control Form 7
Private Sub Command1_Click() Unload Me End End Sub Private Sub Command2_Click() Form7.Hide Form6.Show End Sub

123
APPENDIX H
Module containing Subprograms
Public ID As Single, L As Single, Dfin As Single, targetcost As Single Public den As Single, matl_price As Single, fr As Single, v As Single Public d As Single, r As Single, tl As Single, M As Single, t0 As Single Public tc As Single, a As Single, e As Single, rejectionrate As Single, per_rework As Single Public G As Single, p As Single, Cw As Single, Cost As Single, tb As Single, reworkrate As Single Public ts As Single, m1 As Single, n As Single, C As Single, Lrb As Single Public k2 As Integer, k3 As Integer, ubs As Integer, Nl As Integer, count As Integer Public T As Single, Ft As Single, Fc As Single, time_tool_fails As Single Public X1 As Double, X2 As Double, X3 As Double, X4 As Double, X5 As Double, X6 As Double Public X10 As Double, X11 As Double, X12 As Double, X13 As Double Public Arr1(11) As Single, Arr2(11) As String, typenew As String 'Public m2 As Single, n2 As Single, p2 As Single, C2 As Single, Cost As Single Public dnew As Single, unitcost As Single, frnew As Single, vnew As Single, Mnew As Single Public D1 As Single, D2 As Single, D3 As Single, D4 As Single, m1new As Single Public feedcost As Single, rtc As Single, stc As Single, lcc As Single, tcc As Single Public tmtc As Single, rbc As Single, grc As Single, rsc As Single, cic As Single Public totalcost As Single, matlcost As Single, toolcost As Single Public tooltype1 As String, tooltype2 As String, mcexplore As String Public SF As Double, HP As Double, life(20) As Double, rwc As Double Public unit(20) As Double, depth(20) As Double, speed(20) As Double, feed(20) As Double Public feedingcost(20) As Double, passes(20) As Integer, rapidcost(20) As Double Public rescost(20) As Double, rebcost(20) As Double, carbidecost(20) As Double Public grindcost(20) As Double, loadcost(20) As Double, toolchcost(20) As Double Public setupcost(20) As Double, rapidrate(20) As Double, setuptime(20) As Double Public toolchangetime(20) As Double, rebtime(20) As Double, restime(20) As Double Public loadunloadtime(20) As Double, rew(20) As Double, mc_hr_rate(20) As Double Public matl_cond As String, matl_hard As String, var As Integer, tool_type(40) As String Public brazingrate(20) As Single, grindingrate(20) As Single, feedtime(20) As Single Public matprice(20) As Single, rewquant(20) As Single, rewper(20) As Single Public rewrate(20) As Single, materialcost(20) As Double Public Sub feeding(dnew, rejectionrate, Mnew, vnew, frnew) Dim Dmax(12) As Double Dim Dmin(12) As Double Dim Dav(12) As Double

124
Dim feed_time(12) As Double Dim feed_cost(12) As Double Dim i As Integer, n As Integer Static i1 n = No_passes(dnew) ubs = Round(Nl / (1 - rejectionrate)) + 1 Fc = 0 Ft = 0 For i = 1 To n If (i = 1) Then Dmax(i) = ID Dmin(i) = Dmax(i) - (dnew * 2) Dav(i) = (Dmax(i) + Dmin(i)) / 2 Else Dmax(i) = Dmin(i - 1) Dmin(i) = Dmax(i) - (dnew * 2) If (Dmin(i) < Dfin) Then Dmin(i) = Dfin End If Dav(i) = (Dmax(i) + Dmin(i)) / 2 End If feed_time(i) = (Dav(i) * L) / (3.82 * frnew * vnew) feed_cost(i) = (Mnew / 60) * (Dav(i) * L) / (3.82 * frnew * vnew) Next For i = 1 To n Ft = Ft + feed_time(i) Fc = Fc + feed_cost(i) Next depth(i1) = dnew depth(i1) = Round(depth(i1), 2) passes(i1) = n mc_hr_rate(i1) = Mnew feedtime(i1) = Ft i1 = i1 + 1 End Sub Public Function setup(t0new, Mnew) Static i2 setup = (t0new / Nl) * Mnew / 60 setuptime(i2) = t0new i2 = i2 + 1 End Function Public Function No_passes(dnew) As Integer Dim max_matl As Single max_matl = (ID - Dfin) / 2 If ((max_matl * 100) Mod (dnew * 100) > 0 And (max_matl * 100) Mod (dnew * 100) <= 50) Then

125
No_passes = Round(max_matl / dnew) + 1 Else No_passes = Round(max_matl / dnew) End If End Function Public Function Tool_change(frnew, vnew, T, tcnew, Mnew) Static i3 Tool_change = (ID * L * tcnew * Mnew) / (3.82 * vnew * frnew * T * 60) toolchangetime(i3) = tcnew i3 = i3 + 1 End Function Public Function Rebrazing(Lrbnew, tbnew, k2new, typenew) Static i4 If (typenew <> "carbide tip") Then Rebrazing = 0 Else Rebrazing = (Lrbnew * tbnew) / (k2new * 60) End If rebtime(i4) = tbnew i4 = i4 + 1 End Function Public Function Resharpening(frnew, vnew, T, Gnew, tsnew, k2new, typenew) Static i5 time_tool_fails = (ID * L) / (3.82 * frnew * vnew * T) If (typenew = "carbide insert") Then Resharpening = 0 Else Resharpening = time_tool_fails * Gnew * tsnew / 60 End If restime(i5) = tsnew i5 = i5 + 1 End Function Public Function Carbide(Ccnew, Ft, T, typenew) 'Static i6 If (typenew <> "carbide insert") Then Carbide = 0 Else Carbide = (Ccnew / T) * Ft End If 'carbidecost(i6) = Carbide 'i6 = i6 + 1 End Function Public Function Grinding(frnew, vnew, T, Cw, typenew)

126
'Static i6 If (typenew = "carbide insert") Then Grinding = 0 Else Grinding = time_tool_fails * Cw End If 'grindcost(i6) = Grinding 'i6 = i6 + 1 End Function Public Function Material(matl_price, den) Static i7 Dim vol As Single, wt As Single vol = (3.14 * (ID / 2) ^ 2) * L * 16.38706 wt = vol * den * 0.000001 Material = wt * matl_price matprice(i7) = matl_price 'materialcost(i7) = Material matprice(i7) = Round(matprice(i7), 2) 'materialcost(i7) = Round(Material(i7), 2) i7 = i7 + 1 End Function Public Function Toollife(vnew, frnew, dnew, m1new, nnew, pnew, Cnew, typenew, k3new) Static i11 If (typenew <> "carbide insert") Then Toollife = (Cnew / ((frnew ^ m1new) * (dnew ^ pnew) * vnew)) ^ (1 / nnew) Else Toollife = ((Cnew / ((frnew ^ m1new) * (dnew ^ pnew) * vnew)) ^ (1 / nnew)) * k3new End If life(i11) = Toollife tool_type(i11) = typenew life(i11) = Round(life(i11), 2) i11 = i11 + 1 End Function Public Sub optimum(X7, X8, X9, C2, Costnew, dnew, Mnew) Static i8 X1 = Val(Form1.btext.Text) X2 = Val(Form1.ctext.Text) X3 = Val(Form1.etext.Text) X4 = Val(Form1.gtext.Text) X5 = Val(Form1.htext.Text)

127
X6 = Val(Form1.itext.Text) X10 = Val(Form1.Cstext.Text) X11 = Val(Form1.Cmtext.Text) D3 = 0 D4 = (1 - X7) / (X5 - X4 * X7) D2 = (X8 * (X5 - X4)) / (X5 - X4 * X7) D1 = 1 - D2 Csdash = X10 * (dnew ^ X6) / Form1.SFmaxtext.Text Cmdash = X11 * (dnew ^ X3) / Form1.HPmaxtext.Text C1dash = (3.14 * ID * L * Mnew) / (12 * 60) X12 = (C1dash * (dnew ^ (X9 / X8))) / (C2 ^ (1 / X8)) X13 = ((Mnew * tc / 60) + Costnew) * 60 / Mnew C2dash = X12 * X13 If (D2 >= 0 And D2 <= 1 And D4 >= 0) Then Dual_D2 = D2 Else Dual_D2 = "Not feasible" End If If (D2 >= 0 And D2 <= 1 And D4 >= 0) Then Dual_D4 = D4 Else Dual_D4 = "Not feasible" End If frnew = (Csdash ^ (1 / (X7 * X4 - X5))) * (C1dash * (1 - D1) / (C2dash * D1)) ^ (X8 * X4 / (X7 * X4 - X5)) vnew = 1 / (Csdash * (frnew ^ X5)) ^ (1 / X4) If (Dual_D2 = "Not feasible" Or Dual_D4 = "Not feasible") Then z1 = "not feasible" ' case 1 Else z1 = "ok" End If If z1 = "not feasible" Then D4 = 0 D3 = X1 / X9 If (D2 >= 0 And D2 <= 1 And D3 >= 0) Then Dual_D2 = "ok" Else Dual_D2 = " not feasible" End If If (D2 >= 0 And D2 <= 1 And D3 >= 0) Then Dual_D4 = "ok" Else Dual_D4 = " not feasible" End If If (Dual_D2 = "not feasible" Or Dual_D4 = " not feasible") Then z2 = "not feasible" ' case 2

128
Else z2 = "ok" End If End If If (z1 = "not feasible" And z2 = "not feasible") Then vnew = Exp((X5 * Log(Cmdash) - X2 * Log(Csdash)) / (X4 * X2 - X1 * X5)) frnew = Exp((X1 * Log(Csdash) - X4 * Log(Cmdash)) / (X4 * X2 - X1 * X5)) End If speed(i8) = vnew speed(i8) = Round(speed(i8), 2) feed(i8) = frnew feed(i8) = Round(feed(i8), 4) i8 = i8 + 1 End Sub Public Function reworkcost() Static i10 no_parts_reworked = (ubs - Nl) * (per_rework / 100) reworkcost = (no_parts_reworked * reworkrate) / ubs 'rew(i10) = reworkcost rewrate(i10) = reworkrate rewquant(i10) = no_parts_reworked rewper(i10) = per_rework 'rew(i10) = Round(rew(i10), 2) rewrate(i10) = Round(rewrate(i10), 2) rewquant(i10) = Round(rewquant(i10), 2) rewper(i10) = Round(rewper(i10), 2) i10 = i10 + 1 End Function Public Sub sort() Dim Per(5) As Single Dim i As Integer, j As Integer Dim tempA As Single, tempB As String Arr1(0) = feedcost Arr1(1) = rtc Arr1(2) = stc Arr1(3) = tcc Arr1(4) = lcc Arr1(5) = rbc Arr1(6) = rsc Arr1(7) = cic Arr1(8) = grc Arr1(9) = matlcost Arr1(10) = rwc Arr2(0) = "Feeding Cost" Arr2(1) = "Rapid Traverse Cost" Arr2(2) = "Setup Cost"

129
Arr2(3) = "Tool Changing Cost" Arr2(4) = "Loading and Unloading Cost" Arr2(5) = "Rabrazing Cost" Arr2(6) = "Resharpening Cost" Arr2(7) = "Carbide Insert Cost" Arr2(8) = "Grinding Wheel Cost" Arr2(9) = "Material Cost" Arr2(10) = "Rework Cost" For i = 0 To 10 For j = 1 To 10 If (Arr1(j) < Arr1(j + 1)) Then tempA = Arr1(j) Arr1(j) = Arr1(j + 1) Arr1(j + 1) = tempA tempB = Arr2(j) Arr2(j) = Arr2(j + 1) Arr2(j + 1) = tempB End If Next j Next i End Sub Public Sub calculate(dnew, m1new, nnew, pnew, Cnew, Costnew, Mnew, typenew, Gnew, Cwnew, tsnew, Lrbnew, tbnew, k2new, k3new, rnew, tcnew, tlnew, t0new) Static i9 Call optimum(m1new, nnew, pnew, Cnew, Costnew, dnew, Mnew) T = Toollife(vnew, frnew, dnew, m1new, nnew, pnew, Cnew, typenew, k3new) Call feeding(dnew, rejectionrate, Mnew, vnew, frnew) feedcost = Fc rtc = (a + L + e) * No_passes(dnew) * Mnew / (rnew * 60) stc = setup(t0new, Mnew) tcc = Tool_change(frnew, vnew, T, tcnew, Mnew) lcc = tlnew * Mnew / 60 tmtc = feedcost + rtc + stc + tcc + lcc If (typenew = "hss") Then rsc = Resharpening(frnew, vnew, T, Gnew, tsnew, k2new, typenew) grc = Grinding(frnew, vnew, T, Cwnew, typenew) cic = 0 ElseIf (typenew = "carbide tip") Then rsc = Resharpening(frnew, vnew, T, Gnew, tsnew, k2new, typenew) rbc = Rebrazing(Lrbnew, tbnew, k2new, typenew) grc = Grinding(frnew, vnew, T, Cwnew, typenew) cic = 0 Else rsc = 0 grc = 0 rbc = 0

130
cic = Carbide(Costnew, Ft, T, typenew) End If 'tmtc = feedcost + rtc + stc + tcc + lcc toolcost = rbc + rsc + cic + grc matlcost = Material(matl_price, den) rwc = reworkcost() totalcost = ubs * (tmtc + toolcost + matlcost + rwc) unitcost = totalcost / Nl unit(i9) = unitcost feedingcost(i9) = feedcost rapidcost(i9) = rtc setupcost(i9) = stc toolchcost(i9) = tcc loadcost(i9) = lcc rescost(i9) = rsc rebcost(i9) = rbc grindcost(i9) = grc carbidecost(i9) = cic materialcost(i9) = matlcost rew(i9) = rwc rapidrate(i9) = rnew loadunloadtime(i9) = tlnew loadunloadtime(i9) = Round(loadunloadtime(i9), 2) unit(i9) = Round(unit(i9), 2) feedingcost(i9) = Round(feedingcost(i9), 2) rapidcost(i9) = Round(rapidcost(i9), 2) setupcost(i9) = Round(setupcost(i9), 2) toolchcost(i9) = Round(toolchcost(i9), 2) loadcost(i9) = Round(loadcost(i9), 2) rescost(i9) = Round(rescost(i9), 2) rebcost(i9) = Round(rebcost(i9), 2) grindcost(i9) = Round(grindcost(i9), 2) carbidecost(i9) = Round(carbidecost(i9), 2) materialcost(i9) = Round(materialcost(i9), 2) rew(i9) = Round(rew(i9), 2) feedtime(i9) = Round(feedtime(i9), 2) i9 = i9 + 1 count = i9 End Sub