design - mitweb.mit.edu/flowcytometry/www/bd-horizon-tour-2016-design.pdf · design what you need...
TRANSCRIPT
DesignWhat you need to know before designing a panel
1The BD Horizon™ Global Tour |
For Research Use Only. Not for use in diagnostic or therapeutic procedures.
Alexa Fluor® is a registered trademark of Life Technologies Corporation.
Cy™ is a trademark of GE Healthcare. Cy™ dyes are subject to proprietary rights of GE Healthcare and Carnegie Mellon University and are made and sold under licensefrom GE Healthcare only for research and in vitro diagnostic use. Any other use requiresa commercial sublicense from GE Healthcare, 800 Centennial Avenue, Piscataway, NJ 08855-1327, USA.
Trademarks are the property of their respective owners.
© 2016 BD. BD, the BD Logo and all other trademarks are property of Becton, Dickinson and Company.

Elements of multicolor flow cytometry
Considerations in designing panels:
The BD Horizon™ Global Tour | 2
Fluorochromecharacteristics and
availability
InstrumentQC and setup;
spillover
Biologycell type, antigen
characteristics

FluorochromesExpanding the range of choices to reveal biological context
The BD Horizon™ Global Tour | 3

Fluorochromes reveal biology
• The proper choice of fluorochrome helps us understand more about the biology of the experiment.
• Bright dyes are important when looking at dim antigens.
The BD Horizon™ Global Tour | 4
CD
3
BV421
V450 FITCPerCP-Cy™5.5
PE PE-CF594 Alexa Fluor®
647
Alexa Fluor®
700
CD197 (CCR7)

Evolution of fluorochromes
• 380 CD markers
• Intracellular proteins
– Cytokines
– Cell signaling
– Transcription factors
– Phosphoproteins
• The availability of fluorochromeshas driven major advances in flow cytometry.
The BD Horizon™ Global Tour | 5
0
5
10
15
20
25
1960 1980 2000 2020N
um
ber o
f co
lors
Year
Organic dyes
Phycobiliproteins
Qdots®
Sirigenpolymers
Tandems(protein)
CD Nomenclature 2015: Human Leukocyte Differentiation Antigen Workshops as a Driving Force in
Immunology. Engel P, Boumsell L, Balderas R, et al. J Immunol. 2015 Nov 15;195(10):4555-4563.

Sirigen polymer technology– High-sensitivity fluorescence
• Bright fluorescent materials
• Large collective optical response
• Efficient energy donors
• Amplified dye emission
• Reproducible synthetic framework
-conjugated polymersDirect reporters
h hh hh
Intense dye emission
Tandem reporters

BD Horizon Brilliant™ Violet dyes
• Bright dyes
• Limited cross laser excitation
• Compatible with surface and intracellular targets
The BD Horizon™ Global Tour | 7
BV421 BV480 BV510 BV605 BV650 BV711 BV786
• Seven dyes excited by the violet laser
– Base polymers: BV421, BV510 and BV480new
– Tandems: BV605, BV650, BV711 and BV786

CD4 resolution comparison
The BD Horizon™ Global Tour | 8
FITC: 61 PE: 211 BV421:703 BV510:125
BV605: 118 BV650: 284 BV711: 315 BV786: 333
Stain index

BD Horizon Brilliant™ Ultraviolet dyes
• Six fluorochromes excited by the 355-nm UV laser– Base polymer: BUV395
– Tandems: BUV496, BUV563, BUV661, BUV737, BUV805
• Designed for reduced spillover into violet channels
• Bring phenotyping to the UV-laser line
The BD Horizon™ Global Tour | 9
BUV395 BUV496 BUV563 BUV661 BUV737 BUV805

CD4 resolution comparison
The BD Horizon™ Global Tour | 10
FITC: 61 PE:211 BUV395: 63 BUV661: 321
BUV737: 196 BUV496: 59 BUV805: 44
Stain index

Many fluorochrome choicesEmission
Laser
Ultraviolet(355 nm)
BUV395 BUV496 BUV563 BUV661 BUV737 BUV805
Violet(405 nm)
BV421V450
BV480BV510V500
BV605 BV650 BV711 BV786
Blue(488 nm)
BB515FITC
Alexa Fluor®
488
PE PE-CF594 PE-Cy™5PerCP
PerCP-Cy5.5PE-Cy™7
Yellow/Green(561 nm)
PE PE-CF594 PE-Cy5 PE-Cy5.5 PE-Cy7
Red(640 nm)
APCAlexa Fluor®
647
APC-R700Alexa Fluor®
700
APC-H7APC-Cy7
Choice of fluorochromes depends on the available instrument configuration
and the total number of markers being used in an experiment.

Understand instrument configuration
• The fluorochrome choice must be compatible with the instrument being used.
• Reconfiguration might be necessary to take full advantage of the BD Horizon Brilliant Violet and Ultraviolet portfolio.
• Reconfiguration allows for expansion of the instruments’ capability.
The BD Horizon™ Global Tour | 12

Choose fluorochromes based on configuration
The BD Horizon™ Global Tour | 13
BD Accuri C6BD FACSVerse
BD FACSCanto II
BD FACSVerse
BD FACSCanto II
BD LSRFortessa
BD LSRFortessa X-20
BD LSRFortessa
BD LSRFortessa X-20
Blue(488 nm)
BB515/FITC
PE
PerCP-Cy5.5
BB515/FITC
PE
PerCP-Cy5.5
PE-Cy7
BB515/FITC
PE
PerCP-Cy5.5
PE-Cy7
BB515/FITC
PE
PE-CF594
PerCP-Cy5.5
PE-Cy7
BB515/FITC
PerCP-Cy5.5
Red(640 nm)
APCAPC
APC-H7/APC-Cy7
APC
APC-H7/APC-Cy7
APC
APC-R700
APC-H7/APC-Cy7
APC
APC-R700
APC-H7/APC-Cy7
Violet(405 nm)
BV421/V450
BV510/V500
BV421/V450
BV510/V500
BV605
BV650
BV711
BV786
BV421/V450
BV510/V500
BV605
BV650
BV711
BV786
Yellow/Green (561 nm)
PE
PE-CF594
PE-Cy5
PE-Cy7
Ultra-violet (355 nm)
BUV395
BUV496
BUV661
BUV737
BUV805
BUV395
BUV496
BUV661
BUV737
BUV805
# Lasers 2 2 3 4 5
# Colors 4 6 8 18 18
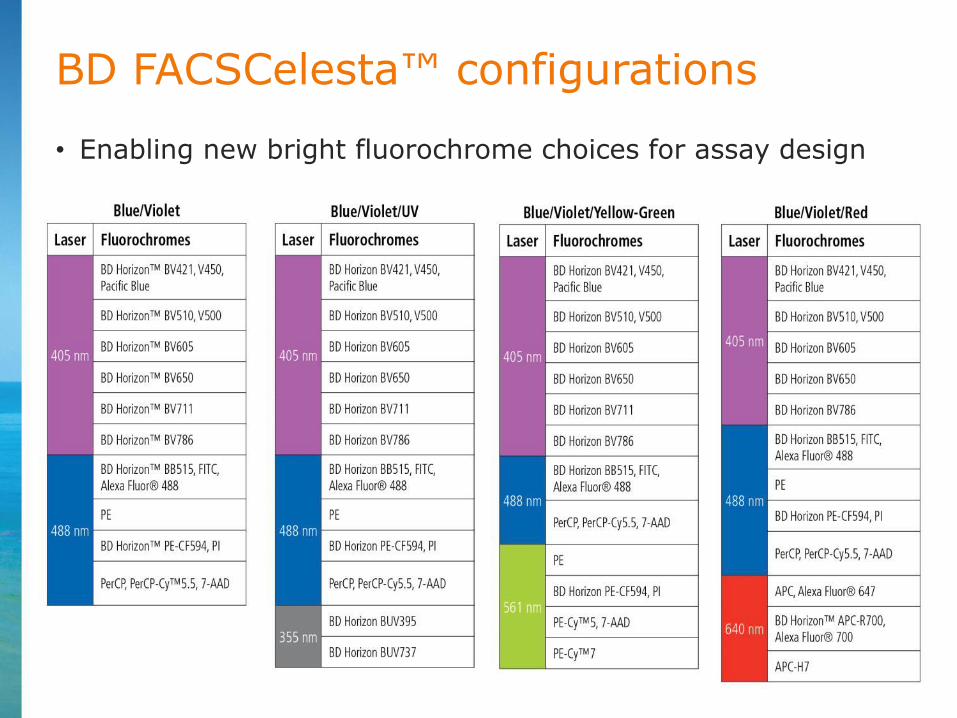
BD FACSCelesta™ configurations
• Enabling new bright fluorochrome choices for assay design

Fluorochrome resolution ranking
• Rankings were determined by comparing the resolution of LWB cells stained on several clones run on a variety of flow cytometers.
• Many factors can influence the relative fluorochrome/reagent performance on a given instrument, including laser power, PMT voltage, optical filters, antibody clone, biological sample and staining methodology.
Fluorochrome
Very bright Bright Moderate Dim
Laser
Ultraviolet(355 nm)
BD Horizon BUV661BD Horizon BUV737BD Horizon BUV563
BD Horizon BUV395BD Horizon BUV496
BD Horizon BUV805
Violet(405 nm)
BD Horizon BV421BD Horizon BV650 BD Horizon BV711
BD Horizon BV480BD Horizon BV605BD Horizon BV786
BD Horizon BV510BD Horizon V450BD Horizon V500
Blue(488 nm)
BD Horizon BB515BD Horizon PE-CF594
PE-Cy5
PEPE-Cy7
FITCAlexa Fluor® 488
PerCP-Cy5.5PerCP
Yellow/Green(561 nm)
PEBD Horizon PE-CF594
PE-Cy5PE-Cy7
Red(640 nm)
APCAlexa Fluor® 647
BD Horizon APC-R700
Alexa Fluor® 700APC-H7APC-Cy7

Know your biologyAntigen density and co-expression influence panel design
The BD Horizon™ Global Tour | 16

Elements of multicolor flow cytometry
Considerations in designing panels:
The BD Horizon™ Global Tour | 17
Fluorochromecharacteristics and
availability
InstrumentQC and setup;
spillover
Biologycell type, antigen
characteristics

Classification of antigens
Leucocyte antigens can be categorized based upon their patterns of expression:
• Primary: Well characterized, easily classified as positive or negative, typically define broad subsets or lineages– Examples: CD3, CD4, CD19
• Secondary: Well characterized, typically expressed at a higher density, often over a continuum
– Examples: CD27, CD28, CD45RA, CD45RO
• Tertiary: Expressed at low levels, variable upon activation unknown, critical
– Examples: CD25, STAT5, FoxP3
CD25
CD45RA
CD4
Mahnke YD, Roederer M. Optimizing a multicolor immunophenotyping assay. Clin Lab Med. 2007;27:469-485.

Grouping antigen density: T-cells
• When evaluating antigen density, it can be useful to group antigens based on their relative levels of expression.
19
400
1,000
10,000
4,000
40,000
100,000
Rela
tive R
ecep
tor
Nu
mb
er
High>15,000
Medium1,000–15,000
Low<1,000
100
Average number of molecules on T cells
BD LSRFortessa™
BD FACSVerse™
Sample

Different subpopulations can express the same antigen at different densities
• Antigen density should be evaluated at the level of the subpopulations of interest.
– Example: for all T-cells, CD45RO has an average density of 15,000.
• Expression on individual subpopulations can vary 300-fold.
• For novel populations, you might need to do test analyses to assess antigen density on your specific population.
– Densities can be expressed as ratios of the median fluorescence intensity (MFI) of a known antigen vs the test antigen using the same fluorochrome.
CD3+ CD8+ T cells
CD45RO
CD
45
RA
CCR7

BD antigen expression projectProviding the scientific community information on antigen density and co-expression
The BD Horizon™ Global Tour | 21

Antigen density project
• Antigen density analyses were performed on blood cells from 12 individuals, covering a range of ages and genders (3 male/3 female each from young/old groups).
• Each antigen of interest was measured using a PE-conjugated antibody.
The BD Horizon™ Global Tour | 22
Antibodies in panel Cell populations identified
Panel 1(B/T)
CD3, CD4, CD8, CD25, CD127,
CD45RA, CCR7, CD19, IgD, CD27
• Naïve, EM, CM and TEMRA populations (defined by CD45RA and CCR7) from CD8 and Th cell subsets
• CD45RA+ Tregs• CD45RA− Tregs
• Naïve B-cells• Non-class-switched
memory B-cells• Class-switched memory
B-cells
Panel 2(non‐B/T)
CD61, CD45, CD3, CD19, CD14, CD16,
CD56, HLA-DR CD123,
CD11c
• Platelets • Neutrophils• Basophils • Eosinophils• Monocytes (subsets based on
CD14 and CD16)
• CD56dimCD16+ NK-cells• CD56bright NK-cells• NKT-cells (CD3+ CD56+)• mDCs• pDCs

Antigen density: B-cell and T-cell panel
Fluorochrome Marker
BD Horizon™ V450 CD45RA
BD Horizon™ V500 CD3
FITC CD4 + IgD
PerCP-Cy™5.5 CD19
PE Drop-in
PE-Cy™5 CD25
PE-Cy™7 CD127
Alexa Fluor® 647 CCR7
Alexa Fluor® 700 CD27
APC-H7 CD8
The BD Horizon™ Global Tour | 23

Antigen density: B-cell and T-cell panel
Fluorochrome Marker
BD Horizon™ V450 CD45RA
BD Horizon™ V500 CD3
FITC CD4 + IgD
PerCP-Cy™5.5 CD19
PE Drop-in
PE-Cy™5 CD25
PE-Cy™7 CD127
Alexa Fluor® 647 CCR7
Alexa Fluor® 700 CD27
APC-H7 CD8
The BD Horizon™ Global Tour | 24
Lymphocytes
CD19
CD
3
CD8 T-cells
CD45RA
CC
R7
B-cells
IgD
CD
27
Th cells
CC
R7
CD4
CD
8
Tregs
CC
R7
CD4 T-cells
CD25
Singlets
FS
C
SSC
CD
12
7
CD3+ lymphocytes
CD45RA CD45RA

Antigen density: B-cell and T-cell panel
The BD Horizon™ Global Tour | 25
CD45RA
B-cells
IgD
CD
27
CD8 T-cells Th cells Tregs
CC
R7
CD45RACD45RACD45RA
CC
R7
CC
R7
FM
OP
E
CD
45
RO
PE
APE (FMO or CD45RO)

Summary: antigen density study
• Complements the information provided by the BD Biosciences Human CD Marker Chart (additional specificities from other vendors to increase specificities to >350).
• Provides information on antigen expression in common lymphocyte cell subpopulations.
• Enables optimal panel design by guiding the selection of antigen-fluorochrome combinations.
~400 cell surface markers analyzed100
% Positive
0

Antigen expressionDefining the biology of your assay
The BD Horizon™ Global Tour | 27

Antigen expression
• Conjugated antibodies used to define specific cell types should be selected with spectrally distinct fluorochrome labels.
• Basic concept of panel design:– “for low expressed antigens use brightest available
fluorochrome”.
• What does this mean for the possible markers for a T-cell panel?– CD3, CD4, CD8, CD45RA, CD27, CCR7, CD25, CD127
The BD Horizon™ Global Tour | 28

Defining the biology of your assay
• Define a population tree based on the goals of the assay.
• Identify the critical populations.
• Determine which antigens are co-expressed and at what levels.
CD4+CD8+
CD25+
CD127+
CD45RA+
CCR7+CD45RA-
CCR7-CD45RA+
CCR7+
CD45RA-CCR7-
CD3+
Ag TregsCD4 naïve
T cellsCD4 memory
T cellsCD8 naïve
T cellsCD8 memory
T cells
CD3
CD4
CD8
CD45RA
CD127
CD25
CCR7
Ag TregsCD4 naïve
T-cellsCD4 memory
T-cellsCD8 naïve
T-cellsCD8 memory
T-cells
CD3
CD4 X X
CD8 X X X
CD45RA
CD127 X
CD25 X X
CCR7 X
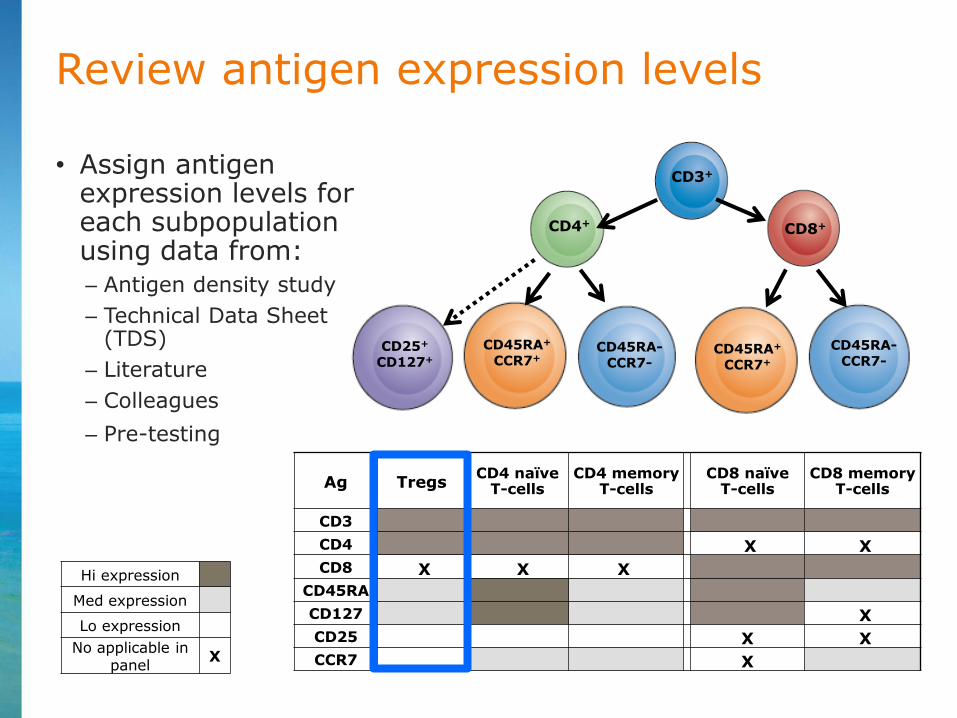
Review antigen expression levels
• Assign antigen expression levels for each subpopulation using data from:– Antigen density study
– Technical Data Sheet (TDS)
– Literature
– Colleagues
– Pre-testing
Hi expression
Med expression
Lo expression
No applicable in panel
X
CD4+CD8+
CD25+
CD127+
CD45RA+
CCR7+CD45RA-
CCR7-
CD45RA-CCR7-
CD3+
CD45RA+
CCR7+

Antigen/fluorochrome combinations
High Low Medium
Fluorochrome
Very Bright Bright Moderate Dim
Laser
Ultraviolet(355 nm)
BD Horizon BUV661BD Horizon BUV737BD Horizon BUV563
BD Horizon BUV395BD Horizon BUV496
BD HorizonBUV805
Violet(405 nm)
BD Horizon BV421BD Horizon BV650 BD Horizon BV711
BD Horizon BV480BD Horizon BV605BD Horizon BV786
BD Horizon BV510BD Horizon V450BD Horizon V500
Blue(488 nm)
BD Horizon BB515BD Horizon PE-
CF594PE-Cy5
PEPE-Cy7
FITCAlexa Fluor® 488
PerCP-Cy5.5PerCP
Yellow/Green(561 nm)
PEBD Horizon PE-
CF594PE-Cy5PE-Cy7
Red(640 nm)
APCAlexa Fluor® 647
BD Horizon APC-R700
Alexa Fluor® 700APC-H7APC-Cy7

Elements of multicolor flow cytometry
Considerations in designing panels:
The BD Horizon™ Global Tour | 32
Fluorochromecharacteristics and
availability
InstrumentQC and setup;
spillover
Biologycell type, antigen
characteristics
InstrumentSetting up your instrument to maximize resolution and consistency
The BD Horizon™ Global Tour | 33

Negative population has low background; populations well resolved.
“Negative” Dim Bright
Resolution vs background
• Resolution: The degree to which a flow cytometer can distinguish dimly stained cells from unstained cells.
• This can be challenging in a polychromatic scenario.
The ability to resolve
populations is a function
of both backgroundand spread
of the negative
population.
Negative population has high background; populations not resolved.
Negative population has low background but high rSD(spread); populations not resolved.

Fluorescence spillover
The BD Horizon™ Global Tour | 35

Factors impacting resolution
The BD Horizon™ Global Tour |36

Why do we care about fluorescence spillover?
• Resolution of populations in multicolor panels– Fluorescence spillover is an important factor in creating a
panel design with good resolution of populations of interest.
• Visualization of multicolor data– Incorrect or poor calculation of spillover values (SOVs)
negatively impacts the quality of data obtained from an assay.
The BD Horizon™ Global Tour | 37

This “background” is subtracted in the process called compensation.
PerCP-Cy5.5
PE
-Cy7 rSD
Fluorescence spillover introduces background and spread into other detectors
Negative Positive
MFI rSD MFI rSD
No comp
12 3,098
Comp
29 291
Fluorochromes spill over into other detectors; for example, PerCP-Cy5.5 spills into the PE-Cy7 detector.
This fluorescence spillover contributes to:
• Increased background (MFI)
• Spread (measured as rSD)

PerCP-Cy5.5
PE
-Cy7 rSD
Fluorescence spillover introduces background and spread into other detectors
Negative Positive
MFI rSD MFI rSD
No comp
12 3,098
Comp
This “background” is subtracted in the process called compensation.
29 291
Fluorochromes spill over into other detectors; for example, PerCP-Cy5.5 spills into the PE-Cy7 detector.
This fluorescence spillover contributes to:
• Increased background (MFI)
• Spread (measures as rSD)
29 2894 3
PE
-Cy7
PerCP-Cy5.5
A sample is correctly compensated when, in the spillover detector (PE-Cy7), the MFI of the positive population is equivalent to that of the negative population.
However, the spread introduced by the spillover is not removed by the compensation and reduces the resolution (SI) of any double-positive cells.

What are some sources of spillover?
The BD Horizon™ Global Tour | 40
Similaremission spectra
(cross-laser)BUV737 and BV711
Residual basefluorescence
BV786 and BV421
Adjacent detectors
FITC and PE

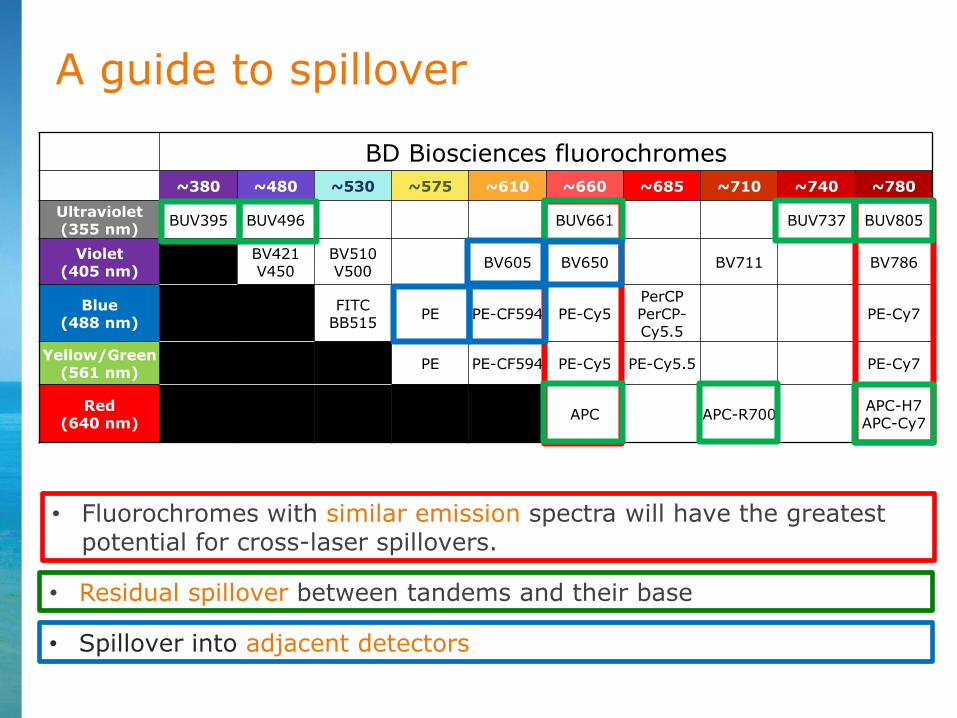
A guide to spillover
BD Biosciences fluorochromes
~380 ~480 ~530 ~575 ~610 ~660 ~685 ~710 ~740 ~780
Ultraviolet(355 nm)
BUV395 BUV496 BUV661 BUV737 BUV805
Violet(405 nm)
BV421V450
BV510V500
BV605 BV650 BV711 BV786
Blue(488 nm)
FITCBB515
PE PE-CF594 PE-Cy5PerCPPerCP-Cy5.5
PE-Cy7
Yellow/Green(561 nm)
PE PE-CF594 PE-Cy5 PE-Cy5.5 PE-Cy7
Red(640 nm)
APC APC-R700APC-H7APC-Cy7
• Fluorochromes with similar emission spectra will have the greatest potential for cross-laser spillovers.
• Residual spillover between tandems and their base
• Spillover into adjacent detectors

Conclusion
Considerations in designing panels:
The BD Horizon™ Global Tour | 43
Fluorochromecharacteristics and
availability
Instrument QC and setup;
spillover
Biology:cell type, antigen
characteristics