design principle of a flywheel regenerative braking system
TRANSCRIPT
DESIGN PRINCIPLES OF A FLYWHEEL REGENERATIVE BRAKING SYSTEM
(F-RBS) FOR FORMULA SAE TYPE RACECAR AND SYSTEM TESTING ON A
VIRTUAL TEST RIG MODELED ON MSC ADAMS
BY
Anirudh Pochiraju
Submitted to the graduate degree program in Mechanical Engineering and the Graduate Faculty of
the University Of Kansas School Of Engineering in partial fulfillment of the requirements for the degree
of Master of Science.
Committee:
______________________
Prof. Dr. Robert M. Sorem, Chairperson
______________________
Prof. Dr. Terry Faddis, Committee Member
______________________
Prof. Robert C. Umholtz, Committee Member
Date Defended: _________________
ii
The Thesis Committee for Anirudh Pochiraju certifies that this is the approved version of the
following thesis:
DESIGN PRINCIPLES OF A FLYWHEEL REGENERATIVE BRAKING SYSTEM
(F-RBS) FOR FORMULA SAE TYPE RACECAR AND SYSTEM TESTING ON A
VIRTUAL TEST RIG MODELED ON MSC ADAMS
______________________
Prof. Dr. Robert M. Sorem, Chairperson
Date Approved: _________________

iii
To
Amma, Nanna, and Vooha
iv
ABSTRACT
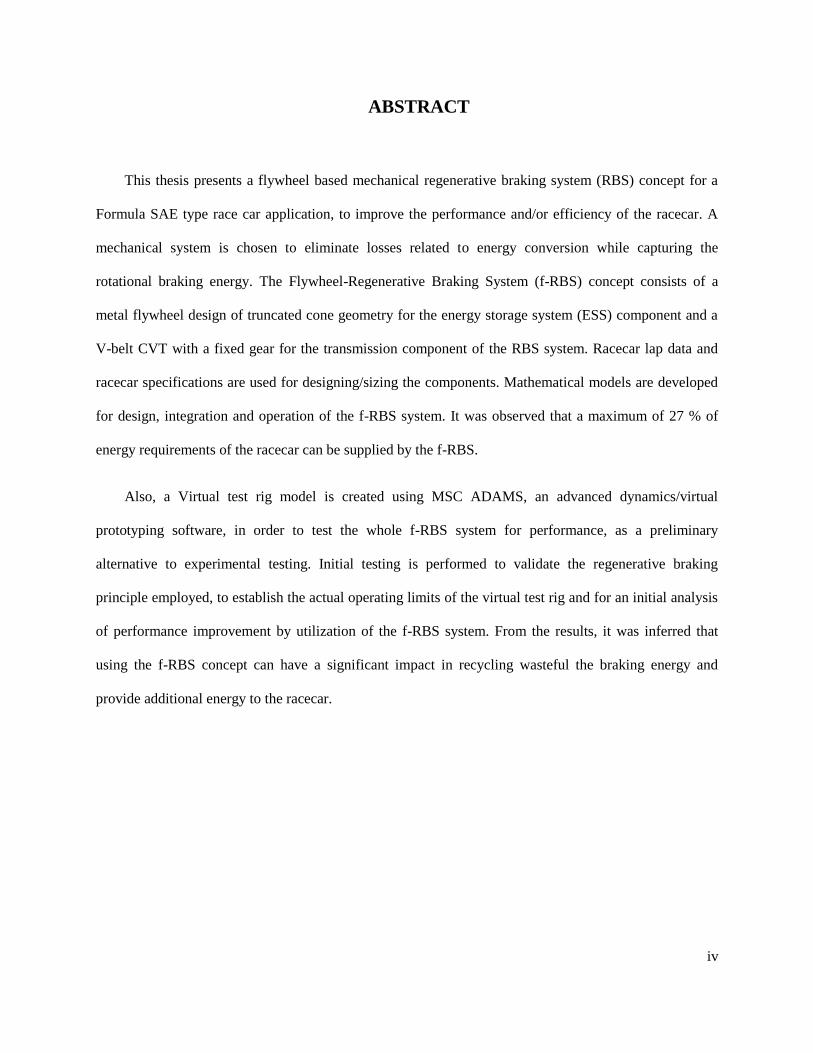
This thesis presents a flywheel based mechanical regenerative braking system (RBS) concept for a
Formula SAE type race car application, to improve the performance and/or efficiency of the racecar. A
mechanical system is chosen to eliminate losses related to energy conversion while capturing the
rotational braking energy. The Flywheel-Regenerative Braking System (f-RBS) concept consists of a
metal flywheel design of truncated cone geometry for the energy storage system (ESS) component and a
V-belt CVT with a fixed gear for the transmission component of the RBS system. Racecar lap data and
racecar specifications are used for designing/sizing the components. Mathematical models are developed
for design, integration and operation of the f-RBS system. It was observed that a maximum of 27 % of
energy requirements of the racecar can be supplied by the f-RBS.
Also, a Virtual test rig model is created using MSC ADAMS, an advanced dynamics/virtual
prototyping software, in order to test the whole f-RBS system for performance, as a preliminary
alternative to experimental testing. Initial testing is performed to validate the regenerative braking
principle employed, to establish the actual operating limits of the virtual test rig and for an initial analysis
of performance improvement by utilization of the f-RBS system. From the results, it was inferred that
using the f-RBS concept can have a significant impact in recycling wasteful the braking energy and
provide additional energy to the racecar.
v
ACKNOWLEDGEMENT
I would like to thank, first and foremost, my parents and my sister, for the unconditional and
continuous support, through their thick and thin that they faced due to my prolonged research work.
I would like to specially thank my research advisor and mentor, Dr. Robert Sorem for, guiding me
throughout my research and being an extremely cool and calm support system throughout. It has been an
honor working under his guidance. For the last four years, he has been an excellent teacher not only in
terms of the fundamentals in Automobile and mechanical engineering, but also in guiding me to make my
own decisions and providing a zeal and motivation towards learning.
I would also like to thank my research committee members- Prof. Robert Umholtz and Prof. Dr.
Terry Faddis for the opportunity to work with them, the guidance and the valuable inputs towards my
thesis document.
I would like to thank my brothers and sisters – Manayya, Wodina, Nitin-Nikhil and Sailakka
Papakka’s families, who have been the strong support for me through my academics and time in the
United States. Additionally, I would like to also thank my extended family – my relatives, and my friends
(especially Chandraprakash Tourani, Amool Raina, Madhan Sai, Akhilesh Katipally, Arun Sai, Vinay,
Kiran, Navadeep, Neerja, Nishant, Gaurav, Manooj, Arjun, Aparna, Roshan, Arun, Bunny Sundeep and
Padmini) for the help and unconditional support they gave throughout.
Lastly, but not the least, I would like to thank God for helping me achieve this milestone.
vi
TABLE OF CONTENTS
ABSTRACT ........................................................................................................................................ IV
ACKNOWLEDGEMENT ................................................................................................................... V
LIST OF TABLES ........................................................................................................................... VIII
LIST OF FIGURES ............................................................................................................................ IX
INTRODUCTION ................................................................................................................................ 1
1.0 Introduction .................................................................................................................................. 2
Preface ...................................................................................................................................... 2 1.1.0
Motivation ................................................................................................................................ 4 1.2.0
Problem Statement: .................................................................................................................. 5 1.3.0
Aims of Research ..................................................................................................................... 5 1.4.0
Design Goals ............................................................................................................................ 5 1.5.0
Methodology ............................................................................................................................ 6 1.6.0
Overview of the Thesis ............................................................................................................ 6 1.7.0
BACKGROUND .................................................................................................................................. 8
2.0 Regenerative Braking ................................................................................................................... 9
Introduction .............................................................................................................................. 9 2.1.0
Parts and Operation of an RBS .............................................................................................. 10 2.2.0
Types of ESS for RBS application ......................................................................................... 10 2.3.0
3.0 Flywheel based Regenerative Braking systems .......................................................................... 14
Introduction ............................................................................................................................ 14 3.1.0
Literature Review ................................................................................................................... 15 3.2.0
Transmission or Variator ........................................................................................................ 23 3.3.0
DESIGN AND DEVELOPMENT ...................................................................................................... 28
4.0 Introduction to the Concept and pre-design ............................................................................... 29
The RBS Concept or Flywheel RBS Concept or Concept Definition .................................... 30 4.1.0
Mechanical Transmission ....................................................................................................... 31 4.2.0
Overall Configuration ............................................................................................................ 31 4.3.0
Theory of Operation ............................................................................................................... 32 4.4.0
Energy Available for Braking ................................................................................................ 34 4.5.0
Mass Addition vs. Performance ............................................................................................. 38 4.6.0
5.0 CVT Design/Selection ................................................................................................................ 41
Modified Torque Converter Design ....................................................................................... 43 5.1.0
CVT Ratio Analysis ............................................................................................................... 44 5.2.0
6.0 Flywheel ..................................................................................................................................... 47
Design Basics ......................................................................................................................... 48 6.1.0
vii
Design of the Flywheel: ......................................................................................................... 51 6.2.0
Material Selection .................................................................................................................. 51 6.3.0
Geometry ................................................................................................................................ 52 6.4.0
Structural Analysis of the flywheel: ....................................................................................... 53 6.5.0
Mathematical Modeling of Vehicle with flywheel-Regenerative Braking System (f-RBS) .. 56 6.6.0
TESTING, RESULTS AND DISCUSSION ....................................................................................... 60
7.0 Testing ........................................................................................................................................ 61
About MSC ADAMS ............................................................................................................. 61 7.1.0
f-RBS Virtual Test Rig - ADAMS Model.............................................................................. 62 7.2.0
Preliminary testing ................................................................................................................. 66 7.3.0
Drive Cycle Testing ............................................................................................................... 68 7.4.0
Results and Discussion ........................................................................................................... 70 7.5.0
Applications of the ADAMS Virtual Test Rig Model ........................................................... 73 7.6.0
8.0 Closure ........................................................................................................................................ 75
Summary and Conclusion ...................................................................................................... 75 8.1.0
Future Scope ........................................................................................................................... 75 8.2.0
REFERENCES .................................................................................................................................... 77
APPENDIX ......................................................................................................................................... 80
viii
LIST OF TABLES
Table 1: Available Brake Energy from Lap Data ............................................................................... 38
Table 2: Race Car Specs ..................................................................................................................... 38
Table 3: Shape Factors for different flywheel geometries[1] .............................................................. 50
Table 4: List of design constraints for the flywheel ............................................................................ 51
Table 5: Specific strength for different materials ................................................................................ 52
Table 6: Final design parameters ........................................................................................................ 52
Table 7: Flywheel design (FW) dimensions and properties ................................................................ 53
Table 8: Parameters used for structural analysis and results of analysis ............................................. 53
Table 9: Vehicle Equivalent Wheel ADAMS model properties ......................................................... 63
Table 10: Drive Cycle Test Cases ....................................................................................................... 69
ix
LIST OF FIGURES
Figure 1 : Flywheel Propulsion for rapid rail cars, Garrett Ai Research Corporation(1974) [26] ...... 16
Figure 2: One Mode configuration of the Engine-Flywheel Hybrid Drive by GM [28] ..................... 18
Figure 3: ETH-Hybrid III Powertrain [15] .......................................................................................... 19
Figure 4: ZI Powertrain Layout [31] ................................................................................................... 21
Figure 5: Mechanical Energy Storage System - Brake Only Version [32] ......................................... 22
Figure 6: Flybrid KERS using Torotrak CVT [33] ............................................................................. 23
Figure 7: Electrical CVT [2] ............................................................................................................... 25
Figure 8: A Torotrak Toroidal CVT[36] ............................................................................................. 26
Figure 9 : Pulley Based CVT [38] ....................................................................................................... 27
Figure 10: Flywheel-RBS Concept ..................................................................................................... 31
Figure 11: Overall Configuration ........................................................................................................ 33
Figure 12: Velocity [km/h] vs. Time [s] Graph from DAQ Data ........................................................ 34
Figure 13: Translational Kinetic Energy [kJ] vs. Time [s] of the vehicle ........................................... 35
Figure 14: Change in Kinetic Energy [kJ] vs. Time [s] ...................................................................... 35
Figure 15: Change in Kinetic Energy (With Losses) vs. Time ........................................................... 36
Figure 16: Effect of mass addition in the performance of the vehicle ................................................ 39
Figure 17: Example of a ‘Torque Converter-Clutch’ type CVT used in ATVs- Comet System [44] . 43
Figure 18: Plot to determine the range of vehicle and flywheel operating speeds for a given range of
transmission ................................................................................................................................................ 45
Figure 19: von Mises Stress Plot of the flywheel design (FW) using Solidworks’ ‘Simulation’ FEA
module ........................................................................................................................................................ 54
Figure 20: Strain Plot for the flywheel design (FW) using Solidworks’ ‘Simulation’ FEA module ... 55
Figure 21: Deformation [mm] plot of the design (FW) using Solidworks’ ‘Simulation’ FEA module
.................................................................................................................................................................... 55
x
Figure 22: Factor of safety plot for the design (FW) using Solidworks’ ‘Simulation’ FEA module .. 56
Figure 23: Flywheel + CVT + Wheel [2] ............................................................................................ 57
Figure 24: Energy transfer during a gear change between a flywheel and wheel ............................... 58
Figure 25: Virtual Test Rig in ADAMS/View .................................................................................... 63
Figure 26: Drawing of V-Belt Part ...................................................................................................... 65
Figure 27: Macro establishing design points for belt model ............................................................... 66
Figure 28: Plot for Preliminary Test -II .............................................................................................. 68
Figure 29: Lap Data Drive Cycle - With Cases to be simulated on the Rig........................................ 69
Figure 30: Results of f-RBS simulated through part of lap as shown in Figure (29) .......................... 70
Figure 31: Plot of Case I – Comparison of Math model results and Virtual Test rig results .............. 71
Figure 32: Plot of Case II – Comparison of Math model results and Virtual Test rig results ............. 71
Figure 33: Plot of Case III – Comparison of Math model results and Virtual Test rig results ........... 72
Figure 34: Plot of Case IV – Comparison of Math model results and Virtual Test rig results ........... 72
Figure 35: Plot of Case V – Comparison of Math model results and Virtual Test rig results............. 73
Figure 36: Plot of Case VI – Comparison of Math model results and Virtual Test rig results ........... 73

1
INTRODUCTION
2
The Age of Industrialization, since the late 1800’s, has been nothing short of remarkable. The world
has vastly benefitted with the advancement of technology and knowledgebase which has brought about
enormous socio-economic progress and consequently raised the standard of living of humankind beyond
comprehension. Among the many resources which have played a major part in the growth, the role of
fossil fuels has been undeniably quite significant. But the reserves of these ‘nonrenewable’ fossil fuels are
rapidly declining and at the rate of growth of the humankind, the exhaustion of these resources in near
future in inevitable. This has been the one of the major causes of concern in the recent past. The other
major concern in the present day has been declining state of environment. The inefficient and excess
usage of fossil fuels has caused the pollution of the environment, to the extent of its breakdown. As a
result, over the past 40-50 years, the focus has shifted towards finding solutions which combat these
issues, with the major areas of concentration being – efficient usage of energy resources (fossil fuels) in
various applications like industry, transportation etc., finding alternative and/or renewable energy
resources to supplement/replace the fossil fuel, better control strategies and treatment techniques to
reduce pollution.[1]
Automobiles are one of the major consumers of fossil fuels and therefore: 1. One of the major
sectors responsible for their depletion to the extent of near exhaustion; 2. One of the major contributors to
the escalating environmental pollution levels. Due to these problems, in the recent past, the Auto Industry
has come to an impasse where they are left with no alternative but to find alternate solutions to conserve
natural resources. Over the years, the efforts in this direction have led to research and development in the
following areas: [2, 3]
1. Improving engine efficiencies and performance – with the help of innovation in engine design
and its components, improved control strategies etc.
1.0 INTRODUCTION
Preface 1.1.0
3
2. Emission treatment and control technologies.
3. Vehicle design changes for reduction of thermal, aerodynamic and road losses.
4. Improvised Transmission design to reduce losses.
5. Hybrid and Alternative Energy Propulsion systems e.g. the Hybrid Electric Vehicle (HEV), the
Fuel Cell Vehicle (FCV).
6. Recycling Braking energy – Storage and reuse of braking energy which is otherwise lost in the
form of heat energy – technology that achieves this purpose is termed as a Regenerative Braking
System (RBS).
With legislations in place for strict emission standards, the automobile industry currently has
embraced the new development, by embedding one or more of the above mentioned technologies in
commercial vehicles. Additionally, as a long term alternative to fossil fuels, the research in ‘Alternative
Energy Vehicles’, especially the field of ‘Hybrid Propulsion with Regenerative braking’ has come to the
forefront [4].
‘Hybrid Propulsion Vehicles (HPV)’ or ‘Hybrid Vehicles’ are vehicles in which two or more power
sources propel the vehicle, in order to share the load and hence improve performance/improve fuel
efficiency. Most of the current hybrid vehicles use an internal combustion engine (ICE) as one of the
power sources and an alternative energy source (electrochemical battery, Fuel cell etc.) for the other
source [5, 6]. By utilizing a hybrid powertrain, the load on the ICE reduces, as a result of which the size
of the ICE can be reduced. Reduction of an ICE implies better fuel efficiency. Alternatively/additionally
the ICE can be optimized to operate only in certain load conditions, which also results in improved fuel
efficiency. Overall, the result is a more efficient vehicle.
As an additional tool to improving efficiency, current hybrid vehicles also employ regenerative
braking to capture and utilize braking energy. Regenerative Braking Systems (RBS) capture the energy
that is usually lost while braking, store that energy in an energy storage system (ESS) and the reuse it to
4
start or accelerate the vehicle [7]. In case of HEVs, regenerative braking is easily implemented as the
electrical technology used to run the wheels is modified to also perform regenerative braking.
Designing and testing such a regenerative braking system for the application in a Formula racecar is
the topic of this research. The later part of this chapter is as follows: In the next section, the motivation for
the thesis is explained followed by the problem statement, after which the aims for the research and
design are set and methodology used is explained. The chapter concludes with the thesis outline.
Jayhawk Motorsports, University of Kansas is a student run organization that designs, manufactures,
and builds two race cars within the given school year [8]. It has been participating in annual student
design competition organized by SAE (Society of Automotive Engineers) – the Formula SAE for a little
more than 20 years. The Formula SAE is a mainly a design, build and racing competition of mini-Indy
type prototype racecars. These race cars are designed and manufactured by the students, in adherence to
the guidelines/constraints set by SAE and with the intended market to be of nonprofessional weekend
autocross racer. [6]
From 2011 onwards, Jayhawk Motorsports has decided to use its experience from Formula SAE and
start participating in Formula Hybrid as well. Formula Hybrid is a competition similar to Formula SAE
which involves designing, building and racing high performance hybrid and electric vehicles instead of
conventional one. In Formula Hybrid, the guidelines allow the racecar to be fitted with a regenerative
braking system [9]. It was observed that firstly in an autocross style racing with frequent braking events
there is a potential for a substantial amount of braking energy, secondly, fitting an RBS to the vehicle
would not only capture the braking energy, increase energy efficiency, but it could also provide the edge
in performance as long as the gain can outweigh the loss due to the extra weight addition. This presented
Motivation 1.2.0
5
an ideal opportunity for my research work – to study different types of RBS, choose, design and test a
certain RBS for the racecar.
To devise a regenerative braking solution for Formula racecar application, design the system and test
it on a virtual test bench.
1. To lay groundwork for building a completely optimized regenerative braking system for Formula
Hybrid racecar.
2. To design and test a viable model using computational simulation tools.
3. To find an optimum balance between the aims of design to design the system, but not
compromise on safety.
4. To recreate the whole system in ADAMS for virtual testing.
1. High energy density and power density – Enough to capture the available braking energy and
store the amount of energy needed to accelerate the vehicle.
2. High storage and transfer efficiency.
3. Conceptually and otherwise, simple and minimalistic in design.
4. Safe in operation.
5. Lightweight
6. Cost effective.
7. Easy to implement and operate.
Problem Statement: 1.3.0
Aims of Research 1.4.0
Design Goals 1.5.0
6
A thorough literature research was conducted in the areas of Regenerative Braking Systems (RBS)
and its related aspects. Based on the literature review, mechanical, electrical and hydraulic RBS were
found as potential contenders for the given application. The Flywheel or the mechanical RBS was chosen
for further development and its various configurations were explored. Parallel-drive (parallel to the
engine) acting on the front wheels consisting of flywheel and a continuously variable transmission (CVT)
was finalized as the design choice. Based on the available racetrack data and racecar specifications, the
potential and the requirements of the racecar were drawn i.e., the available braking energy, the energy
needed for acceleration boost and required power was calculated. The data was used in the design and
selection of individual components of the Flywheel RBS. [10]
A mathematical model demonstrating the CVT operation with the given design of flywheel was
constructed. In order to validate, a testing environment was created using the software MSC ADAMS.
The software MSC ADAMS is a “multi-body dynamics and motion analysis software” essentially used
for studying the dynamics of mechanical systems. It can used to “easily create and test virtual prototypes”
and hence was found appropriate for the application [11]. The Flywheel system prototype was built and
connected to a wheel (as a single substitute for the whole vehicle’s inertia) using ADAMS for the testing
model. Various tests were performed on the model with road and no-road conditions using ADAMS
Solver. The results from mathematical model were validated with the ADAMS simulation results and the
model was deemed viable for further development.
In the chapter 2, an in-depth review of regenerative braking systems (RBS), flywheel based RBS and
the parts of the RBS are presented. The chapter 3 deals with the design, analysis and drawing out of
mathematical model while in chapter 4 the simulations techniques and testing model for this problem
Methodology 1.6.0
Overview of the Thesis 1.7.0

7
using MSC ADAMS are presented. The final chapter deals with the details of the tests, its results,
comparisons and discussion on implications before it finally goes on to drawing out conclusions and
presenting the scope of future work.

8
BACKGROUND
9
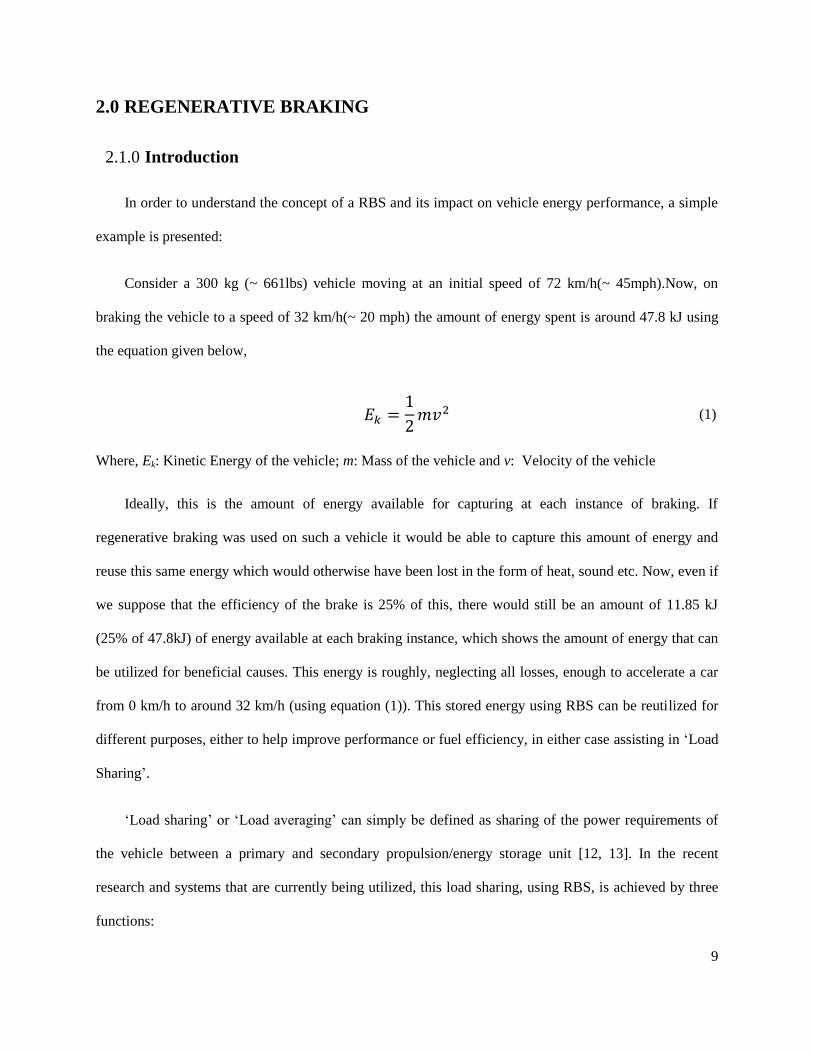
In order to understand the concept of a RBS and its impact on vehicle energy performance, a simple
example is presented:
Consider a 300 kg (~ 661lbs) vehicle moving at an initial speed of 72 km/h(~ 45mph).Now, on
braking the vehicle to a speed of 32 km/h(~ 20 mph) the amount of energy spent is around 47.8 kJ using
the equation given below,
(1)
Where, Ek: Kinetic Energy of the vehicle; m: Mass of the vehicle and v: Velocity of the vehicle
Ideally, this is the amount of energy available for capturing at each instance of braking. If
regenerative braking was used on such a vehicle it would be able to capture this amount of energy and
reuse this same energy which would otherwise have been lost in the form of heat, sound etc. Now, even if
we suppose that the efficiency of the brake is 25% of this, there would still be an amount of 11.85 kJ
(25% of 47.8kJ) of energy available at each braking instance, which shows the amount of energy that can
be utilized for beneficial causes. This energy is roughly, neglecting all losses, enough to accelerate a car
from 0 km/h to around 32 km/h (using equation (1)). This stored energy using RBS can be reutilized for
different purposes, either to help improve performance or fuel efficiency, in either case assisting in ‘Load
Sharing’.
‘Load sharing’ or ‘Load averaging’ can simply be defined as sharing of the power requirements of
the vehicle between a primary and secondary propulsion/energy storage unit [12, 13]. In the recent
research and systems that are currently being utilized, this load sharing, using RBS, is achieved by three
functions:
2.0 REGENERATIVE BRAKING
Introduction 2.1.0
10
1. Providing acceleration boost, in required situations (hence some of the peak power requirements
are being handled by RBS).
2. Idling requirements: during idling the engine can be switched off and the energy stored in RBS
can used to restart the vehicle and the engine. [14]
3. Supplemental propulsion unit for peak/ non-peak power requirements. [15]
In this whole process, RBS also essentially functions as a brake system. But due to heavy torque
demands at emergency braking situations RBS alone would not be sufficient; hence it needs to be a
system supplemental to existing proven friction braking.
An RBS mainly consists of two parts – the Transmission and the Energy Storage system (ESS).
Depending on the arrangement of the RBS, the transmission is made to transmit energy from the wheels
(or drivetrain) to/ the ESS and vice-versa. ESS can store the kinetic energy in different forms depending
its type [1]. The RBS and its types can be classified on the basis of the type of energy storage system
(ESS) and the type of transmission. The choice for the transmission is usually dependent and subsequent
or the type of ESS is selected.
2.3.1.0 Electrochemical Battery:
In an electrochemical battery, the energy is stored in the form of chemical energy and released in
the form of electrical energy. These have been one of the most preferred forms of energy storage systems
adopted across a wide range of applications due to their compactness and cost. Batteries are also
commonly used in modern automobiles to power accessories and for startup of the internal combustion
engine. In recent years, in the search of alternative means of propulsion there has been extensive research
and development in batteries as a good form of ESS for automobiles. This has resulted in the advent of
Parts and Operation of an RBS 2.2.0
Types of ESS for RBS application 2.3.0
11
the ‘battery electric vehicle’ (BEV) and the hybrid electric vehicle(HEV), which have gained momentum
in the industry [4]. These vehicles (BEVs and HEVS) use electric motor/generator pairs to propel
themselves and to recapture braking energy (electric RBS) and the power source is the battery. The
regenerative braking system uses a generator at the wheels or drivetrain to convert the rotational energy
into electrical and store them in the battery, and when needed the electric motor utilizes the same energy
to impart momentum to the vehicle.
However, the electric battery has had its demerits. One of the demerits of the electric battery is the
inherent losses that accompany the energy transformations, due to which, the transfer efficiency can be
quite low [16]. The other demerits are that, they have a low specific power (power per unit weight of
storage system), a low storage efficiency which diminishes which each charge/discharge cycle and lack of
required service life span. These reasons contribute to a limited range for battery electric vehicle (BEV)
due to which, hybrid electric vehicles (HEVs) have become fairly more successful as they use an internal
combustion engine, with its relatively high specific energy and power, to supplement the battery. There
has been ongoing research into other electrochemical batteries like Li-ion and NiMH etc., for better
performance for these applications. [4]
2.3.2.0 Ultra Capacitor Storage
Ultra capacitors are special capacitors which have the capacity to store considerable electrical energy
at low voltage [4]. In a capacitor, the electrical energy is stored in the form of positive and negative
charges. These unlike charges are separated and stored in two parallel plates with an insulator between
them. Here the capacity to store energy is directly proportional to the area of the plates and the
permittivity of the insulator/dielectric and inversely proportional to the distance between the plates. Ultra
capacitors have any or all of these characteristics, for more storage. There is ongoing research in this area
to find ways to make use of Ultra capacitors as well as combining both Ultra capacitors and battery in
order to improve the efficiency. [4]
12
2.3.3.0 Hydraulic and Pneumatic Energy storage
In hydraulic and pneumatic ESS, the energy is stored by compressing a fluid and storing in an
accumulator, with the accumulator being operated either mechanically or pneumatically. The energy is
stored in the form of a pressurized liquid or gas. So, during regenerative braking, utilizing a hydrostatic
transmission consisting of a pump–motor, the energy is captured and stored in the accumulator and the
compressed fluid is then used to run the hydraulic motor to run the vehicle. This has been a well-
researched technology and has been implemented in various concept vehicles, some of them currently in
the market. Quite recently, as a part of the Cooperative Research and Development Agreement
(CRADA), Ford Motor Company collaborated with the United States Environmental Protection Agency
(USEPA) Advanced Technology Division, and built an automobile to test out Hydraulic Hybrid Vehicle
technology. A hydraulic regenerative braking system called the “Hydraulic Power Assist”, which was
developed by Eaton Corporation (was called “Hydraulic Launch Assist” by them), was successfully tested
on this vehicle. It contained a hydro-pneumatic accumulator for storage, using hydrostatic transmission
(variable displacement pump/motor) for the conversion of energy [17]. The downsides to
Hydraulic/pneumatic ESS are that they very heavy with low energy density and have excessive noise
problems associated with them.
2.3.4.0 Kinetic Energy Storage System or Flywheel Energy Storage
The idea behind this concept is to capture and store the mechanical or rotational kinetic energy of the
wheels in the same form, in a heavy rotating mass or the “flywheel”. This way, if a mechanical variator is
used for transmission there won’t be any losses associated with the energy transformations as energy is
being transmitted in mechanical form throughout. But in many cases with flywheels for energy storage,
and a non-mechanical transmission, energy transformations and consequently the associated losses exist,
e.g., an electrical transmission is used in the flywheel battery (FWB) designed by University of Texas at
Austin, Center of ElectroMechanics (UT CEM) [13]; in such cases flywheels are used for their high
13
specific power, high specific energy (depending on the material of the flywheel), high tolerance to charge
discharge cycles, long service life and low cost. Due to these advantages, flywheels are being used for
Energy storage in various applications some of which are:
1. Uninterrupted Power Supply (UPS) systems [5, 18].
2. Grid energy systems like the Beacon Flywheel Power Storage Plant in Stephentown, New York
[19].
3. Standalone/Auxiliary propulsion unit and for regenerative braking in transportation.
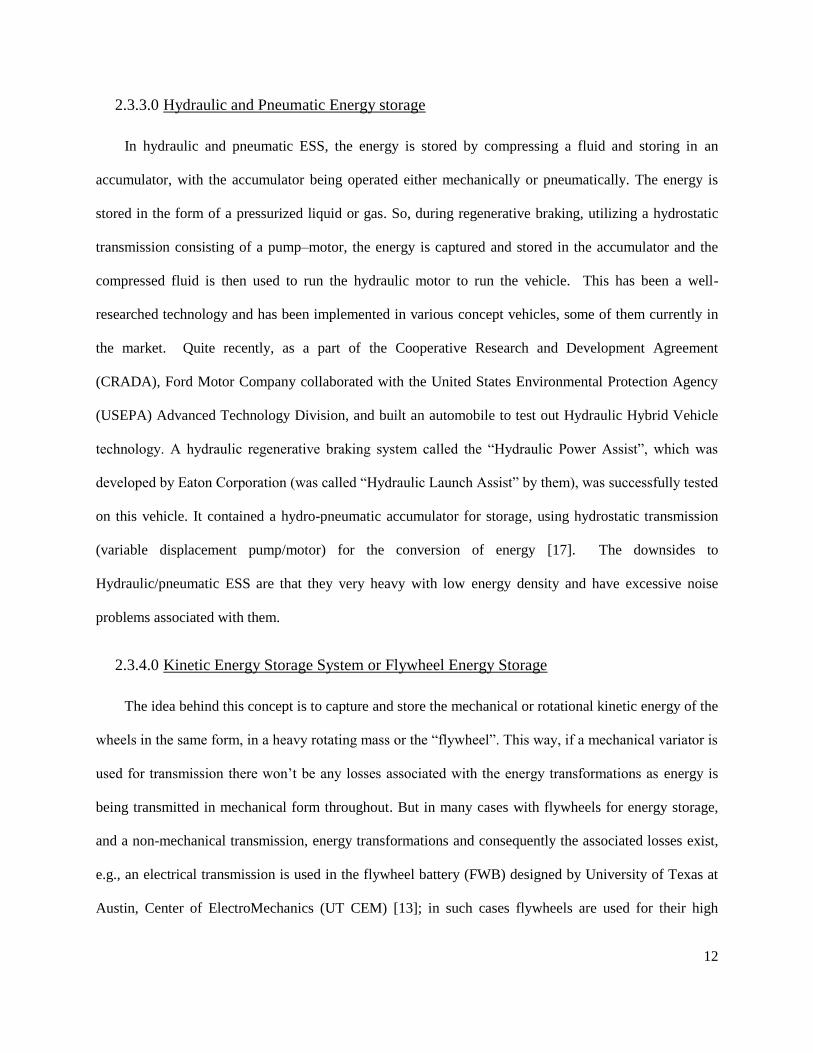
Flywheels store rotational kinetic energy according to the equation given below:
(2)
where, Ek,rot : rotational kinetic energy
I : the rotational inertia of the flywheel about the rotating axis
ω : the angular velocity of the flywheel
This equation implies that the maximum amount of energy that can be stored in a flywheel system
can be increased with either increasing the moment of inertia (I) of the flywheel or the design maximum
angular velocity (ωmax) of the flywheel or both. But due to safety and stability concerns associated with
flywheel shattering and gyroscopic effects respectively, in automobile research applications, low speed
low inertia flywheels have been preferred over high speed ones. In recent times, these issues are being
resolved with the advent of new materials with high specific strength, like composite materials and design
of safer high speed flywheels with high energy storage capabilities has become a possibility with. Lastly,
windage losses and bearing losses are a major concern when using flywheels for energy storage. [20]
14
A flywheel simply is a heavy rotating mass which stores kinetic or rotational energy as a function of
its moment of inertia and angular velocity. Over the ages, flywheels have found an application in various
kinds of machines, like the potter’s wheel, punch press, steam engine etc. They are used for their ability
to:[1, 2, 5]
1. Smoothen out rotations and Provide continuous energy.
2. Store large amounts of energy and release at a very high rate if and when needed.
The energy storage ability of high inertia/ high speed flywheels has been exploited to a good amount
in the past. Using flywheels provides the advantage of a high power (storing and releasing both) ESS,
compared to conventional batteries. Due to which, Flywheel Energy Storage (FES) systems are being
used to replace electrochemical batteries in the field of power supply for Uninterrupted Power Supply
(UPS) systems, grid power storage requirements and pulse power requirements. In comparison, the
application of FES in the field of transportation has been more of a recent phenomenon. Safety issues
with rotating steel flywheels namely disintegration and dislocation in their housing, coupled with high
windage and other losses had but barred their development in the transportation sector. With the arrival of
new materials with higher specific tensile strength such as Composite materials, better technology in
transmission( better CVTs), bearings (e.g., magnetic bearings) and vacuum housing systems, FES for
vehicular applications is being revived. [5, 21]
FES has been applied as Standalone propulsions systems (instead of traditional engines), as auxiliary
propulsion units in hybrid vehicles, and as regenerative braking units in the transportation sector. Most of
the systems implementing flywheel storage have regenerative braking functionality to varying degrees,
3.0 FLYWHEEL BASED REGENERATIVE BRAKING SYSTEMS
Introduction 3.1.0
15
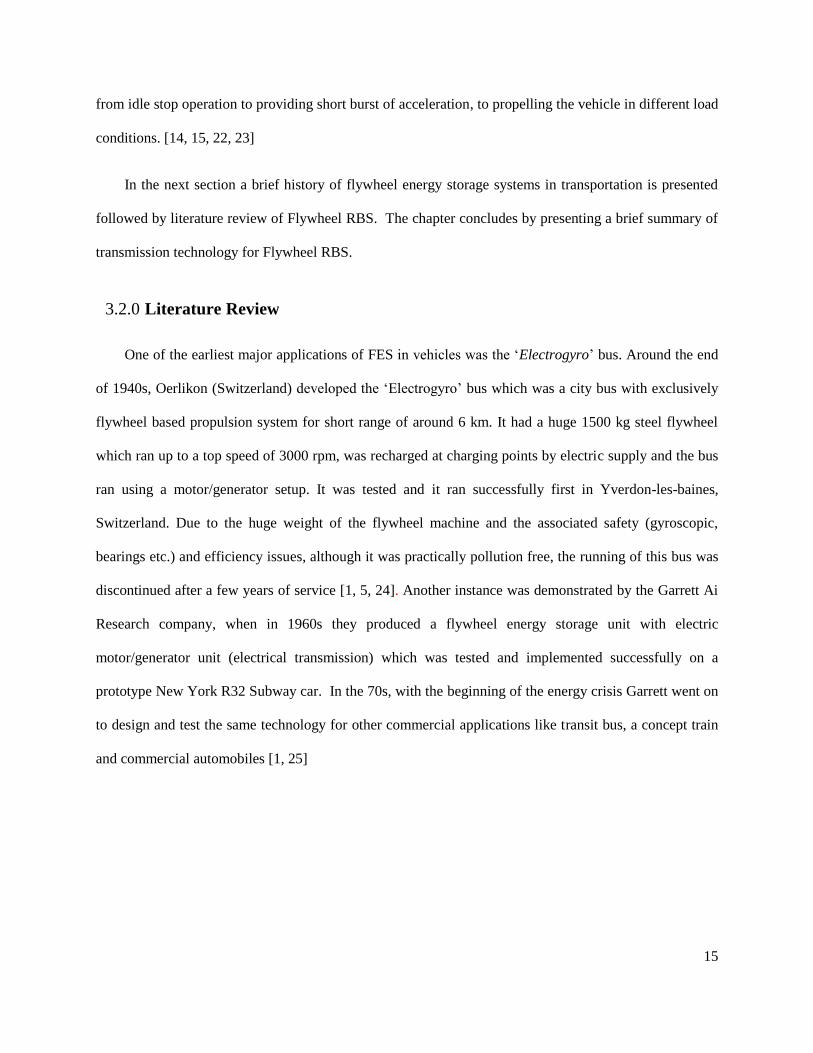
from idle stop operation to providing short burst of acceleration, to propelling the vehicle in different load
conditions. [14, 15, 22, 23]
In the next section a brief history of flywheel energy storage systems in transportation is presented
followed by literature review of Flywheel RBS. The chapter concludes by presenting a brief summary of
transmission technology for Flywheel RBS.
One of the earliest major applications of FES in vehicles was the ‘Electrogyro’ bus. Around the end
of 1940s, Oerlikon (Switzerland) developed the ‘Electrogyro’ bus which was a city bus with exclusively
flywheel based propulsion system for short range of around 6 km. It had a huge 1500 kg steel flywheel
which ran up to a top speed of 3000 rpm, was recharged at charging points by electric supply and the bus
ran using a motor/generator setup. It was tested and it ran successfully first in Yverdon-les-baines,
Switzerland. Due to the huge weight of the flywheel machine and the associated safety (gyroscopic,
bearings etc.) and efficiency issues, although it was practically pollution free, the running of this bus was
discontinued after a few years of service [1, 5, 24]. Another instance was demonstrated by the Garrett Ai
Research company, when in 1960s they produced a flywheel energy storage unit with electric
motor/generator unit (electrical transmission) which was tested and implemented successfully on a
prototype New York R32 Subway car. In the 70s, with the beginning of the energy crisis Garrett went on
to design and test the same technology for other commercial applications like transit bus, a concept train
and commercial automobiles [1, 25]
Literature Review 3.2.0
16
Figure 1 : Flywheel Propulsion for rapid rail cars, Garrett Ai Research Corporation(1974) [26]
About the same time, there were several Government sponsored studies on the feasibility and
different configurations for Flywheel and Flywheel Hybrid propulsion for commercial automobiles [27,
28]. As a culmination of these studies, during the end of 70s, General Electric(GE) came up with its own
version of the Flywheel bus or the gyro bus using a 1.5 ton flywheel and electric motor/generator for
transmission [24]. Also, General Motors (GM) extensively studied the flywheel hybrid for their new
concept commercial vehicle, which they designed and simulated in 1986. This system had a mechanical
transmission (CVT), but after the simulation it was realized that the system (engine/flywheel hybrid)
didn’t match the expected requirement, hence the project was discontinued [28]. Leyland Bus in the U.K.
successfully tested and demonstrated the mechanical regenerative braking system in their busses around
the 80s. The system consisted of a composite flywheel (developed by British Petroleum) and the Leyland
CVT for transmission. [1, 29]
During the early 1990s, Chrysler had developed the ‘Patriot’, a concept car for Le Mans 24 hour
race. It was a gas turbine-electric hybrid vehicle with a Flywheel Regenerative Braking System used for
the purpose of load leveling, with a composite flywheel. The project was dropped later due to issues in
safety and packaging. With the development and usage of the composite materials for flywheels, the
research in flywheels propulsion picked up immensely [1, 5, 30]. One of the most significant events in
recent times, was that FIA authorized the use of Hybrid drivetrains for Formula 1 2009 season. Due to
17
this development, various Regenerative Braking System “Kinetic Energy Recovery System (KERS)”
options including flywheel systems were explored and devised. A good example of such a flywheel
KERS is the system developed by Flybrid LLP which has high speed carbon filament flywheel with
Torotrak CVT [22]. This system will be described in the next section with other reviewed literature.
Note: In following sections the terms Flywheel-KERS or Flywheel-RBS may be used
interchangeably to imply the same.
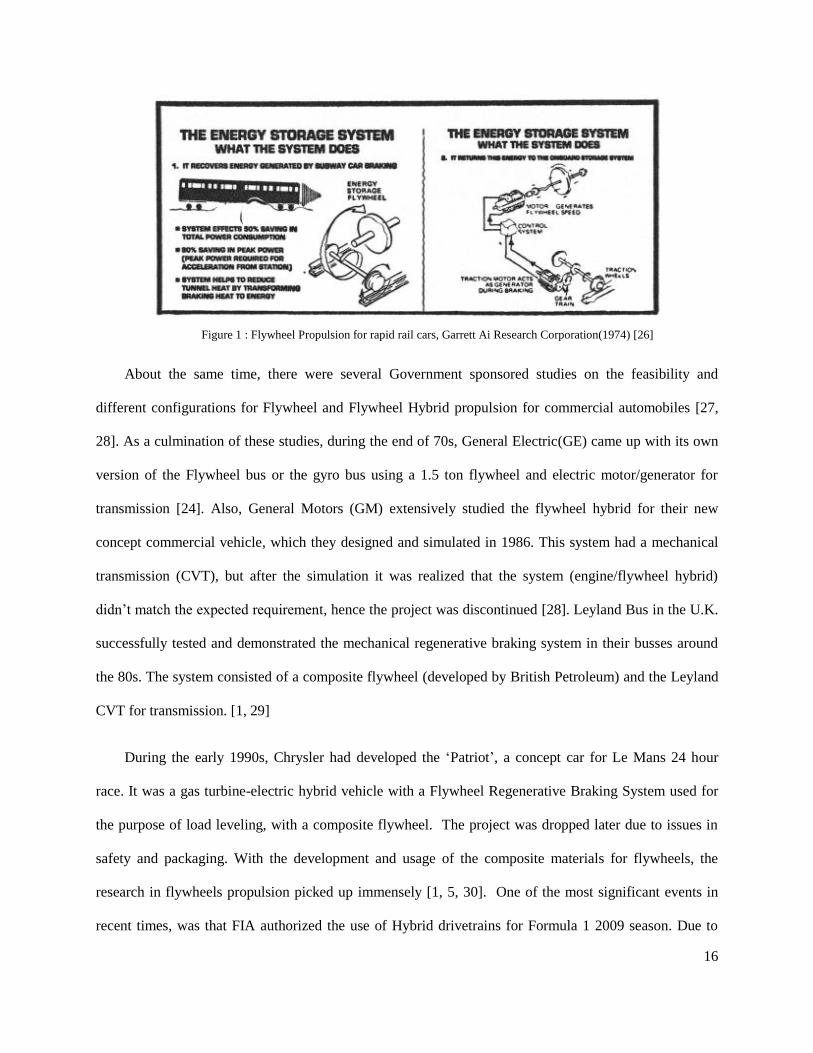
3.2.1.0 Schilke, N.A.(1986) [28]
As a culmination of government sponsored, GM research and other studies in the fuel economy
potential of flywheel hybrid vehicles, GM designed a concept engine-flywheel hybrid drive system for a
compact car and predicted its performance using analytical tools. Initially, for the powertrain concept two
versions were considered, one was a system which had two mode operation and the other with one mode
operation. A CVT is used for transmission in both cases. The two mode drive discontinued due to high
level of complexity in design and hence the simpler one mode drive was chosen. The one mode drive was
a parallel drive system in which wheels or accessories (of the vehicle) were driven either by the engine or
the flywheel and similarly, the energy recovered by regenerative braking charged the flywheel or the
accessories. There was no method of charging the flywheel directly through the engine. All the flywheel
energy was captured only through braking. The design of flywheel was based on the GM Cymbal
Flywheel and had a maximum rotational speed of 12000 RPM, and energy storage of 60Wh. After
laboratory tests and computer simulation, the performance was predicted to achieve a significant gain in
urban fuel economy but the highway fuel economy could not meet the required efficiency levels and
hence the project was discontinued.
18
Figure 2: One Mode configuration of the Engine-Flywheel Hybrid Drive by GM [28]
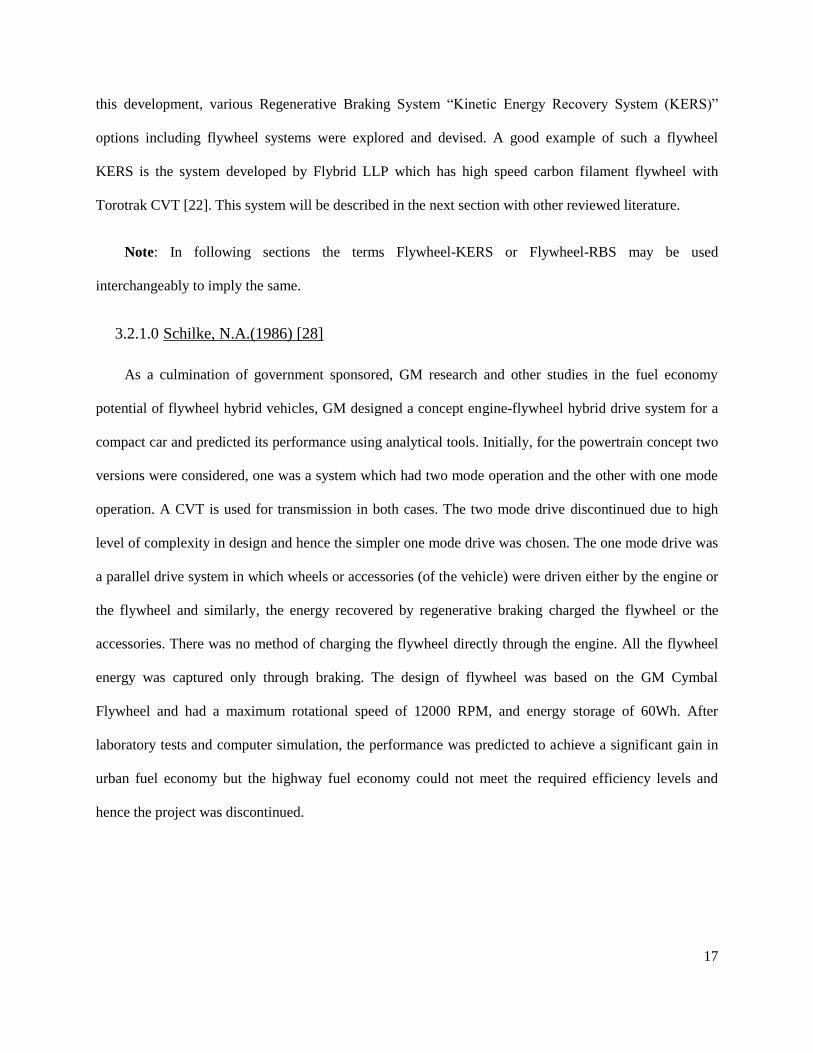
3.2.2.0 Jefferson and Ackerman (1996) [23]
The paper describes a flywheel based energy storage system designed as a standalone propulsion unit
or the main propulsion unit in a hybrid setup, for a railcar application. The system comprised of a steel
flywheel and a mechanical variator (i.e., CVT) for matching the speeds of output drivetrain and the
flywheel and also in order to affect power transfer from/to the flywheel by the variation of the CVT ratio.
The Flywheel of flywheel energy storage (FES) could be charged by an onboard or external power source
(battery, engine etc.) en-route or at stops, and by regenerative braking and the charged FES was used to
propel the railcar. The system was tested on a laboratory test rig and successfully demonstrated on a
minitram. The test rig setup used a composite flywheel, a KOPP CVT and an induction motor as power
source (simulating vehicle). Open and closed loop tests were used to understand CVT control and gauge
system performance. The minitram system used a steel flywheel of 4 MJ storage capacity. The results
from the Minitram system showed that on using ‘flywheel only’ propulsion, the energy savings were
around 24%. It was concluded that having a hybrid powertrain with a flywheel-variator system and a
compact constant power source like an Internal Combustion Engine (ICE) or Fuel Cell would result in a
fuel efficient vehicle of large range.
19
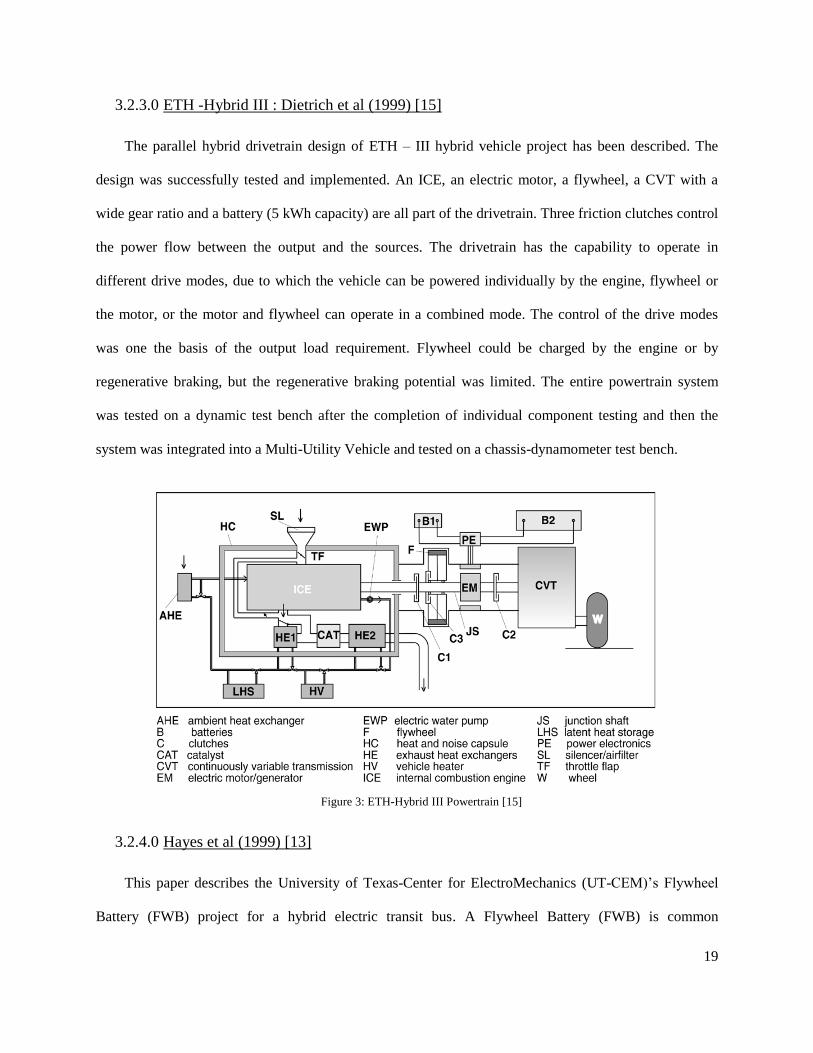
3.2.3.0 ETH -Hybrid III : Dietrich et al (1999) [15]
The parallel hybrid drivetrain design of ETH – III hybrid vehicle project has been described. The
design was successfully tested and implemented. An ICE, an electric motor, a flywheel, a CVT with a
wide gear ratio and a battery (5 kWh capacity) are all part of the drivetrain. Three friction clutches control
the power flow between the output and the sources. The drivetrain has the capability to operate in
different drive modes, due to which the vehicle can be powered individually by the engine, flywheel or
the motor, or the motor and flywheel can operate in a combined mode. The control of the drive modes
was one the basis of the output load requirement. Flywheel could be charged by the engine or by
regenerative braking, but the regenerative braking potential was limited. The entire powertrain system
was tested on a dynamic test bench after the completion of individual component testing and then the
system was integrated into a Multi-Utility Vehicle and tested on a chassis-dynamometer test bench.
Figure 3: ETH-Hybrid III Powertrain [15]
3.2.4.0 Hayes et al (1999) [13]
This paper describes the University of Texas-Center for ElectroMechanics (UT-CEM)’s Flywheel
Battery (FWB) project for a hybrid electric transit bus. A Flywheel Battery (FWB) is common
20
nomenclature for systems in which the transmission is an electric motor/generator but the energy is stored
in rotational form in a flywheel. So when the FWB is used for regeneration, the rotational energy of the
wheels is converted into electrical energy and back into rotational energy at the flywheel using an
electrical motor/generator and vice versa for acceleration. UT-CEM developed computer models to
simulate hybrid electric drivetrain with FWB to calculate the design requirement. The FWB used in this
demonstration had a 2 kWh composite flywheel and a high speed permanent magnet motor/generator with
magnetic bearings. The FWB was of “partially integrated topology” which means that the flywheel and
motor/generator are separate components but ride on the same shaft and in a single housing. Initial testing
was carried out using a titanium flywheel and the thermal analysis results obtained were included to
optimize the design. All components are individually bench tested for safety and optimization. The paper
describes the system in pre-vehicle integration testing phase.
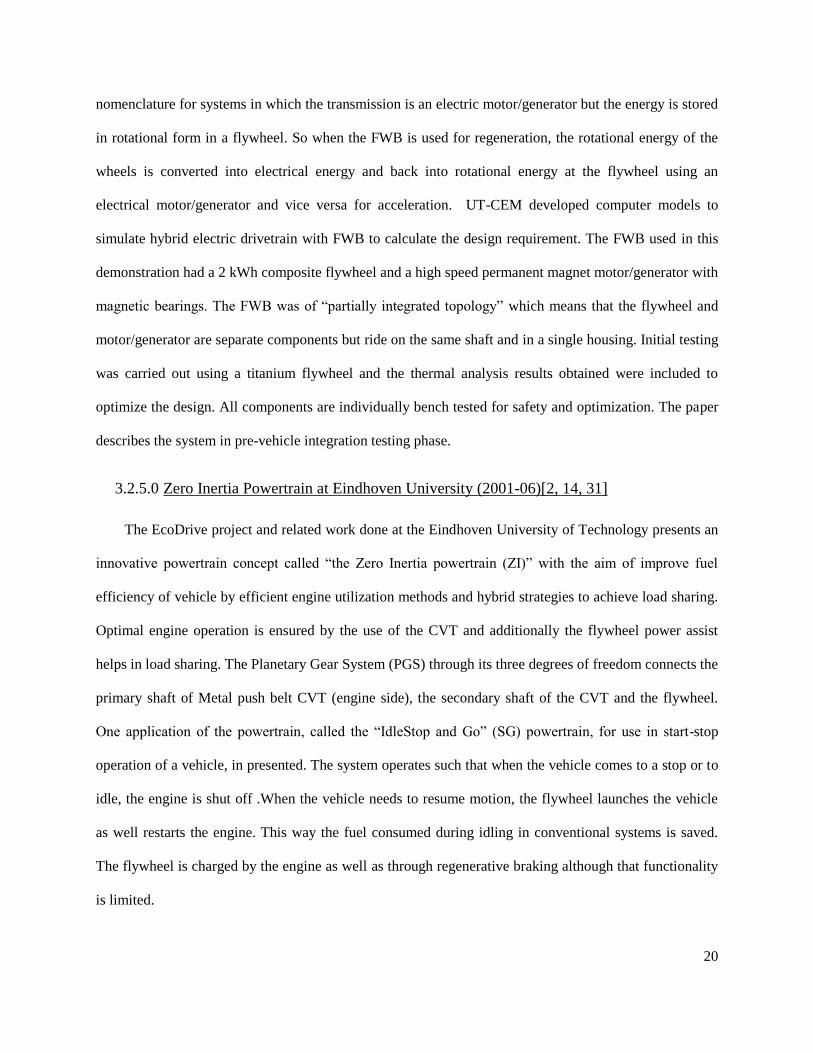
3.2.5.0 Zero Inertia Powertrain at Eindhoven University (2001-06)[2, 14, 31]
The EcoDrive project and related work done at the Eindhoven University of Technology presents an
innovative powertrain concept called “the Zero Inertia powertrain (ZI)” with the aim of improve fuel
efficiency of vehicle by efficient engine utilization methods and hybrid strategies to achieve load sharing.
Optimal engine operation is ensured by the use of the CVT and additionally the flywheel power assist
helps in load sharing. The Planetary Gear System (PGS) through its three degrees of freedom connects the
primary shaft of Metal push belt CVT (engine side), the secondary shaft of the CVT and the flywheel.
One application of the powertrain, called the “IdleStop and Go” (SG) powertrain, for use in start-stop
operation of a vehicle, in presented. The system operates such that when the vehicle comes to a stop or to
idle, the engine is shut off .When the vehicle needs to resume motion, the flywheel launches the vehicle
as well restarts the engine. This way the fuel consumed during idling in conventional systems is saved.
The flywheel is charged by the engine as well as through regenerative braking although that functionality
is limited.
21
Figure 4: ZI Powertrain Layout [31]
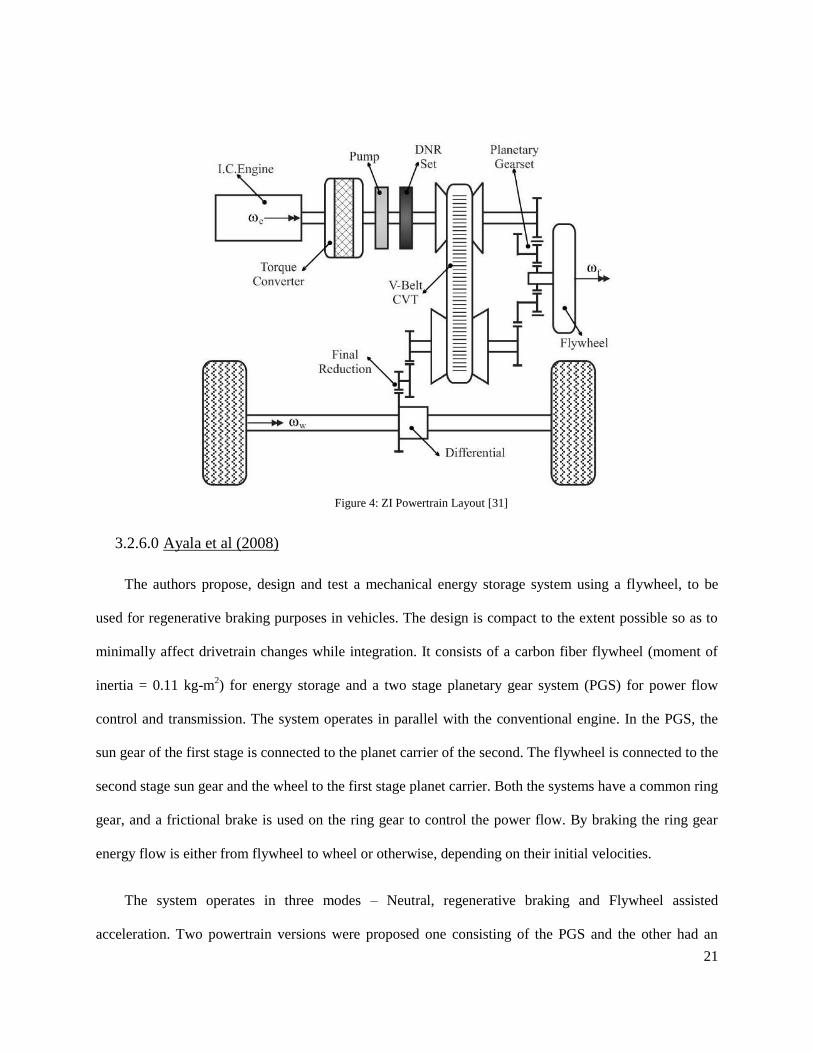
3.2.6.0 Ayala et al (2008)
The authors propose, design and test a mechanical energy storage system using a flywheel, to be
used for regenerative braking purposes in vehicles. The design is compact to the extent possible so as to
minimally affect drivetrain changes while integration. It consists of a carbon fiber flywheel (moment of
inertia = 0.11 kg-m2) for energy storage and a two stage planetary gear system (PGS) for power flow
control and transmission. The system operates in parallel with the conventional engine. In the PGS, the
sun gear of the first stage is connected to the planet carrier of the second. The flywheel is connected to the
second stage sun gear and the wheel to the first stage planet carrier. Both the systems have a common ring
gear, and a frictional brake is used on the ring gear to control the power flow. By braking the ring gear
energy flow is either from flywheel to wheel or otherwise, depending on their initial velocities.
The system operates in three modes – Neutral, regenerative braking and Flywheel assisted
acceleration. Two powertrain versions were proposed one consisting of the PGS and the other had an
22
additionally CVT for increased range of utilization after the ring gear has been stopped. A computational
model was formulated for design and its results compared with those obtained experimentally on a scaled
physical model tested in laboratory using a dynamometer for vehicle behavior, which validated the
operation of the design and the model. Furthermore, computational simulations of a full car model
including the Mechanical energy storage system were conducted using different standard drive cycles to
confirm better fuel efficiency and reduced emissions.
Figure 5: Mechanical Energy Storage System - Brake Only Version [32]
3.2.7.0 Cross and Brockbank (2009)
The paper presents a mechanical Kinetic Energy Recovery System (KERS) developed by Flybrid
Systems LLP using a Torotrak Continuously Variable Transmission (CVT), mainly for Formula 1 (F1)
application and also for motorsport and commercial automobile applications. The aim of the project was
to come up with a KERS solution for F1 application (in response to FIA‘s recent regulation in F1 to allow
hybrid drivetrains with KERS for performance boost and fuel efficiency) and also make it commercially
viable. In keeping up with requirements, compactness, high safety and cost effective were some of goals
set for the design. As a result, the mechanical KERS system developed used a high speed carbon filament
flywheel as the ESS and a Torotrak toroidal traction drive CVT, and the power rating and max speed is
given as 60 kW and 64500 RPM respectively. The power flow control is managed by an electrohydraulic
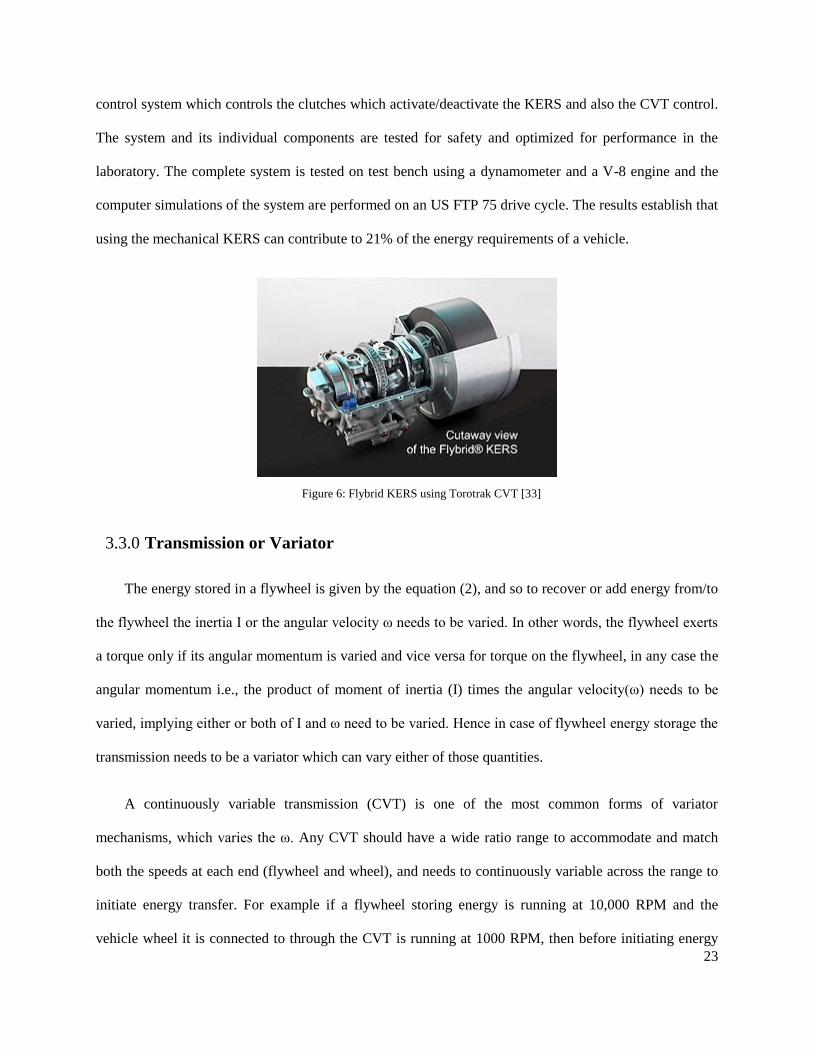
23
control system which controls the clutches which activate/deactivate the KERS and also the CVT control.
The system and its individual components are tested for safety and optimized for performance in the
laboratory. The complete system is tested on test bench using a dynamometer and a V-8 engine and the
computer simulations of the system are performed on an US FTP 75 drive cycle. The results establish that
using the mechanical KERS can contribute to 21% of the energy requirements of a vehicle.
Figure 6: Flybrid KERS using Torotrak CVT [33]
The energy stored in a flywheel is given by the equation (2), and so to recover or add energy from/to
the flywheel the inertia I or the angular velocity ω needs to be varied. In other words, the flywheel exerts
a torque only if its angular momentum is varied and vice versa for torque on the flywheel, in any case the
angular momentum i.e., the product of moment of inertia (I) times the angular velocity(ω) needs to be
varied, implying either or both of I and ω need to be varied. Hence in case of flywheel energy storage the
transmission needs to be a variator which can vary either of those quantities.
A continuously variable transmission (CVT) is one of the most common forms of variator
mechanisms, which varies the ω. Any CVT should have a wide ratio range to accommodate and match
both the speeds at each end (flywheel and wheel), and needs to continuously variable across the range to
initiate energy transfer. For example if a flywheel storing energy is running at 10,000 RPM and the
vehicle wheel it is connected to through the CVT is running at 1000 RPM, then before initiating energy
Transmission or Variator 3.3.0
24
transfer between both of them, the CVT needs to needs to match up speeds by switching to required gear
ratio (Mechanical: gears, variable diameter pulley, toroidal surfaces; Electrical: motor/generator,
hydrostatic: pump/motor etc.). Once both the sources (flywheel and the wheel) are connected and at
equilibrium, the ratio needs to be varied i.e., in this scenario from ratio = 10:1 to 5:1 or 20:1, continuously
to vary the speeds so as to initiate an energy transfer or a momentum exchange. Based on the literature,
the types of CVT commonly used are described below:
3.3.1.0 Hydrostatic CVT:
A Hydrostatic CVT consists of a variable displacement pump and hydraulic motor combination
which control the ratio and the variation of it. Such systems have the inherent disadvantage of energy
conversion losses as energy is being converted from rotational to hydraulic back to rotational. The
advantages of such systems are that they are easily available, easily controllable, durable, and have good
power density. On the other hand their disadvantages are that they have poor efficiencies, high on weight
addition high noise level. [1, 5]
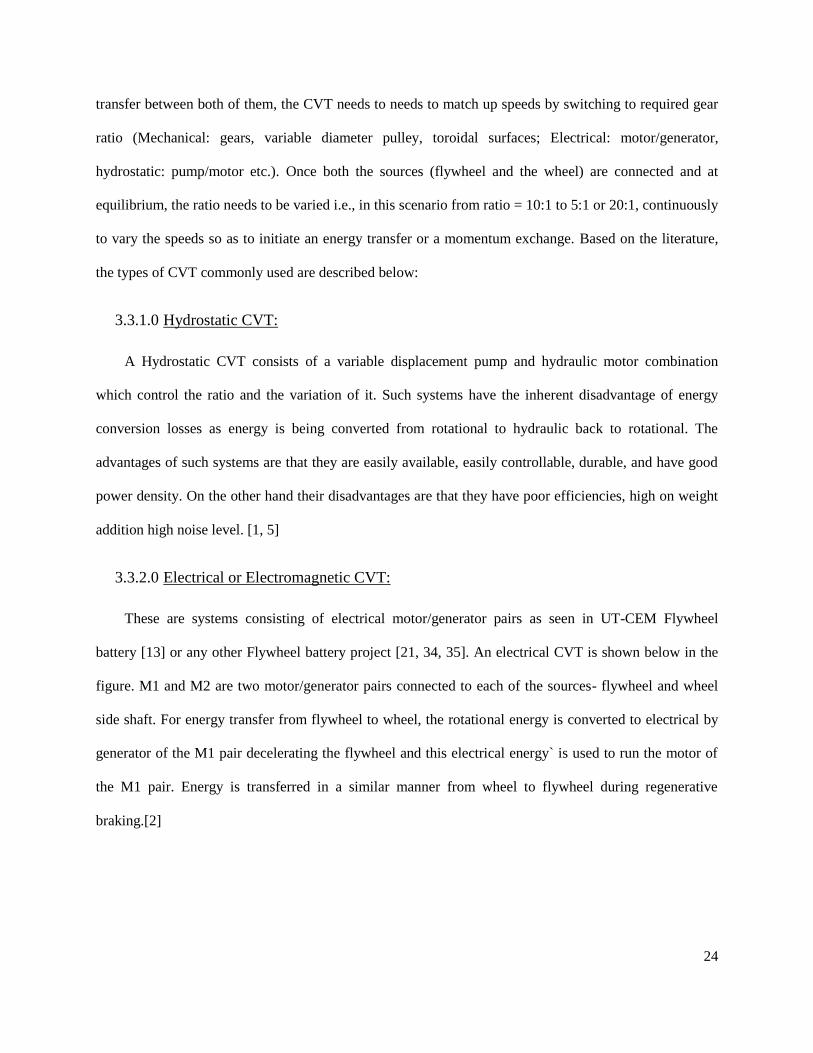
3.3.2.0 Electrical or Electromagnetic CVT:
These are systems consisting of electrical motor/generator pairs as seen in UT-CEM Flywheel
battery [13] or any other Flywheel battery project [21, 34, 35]. An electrical CVT is shown below in the
figure. M1 and M2 are two motor/generator pairs connected to each of the sources- flywheel and wheel
side shaft. For energy transfer from flywheel to wheel, the rotational energy is converted to electrical by
generator of the M1 pair decelerating the flywheel and this electrical energy` is used to run the motor of
the M1 pair. Energy is transferred in a similar manner from wheel to flywheel during regenerative
braking.[2]
25
Figure 7: Electrical CVT [2]
These systems inherently have energy conversion losses. Other than that they are most easily
controllable, are compact, can have a wide and infinitely variable ratio, are durable and have very low
noise levels. The downsides are that these systems are expensive and the transfer efficiencies tend to be
less (due to conversion losses).
3.3.3.0 Mechanical CVT:
Mechanical CVTs can be of various types. Rolling traction drives like toroidal CVT and pulley belt
type are some of the common types. Planetary Gear System combinations are also for the same
purpose[32]. With mechanical systems there are no energy conversion losses hence the transfer
efficiencies can be quite high. That also means the power density is also high. They are simple in design,
economical, compact and have low noise levels. They are not very durable and need maintenance due to
constant wear and tear. [1, 12]. The design and operation of the common types of CVT is explained
below:
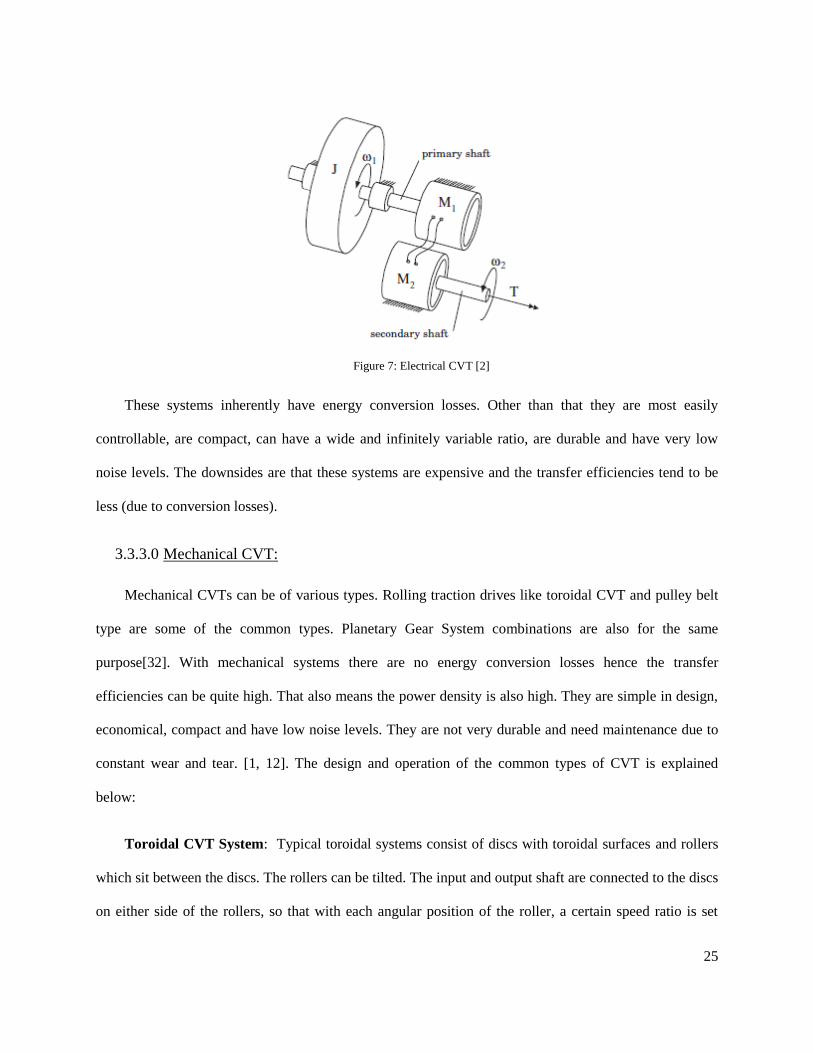
Toroidal CVT System: Typical toroidal systems consist of discs with toroidal surfaces and rollers
which sit between the discs. The rollers can be tilted. The input and output shaft are connected to the discs
on either side of the rollers, so that with each angular position of the roller, a certain speed ratio is set
26
between the input and output shafts. Hence, the variable ratio of the drive is controlled by tilting the
rollers which subsequently can be controlled with the help of an actuator. This design of toroidal systems
provides for a continuously varying gear ratio and wide ratio range. [22] Toroidal CVT systems have the
benefit of being compact, easy to implement and control, having low noise levels, and with efficiencies
greater than 90%. [12]
Figure 8: A Torotrak Toroidal CVT[36]
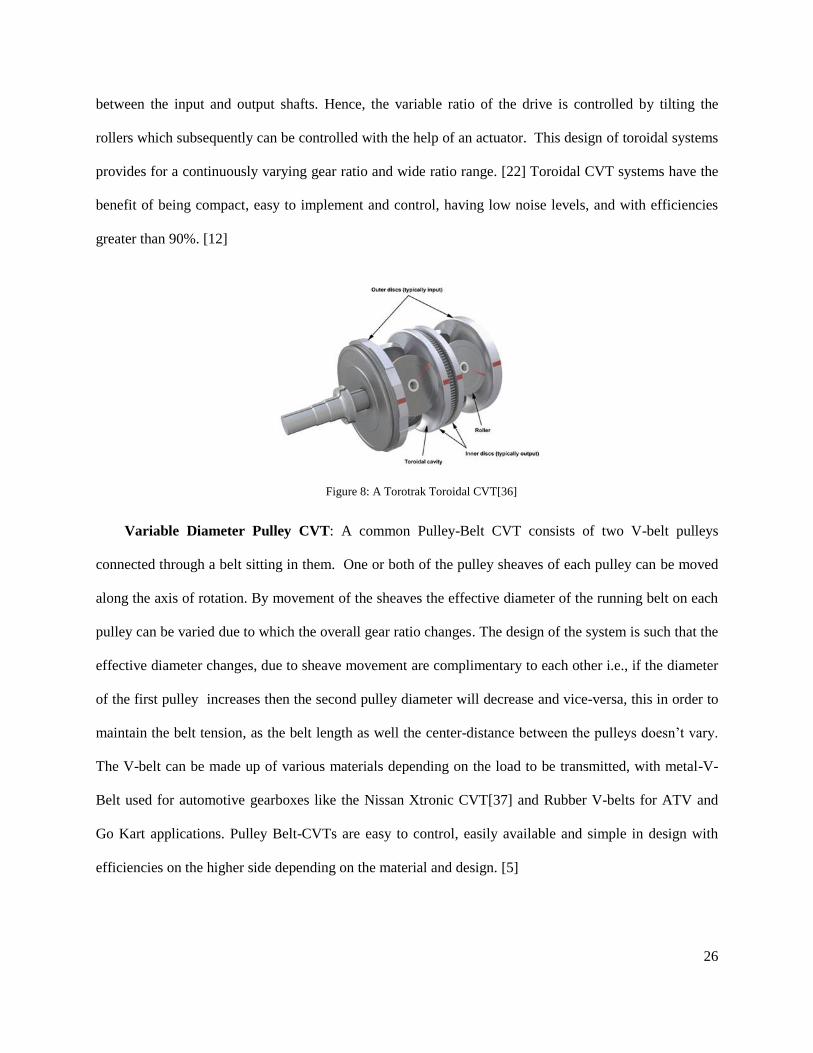
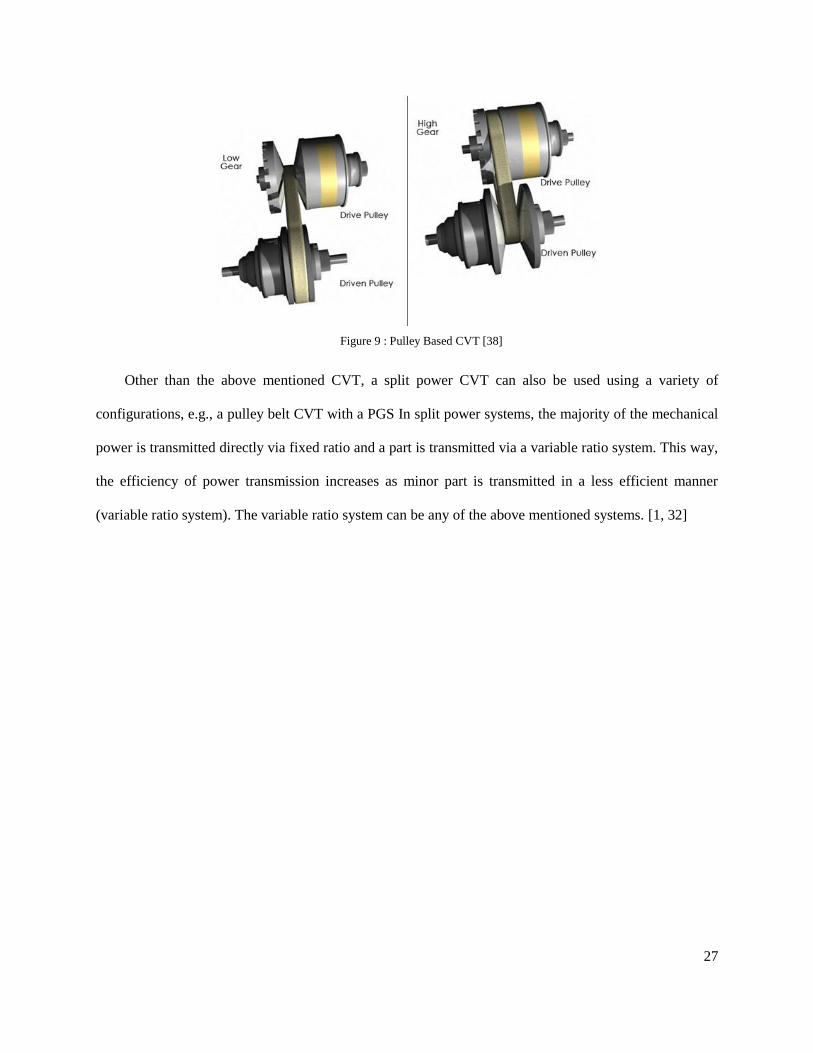
Variable Diameter Pulley CVT: A common Pulley-Belt CVT consists of two V-belt pulleys
connected through a belt sitting in them. One or both of the pulley sheaves of each pulley can be moved
along the axis of rotation. By movement of the sheaves the effective diameter of the running belt on each
pulley can be varied due to which the overall gear ratio changes. The design of the system is such that the
effective diameter changes, due to sheave movement are complimentary to each other i.e., if the diameter
of the first pulley increases then the second pulley diameter will decrease and vice-versa, this in order to
maintain the belt tension, as the belt length as well the center-distance between the pulleys doesn’t vary.
The V-belt can be made up of various materials depending on the load to be transmitted, with metal-V-
Belt used for automotive gearboxes like the Nissan Xtronic CVT[37] and Rubber V-belts for ATV and
Go Kart applications. Pulley Belt-CVTs are easy to control, easily available and simple in design with
efficiencies on the higher side depending on the material and design. [5]
27
Figure 9 : Pulley Based CVT [38]
Other than the above mentioned CVT, a split power CVT can also be used using a variety of
configurations, e.g., a pulley belt CVT with a PGS In split power systems, the majority of the mechanical
power is transmitted directly via fixed ratio and a part is transmitted via a variable ratio system. This way,
the efficiency of power transmission increases as minor part is transmitted in a less efficient manner
(variable ratio system). The variable ratio system can be any of the above mentioned systems. [1, 32]

28
DESIGN AND DEVELOPMENT
29
As introduced before, the aim of this research is to design and test an RBS (Regenerative Braking
System) solution for a Formula SAE racecar application. Such a system will benefit the racecar in two
ways:
1. Save the wasteful braking energy and reuse that energy as an additional source to power the
vehicle, albeit temporarily, thus saving engine’s power and consequently reducing net fuel
consumption.
2. The current design is for front-wheel application in a rear-wheel drive car. So, using the RBS
system to power the front wheels, provides a temporary acceleration boost to the car. This is
because in a rear wheel drive car, the max engine torque deliverable to the rear wheels is traction
limited. So, one alternative for extra power or torque to the car for additional acceleration is by
powering the front wheels too (similar to AWD/4WD vehicles).
Before designing such a system, the design requirements need to be established. This is in order to
set the design constraints for the system. Though, the aims of the design have been previously mentioned,
but for the sake of convenience, the same are mentioned again below:
1. High energy density and power density – Enough to capture the available braking energy and
store the amount of energy needed to accelerate the vehicle.
2. High storage and transfer efficiency.
3. Conceptually and otherwise, simple and minimalistic in design.
4. Safe in operation.
5. Lightweight
6. Cost effective.
7. Easy to implement and operate.
4.0 INTRODUCTION TO THE CONCEPT AND PRE-DESIGN
30
The next sections cover the design and the development of the RBS.
As a first step, a base template of the system needs to be set before proceeding with the design
process. On studying the various types of ESS, it was realized that for all their merits and demerits any of
the ESS could be used for the application. The electrical ESS has been extensively researched and is an
excellent choice due to its high specific energy, compactness and operational/implementation simplicity.
But it was found lacking in storage/recharging efficiency and the transmission losses associated with
energy conversion from mechanical energy to electrical energy. So, on an exploratory basis, a flywheel
with a mechanical transmission was selected with the aim of overcoming these particular shortcomings of
an Electrical RBS system.
With a flywheel ESS, high specific power can be achieved and depending on the design, high
specific energy can be obtained as well. Additionally, flywheels have excellent recharge efficiencies and
very long cycle lives. On coupling this with a mechanical transmission the conversion losses are
eliminated as the mechanical braking energy is transmitted and stored in the same form. The other
advantages being the system can be cost effective (depending on the design) and simple to recreate. The
problems associated with flywheel systems are high weight addition and safety issues. Therefore most of
the design goals are met with a Flywheel based Mechanical System.
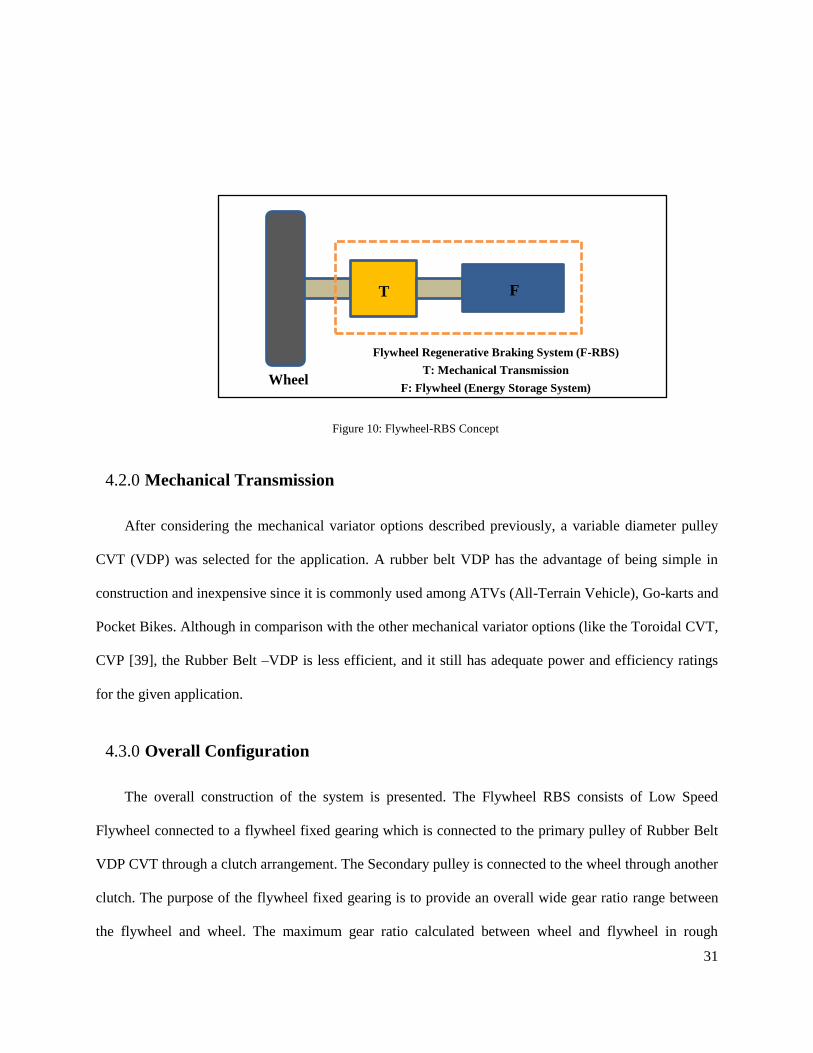
The Flywheel RBS (f-RBS) concept consists of a low/high speed flywheel with a mechanical
transmission and this arrangement is to be directly connected to the front wheel axle/spindle.
The RBS Concept or Flywheel RBS Concept or Concept Definition 4.1.0
31
After considering the mechanical variator options described previously, a variable diameter pulley
CVT (VDP) was selected for the application. A rubber belt VDP has the advantage of being simple in
construction and inexpensive since it is commonly used among ATVs (All-Terrain Vehicle), Go-karts and
Pocket Bikes. Although in comparison with the other mechanical variator options (like the Toroidal CVT,
CVP [39], the Rubber Belt –VDP is less efficient, and it still has adequate power and efficiency ratings
for the given application.
The overall construction of the system is presented. The Flywheel RBS consists of Low Speed
Flywheel connected to a flywheel fixed gearing which is connected to the primary pulley of Rubber Belt
VDP CVT through a clutch arrangement. The Secondary pulley is connected to the wheel through another
clutch. The purpose of the flywheel fixed gearing is to provide an overall wide gear ratio range between
the flywheel and wheel. The maximum gear ratio calculated between wheel and flywheel in rough
Mechanical Transmission 4.2.0
Overall Configuration 4.3.0
Flywheel Regenerative Braking System (F-RBS)
T: Mechanical Transmission
F: Flywheel (Energy Storage System) Wheel
T F
Figure 10: Flywheel-RBS Concept
32
calculations was deemed beyond the ratio range of any available rubber belt CVTs in the market. Hence,
the fixed gear between the flywheel (flywheel gear) and the CVT will provide for a multiplier to the ratio
of the CVT according to the equation given below.
(3)
where, noverall : Overall gear ratio at the wheel including that of CVT and flywheel
ncvt : Gear ratio of the CVT
ngear : Gear ratio of the fixed flywheel gearing
Note: In the coming sections, the design calculations for the f-RBS are presented, and the f-RBS is
designed with the aim that the total inertial load of the racecar will be distributed equally between two
such systems operating on both the front wheels.
The Flywheel RBS would operate in three modes: Regen-Braking, Accel-Boost and Neutral. The
three modes are described below[15]:
1. Regen-Braking: In this mode, the vehicle energy is captured in the flywheel and the vehicle is
slowed down in the process. First, the CVT ratio is controlled so as to set the overall ratio to
match the ratio between the wheel and the flywheel in their original states. After matching the
speeds with the help of the CVT, both the clutches are activated to connect both the wheel and
flywheel to the CVT. After the connection is established, the CVT ratio is changed continuously
from the original high gear ratio to lower ratios so as to initiate the required energy flow from the
wheel to the Flywheel. If the need for more braking arises beyond the limits of the CVT, the
braking will be switched immediately to the default brakes of the racecar.
2. Accel-Boost: In this mode the stored energy of the flywheel is used for accelerating the vehicle
temporarily. As in the previous mode, first the CVT ratio is set so as to match the speeds of wheel
Theory of Operation 4.4.0
33
and the flywheel. Then, the clutches are activated to establish connection and the CVT ratio is
switched continuously from low to high so as to initiate an energy transfer from the flywheel to
the wheel. Once the flywheel energy is reduced to a certain limit or the acceleration need ends,
the clutches are deactivated to disconnect the system on both ends.
3. Neutral: In the neutral mode, the system is disengaged with both the flywheel and the wheel
through the clutches. The flywheel and the wheel rotate at their own speeds without any
connection. This can be the case during either when there is no need for Accel-Boost or f-RBS
assisted braking or when automatic disengagement when the flywheel to wheel speed ratio is less
or more than the extremes of the f-RBS’s transmission ratio.
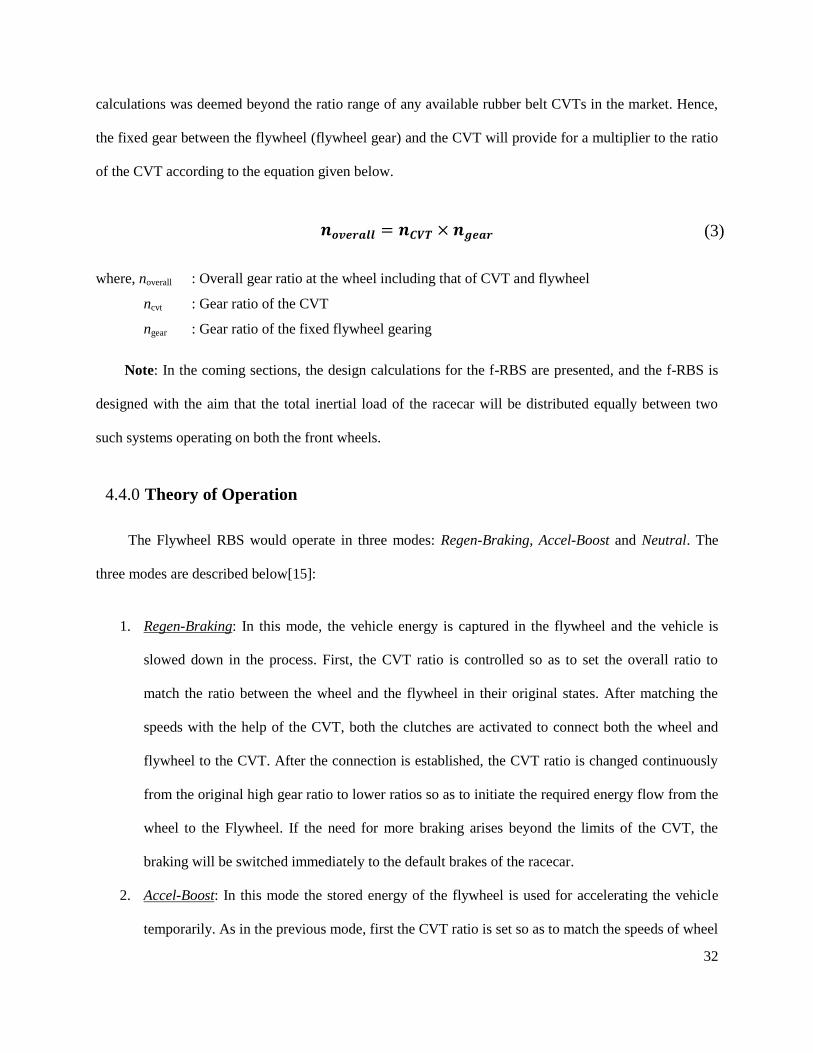
The control of actuator mechanism in the CVT and the clutches control the operation of the
system and its modes.
The next sections present pre-design calculations and design principles of the individual components
which are:
Figure 11: Overall Configuration
C: Clutch; G: Gear
G1 CV
T
G2
C1
C2
Wheel
Flywheel
Transmissio
n
34
1. Flywheel
2. CVT and Fixed Gear
Before designing the RBS system the required power rating and the energy rating of the system i.e.,
the operating power and maximum amount of energy it can store needs to be defined. For these numbers
the amount of braking energy available and the power of braking during a test lap is calculated. The data
used to calculate is the DAQ (Data Acquisition) data from JMS 08’ (Jayhawk Motorsports) racecar test
runs. The data was analyzed with the help of AiM Race Studio 2© [40]Analysis mode
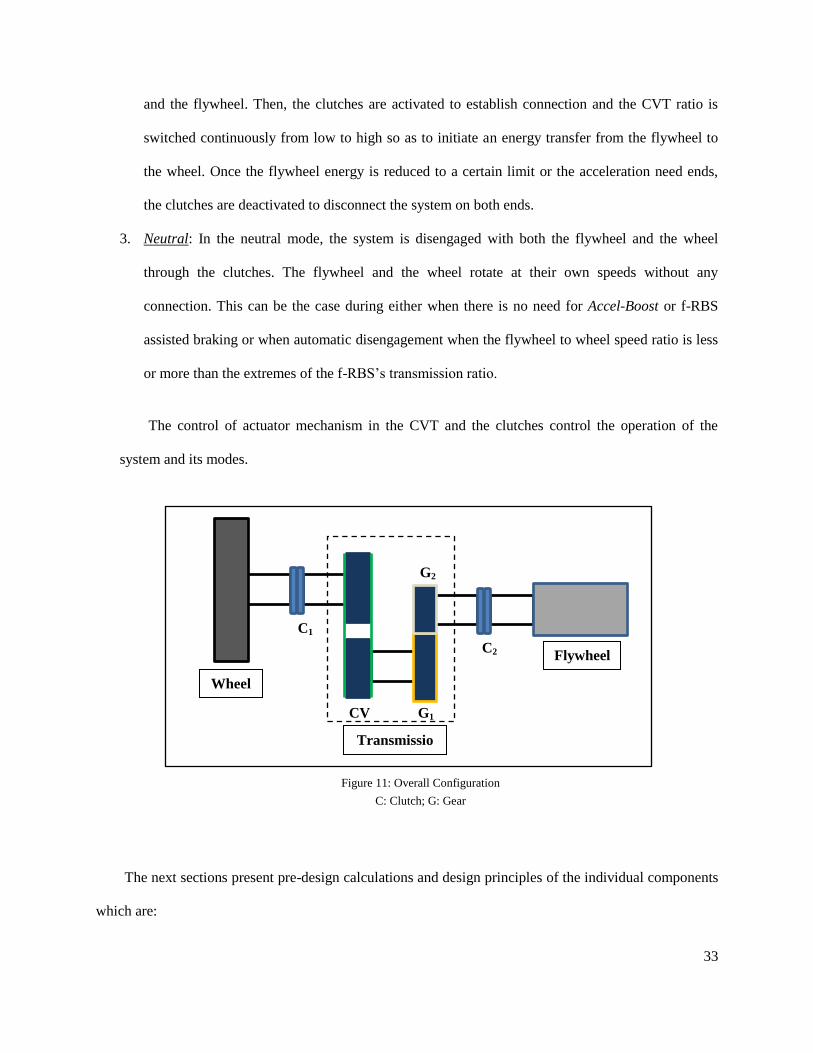
The velocity [km/h] vs. time [s] plot is presented below of a full lap from the DAQ data. The plot for
the lap is not a zero to zero plot.
Figure 12: Velocity [km/h] vs. Time [s] Graph from DAQ Data
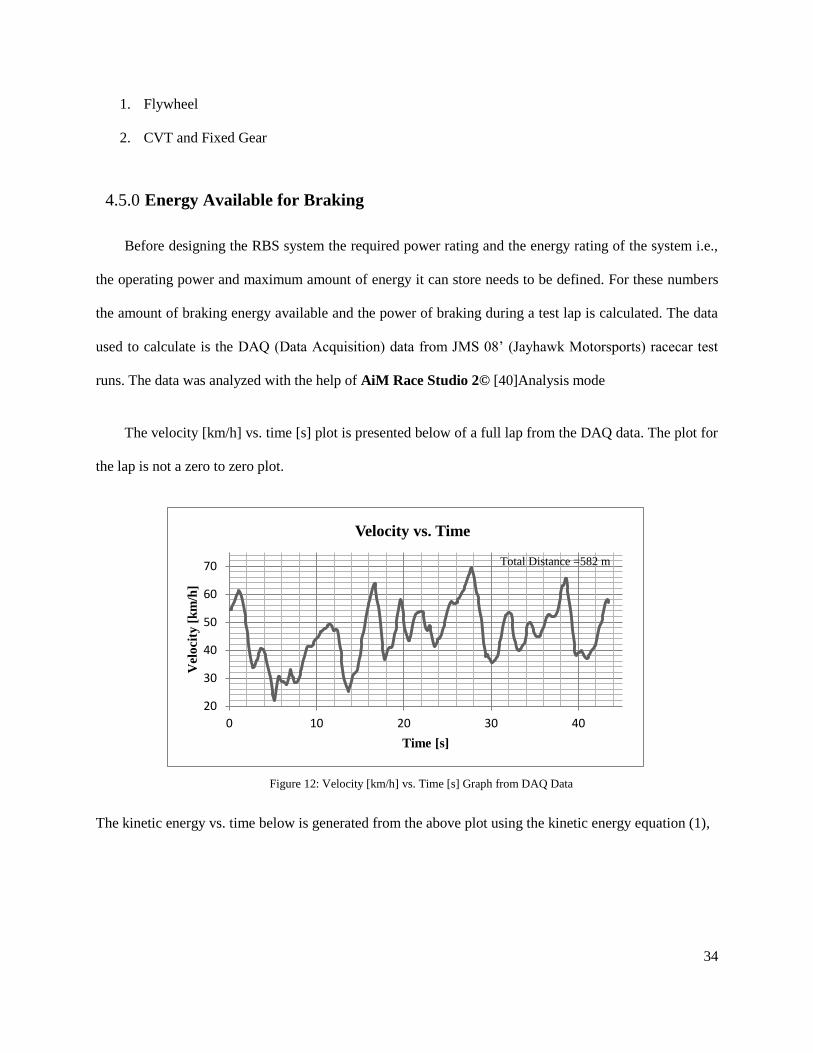
The kinetic energy vs. time below is generated from the above plot using the kinetic energy equation (1),
20
30
40
50
60
70
0 10 20 30 40
Vel
oci
ty [
km
/h]
Time [s]
Velocity vs. Time
Total Distance =582 m
Energy Available for Braking 4.5.0
35
Figure 13: Translational Kinetic Energy [kJ] vs. Time [s] of the vehicle
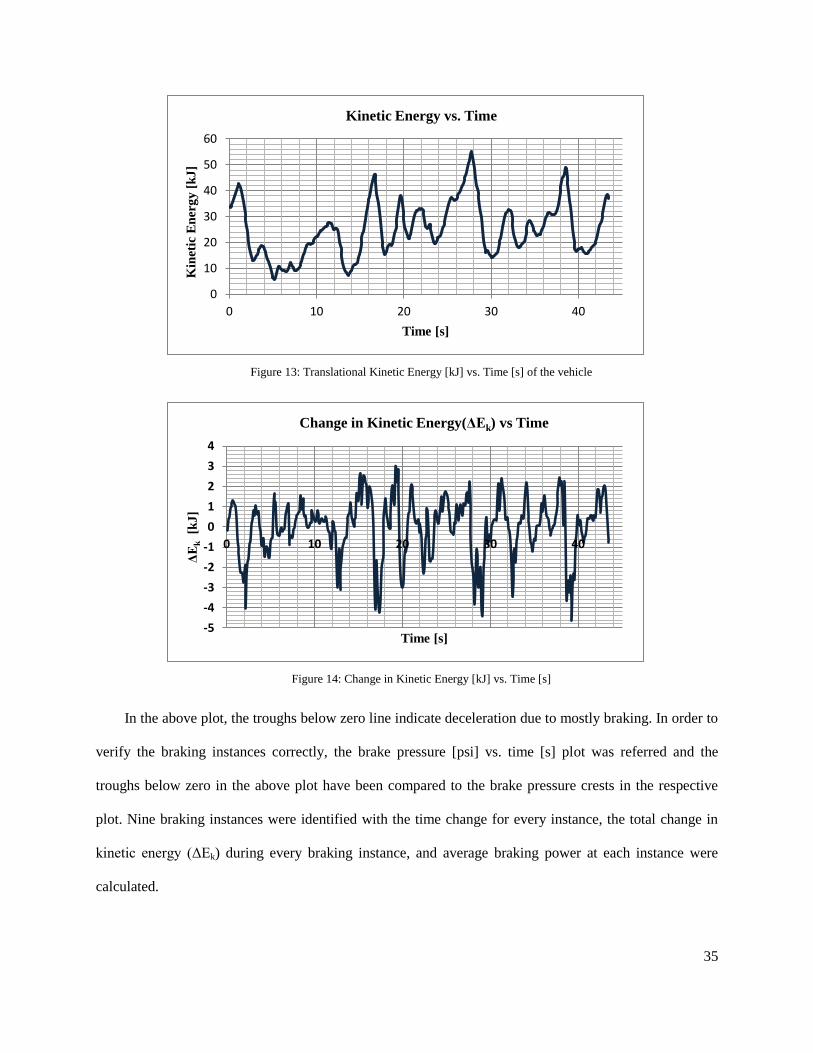
Figure 14: Change in Kinetic Energy [kJ] vs. Time [s]
In the above plot, the troughs below zero line indicate deceleration due to mostly braking. In order to
verify the braking instances correctly, the brake pressure [psi] vs. time [s] plot was referred and the
troughs below zero in the above plot have been compared to the brake pressure crests in the respective
plot. Nine braking instances were identified with the time change for every instance, the total change in
kinetic energy (ΔEk) during every braking instance, and average braking power at each instance were
calculated.
0
10
20
30
40
50
60
0 10 20 30 40
Kin
etic
En
erg
y [
kJ
]
Time [s]
Kinetic Energy vs. Time
-5
-4
-3
-2
-1
0
1
2
3
4
0 10 20 30 40
ΔE
k
[kJ
]
Time [s]
Change in Kinetic Energy(ΔEk) vs Time
36
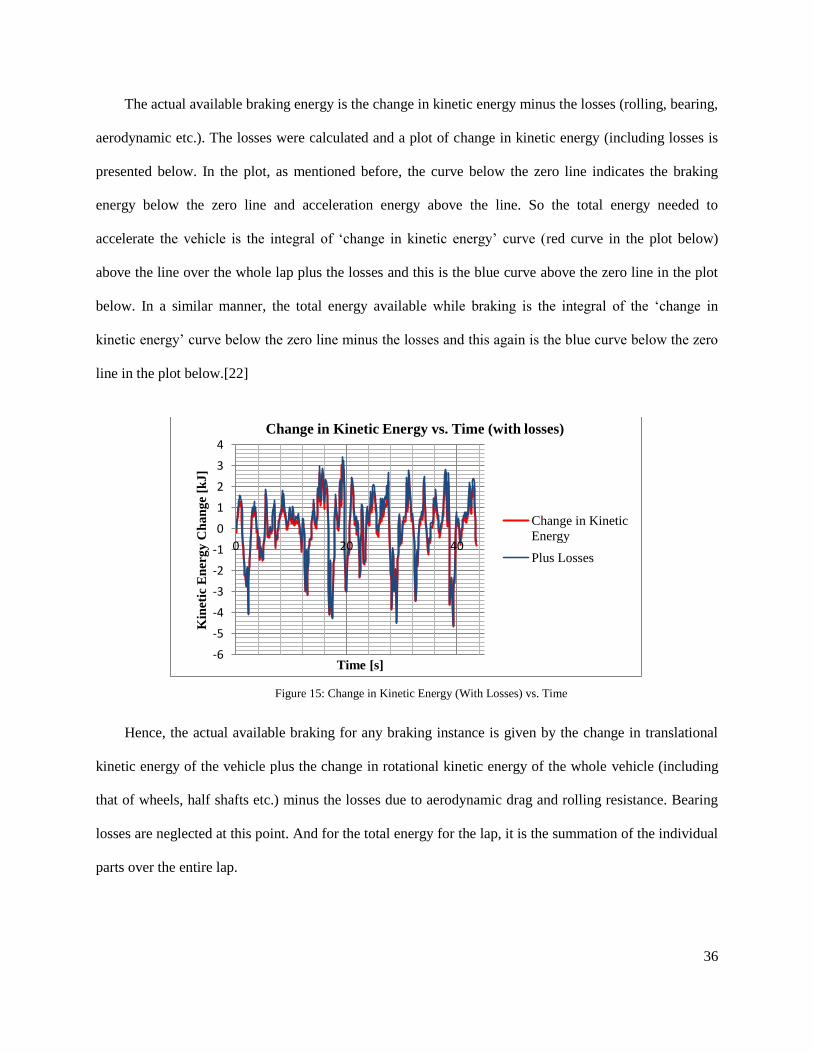
The actual available braking energy is the change in kinetic energy minus the losses (rolling, bearing,
aerodynamic etc.). The losses were calculated and a plot of change in kinetic energy (including losses is
presented below. In the plot, as mentioned before, the curve below the zero line indicates the braking
energy below the zero line and acceleration energy above the line. So the total energy needed to
accelerate the vehicle is the integral of ‘change in kinetic energy’ curve (red curve in the plot below)
above the line over the whole lap plus the losses and this is the blue curve above the zero line in the plot
below. In a similar manner, the total energy available while braking is the integral of the ‘change in
kinetic energy’ curve below the zero line minus the losses and this again is the blue curve below the zero
line in the plot below.[22]
Figure 15: Change in Kinetic Energy (With Losses) vs. Time
Hence, the actual available braking for any braking instance is given by the change in translational
kinetic energy of the vehicle plus the change in rotational kinetic energy of the whole vehicle (including
that of wheels, half shafts etc.) minus the losses due to aerodynamic drag and rolling resistance. Bearing
losses are neglected at this point. And for the total energy for the lap, it is the summation of the individual
parts over the entire lap.
-6
-5
-4
-3
-2
-1
0
1
2
3
4
0 20 40
Kin
etic
En
erg
y C
ha
ng
e [k
J]
Time [s]
Change in Kinetic Energy vs. Time (with losses)
Change in Kinetic
Energy
Plus Losses
37
(4)
∑ ∑ ∑ ∑ (5)
(6)
( ) (7)
Where, ΔEa,b : Available braking energy at any instance of braking
ΔEk : Change in translational kinetic energy of the vehicle during any braking instance
ΔEk,rot : Change in rotational kinetic energy due to all rotating parts
Wlosses : Work done to overcome aerodynamic and rolling resistance losses
Flosses : Force at vehicle/wheel due to losses (aero and rolling)
d : Braking distance
Fd : Aerodynamic Drag Force
µr : Coefficient of rolling friction [41]
g : Acceleration due to gravity = 9.8 m/s2
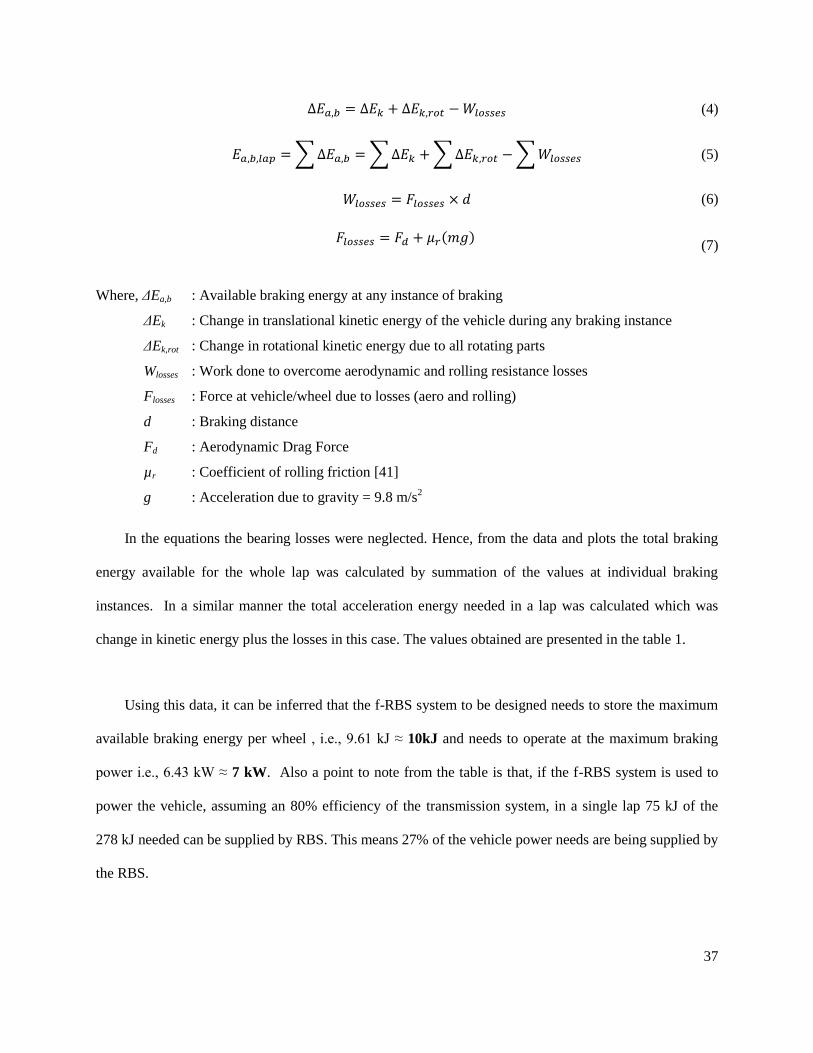
In the equations the bearing losses were neglected. Hence, from the data and plots the total braking
energy available for the whole lap was calculated by summation of the values at individual braking
instances. In a similar manner the total acceleration energy needed in a lap was calculated which was
change in kinetic energy plus the losses in this case. The values obtained are presented in the table 1.
Using this data, it can be inferred that the f-RBS system to be designed needs to store the maximum
available braking energy per wheel , i.e., 9.61 kJ ≈ 10kJ and needs to operate at the maximum braking
power i.e., 6.43 kW ≈ 7 kW. Also a point to note from the table is that, if the f-RBS system is used to
power the vehicle, assuming an 80% efficiency of the transmission system, in a single lap 75 kJ of the
278 kJ needed can be supplied by RBS. This means 27% of the vehicle power needs are being supplied by
the RBS.
38
Table 1: Available Brake Energy from Lap Data
Calculated property Total
At the front axle
(assuming 50%
bias)
per wheel
(Total/2)
Maximum Braking energy in any instance
[kJ] -38.434 -19.217 -9.609
Average braking energy (per Braking
Instance) [kJ] -21.039 -10.520 -5.260
Maximum braking power in any instance
[kW] -25.722 -12.861 -6.430
Average braking power [kW] -16.057 -8.028 -4.014
Total Brake Energy available per lap [kJ] -189.351 -94.676 -47.338
Total Acceleration energy needed per lap
[kJ] 278.200 - -
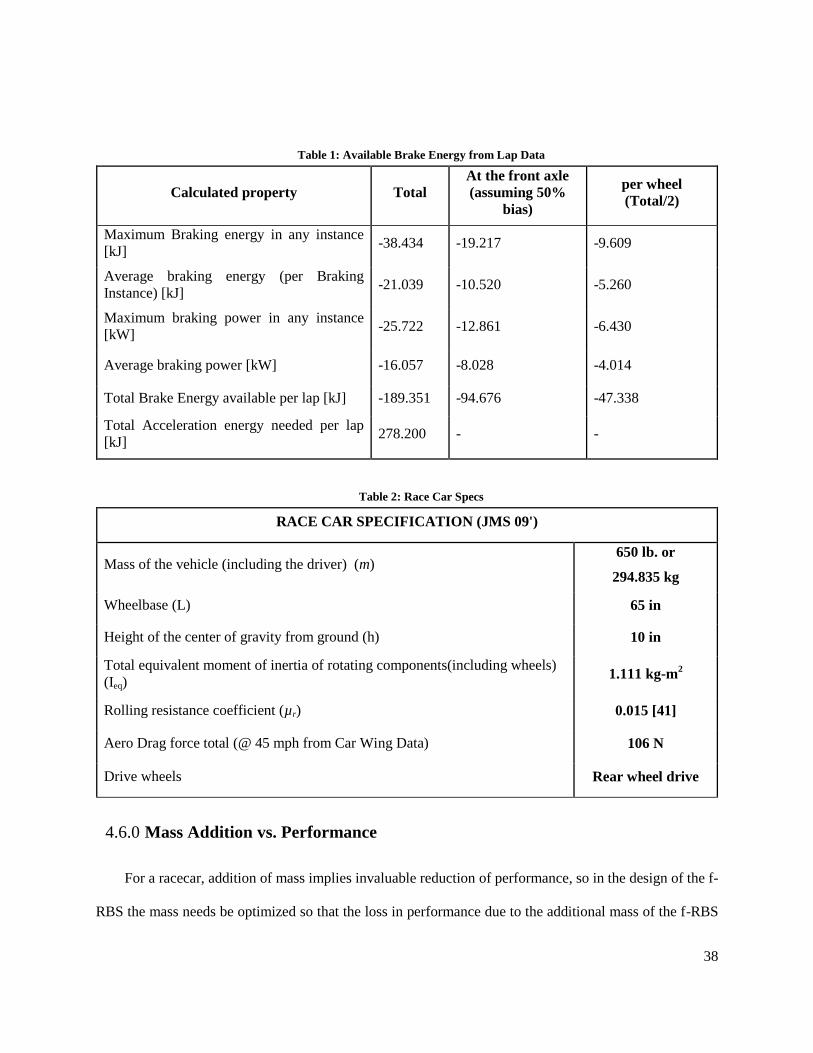
Table 2: Race Car Specs
RACE CAR SPECIFICATION (JMS 09')
Mass of the vehicle (including the driver) (m) 650 lb. or
294.835 kg
Wheelbase (L) 65 in
Height of the center of gravity from ground (h) 10 in
Total equivalent moment of inertia of rotating components(including wheels)
(Ieq) 1.111 kg-m
2
Rolling resistance coefficient (µr) 0.015 [41]
Aero Drag force total (@ 45 mph from Car Wing Data) 106 N
Drive wheels Rear wheel drive
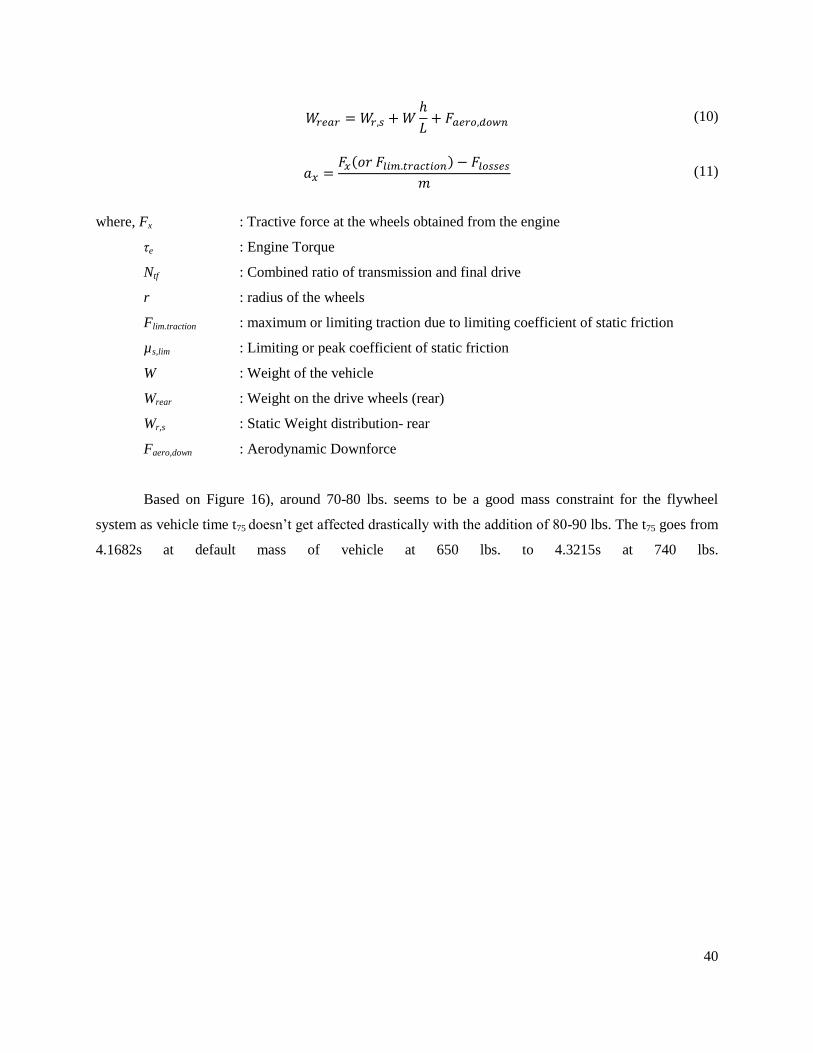
For a racecar, addition of mass implies invaluable reduction of performance, so in the design of the f-
RBS the mass needs be optimized so that the loss in performance due to the additional mass of the f-RBS
Mass Addition vs. Performance 4.6.0
39
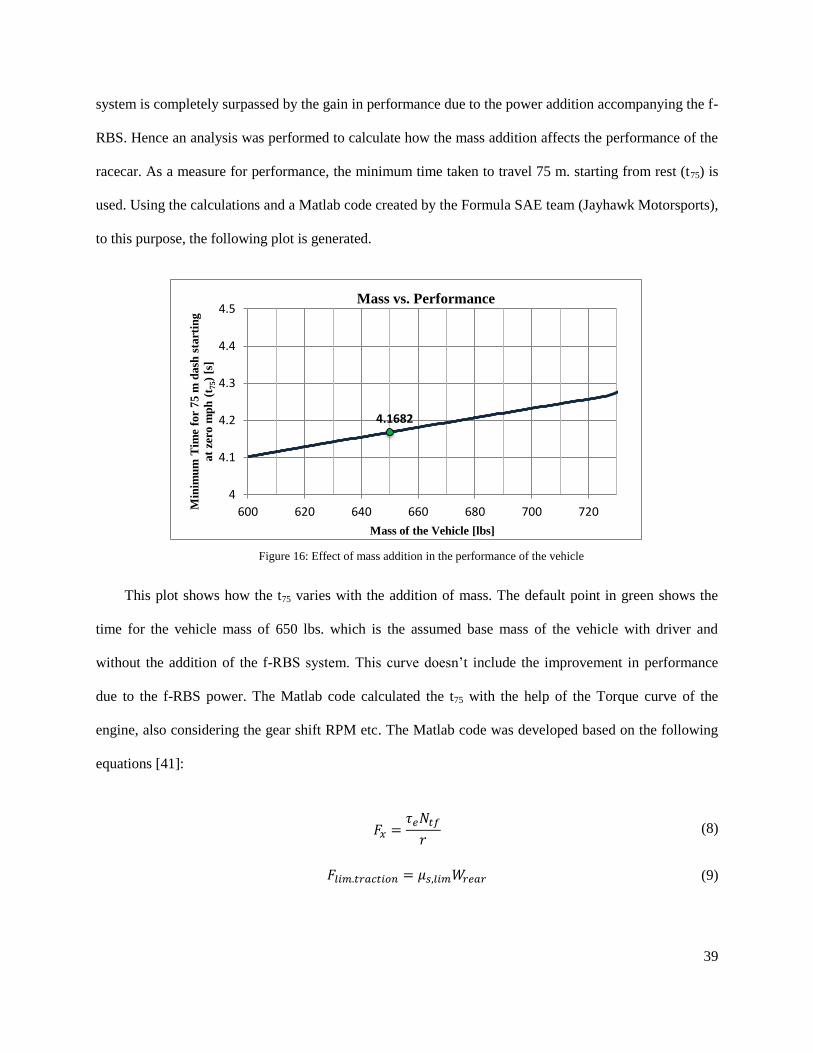
system is completely surpassed by the gain in performance due to the power addition accompanying the f-
RBS. Hence an analysis was performed to calculate how the mass addition affects the performance of the
racecar. As a measure for performance, the minimum time taken to travel 75 m. starting from rest (t75) is
used. Using the calculations and a Matlab code created by the Formula SAE team (Jayhawk Motorsports),
to this purpose, the following plot is generated.
Figure 16: Effect of mass addition in the performance of the vehicle
This plot shows how the t75 varies with the addition of mass. The default point in green shows the
time for the vehicle mass of 650 lbs. which is the assumed base mass of the vehicle with driver and
without the addition of the f-RBS system. This curve doesn’t include the improvement in performance
due to the f-RBS power. The Matlab code calculated the t75 with the help of the Torque curve of the
engine, also considering the gear shift RPM etc. The Matlab code was developed based on the following
equations [41]:
(8)
(9)
4.1682
4
4.1
4.2
4.3
4.4
4.5
600 620 640 660 680 700 720Min
imu
m T
ime
for
75
m d
ash
sta
rtin
g
at
zero
mp
h (
t 75)
[s]
Mass of the Vehicle [lbs]
Mass vs. Performance
40
(10)
( )
(11)
where, Fx : Tractive force at the wheels obtained from the engine
τe : Engine Torque
Ntf : Combined ratio of transmission and final drive
r : radius of the wheels
Flim.traction : maximum or limiting traction due to limiting coefficient of static friction
µs,lim : Limiting or peak coefficient of static friction
W : Weight of the vehicle
Wrear : Weight on the drive wheels (rear)
Wr,s : Static Weight distribution- rear
Faero,down : Aerodynamic Downforce
Based on Figure 16), around 70-80 lbs. seems to be a good mass constraint for the flywheel
system as vehicle time t75 doesn’t get affected drastically with the addition of 80-90 lbs. The t75 goes from
4.1682s at default mass of vehicle at 650 lbs. to 4.3215s at 740 lbs.
41
For the current application, the CVT/Variator design needs to operate in a particular manner:
1. The CVT continuous ratio change should be externally controllable
2. The rated power rating should match that required by the f-RBS
3. It should have a wide ratio so as to affect size reduction of flywheel
The reasoning for the above points – as per kinetic energy equation of the flywheel – equation (2),
the amount of energy stored in a flywheel is directly proportional to the Moment of inertia I and the
square of the rotational velocity ω. So, either a flywheel can be designed to be of less mass and operate at
higher velocities or vice versa. For the given application and due to limit set by available maximum range
of CVT (explained later) and safety concerns, a requirement of lower operating speeds of flywheel was
decided upon. This automatically implied that the flywheel design needs to compensate on moment of
inertia and hence the mass of the flywheel. As mentioned, CVT design/selection sets a limit on the design
of the flywheel. Since the available energy is a function of moment of inertia, the maximum flywheel
speed pertaining to the maximum energy available varies. The CVT range is the constraining factor to the
maximum speed flywheel can achieve and hence to the maximum energy it can capture out of the
available energy. In order to maximize capturing either the mass/moment of inertia needs to be increased
or the range needs to increase.
Mechanical Variators/CVTs, presently used in the industry, are of different design and operational
capabilities due to the varying needs of the applications. They are known by different nomenclature
depending on the application. One of the types of CVTs are the ones used in the automotive sector, the
‘Torque converters’ or ‘Belt-CVTs”- these CVT’s used in the scooters, tractors etc. are designed either
for high performance or for high fuel economy. The common belt CVTs used in scooters or ATVs are
designed to automatically shift from the low to high ratio and vice versa depending upon the output
torque load or speed load with the help of springs, weights and other torque/speed sensing equipment. In
5.0 CVT DESIGN/SELECTION
42
case of heavy duty industrial application (machines utilizing electric motors etc.,) the CVTs better known
as ‘Variable Speed Drives’, are designed to vary output speed(driven shaft) continuously for a constant
speed of electric motor(driver shaft), either manually controlled or with automatic operation on the basis
of load. [42, 43]
The need of the present system is as follows: as mentioned before in the system operation, at the
need of regen-braking or Accel-boost mode initiation, the CVT ratio needs to be set so as to synchronize
the speeds of the driver and driven i.e., the wheel and flywheel or vice versa. And once they are engaged
through the clutches, the gear ratio needs to be switched continuously from the current value to either a
higher or lower gear, so as to initiate an energy transfer. Hence, for this operation the CVT needs to be
externally controllable as per need.
After examining all the variator/CVT/Variable speed drive options available, it was decided that
either of the options given below are suitable for the present application:
1. A Variable speed drive of ‘Fixed Center type Drive’ design e.g., Speed Selector Fixed center
variable pulley drive – series 45 which has a manually controllable pulley. [42]
2. A modified design of torque converter/CVT system used in ATVs and scooters e.g., a Comet
Symmetric 40 series Torque converter.[44]
In case of the Variable Speed Drives, the advantages are that these systems are available in the
power rating required for the f-RBS system and also that they can be externally controlled. But, on the
downside, they are heavy in construction and are designed for a system in which the driver (usually an
electric motor) operates at constant RPM and driven varies, whereas in the context of the f-RBS in this
thesis both the driver and driven operate at varying RPM. This fact needs to be examined while selecting
a variable speed drive.
A modified design of a CVT/Torque converter is desirable, as they are simple in construction, lighter
weight and available in the power rating required.
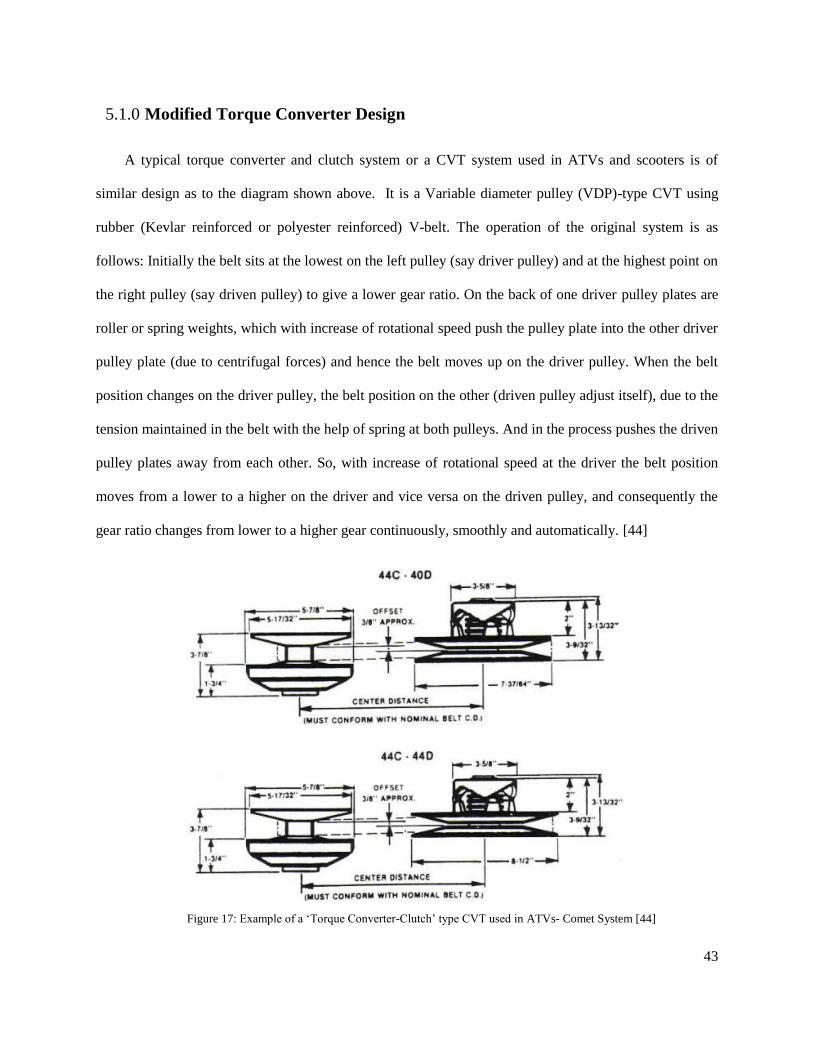
43
A typical torque converter and clutch system or a CVT system used in ATVs and scooters is of
similar design as to the diagram shown above. It is a Variable diameter pulley (VDP)-type CVT using
rubber (Kevlar reinforced or polyester reinforced) V-belt. The operation of the original system is as
follows: Initially the belt sits at the lowest on the left pulley (say driver pulley) and at the highest point on
the right pulley (say driven pulley) to give a lower gear ratio. On the back of one driver pulley plates are
roller or spring weights, which with increase of rotational speed push the pulley plate into the other driver
pulley plate (due to centrifugal forces) and hence the belt moves up on the driver pulley. When the belt
position changes on the driver pulley, the belt position on the other (driven pulley adjust itself), due to the
tension maintained in the belt with the help of spring at both pulleys. And in the process pushes the driven
pulley plates away from each other. So, with increase of rotational speed at the driver the belt position
moves from a lower to a higher on the driver and vice versa on the driven pulley, and consequently the
gear ratio changes from lower to a higher gear continuously, smoothly and automatically. [44]
Figure 17: Example of a ‘Torque Converter-Clutch’ type CVT used in ATVs- Comet System [44]
Modified Torque Converter Design 5.1.0
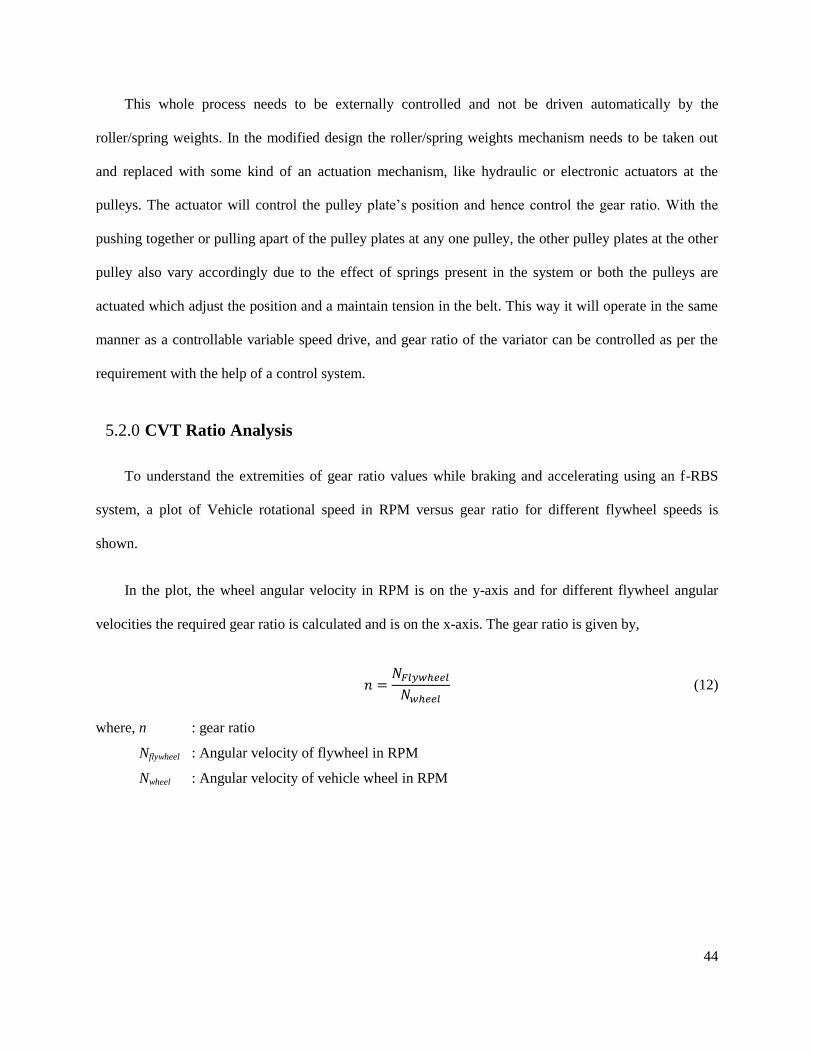
44
This whole process needs to be externally controlled and not be driven automatically by the
roller/spring weights. In the modified design the roller/spring weights mechanism needs to be taken out
and replaced with some kind of an actuation mechanism, like hydraulic or electronic actuators at the
pulleys. The actuator will control the pulley plate’s position and hence control the gear ratio. With the
pushing together or pulling apart of the pulley plates at any one pulley, the other pulley plates at the other
pulley also vary accordingly due to the effect of springs present in the system or both the pulleys are
actuated which adjust the position and a maintain tension in the belt. This way it will operate in the same
manner as a controllable variable speed drive, and gear ratio of the variator can be controlled as per the
requirement with the help of a control system.
To understand the extremities of gear ratio values while braking and accelerating using an f-RBS
system, a plot of Vehicle rotational speed in RPM versus gear ratio for different flywheel speeds is
shown.
In the plot, the wheel angular velocity in RPM is on the y-axis and for different flywheel angular
velocities the required gear ratio is calculated and is on the x-axis. The gear ratio is given by,
(12)
where, n : gear ratio
Nflywheel : Angular velocity of flywheel in RPM
Nwheel : Angular velocity of vehicle wheel in RPM
CVT Ratio Analysis 5.2.0
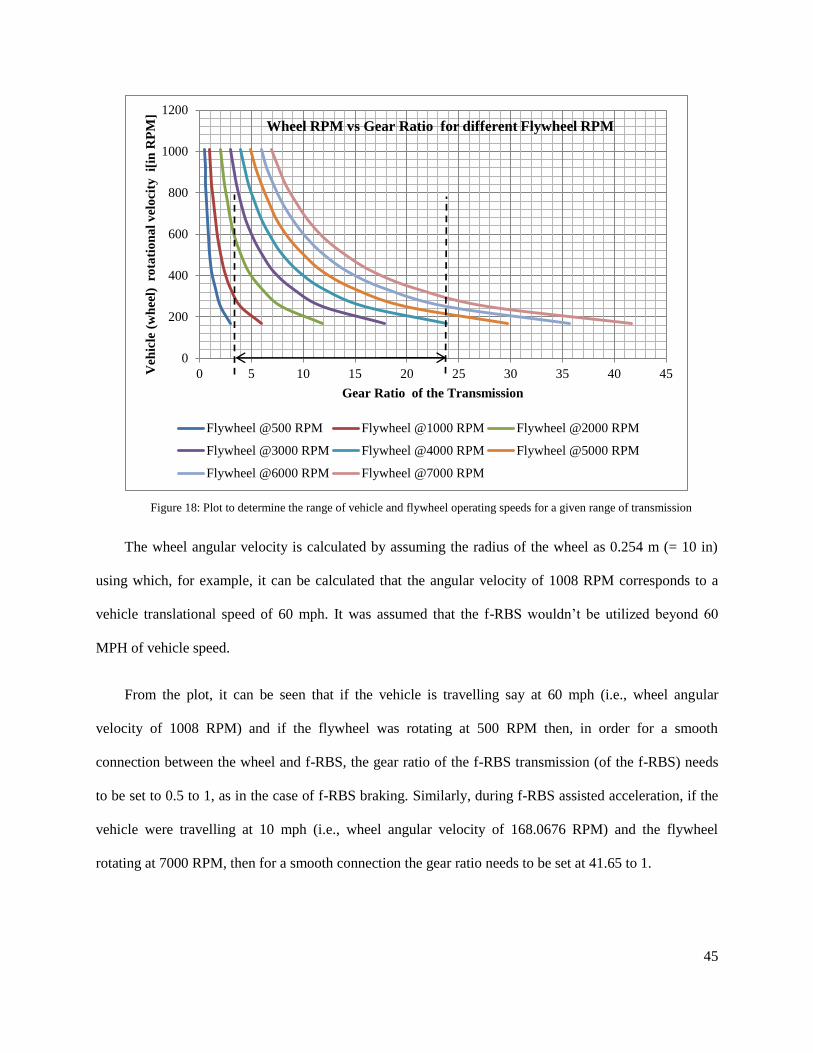
45
Figure 18: Plot to determine the range of vehicle and flywheel operating speeds for a given range of transmission
The wheel angular velocity is calculated by assuming the radius of the wheel as 0.254 m (= 10 in)
using which, for example, it can be calculated that the angular velocity of 1008 RPM corresponds to a
vehicle translational speed of 60 mph. It was assumed that the f-RBS wouldn’t be utilized beyond 60
MPH of vehicle speed.
From the plot, it can be seen that if the vehicle is travelling say at 60 mph (i.e., wheel angular
velocity of 1008 RPM) and if the flywheel was rotating at 500 RPM then, in order for a smooth
connection between the wheel and f-RBS, the gear ratio of the f-RBS transmission (of the f-RBS) needs
to be set to 0.5 to 1, as in the case of f-RBS braking. Similarly, during f-RBS assisted acceleration, if the
vehicle were travelling at 10 mph (i.e., wheel angular velocity of 168.0676 RPM) and the flywheel
rotating at 7000 RPM, then for a smooth connection the gear ratio needs to be set at 41.65 to 1.
0
200
400
600
800
1000
1200
0 5 10 15 20 25 30 35 40 45Veh
icle
(w
hee
l) ro
tati
on
al
vel
oci
ty i[
in R
PM
]
Gear Ratio of the Transmission
Wheel RPM vs Gear Ratio for different Flywheel RPM
Flywheel @500 RPM Flywheel @1000 RPM Flywheel @2000 RPM
Flywheel @3000 RPM Flywheel @4000 RPM Flywheel @5000 RPM
Flywheel @6000 RPM Flywheel @7000 RPM
46
It can be seen that, in order for the f-RBS system to operate at its full potential, either the
transmission needs to have a wide range or the flywheel maximum speed is lower, or both. After
exploring various CVT options in the industry and studying the above plot, it has been decided that a gear
ratio range for the f-RBS transmission of 4 -24 i.e., 4 to 1 being the highest gear and 24 to 1 being the
lowest, would be optimum and achievable. One way to obtain the ratio range is by using a combination
of a CVT with ratio range of 1 – 6 (i.e., 1:1 to 6:1) and fixed flywheel gearing of 4:1.
Also from the plot, it can be inferred that for a 4 – 24 ratio range, the maximum wheel angular
velocity at which f-RBS can be used for braking is 800 RPM (i.e., translational velocity ≈ 48 mph) and a
minimum angular velocity of 336 RPM (i.e., a translational velocity ≈ 48 mph) if a f-RBS assisted
acceleration were to be used with flywheel rotating at 7000 RPM. This way, the plot can be used to
determine the range of operation of the f-RBS for the vehicle, which in this case is 3000-7000 RPM for
the flywheel and around 300-800 RPM (i.e., 20-48 mph range). The plot is also used to set the maximum
angular velocity design constraint for the flywheel which is 7000 RPM.
47
The flywheel is the energy storage component of the regenerative braking system. In applications
with frequent power requirements, flywheel as an ESS is an attractive alternative, with negligible losses
in cycle and storage efficiency over time.
According to the equation of the kinetic energy stored in a rotating flywheel, given by equation (2),
flywheel designs are classified on the basis of angular velocities of operation and moment of inertia
characteristics. On this basis, flywheel designs can be Low speed or High speed with Low or high
moment of inertia. With the needs of the application, low speed or high speed flywheels are employed.
Both the low speed as well as high speed flywheel design with different geometries can be utilized for the
same stored energy requirement. Common materials like metals are usually employed for making low
speed flywheels as they are heavy and are economical , although they do tend to have safety concerns of
shattering at high speeds,. As for high speed flywheels, composite materials tend to be used, as they have
high specific tensile strengths, consequently higher specific energies and also better failure characteristics
at higher speeds.
(13)
where, tm : Specific strength or specific tensile strength
σmax : Ultimate tensile strength
ρ : Mass density of the material
Specific energy is the amount of energy that can be stored per unit mass and is a function of the
material’s specific strength. So, on the basis of flywheel geometry and material there can be various
alternatives to satisfy a certain design need. [45, 46]
6.0 FLYWHEEL
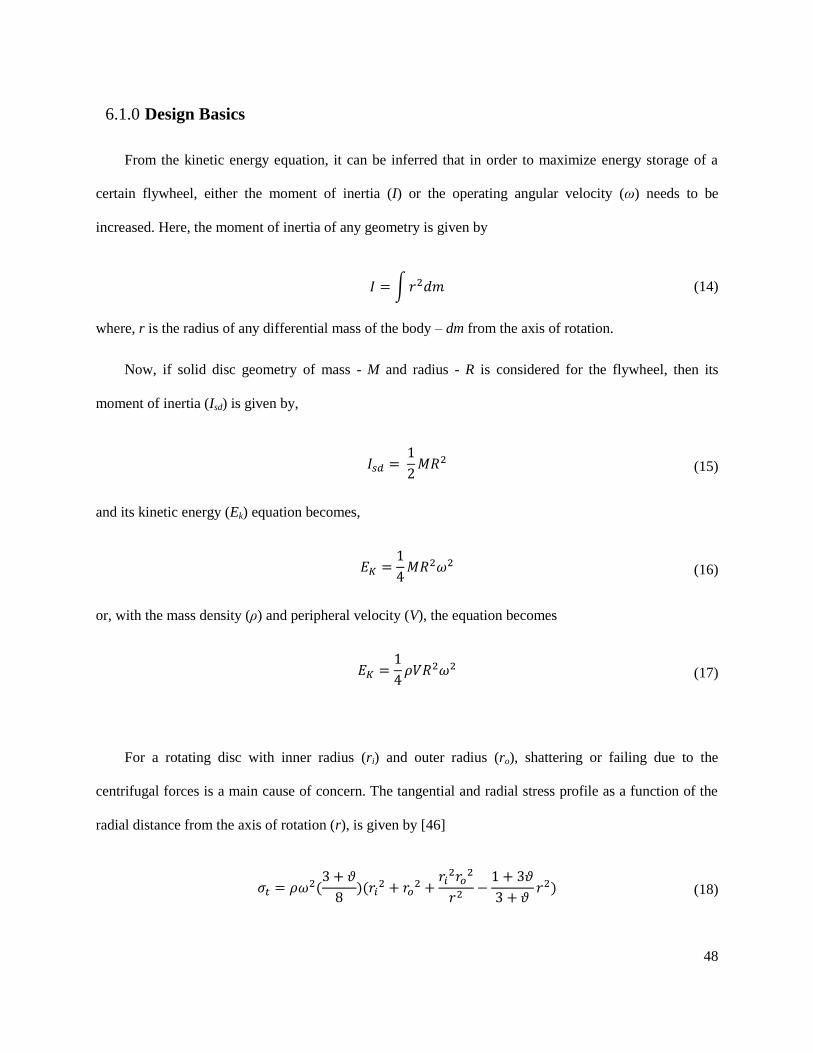
48
From the kinetic energy equation, it can be inferred that in order to maximize energy storage of a
certain flywheel, either the moment of inertia (I) or the operating angular velocity (ω) needs to be
increased. Here, the moment of inertia of any geometry is given by
∫ (14)
where, r is the radius of any differential mass of the body – dm from the axis of rotation.
Now, if solid disc geometry of mass - M and radius - R is considered for the flywheel, then its
moment of inertia (Isd) is given by,
(15)
and its kinetic energy (Ek) equation becomes,
(16)
or, with the mass density (ρ) and peripheral velocity (V), the equation becomes
(17)
For a rotating disc with inner radius (ri) and outer radius (ro), shattering or failing due to the
centrifugal forces is a main cause of concern. The tangential and radial stress profile as a function of the
radial distance from the axis of rotation (r), is given by [46]
(
)(
) (18)
Design Basics 6.1.0
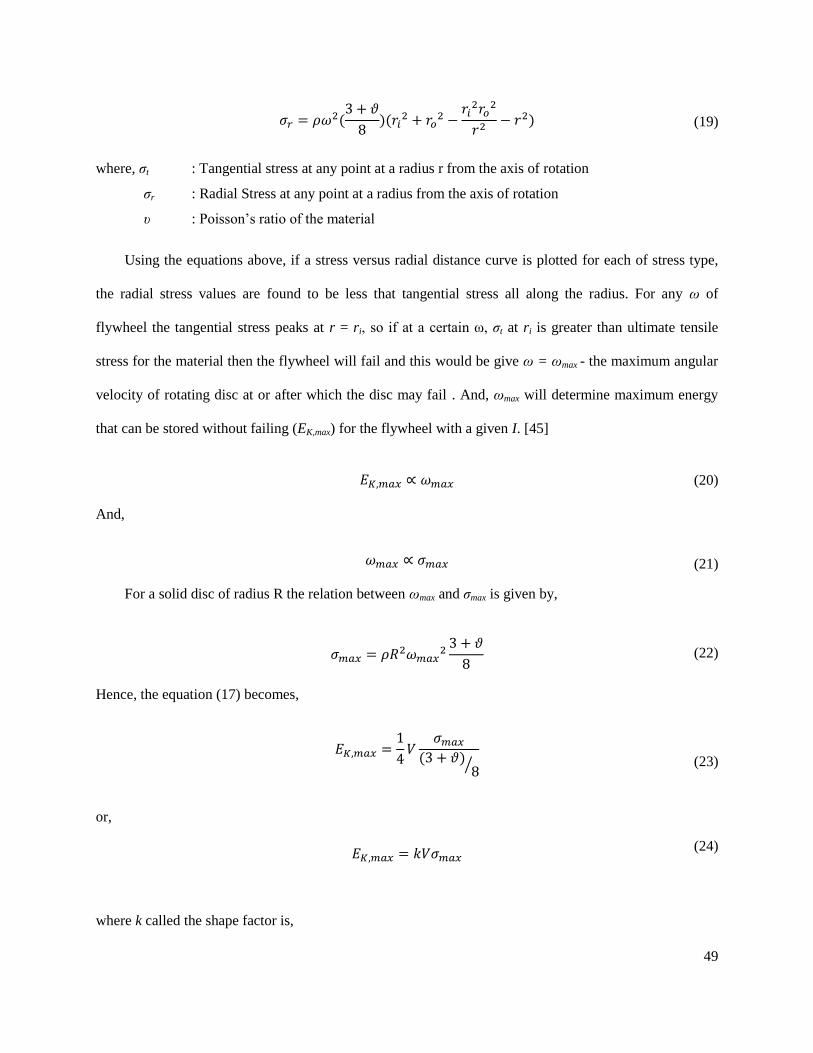
49
(
)(
) (19)
where, σt : Tangential stress at any point at a radius r from the axis of rotation
σr : Radial Stress at any point at a radius from the axis of rotation
υ : Poisson’s ratio of the material
Using the equations above, if a stress versus radial distance curve is plotted for each of stress type,
the radial stress values are found to be less that tangential stress all along the radius. For any ω of
flywheel the tangential stress peaks at r = ri, so if at a certain ω, σt at ri is greater than ultimate tensile
stress for the material then the flywheel will fail and this would be give ω = ωmax - the maximum angular
velocity of rotating disc at or after which the disc may fail . And, ωmax will determine maximum energy
that can be stored without failing (EK,max) for the flywheel with a given I. [45]
(20)
And,
(21)
For a solid disc of radius R the relation between ωmax and σmax is given by,
(22)
Hence, the equation (17) becomes,
( )
⁄
(23)
or,
(24)
where k called the shape factor is,
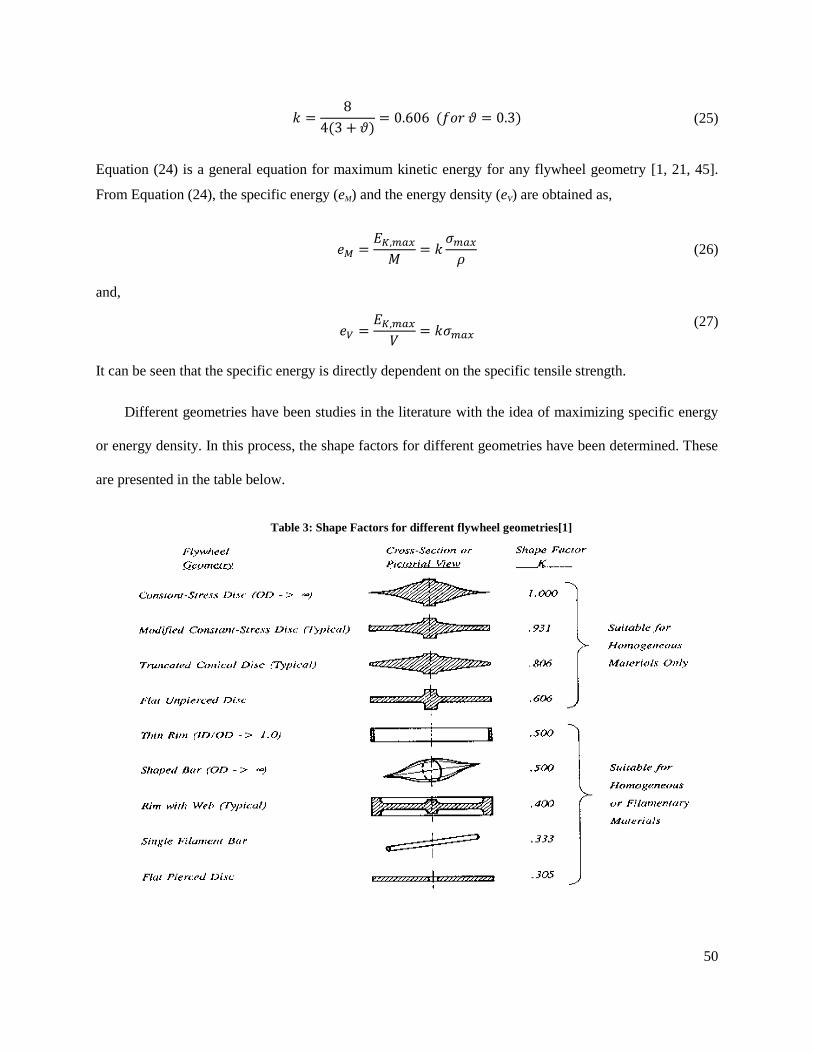
50
( ) ( ) (25)
Equation (24) is a general equation for maximum kinetic energy for any flywheel geometry [1, 21, 45].
From Equation (24), the specific energy (eM) and the energy density (eV) are obtained as,
(26)
and,
(27)
It can be seen that the specific energy is directly dependent on the specific tensile strength.
Different geometries have been studies in the literature with the idea of maximizing specific energy
or energy density. In this process, the shape factors for different geometries have been determined. These
are presented in the table below.
Table 3: Shape Factors for different flywheel geometries[1]
51
The design constraints for the flywheel for the f-RBS system are the following:
Table 4: List of design constraints for the flywheel
Constraint Type Description
Energy Storage ≈10-12 kJ
Mass < 80 lbs. (≈36.29 kg)
Space Constraint Compact
Transmission Constraint Gear ratio range = 4-24
Out of the above constraints, the critical constraint is the transmission subsystem gear ratio range.
Due to limitation placed by the transmission ratio range, the flywheel rotating speeds above 7000 RPM
cannot be utilized. Hence, a low speed flywheel design is chosen, which takes the transmission constraint
into consideration and is also economical to implement.
Now, using the kinetic energy equation, considering the flywheel stores maximum available energy
(≈10 kJ) at maximum utilizable rotational speed (≈ 7000 RPM), the moment of inertia of the flywheel (If)
needs to be
(28)
The specific tensile strengths for different metals are calculated to determine the material with better
specific energy capability. The material physical property data is obtained using SolidWorks.
Design of the Flywheel: 6.2.0
Material Selection 6.3.0
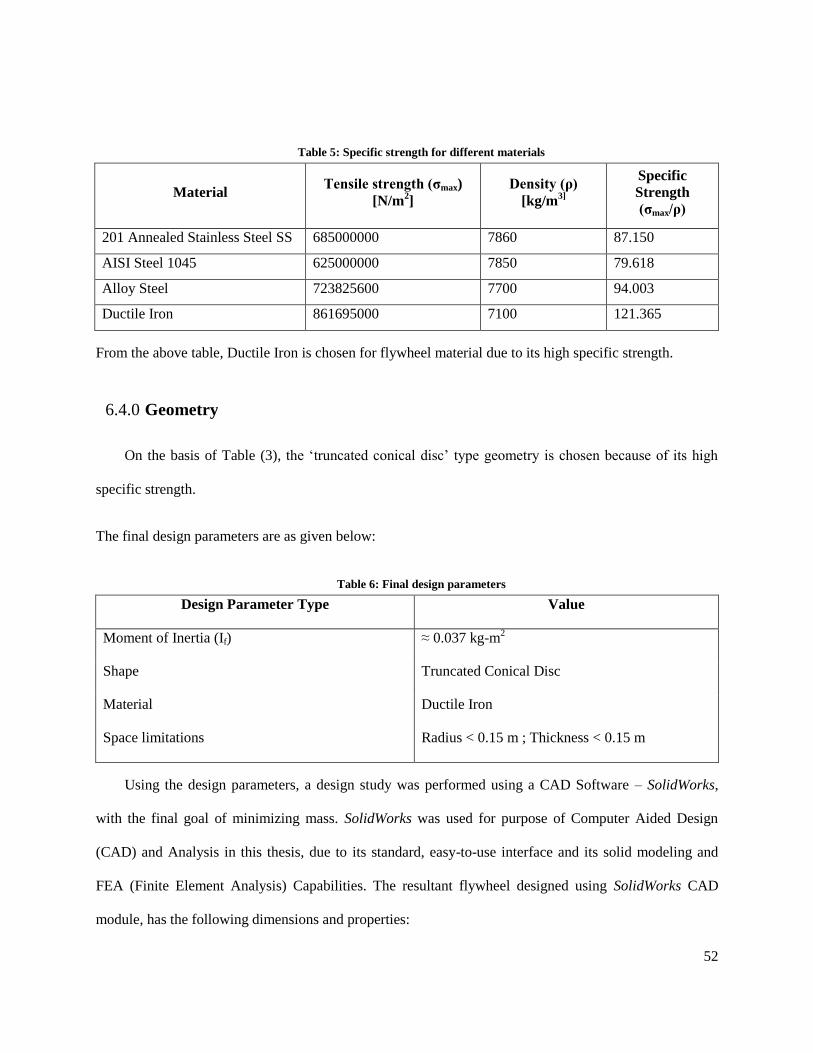
52
Table 5: Specific strength for different materials
Material Tensile strength (σmax)
[N/m2]
Density (ρ)
[kg/m3]
Specific
Strength
(σmax/ρ)
201 Annealed Stainless Steel SS 685000000 7860 87.150
AISI Steel 1045 625000000 7850 79.618
Alloy Steel 723825600 7700 94.003
Ductile Iron 861695000 7100 121.365
From the above table, Ductile Iron is chosen for flywheel material due to its high specific strength.
On the basis of Table (3), the ‘truncated conical disc’ type geometry is chosen because of its high
specific strength.
The final design parameters are as given below:
Table 6: Final design parameters
Design Parameter Type Value
Moment of Inertia (If) ≈ 0.037 kg-m2
Shape Truncated Conical Disc
Material Ductile Iron
Space limitations Radius < 0.15 m ; Thickness < 0.15 m
Using the design parameters, a design study was performed using a CAD Software – SolidWorks,
with the final goal of minimizing mass. SolidWorks was used for purpose of Computer Aided Design
(CAD) and Analysis in this thesis, due to its standard, easy-to-use interface and its solid modeling and
FEA (Finite Element Analysis) Capabilities. The resultant flywheel designed using SolidWorks CAD
module, has the following dimensions and properties:
Geometry 6.4.0
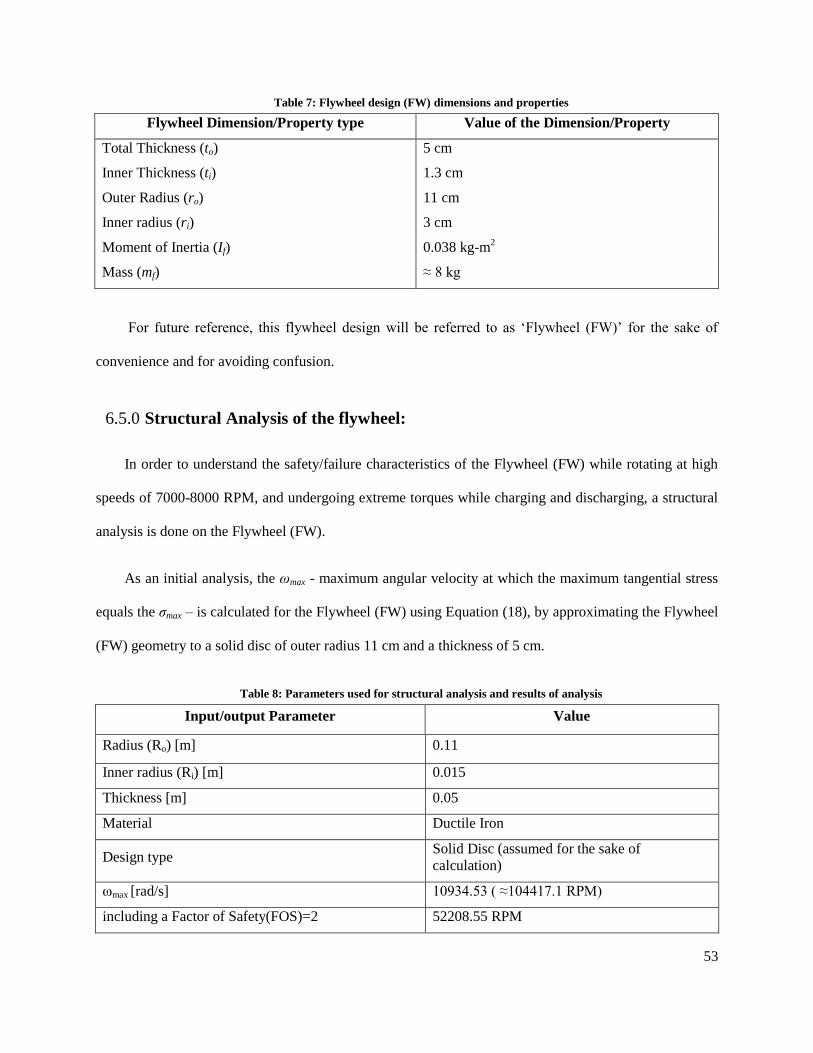
53
Table 7: Flywheel design (FW) dimensions and properties
Flywheel Dimension/Property type Value of the Dimension/Property
Total Thickness (to) 5 cm
Inner Thickness (ti) 1.3 cm
Outer Radius (ro) 11 cm
Inner radius (ri) 3 cm
Moment of Inertia (If) 0.038 kg-m2
Mass (mf) ≈ 8 kg
For future reference, this flywheel design will be referred to as ‘Flywheel (FW)’ for the sake of
convenience and for avoiding confusion.
In order to understand the safety/failure characteristics of the Flywheel (FW) while rotating at high
speeds of 7000-8000 RPM, and undergoing extreme torques while charging and discharging, a structural
analysis is done on the Flywheel (FW).
As an initial analysis, the ωmax - maximum angular velocity at which the maximum tangential stress
equals the σmax – is calculated for the Flywheel (FW) using Equation (18), by approximating the Flywheel
(FW) geometry to a solid disc of outer radius 11 cm and a thickness of 5 cm.
Table 8: Parameters used for structural analysis and results of analysis
Input/output Parameter Value
Radius (Ro) [m] 0.11
Inner radius (Ri) [m] 0.015
Thickness [m] 0.05
Material Ductile Iron
Design type Solid Disc (assumed for the sake of
calculation)
ωmax [rad/s] 10934.53 ( ≈104417.1 RPM)
including a Factor of Safety(FOS)=2 52208.55 RPM
Structural Analysis of the flywheel: 6.5.0
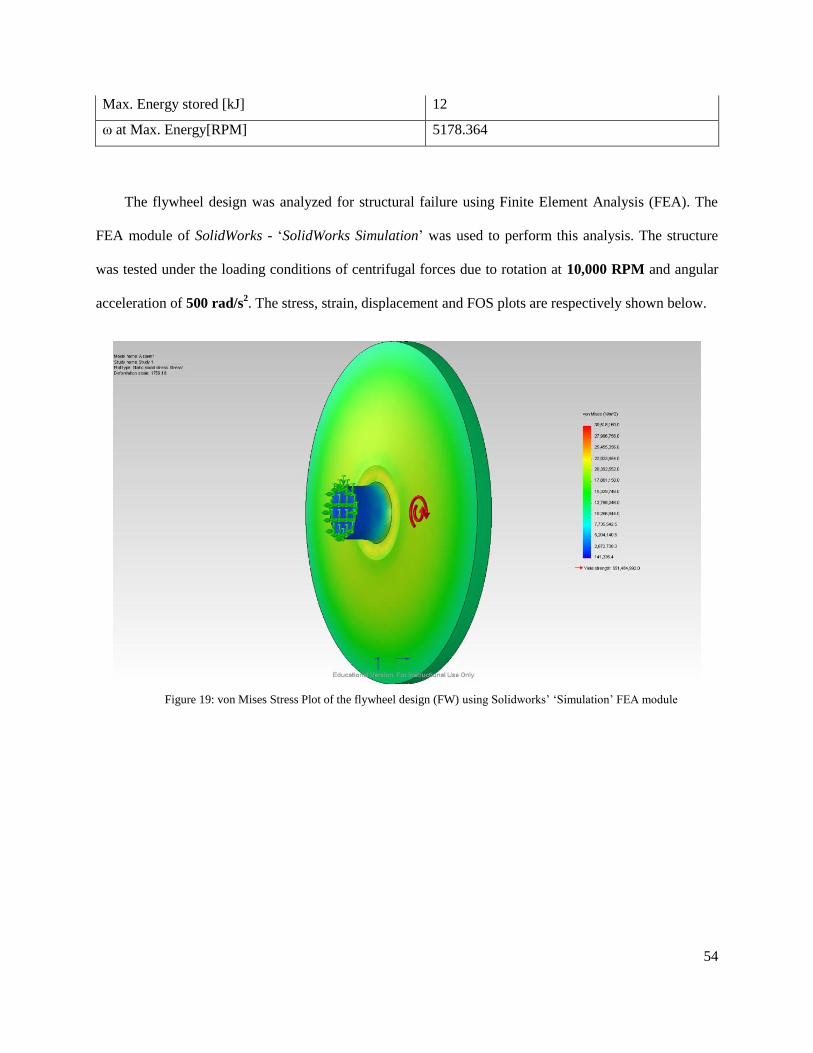
54
Max. Energy stored [kJ] 12
ω at Max. Energy[RPM] 5178.364
The flywheel design was analyzed for structural failure using Finite Element Analysis (FEA). The
FEA module of SolidWorks - ‘SolidWorks Simulation’ was used to perform this analysis. The structure
was tested under the loading conditions of centrifugal forces due to rotation at 10,000 RPM and angular
acceleration of 500 rad/s2. The stress, strain, displacement and FOS plots are respectively shown below.
Figure 19: von Mises Stress Plot of the flywheel design (FW) using Solidworks’ ‘Simulation’ FEA module
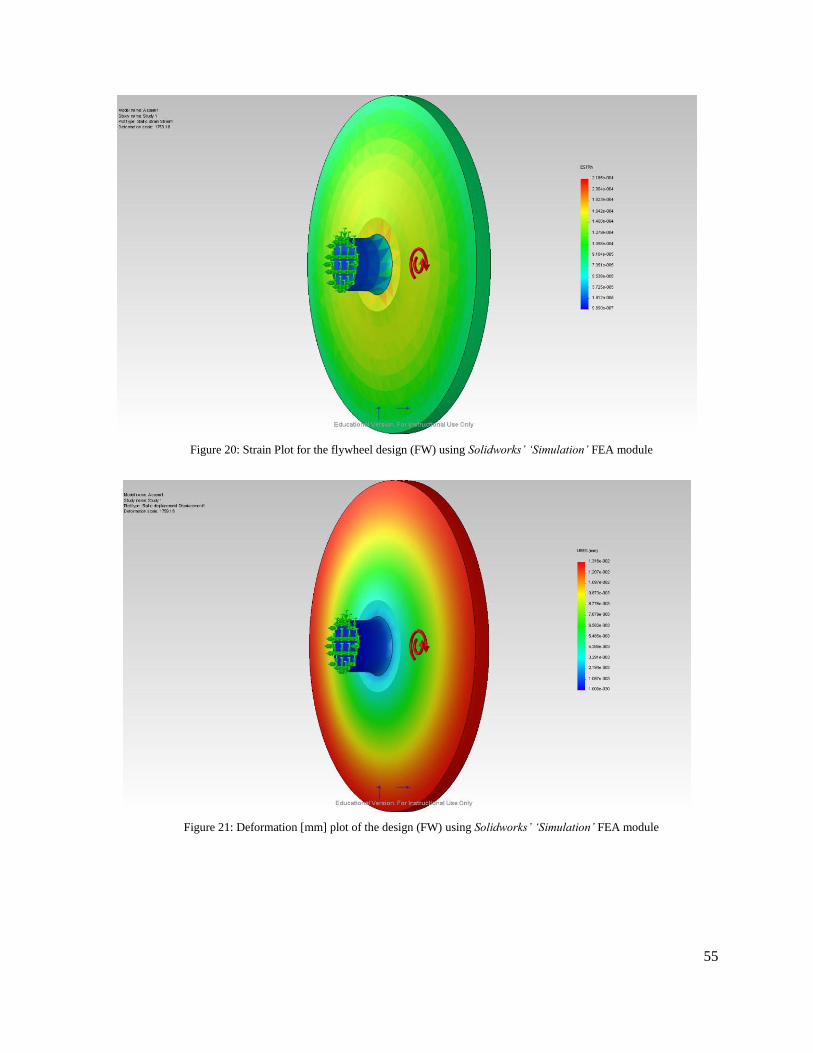
55
Figure 20: Strain Plot for the flywheel design (FW) using Solidworks’ ‘Simulation’ FEA module
Figure 21: Deformation [mm] plot of the design (FW) using Solidworks’ ‘Simulation’ FEA module
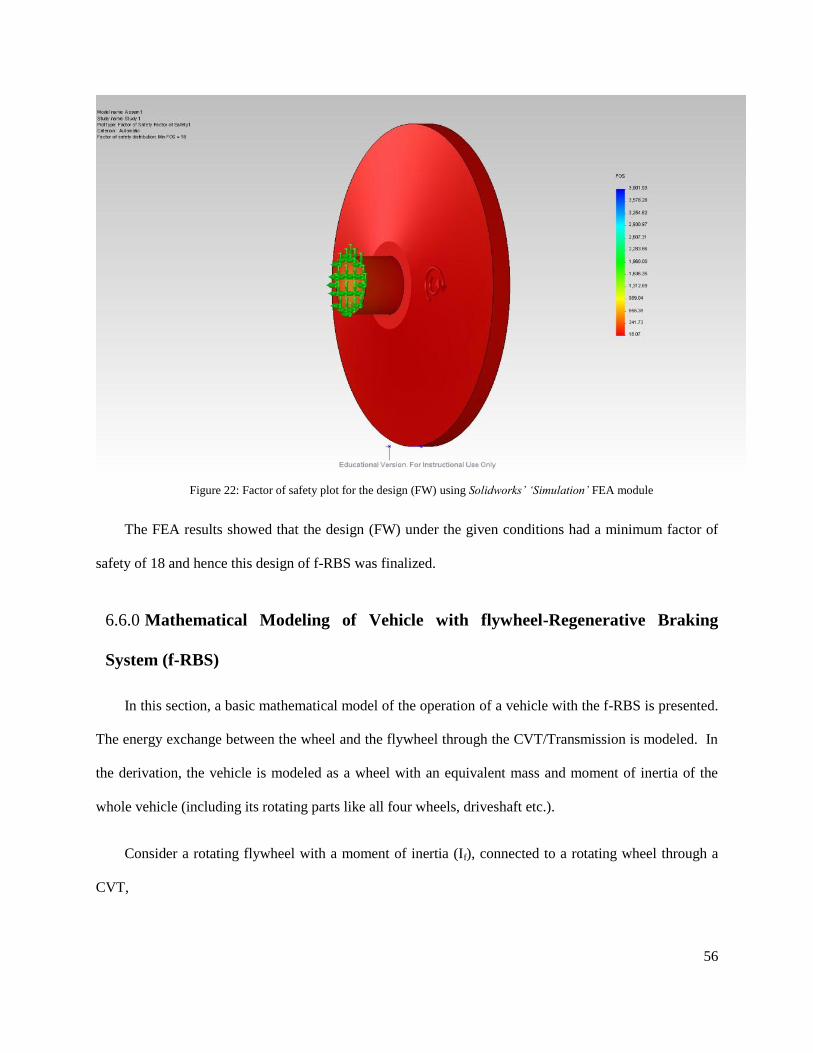
56
Figure 22: Factor of safety plot for the design (FW) using Solidworks’ ‘Simulation’ FEA module
The FEA results showed that the design (FW) under the given conditions had a minimum factor of
safety of 18 and hence this design of f-RBS was finalized.
In this section, a basic mathematical model of the operation of a vehicle with the f-RBS is presented.
The energy exchange between the wheel and the flywheel through the CVT/Transmission is modeled. In
the derivation, the vehicle is modeled as a wheel with an equivalent mass and moment of inertia of the
whole vehicle (including its rotating parts like all four wheels, driveshaft etc.).
Consider a rotating flywheel with a moment of inertia (If), connected to a rotating wheel through a
CVT,
Mathematical Modeling of Vehicle with flywheel-Regenerative Braking 6.6.0
System (f-RBS)
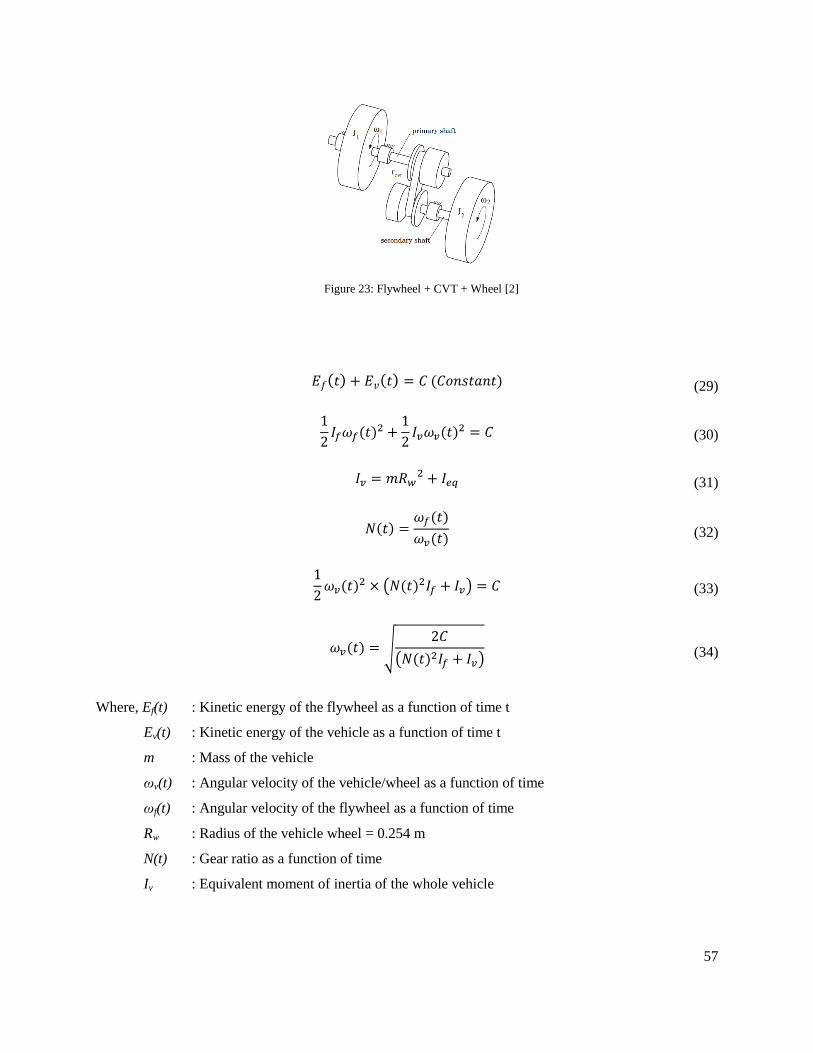
57
Figure 23: Flywheel + CVT + Wheel [2]
( ) ( ) ( ) (29)
( )
( )
(30)
(31)
( ) ( )
( ) (32)
( )
( ( ) ) (33)
( ) √
( ( ) ) (34)
Where, Ef(t) : Kinetic energy of the flywheel as a function of time t
Ev(t) : Kinetic energy of the vehicle as a function of time t
m : Mass of the vehicle
ωv(t) : Angular velocity of the vehicle/wheel as a function of time
ωf(t) : Angular velocity of the flywheel as a function of time
Rw : Radius of the vehicle wheel = 0.254 m
N(t) : Gear ratio as a function of time
Iv : Equivalent moment of inertia of the whole vehicle
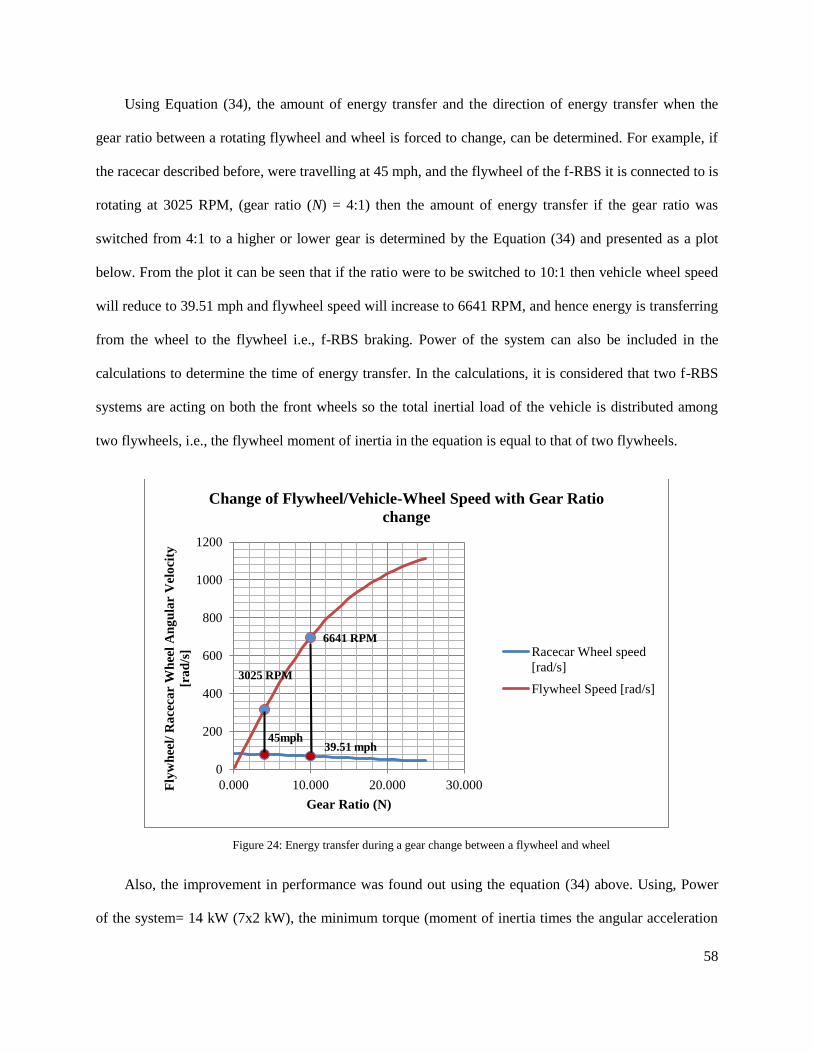
58
Using Equation (34), the amount of energy transfer and the direction of energy transfer when the
gear ratio between a rotating flywheel and wheel is forced to change, can be determined. For example, if
the racecar described before, were travelling at 45 mph, and the flywheel of the f-RBS it is connected to is
rotating at 3025 RPM, (gear ratio (N) = 4:1) then the amount of energy transfer if the gear ratio was
switched from 4:1 to a higher or lower gear is determined by the Equation (34) and presented as a plot
below. From the plot it can be seen that if the ratio were to be switched to 10:1 then vehicle wheel speed
will reduce to 39.51 mph and flywheel speed will increase to 6641 RPM, and hence energy is transferring
from the wheel to the flywheel i.e., f-RBS braking. Power of the system can also be included in the
calculations to determine the time of energy transfer. In the calculations, it is considered that two f-RBS
systems are acting on both the front wheels so the total inertial load of the vehicle is distributed among
two flywheels, i.e., the flywheel moment of inertia in the equation is equal to that of two flywheels.
Figure 24: Energy transfer during a gear change between a flywheel and wheel
Also, the improvement in performance was found out using the equation (34) above. Using, Power
of the system= 14 kW (7x2 kW), the minimum torque (moment of inertia times the angular acceleration
45mph 39.51 mph
3025 RPM
6641 RPM
0
200
400
600
800
1000
1200
0.000 10.000 20.000 30.000Fly
wh
eel/
Ra
ceca
r W
hee
l A
ng
ula
r V
elo
city
[ra
d/s
]
Gear Ratio (N)
Change of Flywheel/Vehicle-Wheel Speed with Gear Ratio
change
Racecar Wheel speed
[rad/s]
Flywheel Speed [rad/s]

59
of the wheel) and hence the minimum force delivered by the f-RBS(in the range of operation) to the
wheel is calculated and included in the performance calculations code described before (in the Mass vs.
Performance section). It was observed there was a gain of a minimum of 0.4 s gain due to the use of f-
RBS system. The gain in performance outperforms the loss due to the mass addition by at least 0.3 s.

60
TESTING, RESULTS AND DISCUSSION
61
Any scientific theory suggested is developed and validated with help of mathematical models and
experimental testing. Virtual testing is one computational method developed over the recent past which
bridges the gap between these two methods. It is the process of testing any principle/product using
Computer-aided tools by developing virtual prototypes and testing in conditions which can closely mimic
actual conditions with close to realistic assumptions. It has the benefits of mathematical models as it too
is a computational tool and hence is inexpensive, convenient and flexible in implementation with
relatively less time and resources required. For most engineering problems, the real life physics can be
simulated using Virtual testing, so most of the results of experimental testing can be generated with help
of virtual testing. Due to its flexible and economical nature, it is a useful initial testing or supplemental
tool to experimental testing. On this basis, it was chosen for this research. [47]
A Virtual Testing Rig model was developed using MSC ADAMS, a multibody dynamics and motion
analysis software, in order to validate the principle of operation of the flywheel Regenerative Braking
System (f-RBS). With the help of the Virtual test rig model, the kinematics of the f-RBS is to be studied
and the mathematical model developed in the previous section validated.
MSC ADAMS (Acronym: Automatic Dynamic Analysis of Mechanical Systems) is a powerful
software to analyze the dynamics of mechanical systems, by solving complex linear/non-linear dynamics,
kinematics, statics and quasi-statics problems pertaining to the system. ADAMS can be used to create
virtual prototypes of mechanical products and also for testing them on a virtual platform, in order to
optimize the design and function of the product. It can also be used to generate accurate loads and forces
in systems as an input for any Finite Element Analysis (FEA) code. MSC ADAMS has various modules
to integrate the various technologies in a system like vibration analysis, control system design etc. and
7.0 TESTING
About MSC ADAMS 7.1.0
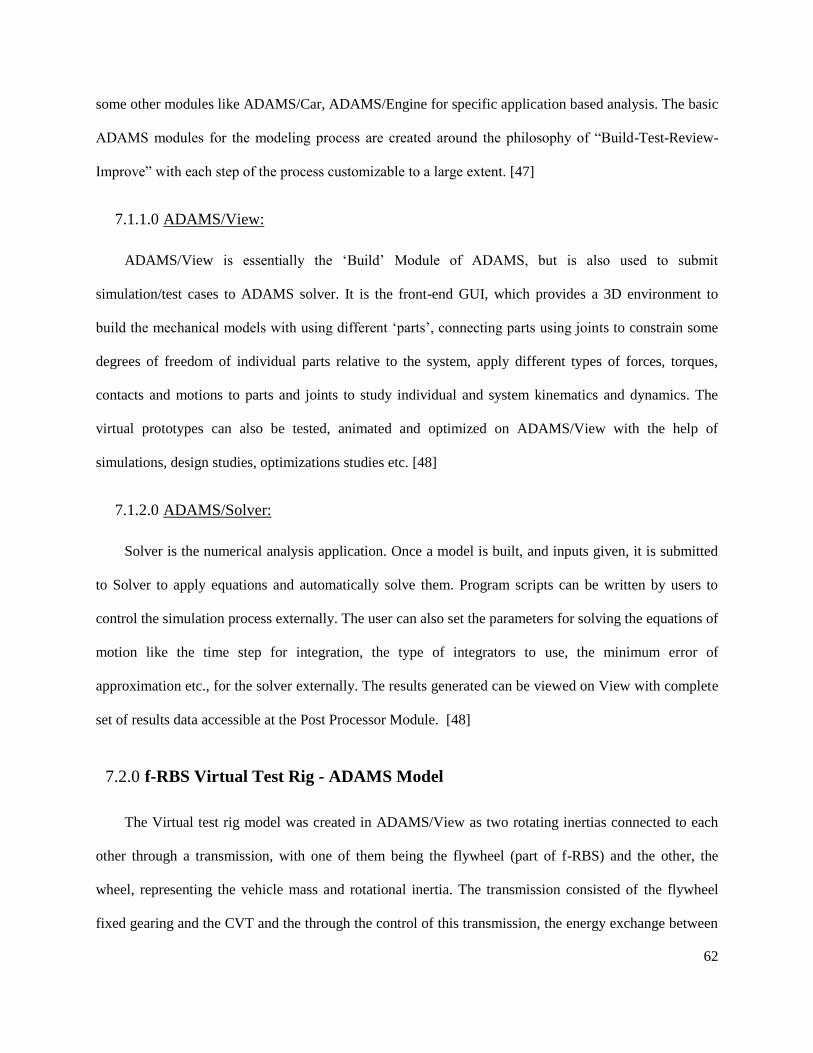
62
some other modules like ADAMS/Car, ADAMS/Engine for specific application based analysis. The basic
ADAMS modules for the modeling process are created around the philosophy of “Build-Test-Review-
Improve” with each step of the process customizable to a large extent. [47]
7.1.1.0 ADAMS/View:
ADAMS/View is essentially the ‘Build’ Module of ADAMS, but is also used to submit
simulation/test cases to ADAMS solver. It is the front-end GUI, which provides a 3D environment to
build the mechanical models with using different ‘parts’, connecting parts using joints to constrain some
degrees of freedom of individual parts relative to the system, apply different types of forces, torques,
contacts and motions to parts and joints to study individual and system kinematics and dynamics. The
virtual prototypes can also be tested, animated and optimized on ADAMS/View with the help of
simulations, design studies, optimizations studies etc. [48]
7.1.2.0 ADAMS/Solver:
Solver is the numerical analysis application. Once a model is built, and inputs given, it is submitted
to Solver to apply equations and automatically solve them. Program scripts can be written by users to
control the simulation process externally. The user can also set the parameters for solving the equations of
motion like the time step for integration, the type of integrators to use, the minimum error of
approximation etc., for the solver externally. The results generated can be viewed on View with complete
set of results data accessible at the Post Processor Module. [48]
The Virtual test rig model was created in ADAMS/View as two rotating inertias connected to each
other through a transmission, with one of them being the flywheel (part of f-RBS) and the other, the
wheel, representing the vehicle mass and rotational inertia. The transmission consisted of the flywheel
fixed gearing and the CVT and the through the control of this transmission, the energy exchange between
f-RBS Virtual Test Rig - ADAMS Model 7.2.0
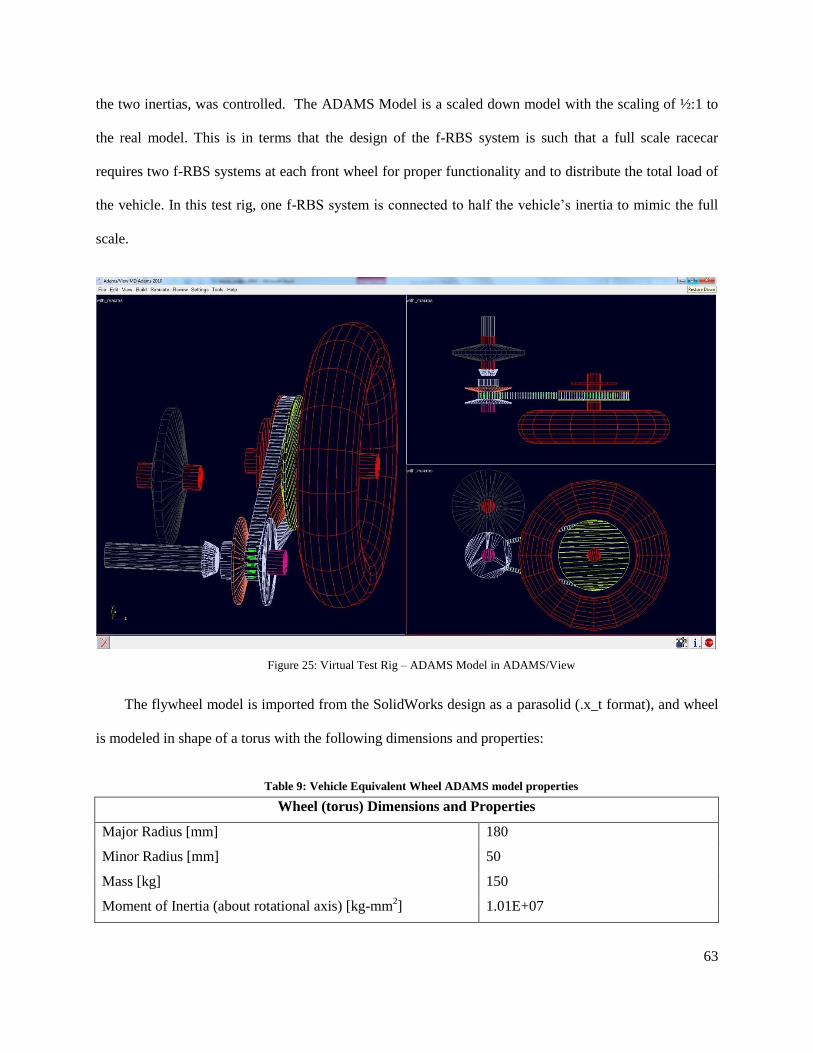
63
the two inertias, was controlled. The ADAMS Model is a scaled down model with the scaling of ½:1 to
the real model. This is in terms that the design of the f-RBS system is such that a full scale racecar
requires two f-RBS systems at each front wheel for proper functionality and to distribute the total load of
the vehicle. In this test rig, one f-RBS system is connected to half the vehicle’s inertia to mimic the full
scale.
Figure 25: Virtual Test Rig – ADAMS Model in ADAMS/View
The flywheel model is imported from the SolidWorks design as a parasolid (.x_t format), and wheel
is modeled in shape of a torus with the following dimensions and properties:
Table 9: Vehicle Equivalent Wheel ADAMS model properties
Wheel (torus) Dimensions and Properties
Major Radius [mm] 180
Minor Radius [mm] 50
Mass [kg] 150
Moment of Inertia (about rotational axis) [kg-mm2] 1.01E+07
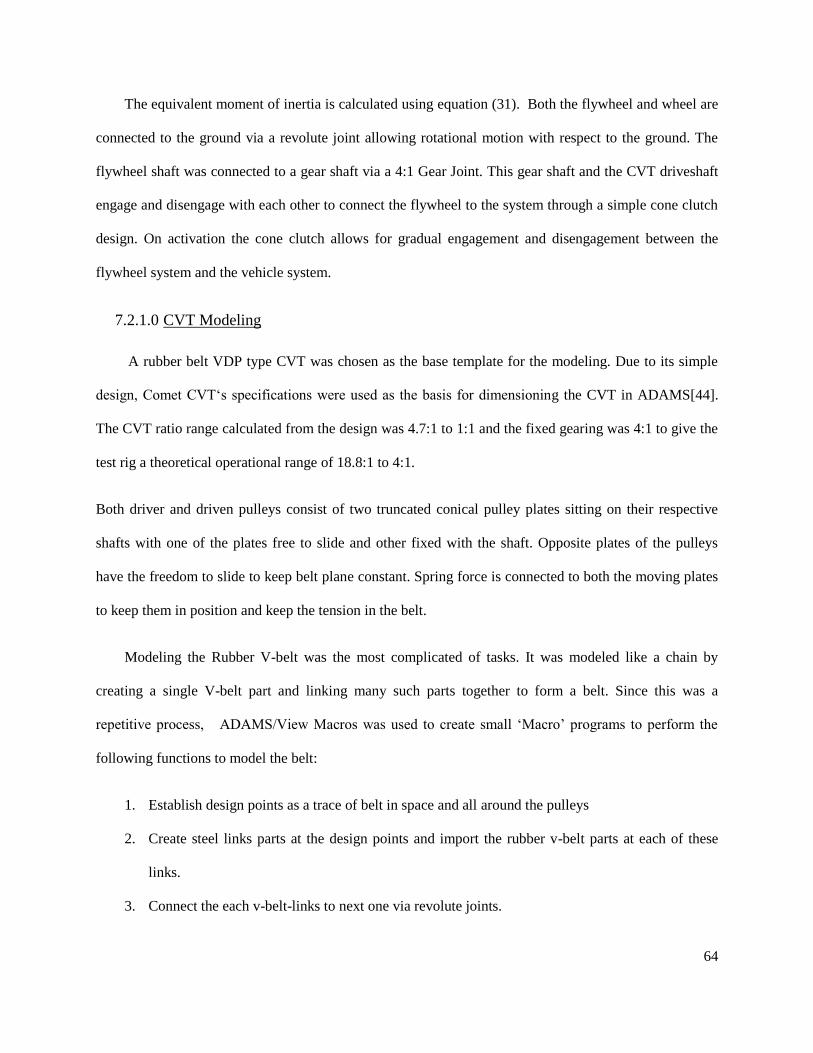
64
The equivalent moment of inertia is calculated using equation (31). Both the flywheel and wheel are
connected to the ground via a revolute joint allowing rotational motion with respect to the ground. The
flywheel shaft was connected to a gear shaft via a 4:1 Gear Joint. This gear shaft and the CVT driveshaft
engage and disengage with each other to connect the flywheel to the system through a simple cone clutch
design. On activation the cone clutch allows for gradual engagement and disengagement between the
flywheel system and the vehicle system.
7.2.1.0 CVT Modeling
A rubber belt VDP type CVT was chosen as the base template for the modeling. Due to its simple
design, Comet CVT‘s specifications were used as the basis for dimensioning the CVT in ADAMS[44].
The CVT ratio range calculated from the design was 4.7:1 to 1:1 and the fixed gearing was 4:1 to give the
test rig a theoretical operational range of 18.8:1 to 4:1.
Both driver and driven pulleys consist of two truncated conical pulley plates sitting on their respective
shafts with one of the plates free to slide and other fixed with the shaft. Opposite plates of the pulleys
have the freedom to slide to keep belt plane constant. Spring force is connected to both the moving plates
to keep them in position and keep the tension in the belt.
Modeling the Rubber V-belt was the most complicated of tasks. It was modeled like a chain by
creating a single V-belt part and linking many such parts together to form a belt. Since this was a
repetitive process, ADAMS/View Macros was used to create small ‘Macro’ programs to perform the
following functions to model the belt:
1. Establish design points as a trace of belt in space and all around the pulleys
2. Create steel links parts at the design points and import the rubber v-belt parts at each of these
links.
3. Connect the each v-belt-links to next one via revolute joints.
65
4. Establish friction type contact forces between the belt parts and pulley plates and normal contact
between individual pulley plates. Each of the v-belt-link part comes in contact with each of the
pulley plates, so that’s makes it 4 contacts forces for each part.
Figure 26: Drawing of V-Belt Part
The gear ratio of the system is controlled by assigning translational motion to the movable driver and
driven pulley plate. The translational motion can be defined with help of functions or numerical values to
define the displacement, velocity or acceleration of the pulley plate as a function of time. For initializing
or giving a part an initial velocity or acceleration inn ADAMS/View, the motion of each parts can either
defined by setting a motion at any of the joints or by giving initial velocity or displacement conditions to
individual parts.
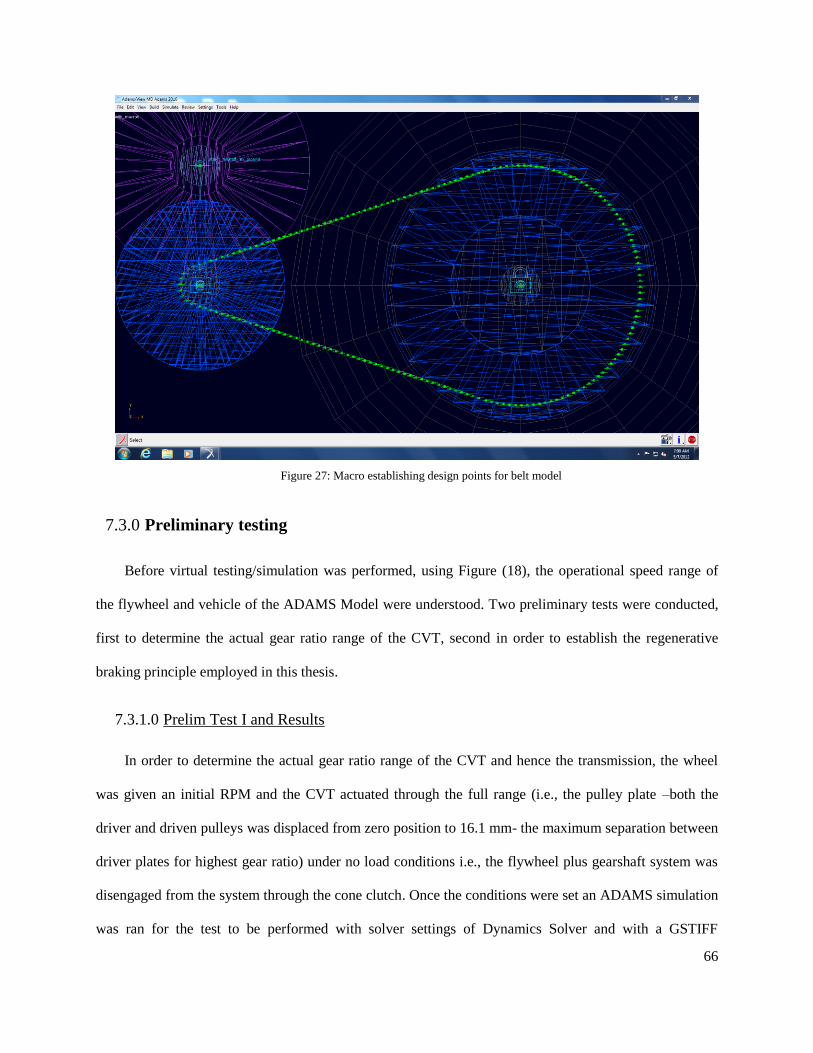
66
Figure 27: Macro establishing design points for belt model
Before virtual testing/simulation was performed, using Figure (18), the operational speed range of
the flywheel and vehicle of the ADAMS Model were understood. Two preliminary tests were conducted,
first to determine the actual gear ratio range of the CVT, second in order to establish the regenerative
braking principle employed in this thesis.
7.3.1.0 Prelim Test I and Results
In order to determine the actual gear ratio range of the CVT and hence the transmission, the wheel
was given an initial RPM and the CVT actuated through the full range (i.e., the pulley plate –both the
driver and driven pulleys was displaced from zero position to 16.1 mm- the maximum separation between
driver plates for highest gear ratio) under no load conditions i.e., the flywheel plus gearshaft system was
disengaged from the system through the cone clutch. Once the conditions were set an ADAMS simulation
was ran for the test to be performed with solver settings of Dynamics Solver and with a GSTIFF
Preliminary testing 7.3.0
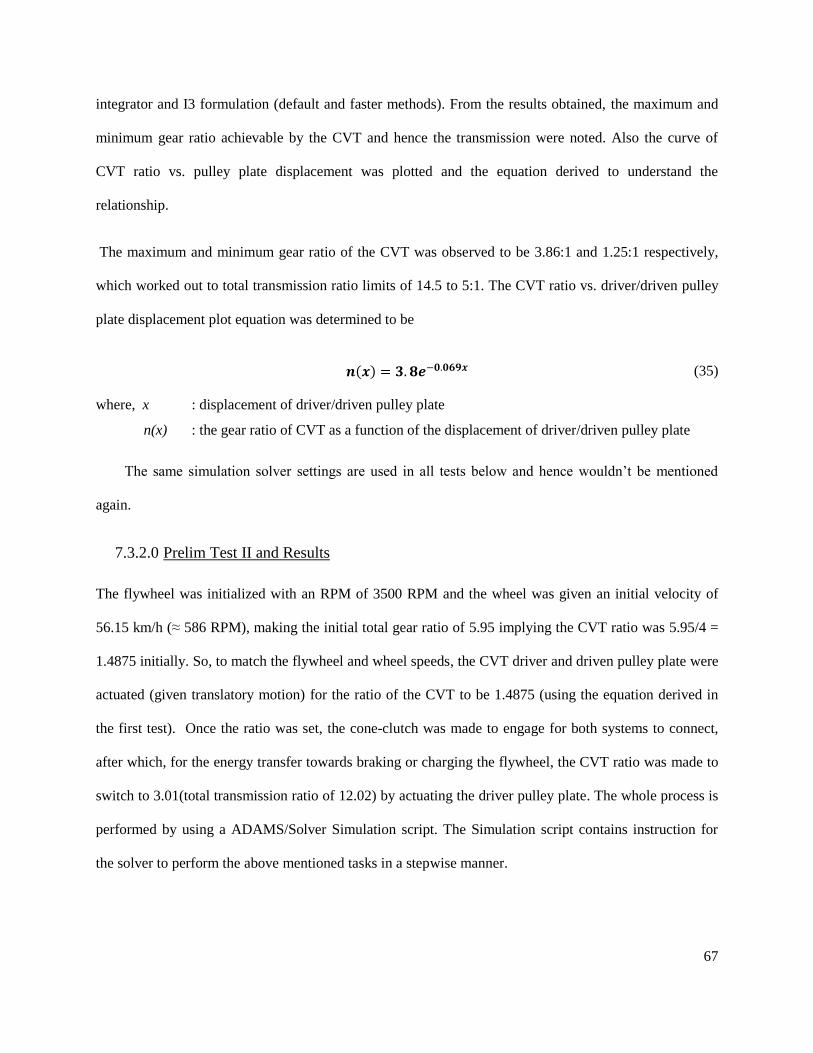
67
integrator and I3 formulation (default and faster methods). From the results obtained, the maximum and
minimum gear ratio achievable by the CVT and hence the transmission were noted. Also the curve of
CVT ratio vs. pulley plate displacement was plotted and the equation derived to understand the
relationship.
The maximum and minimum gear ratio of the CVT was observed to be 3.86:1 and 1.25:1 respectively,
which worked out to total transmission ratio limits of 14.5 to 5:1. The CVT ratio vs. driver/driven pulley
plate displacement plot equation was determined to be
( ) (35)
where, x : displacement of driver/driven pulley plate
n(x) : the gear ratio of CVT as a function of the displacement of driver/driven pulley plate
The same simulation solver settings are used in all tests below and hence wouldn’t be mentioned
again.
7.3.2.0 Prelim Test II and Results
The flywheel was initialized with an RPM of 3500 RPM and the wheel was given an initial velocity of
56.15 km/h (≈ 586 RPM), making the initial total gear ratio of 5.95 implying the CVT ratio was 5.95/4 =
1.4875 initially. So, to match the flywheel and wheel speeds, the CVT driver and driven pulley plate were
actuated (given translatory motion) for the ratio of the CVT to be 1.4875 (using the equation derived in
the first test). Once the ratio was set, the cone-clutch was made to engage for both systems to connect,
after which, for the energy transfer towards braking or charging the flywheel, the CVT ratio was made to
switch to 3.01(total transmission ratio of 12.02) by actuating the driver pulley plate. The whole process is
performed by using a ADAMS/Solver Simulation script. The Simulation script contains instruction for
the solver to perform the above mentioned tasks in a stepwise manner.
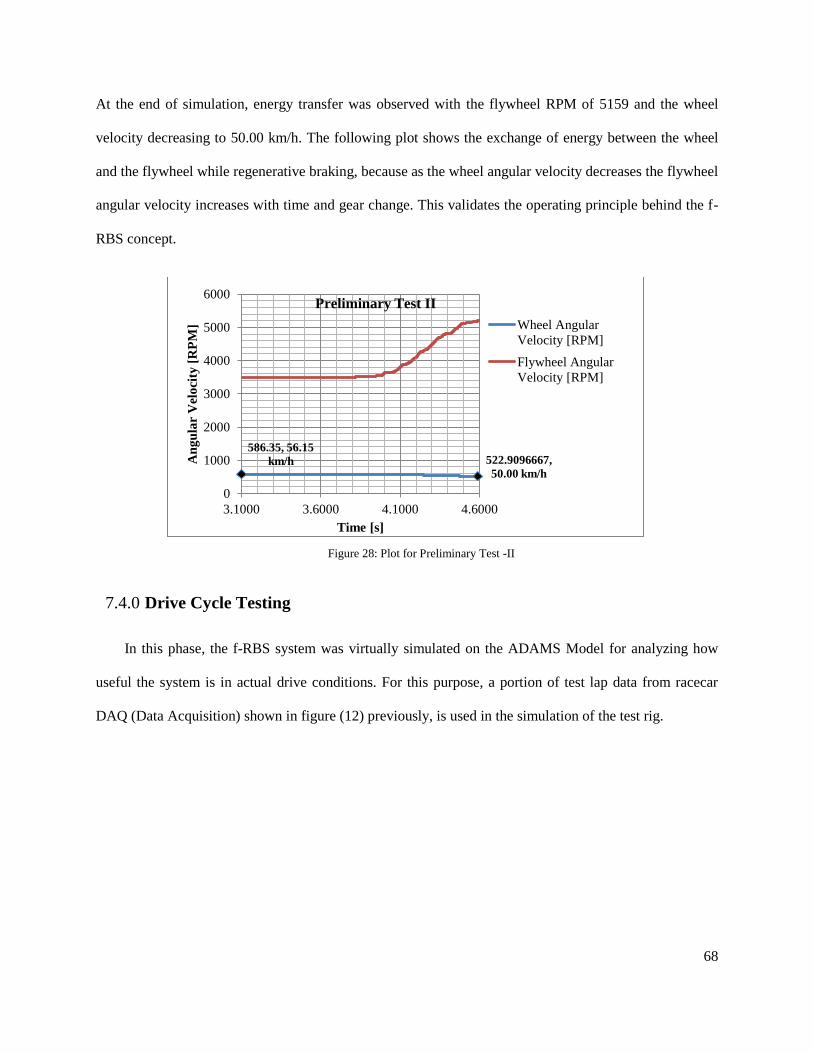
68
At the end of simulation, energy transfer was observed with the flywheel RPM of 5159 and the wheel
velocity decreasing to 50.00 km/h. The following plot shows the exchange of energy between the wheel
and the flywheel while regenerative braking, because as the wheel angular velocity decreases the flywheel
angular velocity increases with time and gear change. This validates the operating principle behind the f-
RBS concept.
Figure 28: Plot for Preliminary Test -II
In this phase, the f-RBS system was virtually simulated on the ADAMS Model for analyzing how
useful the system is in actual drive conditions. For this purpose, a portion of test lap data from racecar
DAQ (Data Acquisition) shown in figure (12) previously, is used in the simulation of the test rig.
586.35, 56.15
km/h 522.9096667,
50.00 km/h
0
1000
2000
3000
4000
5000
6000
3.1000 3.6000 4.1000 4.6000
An
gu
lar
Vel
oci
ty [
RP
M]
Time [s]
Preliminary Test II
Wheel Angular
Velocity [RPM]
Flywheel Angular
Velocity [RPM]
Drive Cycle Testing 7.4.0
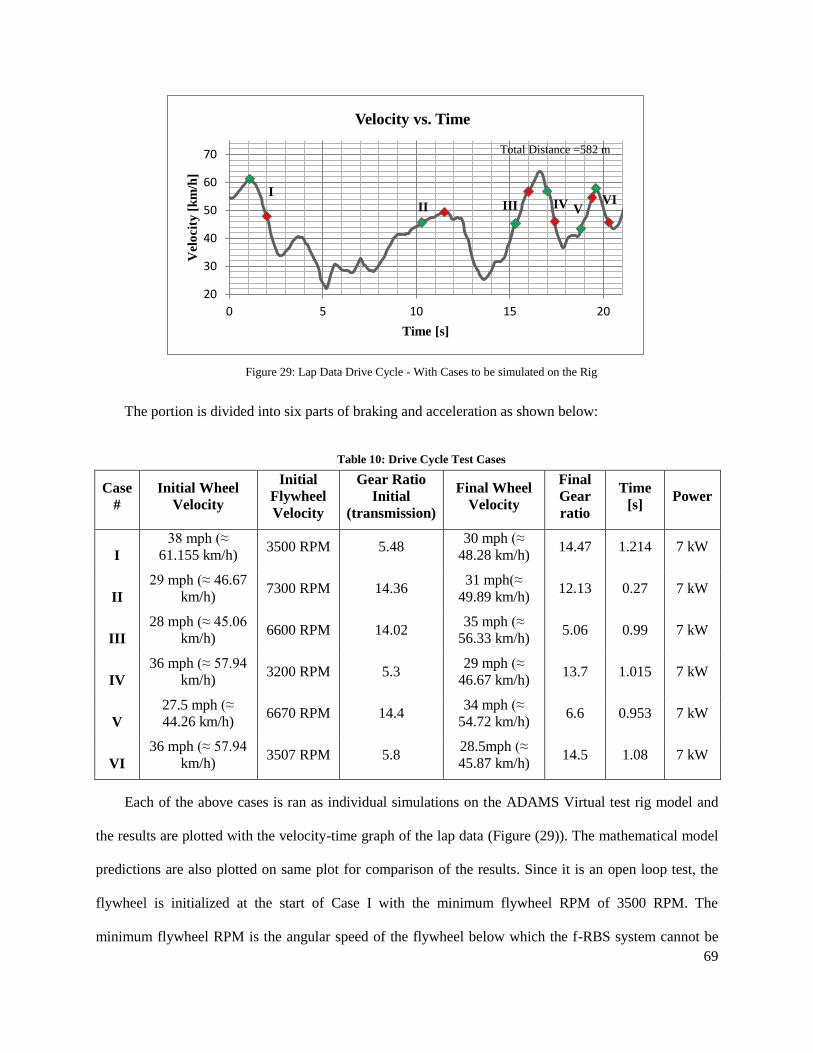
69
Figure 29: Lap Data Drive Cycle - With Cases to be simulated on the Rig
The portion is divided into six parts of braking and acceleration as shown below:
Table 10: Drive Cycle Test Cases
Case
#
Initial Wheel
Velocity
Initial
Flywheel
Velocity
Gear Ratio
Initial
(transmission)
Final Wheel
Velocity
Final
Gear
ratio
Time
[s] Power
I
38 mph (≈
61.155 km/h) 3500 RPM 5.48
30 mph (≈
48.28 km/h) 14.47 1.214 7 kW
II
29 mph (≈ 46.67
km/h) 7300 RPM 14.36
31 mph(≈
49.89 km/h) 12.13 0.27 7 kW
III
28 mph (≈ 45.06
km/h) 6600 RPM 14.02
35 mph (≈
56.33 km/h) 5.06 0.99 7 kW
IV
36 mph (≈ 57.94
km/h) 3200 RPM 5.3
29 mph (≈
46.67 km/h) 13.7 1.015 7 kW
V
27.5 mph (≈
44.26 km/h) 6670 RPM 14.4
34 mph (≈
54.72 km/h) 6.6 0.953 7 kW
VI
36 mph (≈ 57.94
km/h) 3507 RPM 5.8
28.5mph (≈
45.87 km/h) 14.5 1.08 7 kW
Each of the above cases is ran as individual simulations on the ADAMS Virtual test rig model and
the results are plotted with the velocity-time graph of the lap data (Figure (29)). The mathematical model
predictions are also plotted on same plot for comparison of the results. Since it is an open loop test, the
flywheel is initialized at the start of Case I with the minimum flywheel RPM of 3500 RPM. The
minimum flywheel RPM is the angular speed of the flywheel below which the f-RBS system cannot be
20
30
40
50
60
70
0 5 10 15 20
Vel
oci
ty [
km
/h]
Time [s]
Velocity vs. Time
Total Distance =582 m
I
II III IV V VI
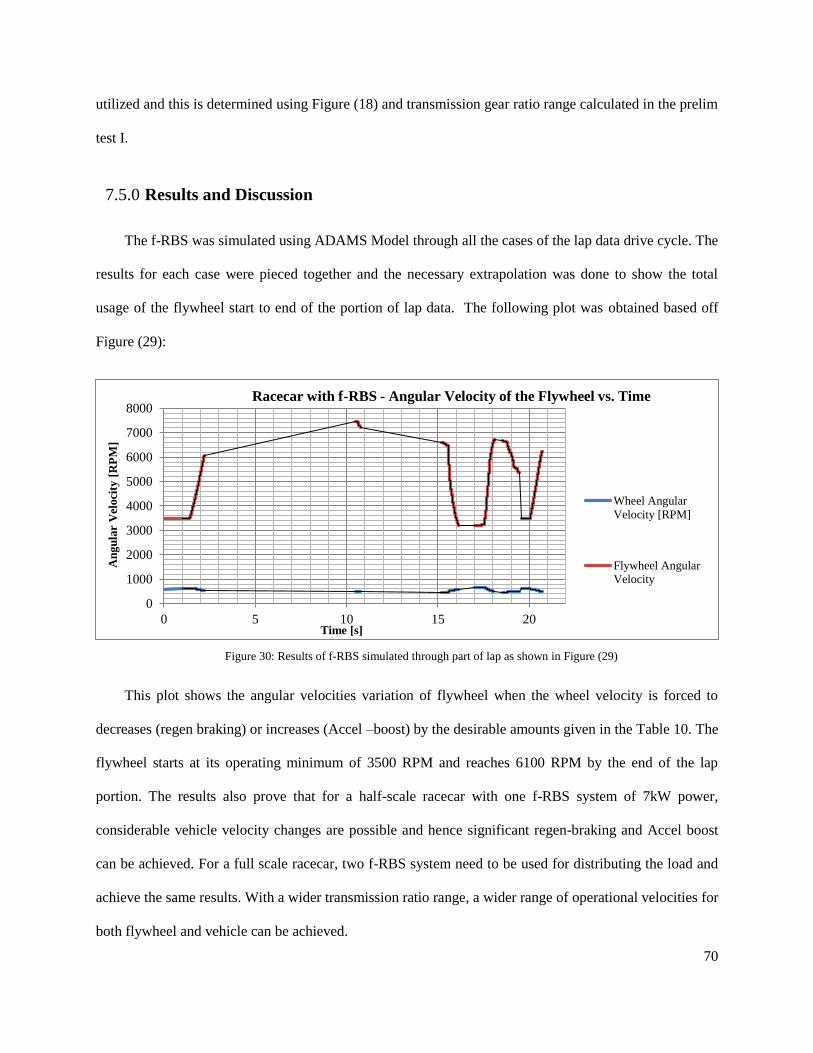
70
utilized and this is determined using Figure (18) and transmission gear ratio range calculated in the prelim
test I.
The f-RBS was simulated using ADAMS Model through all the cases of the lap data drive cycle. The
results for each case were pieced together and the necessary extrapolation was done to show the total
usage of the flywheel start to end of the portion of lap data. The following plot was obtained based off
Figure (29):
Figure 30: Results of f-RBS simulated through part of lap as shown in Figure (29)
This plot shows the angular velocities variation of flywheel when the wheel velocity is forced to
decreases (regen braking) or increases (Accel –boost) by the desirable amounts given in the Table 10. The
flywheel starts at its operating minimum of 3500 RPM and reaches 6100 RPM by the end of the lap
portion. The results also prove that for a half-scale racecar with one f-RBS system of 7kW power,
considerable vehicle velocity changes are possible and hence significant regen-braking and Accel boost
can be achieved. For a full scale racecar, two f-RBS system need to be used for distributing the load and
achieve the same results. With a wider transmission ratio range, a wider range of operational velocities for
both flywheel and vehicle can be achieved.
0
1000
2000
3000
4000
5000
6000
7000
8000
0 5 10 15 20
An
gu
lar
Vel
oci
ty [
RP
M]
Time [s]
Racecar with f-RBS - Angular Velocity of the Flywheel vs. Time
Wheel Angular
Velocity [RPM]
Flywheel Angular
Velocity
Results and Discussion 7.5.0
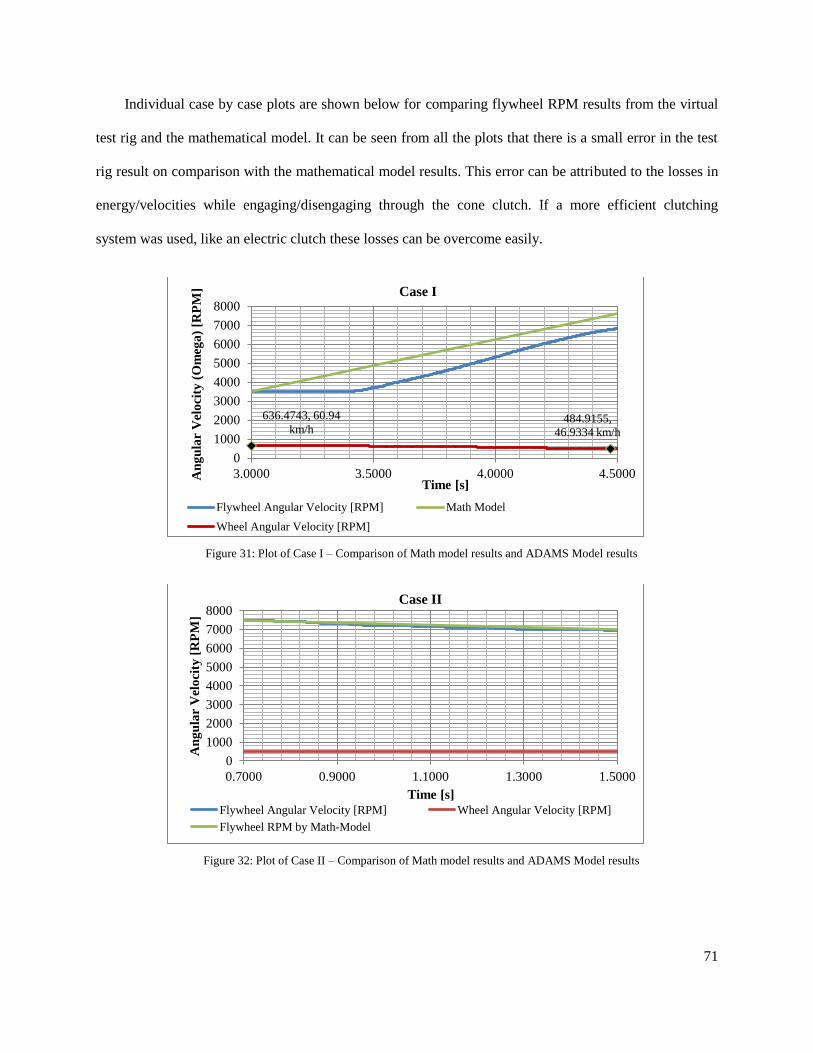
71
Individual case by case plots are shown below for comparing flywheel RPM results from the virtual
test rig and the mathematical model. It can be seen from all the plots that there is a small error in the test
rig result on comparison with the mathematical model results. This error can be attributed to the losses in
energy/velocities while engaging/disengaging through the cone clutch. If a more efficient clutching
system was used, like an electric clutch these losses can be overcome easily.
Figure 31: Plot of Case I – Comparison of Math model results and ADAMS Model results
Figure 32: Plot of Case II – Comparison of Math model results and ADAMS Model results
636.4743, 60.94
km/h 484.9155,
46.9334 km/h
0
1000
2000
3000
4000
5000
6000
7000
8000
3.0000 3.5000 4.0000 4.5000An
gu
lar
Vel
oci
ty (
Om
ega
) [R
PM
]
Time [s]
Case I
Flywheel Angular Velocity [RPM] Math Model
Wheel Angular Velocity [RPM]
0
1000
2000
3000
4000
5000
6000
7000
8000
0.7000 0.9000 1.1000 1.3000 1.5000
An
gu
lar
Vel
oci
ty [
RP
M]
Time [s]
Case II
Flywheel Angular Velocity [RPM] Wheel Angular Velocity [RPM]
Flywheel RPM by Math-Model
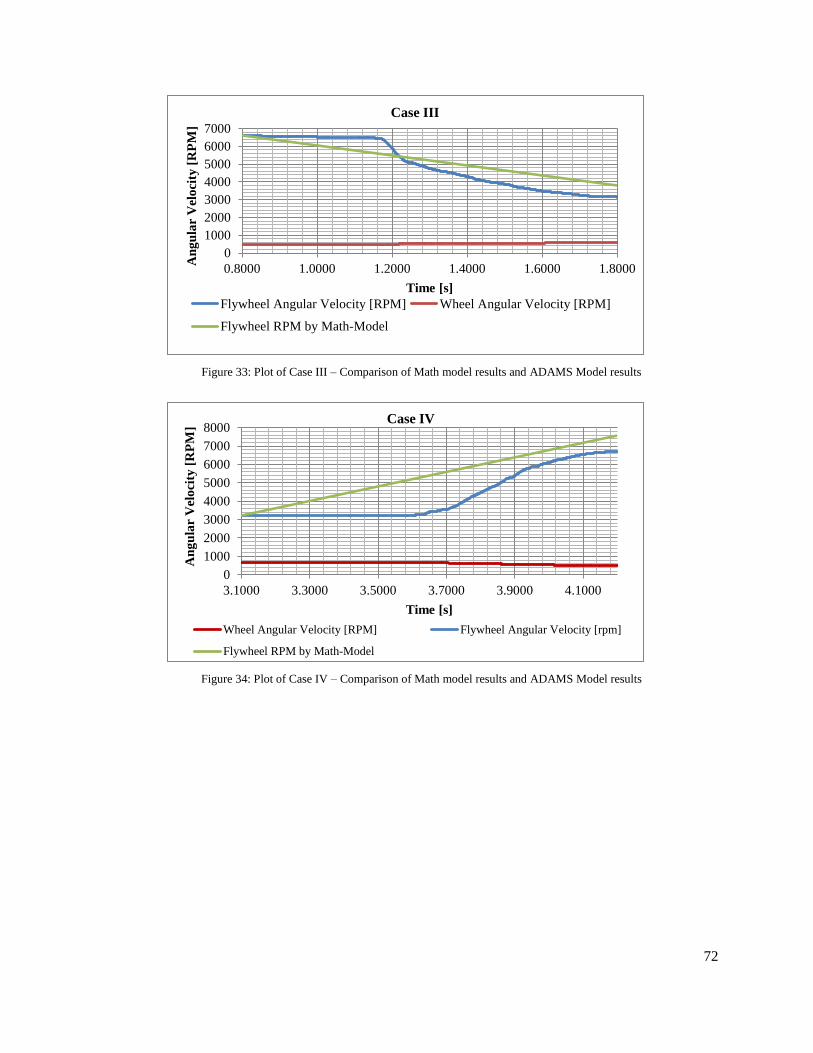
72
Figure 33: Plot of Case III – Comparison of Math model results and ADAMS Model results
Figure 34: Plot of Case IV – Comparison of Math model results and ADAMS Model results
0
1000
2000
3000
4000
5000
6000
7000
0.8000 1.0000 1.2000 1.4000 1.6000 1.8000
An
gu
lar
Vel
oci
ty [
RP
M]
Time [s]
Case III
Flywheel Angular Velocity [RPM] Wheel Angular Velocity [RPM]
Flywheel RPM by Math-Model
0
1000
2000
3000
4000
5000
6000
7000
8000
3.1000 3.3000 3.5000 3.7000 3.9000 4.1000
An
gu
lar
Vel
oci
ty [
RP
M]
Time [s]
Case IV
Wheel Angular Velocity [RPM] Flywheel Angular Velocity [rpm]
Flywheel RPM by Math-Model
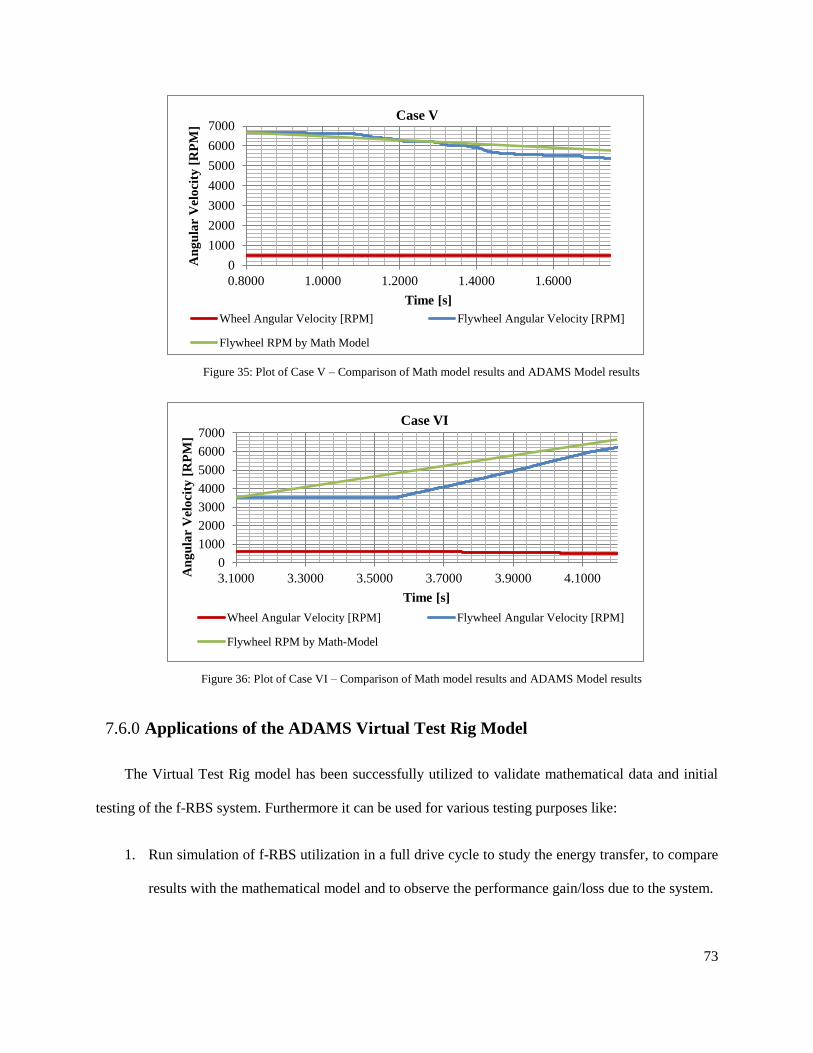
73
Figure 35: Plot of Case V – Comparison of Math model results and ADAMS Model results
Figure 36: Plot of Case VI – Comparison of Math model results and ADAMS Model results
The Virtual Test Rig model has been successfully utilized to validate mathematical data and initial
testing of the f-RBS system. Furthermore it can be used for various testing purposes like:
1. Run simulation of f-RBS utilization in a full drive cycle to study the energy transfer, to compare
results with the mathematical model and to observe the performance gain/loss due to the system.
0
1000
2000
3000
4000
5000
6000
7000
0.8000 1.0000 1.2000 1.4000 1.6000
An
gu
lar
Vel
oci
ty [
RP
M]
Time [s]
Case V
Wheel Angular Velocity [RPM] Flywheel Angular Velocity [RPM]
Flywheel RPM by Math Model
0
1000
2000
3000
4000
5000
6000
7000
3.1000 3.3000 3.5000 3.7000 3.9000 4.1000An
gu
lar
Vel
oci
ty [
RP
M]
Time [s]
Case VI
Wheel Angular Velocity [RPM] Flywheel Angular Velocity [RPM]
Flywheel RPM by Math-Model
Applications of the ADAMS Virtual Test Rig Model 7.6.0
74
2. With the addition of road-tire contacts using ADAMS/Car, road losses can also be embedded
into the model as force functions.
3. Calculate torque and power characteristics of the system
4. Understand the basic controllability of the system, and embed control systems into to the model
and further understand that function.
5. Calculation of actuation force required for the pulley plate and actuation control functions too.
6. Fuel Efficiency calculation by calculation how much energy needs are being satisfied during a
drive cycle /lap.
7. Testing using different belt materials and different CVTs.
75
The design principles for a f-RBS concept for a Formula SAE type racecar have been presented in
this thesis. In addition, modeling of a Virtual Test rig for the f-RBS testing using MSC ADAMS and
initial testing results of the f-RBS on the Virtual test rig have also been presented.
For a RBS solution for the racecar, a comprehensive literature review was performed and presented
on RBS technologies and mechanical RBS technologies. As a result of the research, a flywheel based
mechanical regenerative braking system (f-RBS) was conceptualized for a Formula SAE type racecar
application. Utilizing the racecar data, the design principles for the f-RBS and its components namely –
transmission and flywheel were established. Operation and integration principles of such a system with
the racecar were realized and extended to the current application.
A mathematical model was derived to explain the operating principle of regenerative braking and
acceleration using the f-RBS system. A virtual test rig model was also created using MSC ADAMS to
validate the mathematical model results and perform initial testing as an alternative to experimental
testing. Virtual test rig ADAMS Model results successfully proved the validity of the test rig as a
preliminary, cost effective and flexible alternative to experimental testing. The potential of the test rig for
future testing was also realized. On the basis of the test rig results and mathematical model, the operating
principle of the f-RBS was validated. Also, the results proved that the system can be a useful tool for
improving the performance of the racecar and recycling wasteful braking energy.
The following areas need to be addressed in future work to complete the design and testing of the f-
RBS concept before implementation:
8.0 CLOSURE
Summary and Conclusion 8.1.0
Future Scope 8.2.0
76
1. Incorporation of the actuator mechanism in the CVTs for external control of the transmission if
necessary.
2. Vacuum and Containment Design for the flywheel for reduction of windage losses.
3. Bearing and clutch selection to reduce friction losses.
4. Incorporation of Carbon Fiber or other composite material for high speed flywheel design
instead of metal low speed with the appropriate transmission-CVT for improving safety from
shattering of flywheels.
5. Rotational Dynamics analysis from the vehicle standpoint as to how inclusion of two
rotating/counter-rotating flywheels from two f-RBS systems can affect the dynamics of the
moving racecar.
6. A more comprehensive failure and fatigue analysis for safety of the system
7. Control system design for the f-RBS operation in conjunction with the vehicle.
8. Cooling system design if required.
9. Physical/Experimental testing on a Rig and vehicle.
On the front of the virtual test rig, it can be developed furthermore to incorporate all the possible
applications mentioned above in 7.6.0. The current model needs to be run manually and individually for
every acceleration and deceleration event. Instead, it can be modified to run a complete cycle with a few
simple inputs with the help Solver scripts, sensors, Macros and GUI developing tools. Also road, bearing
and clutch losses need to be incorporated for a complete dynamic analysis of the f-RBS system.
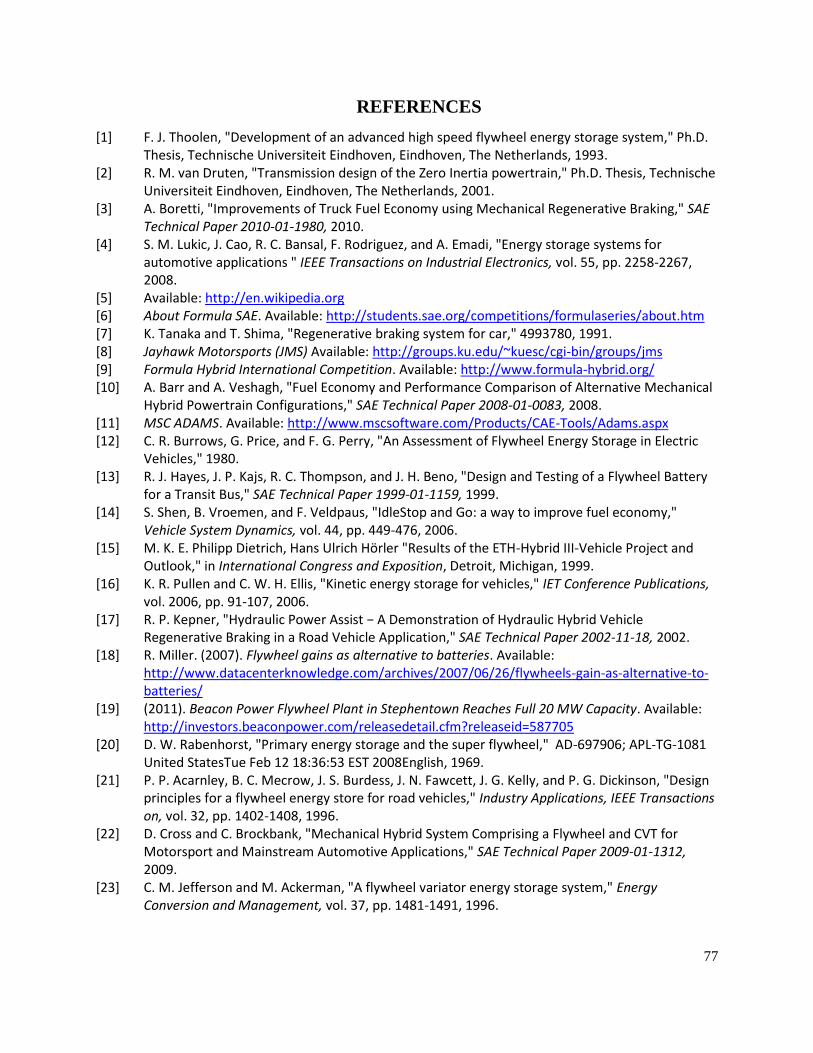
77
REFERENCES
[1] F. J. Thoolen, "Development of an advanced high speed flywheel energy storage system," Ph.D. Thesis, Technische Universiteit Eindhoven, Eindhoven, The Netherlands, 1993.
[2] R. M. van Druten, "Transmission design of the Zero Inertia powertrain," Ph.D. Thesis, Technische Universiteit Eindhoven, Eindhoven, The Netherlands, 2001.
[3] A. Boretti, "Improvements of Truck Fuel Economy using Mechanical Regenerative Braking," SAE Technical Paper 2010-01-1980, 2010.
[4] S. M. Lukic, J. Cao, R. C. Bansal, F. Rodriguez, and A. Emadi, "Energy storage systems for automotive applications " IEEE Transactions on Industrial Electronics, vol. 55, pp. 2258-2267, 2008.
[5] Available: http://en.wikipedia.org [6] About Formula SAE. Available: http://students.sae.org/competitions/formulaseries/about.htm [7] K. Tanaka and T. Shima, "Regenerative braking system for car," 4993780, 1991. [8] Jayhawk Motorsports (JMS) Available: http://groups.ku.edu/~kuesc/cgi-bin/groups/jms [9] Formula Hybrid International Competition. Available: http://www.formula-hybrid.org/ [10] A. Barr and A. Veshagh, "Fuel Economy and Performance Comparison of Alternative Mechanical
Hybrid Powertrain Configurations," SAE Technical Paper 2008-01-0083, 2008. [11] MSC ADAMS. Available: http://www.mscsoftware.com/Products/CAE-Tools/Adams.aspx [12] C. R. Burrows, G. Price, and F. G. Perry, "An Assessment of Flywheel Energy Storage in Electric
Vehicles," 1980. [13] R. J. Hayes, J. P. Kajs, R. C. Thompson, and J. H. Beno, "Design and Testing of a Flywheel Battery
for a Transit Bus," SAE Technical Paper 1999-01-1159, 1999. [14] S. Shen, B. Vroemen, and F. Veldpaus, "IdleStop and Go: a way to improve fuel economy,"
Vehicle System Dynamics, vol. 44, pp. 449-476, 2006. [15] M. K. E. Philipp Dietrich, Hans Ulrich Hörler "Results of the ETH-Hybrid III-Vehicle Project and
Outlook," in International Congress and Exposition, Detroit, Michigan, 1999. [16] K. R. Pullen and C. W. H. Ellis, "Kinetic energy storage for vehicles," IET Conference Publications,
vol. 2006, pp. 91-107, 2006. [17] R. P. Kepner, "Hydraulic Power Assist − A Demonstration of Hydraulic Hybrid Vehicle
Regenerative Braking in a Road Vehicle Application," SAE Technical Paper 2002-11-18, 2002. [18] R. Miller. (2007). Flywheel gains as alternative to batteries. Available:
http://www.datacenterknowledge.com/archives/2007/06/26/flywheels-gain-as-alternative-to-batteries/
[19] (2011). Beacon Power Flywheel Plant in Stephentown Reaches Full 20 MW Capacity. Available: http://investors.beaconpower.com/releasedetail.cfm?releaseid=587705
[20] D. W. Rabenhorst, "Primary energy storage and the super flywheel," AD-697906; APL-TG-1081 United StatesTue Feb 12 18:36:53 EST 2008English, 1969.
[21] P. P. Acarnley, B. C. Mecrow, J. S. Burdess, J. N. Fawcett, J. G. Kelly, and P. G. Dickinson, "Design principles for a flywheel energy store for road vehicles," Industry Applications, IEEE Transactions on, vol. 32, pp. 1402-1408, 1996.
[22] D. Cross and C. Brockbank, "Mechanical Hybrid System Comprising a Flywheel and CVT for Motorsport and Mainstream Automotive Applications," SAE Technical Paper 2009-01-1312, 2009.
[23] C. M. Jefferson and M. Ackerman, "A flywheel variator energy storage system," Energy Conversion and Management, vol. 37, pp. 1481-1491, 1996.
78
[24] The Flywheel Bus is Back. Available: http://www.commentary.net/view/atearchive/s76a4325.htm
[25] W. V. Loscutoff, "Flywheel-heat engine power for an energy-economic personal vehicle," BNWL-2006 United States10.2172/7185981Thu Mar 24 09:14:26 EDT 2011Dep. NTISPNNL; ERA-01-023601; EDB-76-064998English, 1976.
[26] P. W. DeVore, "Creativity in the Technologies:a Search for Insight —Inventors and Inventions," in Essential topics for technology educators, ed: Council on Technology Teacher Education, 2009, p. 92.
[27] R. R. Gilbert, L. Missiles, S. Company, and U. S. E. P. A. O. o. A. Programs, Flywheel drive systems study: Lockheed Missiles and Space Co., 1972.
[28] N. A. Schilke, A. O. DeHart, L. O. Hewko, C. C. Matthews, D. J. Pozniak, and S. M. Rohde, "The Design of an Engine-Flywheel Hybrid Drive System for a Passenger Car," Proceedings of the Institution of Mechanical Engineers, Part D: Journal of Automobile Engineering, vol. 200, pp. 231-248, October 1, 1986 1986.
[29] Kestrel Powertrains - Technical Background. Available: http://www.users.zetnet.co.uk/powertrains/kestrel/background.htm#top
[30] The Chrysler Patriot: Turbine-Powered Hybrid Racing Car — Future of Formula 1 Racing. Available: http://www.allpar.com/model/patriot.html
[31] S. Shen, A. Serrarens, M. Steinbuch, and F. Veldpaus, "Coordinated control of a mechanical hybrid driveline with a continuously variable transmission," JSAE Review, vol. 22, pp. 453-461, 2001.
[32] U. Diego Ayala, Martinez-Gonzalez, P., McGlashan, N., Pullen, K.R.,, "The mechanical hybrid vehicle: an investigation of a flywheel-based vehicular regenerative energy capture system," Proceedings of the Institution of Mechanical Engineers. Part D, Journal of automobile engineering, vol. 222, 2008.
[33] Torotrak - Energy Recovery Available: http://www.torotrak.com/content/165/applications.aspx [34] R.E.Rinehart, "A Flywheel Energy Storage Propulsion System for Intra Urban Buses," in 1980
Flywheel Technology Symposium, Scottsdale, Arizona, 1980. [35] J. G. Bitterly and S. E. Bitterly, "Flywheel Based Energy Storage System," U.S.A Patent 5614777,
1997. [36] Variator - Design and Specification. Available: http://www.torotrak.com/content/16/design-
and-specification.aspx [37] Nissan XTRONIC CVT. Available: http://www.nissan-
global.com/EN/TECHNOLOGY/OVERVIEW/cvt.html [38] How CVTs Work - Pulley Based CVT. Available: http://auto.howstuffworks.com/cvt2.htm [39] NuVinci® Overview. Available: http://fallbrooktechnologies.com/ [40] AiM Sports - Race Studio: Overview. Available: http://www.aimsports.com/products/race-
studio/index.html [41] T. D. Gillespie, Fundamental of Vehcile Dynamics: SAE International. [42] Speed Selector Available: http://www.speedselector.com/engineering/index.htm [43] "Lovejoy Variable Speed Drives," Lovejoy, Ed., ed. [44] Comet Clutches for 8-18 h.p. Available: http://www.gokartsupply.com/4044seri.htm [45] R. Pena-Alzola, R. Sebastian, J. Quesada, and A. Colmenar, "Review of flywheel based energy
storage systems," in Power Engineering, Energy and Electrical Drives (POWERENG), 2011 International Conference on, 2011, pp. 1-6.
[46] R. L. Norton, Machine design: An integrated approach: Prentice Hall (Upper Saddle River, N.J.) 1998.

79
[47] ADAMS - Multibody Dynamics Simulation. Available: http://www.mscsoftware.com/Products/CAE-Tools/Adams.aspx
[48] MD ADAMS 2010 - Help. MSC Sim Companion1. Available: simcompanion.mscsoftware.com
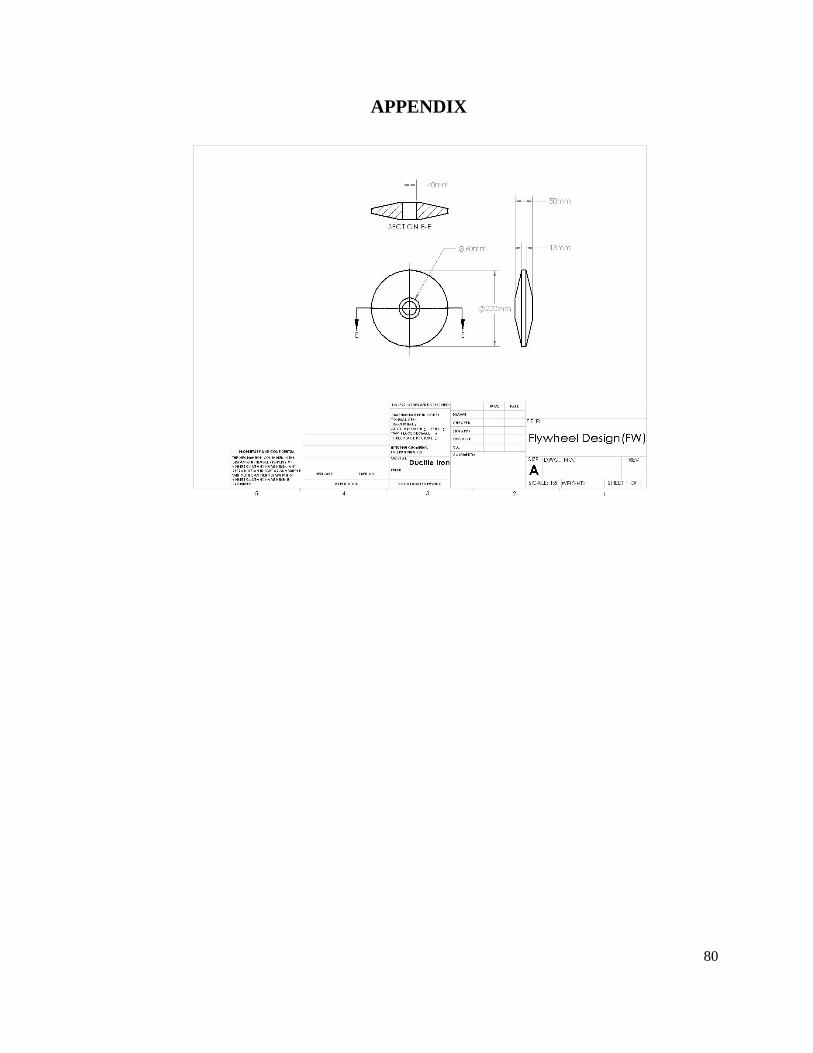
80
APPENDIX