designing today the plants of the...
TRANSCRIPT

2011 FINANCIAL REPORTFives - 27 / 29 rue de Provence - 75009 Paris - www.fi vesgroup.com
Designing today the plants of the futureDesigning today the plants of the futureDesigning today the plants of the futureDesigning today the plants of the future
FIVES COUVFI FR2012.indd 1 16/07/12 16:10

www.fivesgroup.com
FINANCIAL REPORT 3
Group activity 04
Corporate governance 22
Financial and legal information 26
Non-financial indicators 27
2011 Consolidated financial statements 33Statutory Auditors’ Report 77
Ordinary annual general meeting 79Draft resolutions (extract) 80
PROFILE
As an industrial engineering group, Fives designs and supplies process equipment, production lines and turnkey plants for the world’s largest industrial groups in the aluminium, steel, glass, automotive & logistics, cement, energy and sugar sectors.Located in nearly thirty countries and with more than 6,100 employees across six continents, the Group is known for its technological expertise and competence in executing large-scale international projects.

2011 FINANCIAL REPORT
4
ACTIVITY REPORT
1. GROUP OPERATIONS IN 2011
After the marked improvement seen in 2010, the global economic recovery continued in 2011. As was the case in the previous year, the world's emerging countries delivered the growth, driven by their substantial infrastructure needs and rising domestic demand. The developed countries, still at a recovery stage (below-capacity production, still-depressed real-estate markets and public finance shortfalls), however continued to make progress, albeit more modestly. Although the spectacular dynamic start to the year was later impacted by the summer financial crisis, the recovery in industrial capital expenditure projects – which was particularly strong in the first half of the year – resulted in a wider improvement of the Group’s business environment.
Against this generally favorable, but still volatile and uncertain background, Fives delivered its best-ever performance in 2011, demonstrating the strength of its growth model and the relevance of its strategic positioning. As a result, Group order intake rose to the all-time high level of €1,674 million, reflecting a 37% increase over 2010 (€1,224 million) and exceeding the previous record (€1,503 million set in 2007) by 11%.
Business levels were particularly sustained in the emerging countries (which accounted for 56% of the year’s order intake), where the commercial dynamic and local presence of Fives continued to support high order intake, especially in the Middle East, Brazil and China. Building on the quality, energy efficiency and environmental performance of its technologies, the Group also achieved notable commercial successes in the more demanding markets of the developed countries, where industrial companies selectively committed capital expenditure to upgrade projects that had been on hold for two years, especially in North America. All business lines contributed to this success. The Group delivered its best-ever performance in the automotive and logistics division, since leading car manufacturers committed massive capital expenditure in order both to create new production capacity in emerging countries and to upgrade their existing production facilities in the USA. Sustained levels of order intake were also seen in metals, where Fives benefited from the confirmation of major aluminium projects in the Middle East and from steel and glass production projects in many emerging countries at the
beginning of the year (especially China and Brazil), although this trend tailed off significantly after the end of the summer. Despite having begun its recovery more slowly and being impacted by the increasing difficulties suffered by the nuclear industry after the Fukushima disaster in the spring, the energy sector nevertheless remains well positioned for the medium term as a result of increasing energy demand from emerging countries, and the need for high levels of energy efficiency as gas and oil production approach their maximum levels. In the cement sector, the Group returned to a level of order intake close to that reported for 2008, after two difficult years in 2009 and 2010.
The Group also recorded a very good operational performance, reporting record EBITDA of €99.0 million (up 15% compared with 2010), whilst continuing to intensify research and development and to strengthen its commercial and operational structures in the major emerging countries.
Lastly, the commercial performance achieved in 2011 allowed Fives to end the year with an historically high order backlog of €1,552 million, reflecting a significant improvement over 2010 (+39%) and 2009 (+86%) and providing the Group with excellent forward visibility on activity levels in 2012.
1.1. Business overview
Total Group order intake for 2011 was €1,674 million, reflecting an increase of €450 million (+37%) over 2010. This increase includes a €23 million contribution from the Fives Bronx sub-group, which was consolidated for the full 12 months of 2011, compared with just 1 month of 2010. It also includes a negative exchange rate effect of -€18 million, mainly relating to the appreciation of the euro average exchange rate against the dollar from one financial year to the other (the average exchange rate in 2011 was €1 = $1.39, compared with €1 = $1.33 in 2010). At like-for-like consolidation scope and foreign exchange rates, order intake was therefore up by €445 million (+36%).
The total order backlog at December 31 was €1,552 million, reflecting an increase of €435 million (+39%) over 2010. This variation does not include any consolidation scope effect, since the Fives Bronx sub-group was
Report of the executive boardto the ordinary general meeting on June 27th, 2012

www.fivesgroup.com
5
already consolidated at the end of the 2010 financial year. It does however include a positive exchange rate effect of +€19 million, mainly relating to the depreciation of the euro year-end exchange rate against the dollar (the year-end rate at December 31, 2011 was €1 = $1.29 dollar, compared with €1 = $1.34 at December 31, 2010). At like-for-like consolidation scope and foreign exchange rates, order backlog was therefore up by €416 million (+37%).
Automotive & Logistics The recovery that began in summer 2010 in the automotive sector gathered pace in 2011. Benefiting from worldwide growth in volumes (despite difficulties in the aftermath of the Japanese tsunami, the floods in Thailand and the sovereign debt crisis in Western countries) and better financial health, manufacturers accelerated their capital expenditure programs. In emerging countries, where factors such as demographics, improving living standards and still-low rates of product take-up are all favorable underlying trends to market growth, many capacity-related projects were launched during the year, especially in China, and to a lesser extent in Russia, Brazil and India. In the developed countries, although the recovery in vehicle sales generated few major projects, programs to upgrade those sites that are remaining in production, which were put on hold when the global crisis broke in 2008, were re-launched in the USA and, on a more modest scale, in Europe.
At the same time, regulatory changes and the introduction of sustainable development initiatives have encouraged the emergence of projects to develop more eco-friendly technologies, with the emphasis on powertrain equipment, such as smaller engines and robotized transmissions. The reconfiguration of the automotive industry that emerged in 2010 from the global crisis has also resulted in a number of manufacturers rethinking their strategic positioning and developing new models tailored to the new market dynamics in emerging countries (low-cost vehicles), the USA (smaller, more energy-efficient vehicles) and Europe (up-market move).
In this favorable economic environment, the Group delivered its best-ever performance in terms of order intake, within which special mention should be made of the machining systems segment where Fives offers a very high-quality range of grinding solutions. Major sales successes were achieved throughout the world, particularly in the USA (with Chrysler and General Motors) and in China (with Volkswagen, Ford and local manufacturers), whilst the Group's French subsidiaries confirmed their key-supplier status with Renault and Peugeot by securing contracts in France, Morocco and Russia.
In logistics, the underlying trend towards growth in the volumes of goods transported in industrialized countries (as a result of e-commerce, increased travel and an ageing population) combined with high labor costs are the driving factors behind the need to extend and upgrade existing infrastructures. As a result, transportation and courier companies in North
ORDER INTAKE AND CLOSING ORDER BOOK
€ Millions 2009 2010 2011
Order intake 727.1 1,224.0 1,674.3
Order book at Dec. 31 834.3 1,116.6 1,551.8
SALES
€ Millions 2009 2010 2011
Sales 1,282.6 1,049.3 1,268.3

2011 FINANCIAL REPORT
6
ACTIVITY REPORT
America, Japan and Europe continued to automate their sorting centers, whilst other opportunities appeared in airports, retailing and outsourced industrial maintenance.
These trends enabled the Group to deliver an excellent sales performance, with highlights including the award of two major orders in North America as part of the ongoing upgrade program implemented by Canada Post, and a number of contracts with major transportation operators in Japan.
Metals The upward trend in the steel market that began in 2010 continued in 2011, with a new production record being set during the year (1,527 billion metric tons, reflecting an increase of 7%). Although North America and, to a lesser degree, Europe (especially the former Soviet states) contributed to this growth, production increase in these areas was mainly achieved through existing installation, still at a far lower level of use than before 2008. Capital expenditure on new capacity was therefore essentially concentrated on China (although less spectacularly than in the previous decade, as the high inventory levels suggest that the country is likely to face overcapacity), even if some other emerging countries confirmed the positive trend started in 2010 (especially India and Brazil).
After a promising first quarter, downward pressure on market prices - accentuated by tighter funding conditions and uncertainties about global growth following the summer financial crisis - depressed the general trading environment. As a result, a number of anticipated projects were put on hold, including some in emerging countries. In this risky economic context, industrial companies began to pay more attention to optimizing their production costs, boosting operational efficiency and becoming more energy efficient. They also confirmed the trend towards focusing their businesses on higher added-value steels, such as stainless steel (production of which hit the record level of 32 million tons in 2011) and other special steels (such as silicon steel) - a trend that included the developed countries’ facilities.
The situation was very similar in flat glass, where the market trended downwards after peaking at the midpoint of the year. Downward pressure on prices, combined with Chinese overcapacity, the slowdown in the construction industry and the funding issues faced by independent glassmakers (in Europe and China) all resulted in a rather lackluster trading environment. Nevertheless, opportunities were identified in the BRIC countries and in products requiring special expertise, such as glass for photovoltaic and flat screen applications.
Despite the marked slowdown in the market at the end of the first half, the Group delivered a good commercial performance in the steel and glass sectors in 2011, thanks to the dynamic approach taken in emerging countries and its technology positioning in high added-value segments, such as special steeland glass for photovoltaic and flat screen applications.
ORDER INTAKE BY END MARKET
€ Millions 2009 2010 2011
Automotive/Logistics 193.9 399.1 607.2
Metals (aluminium & steel) 216.5 468.8 550.7
Energy 229.1 286.4 272.7
Cement 87.6 69.7 243.7
Total 727.1 1,224.0 1,674.3
BY GEOGRAPHICAL AREA
€ Millions 2009 2010 2011
The Americas 135.6 232.7 546.8
The Middle East & Africa 117.8 243.3 350.2
Asia & Oceania 213.4 392.4 338.9
France 162.3 234.8 241.2
Europe (excluding France) 98.0 120.8 197.2
Total 727.1 1,224.0 1,674.3
Contribution from mature economies 51% 49% 44%
Contribution from emerging countries 49% 51% 56%

www.fivesgroup.com
7
The 2010 recovery in end-user markets for primary aluminium continued in 2011. Having recovered strongly during the previous year (+19%), world production continued to grow to a level in excess of 44 million tons (+8%), enabling existing capacity to return almost to pre-crisis production levels. Combined with higher energy prices, a weaker dollar and low levels of free stock, the return to sustained consumption drove up aluminium prices, which reached their highest point since August 2008. Supported by forecasts of continued growth over the medium term, this upward trend encouraged the world's leading producers to speed up the launch of their projects in this sector during the first half of the year (excluding China).
Whilst business levels remained high in the Middle East, driven by major manufacturers seeking energy at better prices and easier access to raw materials, and by national producers wishing to increase capacity, this market context also encouraged leading global producers to revive capital expenditure in their historic markets after two years of suspending or cancelling every new project.
By securing major orders on the main projects launched in the most active regions of the world (Saudi Arabia, Russia and Canada), the Group consolidated its already-excellent position in the aluminium industry during 2011.
EnergyAs a result of growing energy needs in emerging countries on the one hand, and increased demand for energy efficiency and smaller environmental footprints on the other hand, the trends underlying the energy sector remain positive.
Order intake grew significantly in the cryogenic equipment sector, driven by increasing demand for natural gas and hydrocarbon processing projects (especially in the Middle East and Europe), as well as a significant increase in the consumption of industrial gases in Asia in general, and China in particular. In the industrial combustion systems segment, the dynamic commercial trend that began in 2010 continued in 2011, benefiting simultaneously from the confirmed recovery of end-user markets (especially in the USA) and the need to upgrade existing capacity to address rising energy costs and comply with increasingly-demanding environmental standards. In sugar and bioenergies, the slowdown of manufacturing-focused capital expenditure in traditional markets (particularly in Brazil and India) was offset by the growth in Africa, Asia and Central America, thanks to projects designed either to increase extraction capacity or to reduce energy consumption.
In the high-performance industrial pipelines segment, where Group activity relies on the nuclear industry, the events of spring 2011 in Japan had a serious negative effect on the trading environment of the year. Although the Chinese nuclear program continued, many new construction projects elsewhere in the world (and particularly in industrialized
SALES BY END MARKET
€ Millions 2009 2010 2011
Automotive/Logistics 259.6 274.4 391.3
Metals (aluminium & steel) 475.3 365.3 474.9
Energy 263.5 284.5 290.2
Cement 284.2 125.1 111.9
Total 1,282.6 1,049.3 1,268.3
BY GEOGRAPHICAL AREA
€ Millions 2009 2010 2011
The Americas 303.7 218.8 295.4
The Middle East & Africa 366.9 193.2 246.3
Asia & Oceania 262.2 306.3 331.8
France 208.8 205.4 223.3
Europe (excluding France) 141.0 125.6 171.5
Total 1,282.6 1,049.3 1,268.3
Contribution from mature economies 39% 46% 50%
Contribution from emerging countries 61% 54% 50%

2011 FINANCIAL REPORT
8
ACTIVITY REPORT
countries) have been officially reviewed or have been the subject of delayed confirmation. Added to which, progress on those projects already under construction was significantly disrupted as a result of new restrictions imposed by nuclear safety inspection authorities. Lastly, although the maintenance business is expected to grow significantly in France as a result of increasing regulatory requirements, 2011 saw slippage in the majority of programs as operators waited for the final conclusions of post-Fukushima audit reports.
CementThe economic environment remained difficult in the cement sector. Conditions are still depressed in the majority of industrialized countries: European markets continue to show structural weaknesses (particularly in Spain and Greece) or are at best relatively lackluster (especially in the UK and Italy), whilst the US construction industry has yet to recover. Furthermore, some emerging markets that show promise for the medium term nevertheless stood still in 2011: although growth continued in India, it was at the slowest rate seen in the past 10 years, whilst North Africa came to a virtual halt as a result of political events throughout the year. The market for new cement production capacity (excluding China), driven mainly by growth in demand from South America and the former Soviet states, was only around 55 million tons in 2011: a level still a very long way from the peak seen between 2006 and 2008 (when 120-150 million tons of capacity were added each year), which is therefore no longer to be treated as a benchmark level. Apart from a few exceptions (notably China and Brazil), the average utilization of existing capacity remains below 75%. Although the world's leading producers have returned to volume growth, this compensates neither for inflation in energy, raw materials and transportation costs, nor for the negative currency exchange rate trends seen throughout the year. This background has encouraged leading cement producers to take a very prudent approach to capital expenditure commitments, especially since their funding capacity remains severely limited as a result of debt levels and the tensions seen in the banking market, which have worsened since the summer financial crisis.
Nevertheless, the fact that the major customers in this industry recognize the high performance delivered by its technologies helped the Group to perform well, with a level of order intake comparable to that seen in the glory days of 2006-2008, despite operating in a much less positive economic environment and facing a high level of competition. As a result, Fives was able to achieve significant commercial sucesses, both in turnkey projects (in Brazil and Saudi Arabia) and in process equipment (notably in the Middle East, Russia and China).
ORDER BOOK BY END MARKET
€ Millions 31.12.09 31.12.10 31.12.11
Automotive/Logistics 105.2 240.8 476.1
Metals (aluminium & steel) 381.0 571.6 656.5
Energy 228.4 234.8 217.4
Cement 119.7 69.4 201.8
Total 834.3 1,116.6 1,551.8
BY GEOGRAPHICAL AREA
€ Millions 31.12.09 31.12.10 31.12.11
The Americas 135.0 186.4 448.7
The Middle East & Africa 170.5 236.4 350.4
Asia & Oceania 277.3 402.7 417.6
France 140.0 169.5 187.5
Europe (excluding France) 111.5 121.6 147.6
Total 834.3 1,116.6 1,551.8
Contribution from mature economies 34% 39% 37%
Contribution from emerging countries 66% 61% 63%

www.fivesgroup.com
9
1.2. Highlights
Continued international developmentThe Group finalized the acquisition of CBL Combustion Systems Pvt. Ltd. (now renamed Fives Combustion Systems Pvt. Ltd.) on January 10, 2012. This Indian company specializes in the design and supply of combustion equipment, mainly used in the energy industry (burners for industrial boilers and heating plants) and the minerals sector (cement). Headquartered in Mumbai, Fives Combustion Systems also operates a production and assembly plant at Vadodara in the state of Gujarat. The company employs around 100 people and reports annual sales of nearly €5 million.
By providing Fives Pillard with a local operational entity in the combustion market, this acquisition marks a new stage in the Group’s development within the fast-growing Indian market.
An ambitious innovation policyInnovation is at the heart of Fives strategy. In 2011, the Group once again stepped up its Research and Development efforts with a record allocation of €21.2 million, a figure that represents an increase of 7% on 2010 and is nearly 80% higher than the figure for 2006. The developments undertaken in recent years led to a number of technical and commercial successes in 2011:
In aluminium, the potline gas heat recovery technology developed by Fives Solios in partnership with Hydro and the Norwegian University of Science and Technology (NTNU) was validated with implementation of an industrial pilot project. This technology enables aluminium producers to boost potline current ratings, while improving pollutant capture and reducing electricity consumption without additional capital expenditure. The Genios aluminium stirring and pumping technology was also validated during the year in an industrial environment, where it delivered customer satisfaction in terms of increased production capacity, reliability and consistency.
In high-performance steel, Fives Celes continued its collaboration with a major steelmaker in 2011, following commissioning in 2010 of the full-scale dynamic test facility that forms part of a program to develop rapid heating of steel strip by transverse flux induction. In glass, the very latest L.E.M.® (Low Energy Melter) technology developed by Fives Stein to achieve a 20% saving in energy consumption and greenhouse gas emissions was adopted by Brazilian glass producer CBVP for a float glass production line to be supplied by the Group. This real-life application opens the way to full-scale commercialization of the technology. Fives Stein also pressed ahead with final development of its Sunbath® photovoltaic cell glass production process as part of an agreement signed with a major glass production partner. Encouraging initial results were obtained on an industrial production line in September 2011.
In combustion systems for iron ore pelletization, Fives North American has used a prototype 10 MW unit installed at its Cleveland site to perfect a new technology that reduces nitrogen oxide emissions by more than 95% compared with existing technologies. Conducted in collaboration with a major iron ore producer, this development is now to be offered for sale.
Corporate Social Responsibility at the heart of FivesFives joined the UN Global Compact in April 2011. As its major customers already signatories to the agreement have, the Group has committed to respect, promote, and incorporate into its corporate governance the 10 Global Compact principles covering human rights, labor conditions, the environment and the fight against corruption,. Fives will also publish an annual progress report on the United Nations website.
The Group has also continued deployment of a consistent and efficient Health, Safety and Environmental management system. As an illustration of this commitment in action, the initiatives undertaken by Fives in 2011 on the Ma’aden site in Saudi Arabia were awarded the Project ES&H Contractor of the Year 2011 Award.
The Bribery Act, which came into effect in the United Kingdom in July 2011, introduced two innovative concepts to international legislation: criminal liability for failing to prevent bribery and extra-territorial jurisdiction to deal with bribery committed outside the UK. Considered as the strictest legislation of its type in the world, it has been the focus of specific initiatives deployed in the Group's six British companies, including an analysis of potential risks, the introduction of a prevention mechanism and a training seminar.
Outstanding commercial successes
In the Americas
BRAZILIn July, Fives Stein received an order from Cornélio Brennand Group subsidiary CBVP for a float glass plant with a production capacity of 800 tons per day to be constructed in the north-east of the country. The glass melting furnace will use the very latest L.E.M.® (Low Energy Melter) technology developed by Fives Stein, which reduces energy consumption by around 20% compared with current market standards.
In October, Holcim awarded Fives FCB an order for a new 4,500 tons per day clinker production line for its Barroso cement plant in Minas Gerais state. The new line, which will be equipped with Fives FCB water, energy and nitrogen oxide emissions reduction technologies (a Horomill® grinder, TSV™ separator and Zero-NOx precalciner), will enable Holcim to increase cement production at this site by 2.6 million tons per year under optimum environmental conditions. This order confirms the status of

2011 FINANCIAL REPORT
10
ACTIVITY REPORT
Fives FCB as a preferred supplier to Holcim, following the successful commissioning in 2010 of the Hermosillo cement plant in Mexico.
CANADAIn January, Rio Tinto Alcan placed an order with Fives Solios for the supply of turnkey pot gas treatment centers for its new Jonquière pilot plant: the first aluminium production plant in the world to use 600 kA electrolysis pots.
As part of an ongoing program to automate its principal sorting centers, Canada Post Corporation selected Fives Cinetic in October for its new site in Vancouver, which follows the two contracts awarded to the Group in 2010 for the centers in Winnipeg and Toronto. The proposed solution will include the latest-generation high-capacity cross belt sorters capable of handling more than 20,000 packages per hour. Canada Post Corporation also placed a new order with Fives Cinetic in December for the automation of its Calgary sorting center.
UNITED STATESIn February, Fives Cinetic received an order from Chrysler to supply its Kokomo plant with nine assembly and testing lines for key components used in the 8-speed ZF transmissions fitted to its rear-wheel drive vehicles. This new generation of gearboxes will be fitted to Chrysler vehicles from now on to deliver significant reductions in fuel consumption. The Chrysler decision also recognizes the Group's commitment to more eco-friendly technologies.
In the Middle East and Africa
SAUDI ARABIAMa’aden Alcoa Aluminium, the joint venture formed by the state-owned Saudi Arabian Mining Co. and Alcoa, awarded a number of turnkey contracts to Fives Solios as part of its project to construct an industrial complex, the first phase of which includes an aluminium foundry and rolling mill, to be followed by a second phase comprising a bauxite mine and an alumina refinery. Having received an order, in 2010, to supply two green anode production plants and a liquid pitch terminal, Fives Solios was awarded in 2011 orders for four gas treatment centers, fifteen melting and holding furnaces and a bath processing unit. This facility, which will produce 740,000 tons of aluminium per year using 360 electrolysis pots, will be the world's largest integrated aluminium production complex. This major success consolidates the leading position of Fives Solios in the three key sectors of the primary aluminium industry: carbon, electrolysis and foundry.
In February, Fives FCB began work at the Saudi White Cement Company to revamp the Muzahmiyah plant’s white cement production line and increase its capacity from 700 to 1,000 tons per day. The contract covers installing a new kaolin and gypsum crushing plant, increasing the capacity
of the raw mix and cement grinding plants, installing a new precalciner, upgrading the baking workshop equipment and constructing a 10,000 metric ton cement silo.
MOROCCOIn November, Renault appointed Fives Cinetic for the design, supply and commissioning of all the handling systems for the metalworking and assembly shops involved in Phase II of its Tanger Méditerranée plant project. Fives Cinetic was also awarded the contract to supply fluid filling and testing equipment for use at the end of the assembly line in the same plant. Designed to deliver multi-skilled production of 30 vehicles per hour, this new line will join installations previously supplied and commissioned by Fives Cinetic as part of Phase I. By 2013, this site will be producing 400,000 vehicles per year, compared with the current 170,000.
TURKEYIn August, Fives DMS signed a contract for the supply of two monobloc cold rolling mills for the country's first stainless steel production facility now under construction by Posco in collaboration with Daewoo and the Turkish steel producer Kibar. This order further extends the cooperative relationship between Fives DMS and Posco, which has already resulted in projects being completed in China over the last two years and in Vietnam at the beginning of 2011.
In Asia and Oceania
CHINAIn January, Fives DMS signed a contract with Wisco for the supply of two ZR22 monobloc cold rolling mills. Wisco is the world's leading producer of silicon steel, and the two new rolling mills supplied under this new Fives DMS order will join two previously commissioned for the company in 2006. They will produce a total of 186,000 tons of grain-oriented (GO) silicon steel, whose excellent magnetic properties are achieved using a rolling process made particularly complex by the high silicon content of the metal. Fives Stein, setting the benchmark for the global market in tinplate production following the successful commissioning of China's fastest continuous tinplate annealing lines in two plants operated by Baosteel (Yichang and Meishan, in association with Fives DMS), received in February a new order to supply Shougang Jingtang with a very high-speed (750 meters per minute) vertical annealing furnace with an annual capacity of 440,000 tons. Fives Stein furnaces are already installed in this customer’s No. 1 and No. 2 continuous annealing lines and No. 3 and No. 4 galvanization lines, the three most recent of which were commissioned successfully during the year.
In February, Fives Cinetic received an order for nine Landis LT2 machines from FAW 1st Engine Plant in China, where they will be used for grinding main bearings and crank pins on two truck engine crankshaft production

www.fivesgroup.com
11
lines. This order highlights the quality of Fives Cinetic orbital grinding technology and its enviable market position in emerging countries with fast-growing automotiive markets.
In August, Chinese steelmaker SWSS (South West Stainless Steel) contracted Fives to supply the company with its second stainless steel hot annealing and pickling line. Fives DMS will manage the contract, design and supply all the mechanical equipment for the line, assemble and commission the annealing furnace and stripping section, whilst Fives Stein will manufacture the furnace in partnership with its local company. This project is the first order for a stainless steel production line to be fulfilled entirely by the Group.
Fives Nordon continued its involvement in the Chinese nuclear power program with the receipt of two orders for pressurizer expansion lines in the second half of the year: the first order, for two lines, was placed by CNEIC (China Nuclear Energy Industry Corporation) for the Fuqing 3&4 plants, and the second one, for four lines originated with CNPEC (China Nuclear Power Engineering Company Ltd) for the Yangjiang and Fangchenggang plants.
INDIASAIL (Steel Authority of India Limited) is one of the subcontinent’s leading steelmakers and a longstanding customer of Fives Stein. During the year, it placed an order for two Digit@l Furnace® reheating furnaces: the first with a capacity of 200 metric tons per hour for the new long products rolling mill in the Bhilai plant (in February), and the second with a capacity 300 metric tons per hour for the strip rolling mill at Bokaro (in November). These two orders further strengthen the Group’s presence in the Indian market for reheating furnaces.
JAPANHaving contracted Fives Cinetic to automate its sorting center near Tokyo Haneda international airport in 2010, Yamato Transport awarded the company two new contracts to automate its terminals at Atsugi (in September) and Hyogo (in October). The system proposed for Atsugi involves two cross belt sorters and five slide sorters to provide the customer with a sorting capacity of 35,000 items per hour using a highly flexible operating mode to cope with peak flows and volumes in order to minimize item distribution times. The Hyogo solution uses four steel belt and two slide sorters.
VIETNAMIn February, Fives DMS began work on a contract to supply a ZR21 cold rolling mill to Posco, the world’s third-largest steel producer. This order confirms the status of Fives DMS as the preferred supplier to the cold rolling mills market.
In Europe
FRANCEIn February, Fives DMS was appointed by Aperam (the stainless steel branch of ArcelorMittal) as part of the company’s first major capital expenditure project. The contract covers the supply of a stainless steel hot annealing and pickling line for its Gueugnon facility. The award of this order, which includes all the associated strip conveyors, has highlighted the strengths of the Fives DMS-developed pivoting double-reel unwinding technology in terms of space saving and civil engineering. Fives Nordon has confirmed its position in the gas infrastructures market with TIGF (Total Group), the natural gas transportation and storage company, which plays a strategically-important role in gas movements between France and Spain. After having been awarded an order as part of the ‘Artère du Béarn’ pipeline project in the second quarter, Fives Nordon won a third major contract in the third quarter for the ‘Girland’ project (also in Aquitaine), and will also undertake the interconnection work required at the Lussagnet gas storage facility using a 900mm diameter pipeline.
BELGIUMFives Stein received an order in March for a photovoltaic glass melting furnace for the new Belgian glassmaker Ducatt NV. This melting furnace uses oxy-combustion technology and has the very latest Group developments in terms of reducing polluting emissions and energy consumption.
RUSSIAIn July, Rusal, the world’s largest aluminium producer, signed an endorsement with Fives Solios to resume contracts (suspended in 2008) for the construction of gas treatment centers in its two new plants at Taishet and Boguchany in Siberia.
Main deliveries
In the steel sector, 2011 was marked by the commissioning of many production lines and equipment installations with some of the Group’s most important customers.
In the process lines segment, an annealing line and two galvanization lines were commissioned for Chinese steelmaker Shougang Jingtang as part of Phase 2 of its project to relocate production facilities outside Beijing. These are some of the largest lines in the world, producing steel sheets up to 2,080mm swide. Equipped with a digital vertical furnace and the Flash Cooling® system with high hydrogen content, as well as a Galvannealing system for improved steel sheet appearance and weldability, these processing lines are capable of producing all grades of steel, with the

2011 FINANCIAL REPORT
12
ACTIVITY REPORT
emphasis on high-strength steels for the automotive industry. These three installations boost Shougang Jingtang production capacity in annealed and coated steel sheets to 2,000,000 tons per year. Still in China, Fives confirmed its status as the lead supplier to the country's top steelmaker Baosteel, with the commissioning of two silicon steel lines (one decarburization/annealing line and one coating line) at its Baoshan plant, and a bright annealing line for Baoxin at Ningbo. The year also saw acceptance of a tinplate annealing line for Meishan and a galvanization line in Shanghai for BSSB (Baosteel Special Steel Branch).A carbon steel annealing line rated at 750,000 tons per year was also commissioned successfully for Xinyu Steel.
In the reheating segment, a number of furnaces were commissioned during the year, including two walking beam furnaces of 200 tons per hour for Russian steelmaker OMK. These will be used to produce tubes for the offshore oil and gas industries. Fives also confirmed its leading market position in India, with the successful commissioning of two furnaces for JSPL (Jindal Steel and Power Limited): a Digit@l Furnace® rated at 280 tons per hour in Orissa State and a reheating furnace of 200 tons per hour in Jharkhand.
In the steel rolling segment, the Group further confirmed its expertise in the production of monobloc ZR rolling mills, with production of the first coil from a 64-inch rolling mill for ZPSS in China, and the successful start-up of the Skin-Pass and the first rolling mill for ThyssenKrupp Steel Alabama. This equipment is unique in its ability to roll steel coils of up to 74 inches wide.
In the glass sector, the 2011 financial year was marked by the commissioning of a float glass production line rated at 800 tons per day for the Obeïkan Glass Co. in Saudi Arabia, and three float glass lines for the Chinese Xinyi Group, to which Fives Stein had previously supplied several annealing lehrs (two lines rated at 600 tons per day, and one at 1,000 tons per day). The Group also commissioned a complete tin bath with a capacity of 650 tons per day for Sangalli Vetroitalia in Italy, as well as 20 pairs of top rolls for the first float glass plant constructed by LG Chem in Korea for the dedicated production of extra-thin glass for touch-screen applications. In the aluminium sector, Fives Solios successfully completed performance testing of the anode baking furnace heating and regulating equipment supplied to Vitmeco for its ALRO plant in Romania. This marks the first operational use of furnaces using the patented blown inflatable sealing membrane PSR technology developed by Fives Solios, which delivers significant reductions in energy consumption.
In the cement sector, Holcim Apasco opened its new cement plant in Hermosillo, Mexico, in March with a ceremony attended by President Felipe Calderon. The contract awarded to Fives FCB and signed at the
beginning of 2008 covered engineering services and the supply of a complete cement plant with a capacity of 3,500 tons per day. Designed to meet the very highest sustainable development standards, this production line enables Holcim Apasco to produce very high-quality cement, at the same time as minimizing electricity, fuel and water consumption, along with carbon dioxide and nitrogen oxide emissions.
In the logistics sector, Fives Cinetic commissioned the system installed in the new Fukuyama Transport sorting terminal near Tokyo in November (Fukuyama Transport is a major transportation operator in Japan). Four of the seven sorting systems ordered by MNG Kargo (one of Turkey’s leading express courier companies) from Fives Cinetic became operational in 2011. Lastly, Fives Cinetic installed the first 12,000 items per hour sorting system for the Swedish post office. This pilot system will be deployed as part of an automation program that includes seven locations around the country.
1.3. Trends and outlook
An uncertain global macroeconomic environmentAlthough the global economy continued to grow in 2011, driven by a promising first half to the year, the financial crisis that broke at the start of the summer resulted in slower growth through the fourth quarter.
The sovereign debt crisis in developed countries that struck the USA (downgraded by Standard & Poor’s in July) and, much more severely, Europe (where the banking sector came under pressure), acted in combination with rising interest rates and exchange rate volatility in many emerging countries to put greater pressure on liquidity and access to funding, which continued to affect industrial companies’ capital expenditure.
Growth forecasts for 2012 were successively downgraded from September onwards, and the IMF is now anticipating a global growth rate of 3.25%, and only 1.50% in mature economies. Faced with weakening domestic demand, the emerging economies are also likely to stand still (although to a lesser degree at 5.75%); in fact, China, India and Russia are already showing signs of slowing down.
This uncertain macroeconomic climate, which is further impacted by half-hearted demand and structural overcapacity in some countries and sectors, as well as by still-restricted access to funding, is likely to encourage industrial companies to be particularly cautious about embarking on major capital expenditure plans. The Group is therefore preparing for a more difficult trading environment in 2012.

www.fivesgroup.com
13
Fives seems well prepared to maintain its dynamic growth in 2012Nevertheless, any return to the 2009 situation of unprecedented contraction in capital expenditure by industry worldwide seems rather unlikely. The emerging countries and the USA should continue to invest, albeit selectively regarding major capacity-related projects, but more consistently in smaller projects designed to maintain or improve production resource efficiency. The quality of its technologies, its positioning in high added-value market segments, its international coverage and its financial stability provide the Group - which survived the turbulence of the 2009 crisis remarkably well - with a series of important strengths that should enable it to perform well in a more demanding market context and a more selective competitive environment. Consistent with the performances seen in 2011, the high level of order intake reported for the first two months of 2012 seems to confirm this view. In operational terms, Fives began 2012 with a record order book of €1,552 million, representing a 39% increase over the previous year. This order book includes outstanding portions of major contracts awarded since the end of 2010 (in the aluminium sector in the Middle East, in cement and glass in Brazil, in logistics in Japan and Canada, and in the steel sector in China), as well as a large number of smaller contracts distributed across all regions (with particular emphasis on the USA) and sectors (especially automotive and energy). This diverse portfolio of orders in progress provides the Group with excellent forward visibility of 2012 activity in all its business lines.
A growth strategy designed for the long termThe medium and long-term prospects for the Group appear substantial. The demographics, urbanization, infrastructure needs and improving levels of education seen in emerging countries are positive and powerful underlying factors for driving growth in demand, and therefore in industrial capital expenditure. Mature markets are showing strong potential in terms of upgrading existing installations, further strengthened by rising demand for energy efficiency and reduced environmental footprints.
In order to achieve levels of business consistent with its ambitions and potential, the Group is more committed than ever to the three key strategic directions that will characterize its growth in future years:
Intensifying the commitment to innovation and R&D The Group’s innovation policy aims to reduce time-to-market for
distinctive and breakthrough technologies, and ensure that its range of products and services continually adapts to meet the needs of markets that have been in the reconfiguration stage for nearly two years now. The very strong competitive positions occupied by Fives in the majority of its business lines are directly related to the development of innovative solutions that offer customers a real competitive edge. The R&D budget increases every year, and will increase again significantly in 2012 as part
of improving the performance of existing facilities and developing the solutions of tomorrow. Current programs focus particularly on ecodesign, process optimization and improved energy efficiency. The technologies developed by Fives reconcile high levels of energy efficiency with environmental responsibility, operational flexibility and cost effectiveness to meet the increased expectations of customers in the post-crisis world.
Strengthening the Group’s sales and operational structure in the world’s leading emerging countries
With their growth economies and significant requirements for industrial equipment, the emerging countries are now the most important drivers of growth for the Group. With subsidiaries established in nearly 30 countries already, Fives is focusing particularly on strengthening its commercial presence and structuring its operational companies in China, Brazil and Russia, where the initiatives put into place several years ago are already beginning to pay off. In India, the acquisition of CBL (now renamed Fives Combustion Systems Pvt. Ltd.) at the beginning of January 2012 marks a new stage in the development of Fives in this country. This Indian company specializes in the design and supply of combustion equipment, mainly used in the energy industry (burners for industrial boilers and heating plants) and minerals sector (cement). Lastly, the Group plans to set up a sales office and develop an after-sales company both in the Middle East during 2012 in order to benefit from the dynamic business environment of this region and capitalize on the major assembly projects it has completed there over the past five years.
Ensuring the best-possible fulfillment of existing contracts Having ended 2011 with a record order book, Fives can look forward to
a particularly busy year in 2012. In order to continue to be able to guarantee its customers faultless quality in the way their contracts are fulfilled, the Group is continuing to deploy its operational strategy in three main areas:
- a major global recruitment program, building skills remaining a priority for Fives
- affirming its industrial policy in terms of purchasing and production, which are particularly important in an increasingly globalized and interdependent environment impacted by high levels of volatility in exchange rates and commodity prices
- continuing the initiatives deployed on all its sites to ensure the safety of all its people.

2011 FINANCIAL REPORT
14
ACTIVITY REPORT
2. FINANCIAL PERFORMANCE
2.1. Accounting principles and consolidation scope
The Group consolidated financial statements have been prepared in accordance with IFRS since January 1st, 2011. Although the consolidated financial statements prepared under French GAAP remain the official financial statements for the 2010 and 2009 financial years, they have been restated to IFRS for the purposes of comparison. All the following figures are therefore presented in accordance with IFRS.
Extending its parent company’s activity into Spain, Cinetic Conveying Iberica (automotive sector) was included in the consolidation scope with effect from January 1st, 2011. Fives Bronx Inc. and Fives Bronx Ltd., which were acquired on November 30th, 2010 and therefore consolidated for only one month in 2010, contributed to Group results for the full year in 2011. Constant scope analyses exclude those companies that were consolidated as a result of external growth. Like-for-like analyses refer to analyses performed at constat scope and foreign exchange rate.
2.2. Summary of results SalesGroup sales totaled €1,268 million in 2011, reflecting an increase of €219 million (21%) over 2010. This increase included a €46 million scope effect (contribution from the Fives Bronx sub-group, which was consolidated for the full 12 months of 2011, compared with just 1 month in 2010). It also included a negative foreign exchange rate effect of -€11 million, mainly relating to the appreciation of the euro average exchange rate against the dollar from one financial year to the other. Like-for-like sales were therefore up by €184 million (18%).
This increase is directly resulting from the opening order book, which was 34% higher than that for the previous year (26% at constant scope). However, the higher level of opening order book is not entirely reflected in the increase in sales, since the proportion of major orders (spanning more than one financial year) was larger at the beginning of 2011 than was the case at the beginning of 2010.
Gross marginGross margin was €280.3 million in 2011, representing an increase of €37.8 million on 2010 (€242.5 million). The gross margin rate for 2011 was therefore 22.1% (22.0% on a like-for-like basis), compared with 23.1% in 2010. This slight reduction is explained by the issues faced by Fives Nordon on new power plant construction projects in France (in common with the rest of the industry). In the rest of the Group, the fact that contract margins were maintained despite higher activity and increased downward pressure on prices from customers reflects the good operational performance achieved during the year.
EBITAGroup EBITA rose by €11.8 million relative to 2010 to end the year 16% higher at €83.5 million. This increase includes a contribution of €11.2 million from Fives Bronx (compared with €2.2 million in 2010), as well as a negative exchange rate effect of -€1.3 million. Like-for-like EBITA was therefore up by €4.1 million (6%). The Group however benefited in 2010 from the favorable effect of withdrawing from a defined benefits pension scheme in the United Kingdom. After restatement of this effect, the actual growth in like-for-like EBITA was 26%.
Like-for-like EBITA margin rate improved by 0.4 point to 6.0% (compared with 5.6% in 2010 post-restatement), reflecting the good performance achieved in containing overheads against a background of growing business volumes.
Net financial resultThe Group held consolidated cash and cash equivalents of €239 million at December 31, 2011 - a figure €25 million higher than that for December 31, 2010 - as a result of significant progress payments received on aluminium, cement and logistics turnkey contracts, and despite the increase in working capital requirement generated by the sustained recovery in the automotive industry and the delays experienced by the nuclear power industry on new plant construction sites.
Net financial result includes the cost of net financial debt, the financial expenses relating to defined benefits pension schemes (discount effect on obligation net of expected return on fund assets), foreign exchange rate gains or losses, as well as changes in fair value and forward points of derivatives.
Net financial result for 2011 was €4.7 million lower than the figure for 2010, resulting in a loss of - €0.6 million. This reduction mainly came from the €4.2 million reduction in foreign exchange gains.
The change seen in the Group's foreign exchange rate gains relates principally to the way in which the North American and Bronx acquisitions were structured in 2008 and 2010 respectively. Since these acquisitions were financed by US dollar loans granted by Fives to its American subsidiaries, the Group’s net financial result is automatically affected by the euro/dollar exchange rate over the full life of the loans concerned. Since the appreciation of the euro against the dollar was less significant between December 31, 2010 (€1 = $1.34 dollars) and December 31, 2011 (€1 = $1.29) than between December 31, 2009 (€1 = $1.44) and December 31, 2010, the foreign exchange rate gain recognized for the 2011 financial year in respect of these transactions (€3.1 million) was €2.5 million lower than that recognized for the 2010 financial year (€5.6 million).Furthermore, a foreign exchange rate gain of €1.6 million had been recognized in 2010 as a result of forward purchases and sales of dollars put in place prior to the Bronx acquisition.

www.fivesgroup.com
15
The cumulative foreign exchange rate gain recognized on these operations from the initial transaction to the end of 2011 is €17.4 million (including an unrealized gain of €12.7 million and a realized gain of €4.7 million), to which should be added the gain of €1.6 million made on the transactions involved prior to the Bronx acquisition.
Net profitThe total income tax expense (current and deferred) for the financial year was €33.4 million, €8.6 million higher than the figure for 2010 (€24.8 million). This figure includes €33.8 million of current tax due (of which €18.4 million relate to those companies within the French tax group, with the remaining €15.4 million attributable to those French and international companies not included in that group), and a deferred tax gain of €0.4 million.
The nominal tax rate was therefore 44.9% in 2011. This is explained, on the one hand, by recognition of CVAE (the French added-value-based corporate tax) as an income tax expense (which imposes a 3.9% effect on the tax rate) and, on the other hand, by the absence of recognition of a deferred tax asset in respect of tax losses incurred by some French subsidiaries during the financial year. For reference, the nominal tax rate in 2010 was 36.5%, including a 3.3% effect imposed by the CVAE.
Net profit of consolidated companies was therefore €41.0 million. This figure was €2.0 million lower than that for 2010 (€43.0 million), despite the increase seen in operating profit (+ €11.3 million), due to the increase in the income tax expense (- €8.6 million) and the reduction in net financial result (- €4.7 million).
SUMMARY OF CONSOLIDATED FIGURES
€ Millions 2009 2010 2011
Sales 1,282.6 1,049.3 1,268.3
Gross Margin 240.6 242.5 280.3
EBITDA (*) 74.0 86.3 99.0
EBITA (*) 60.4 71.7 83.5
Current operating profit (EBIT) 59.0 68.3 76.2
Operating profit 50.8 63.7 75.0
Net financial result (6.4) 4.1 (0.6)
Profit before tax 44.4 67.8 74.4
Net profit of consolidated companies 25.9 43.0 41.0
Net profit (Group Share) 24.8 42.5 40.4
Shareholders’ equity attributable to owners of the Group
172.0 223.2 244.8
Cash and cash equivalents at December 31
229.8 214.0 239.2
(*) The Group defines EBITDA and EBITA as follows:
• EBITDAisdefinedascurrentoperatingprofitbeforeamortizationanddepreciationof
property, plant and equipment and intangible assets, excluding any purchase price
allocation effect on gross margin.
• EBITA isdefinedas currentoperatingprofitbeforeamortizationof intangible assets
related to acquisitions, excluding any purchase price allocation effect on gross margin.
N.B.: purchase price allocation adjustments impacted negatively on gross margin by €2.3
million in 2011 and €1.3 million in 2010.

2011 FINANCIAL REPORT
16
ACTIVITY REPORT
2.3. Contribution of each division to Group results
AUTOMOTIVE/LOGISTICS
€ Millions 2009 2010 2011
Order intake 193.9 399.1 607.2
Order book at Dec. 31 105.2 240.8 476.1
Sales 259.6 274.4 391.3
EBITA 8.0 14.4 28.0
Employees at Dec.31 1,694 1,710 1,978
The activity: the automotive division designs, manufactures and installs equipment, integrated tooling systems and automated production systems for the automotive industry. In logistics, the Group offers an extensive range of automated sorting systems. All these items of equipment and systems are marketed under the Fives Cinetic brand.
In the automotive sector, the recovery in capital expenditure that began in summer 2010 gained pace in 2011, despite the effects of the tsunami in Japan and the floods in Thailand, which impacted Japanese manufacturers, as well as component suppliers, and had knock-on effects throughout the industry. The emerging countries continued to forge ahead with constructing new production capacity, led by China, and to a lesser degree, Russia and Brazil. In developed countries, the production capacity rationalization policies and existing plant conversion projects introduced in previous years continued in 2011 alongside the emergence of projects aiming to develop more eco-friendly technologies, with the emphasis on engines (hybrid engines and new types of internal combustion engine), automatic gearboxes (double-clutch robotized transmissions) and the introduction of new air conditioning refrigerant (HFO) filling systems.
Business volumes remained very buoyant in machining systems during the year. In the emerging countries - led by China and India - capital expenditure gained further pace as a result of projects initiated by the leading international manufacturers and by national market players, whilst in the USA and Europe, the market was driven by the development of new production lines for more fuel-efficient engines and robotized transmissions. As a result, the Group received a series of major orders for its grinding technology from China (for Volkswagen, Ford and national manufacturers), the USA (for General Motors) and Europe (for BMW in England).
In automated production systems, Group companies saw business levels rise in the wake of capital expenditure projects initiated by their national customers. In the USA, where the industrial restructuring projects introduced by General Motors and Chrysler in 2009 continued to have their effect, the Group was involved in a number of ongoing powertrain
replacement programs, one of which generated an order for nine assembly systems for the production of a new automatic gearbox at Chrysler. Automated handling systems benefited from the recovery in capital investment amongst automobile and other vehicle manufacturers in France, and the favorable environment in those export markets accessible to France, such as Russia (with an order to supply assembly plant handling equipment and cradles for Avtovaz) and Morocco (with an order to supply handling equipment for the metalworking and assembly plants being installed as part of Phase 2 of the Renault Tangier plant).
The market for fluid filling and sealing systems was driven by the commercial opportunities created by new production capacity now in construction in emerging countries - especially China and Brazil - and by the launch of many projects to replace R134 refrigerant with HFO; an area of expertise in which Fives Cinetic offers a very effective technology.
In the logistics sector, North American, Japanese and European courier companies continued to automate their sorting centers. The effects of the Japanese tsunami and the sovereign debt crisis in North America and Europe had no negative effect on planned capital expenditure projects in this promising market, which is driven by strong growth in the volumes of goods carried. This market context created opportunities for far-reaching projects, including, in some instances, the possibility of taking a technology developed on a pilot site (for postal and transportation operators) and adapting it for use in multiple locations.
Having achieved many major successes with these customers in 2010, the Group received new substantial orders from Canada Post Corporation (greenfield project to automate the Vancouver sorting center and revamping project of the Calgary center) and the Japanese transportation company Yamato (automation projects in two logistics terminals). These orders underline the substantial success achieved in this market by the cross belt technology developed and marketed by Fives Cinetic, which is particularly effective in high-speed sorting applications. The Group also strengthened its positions in the booming airport market (for Chicago airport in the USA), in manufacturing industry and distribution (for 3 Suisses in France) and in the French maintenance outsourcing market, with customers such as the French Defence Procurement Agency, SNCF and Safran.
In overall terms, order intake for the automotive and logistics sectors ended the year at €607 million, reflecting a more than 50% increase on the previous year and setting an all-time record for the Group.
Part of this spectacular increase in order intake is reflected in the sales figure for the year, which was also up substantially on that for 2011 (+43%). Divisional EBITA rose even more impressively by 95% thanks to the fixed-cost reductions generated by the measures introduced during the 2009-2010 crisis to adjust cost structures and reduce breakeven

www.fivesgroup.com
17
points. Combined with rising business volumes, these measures showed full effect, especially amongst the Group's French companies, which recovered strongly.
The excellent sales performance also had the effect of doubling the closing order book, which ended the year at €476 million, giving the division excellent forward visibility of its workload for the new financial year. After a record year in 2011, in which projects shelved as a result of the 2008 crisis made up lost ground spectacularly, the automotive market is now expected to slow. Nevertheless, conscious of the potential offered by emerging countries - especially China and India - and the need to focus capital expenditure on those markets to maintain global market share, the leading manufacturers are already planning increases in capacity there. In the mature countries, optimization and upgrade policies seem likely to continue for several years, although at a pace certainly more modest than that seen in 2011. In logistics, the outlook is extremely favorable in developed countries against a background of volume growth combined with high labor costs. It is likely therefore that transportation and courier companies will continue to press ahead with automation programs, whilst airports and distribution also offer new prospects for growth.
METALS (ALUMINIUM, STEEL & GLASS)
€ Millions 2009 2010 2011
Order intake 216.5 468.8 550.7
Order book at Dec. 31 381.0 571.6 656.5
Sales 475.3 365.3 474.9
EBITA 21.1 33.1 36.7
Employees at Dec. 31 1,342 1,377 1,420
The activity: the metals division supplies key processes and equipment, mainly for aluminium and steel production. For aluminium, the equipment covers key manufacturing processes in the carbon, electrolysis and casthouse sectors. All this equipment is marketed under the Fives Solios brand name.In steel, the Group has both mechanical and thermal expertise and supplies rolling mills, large capacity reheat furnace, surface treatment lines as well as finishing equipement and mechanical processing for pipes and tubes. The division also serves the glass industry where its thermal technology has found new applications. The division’s activities are carried out under the Fives DMS, Fives Stein, Fives Celes ans Fives Bronx brand names in steel and under the Fives Stein brand name in the glass sector.
In the aluminium sector, the strong recovery in end-user markets resulted on the one hand in the continuation of major projects in the
Middle East (where energy is cheaper and access to raw materials is easier) and, on the other hand, in the resumption of capital expenditure on upgrading and/or capacity enhancement projects in those countries that have historically been the major producers.
Having contributed to all the Middle East's major aluminium projects since 2006, Fives consolidated its strong position in this region during 2011 by securing a number of turnkey contracts with Ma’aden Aluminium Company (the joint venture operated by the state-owned Saudi Arabian Mining Co. and Alcoa) for the supply of four gas treatment centers, fifteen melting furnaces and a bath processing unit, as part of an industrial complex construction project in Saudi Arabia (for which the Group was also contracted to supply two green anode production plants and a liquid pitch terminal in 2010). The Group also benefited from the recovery in capital expenditure seen in its historic markets, with the award of orders from Rio Tinto Alcan and Rusal to supply gas treatment centers for new plants in Canada and Russia respectively.
In the steel sector, the majority of the production growth that continued through 2011 was achieved using existing capacity, and did not feed through into new capital expenditure. Despite some opportunities seen in emerging countries at the start of the year, two factors cast a shadow over prospects for sales going forward: the slowdown in China (which has been the Group’s major market in recent years) as a result of the increasing difficulty encountered by manufacturers in securing capital expenditure permits against a background of long-term overcapacity, and the stricter conditions imposed on access to funding, exacerbated by the summer financial crisis.
The acquisition of Fives Bronx established the Group as a leading player in the tube finishing and production equipment design and supply segment, where the market paused for breath in 2011, after several years of strong growth. Macroeconomic uncertainties and the problems surrounding access to funding imposed a negative effect on Group commercial activity, especially in Russia and China. In this context of slowdown in the global steel market, many capital investment projects were the subject of longer decision-making processes, and some were even postponed indefinitely. Nevertheless, the quality of its technologies and its excellent reputation amongst leading prime contractors ensured that the Group was awarded a number of major orders in the high added-value steels segment in China (two silicon steel cold rolling mills for world-leader Wisco and a stainless steel hot annealing and pickling line), in Vietnam and Turkey (stainless steel cold rolling mills for Posco) and in France (the mechanical components for a stainless steel hot annealing and pickling line for Aperam). Its proprietary Digit@l Furnace® technology also enabled Fives to continue to set the benchmark for reheating furnaces and line furnaces, securing major orders for local steelmakers in India (two reheating furnaces for use in rolling mills) and China (a vertical furnace for a tinplate annealing line).

2011 FINANCIAL REPORT
18
ACTIVITY REPORT
In the glass sector, the imbalance between supply and demand resulting from overcapacity in China, the slowdown in the construction industry, and the problems encountered by independent glassmakers in accessing funding in many - otherwise economically healthy - emerging countries all had a negative effect on the trading environment. Despite this less than favorable background, the Group delivered a remarkable performance in 2011 by capitalizing on its positioning in high-growth regions and its powerful technology solutions to secure major orders for the supply of a float glass production plant in Brazil and a high-performance oxy-combustion laminated glass melting furnace to produce photovoltaic glass in Belgium.
In overall terms, Group order intake for metals totaled €551 million, reflecting a 17% increase on 2010 (13% at constant scope). This growth was delivered by the primary aluminium and glass segments, whilst in the steel segment, the lower volume of orders gained at constant scope as a result of market slowdown was partially offset by the consolidation of Fives Bronx (for all twelve months of 2011, compared with just one month in 2010).
Sales were up by 31% (19% at constant scope) as a result of a much higher opening order backlog, which generated sustained levels of activity throughout the year. Growth in EBITA was however only 11%, given that the Group had benefited in 2010 from the favorable impact of withdrawing from a defined benefit pension scheme in the UK. After restatement of this effect, EBITA for the metals division shows the very significant increase of 68% (29% at constant scope), reflecting good operational performance against a background of high business activity.
However, the trading environment is looking more difficult for the year ahead. Despite the excellent medium-term outlook for the primary aluminium market as a result of prospects for growth in global demand, 2012 is likely to mark a low point before the recovery forecast for 2013: the combination of the price falls seen since the end of 2011 and the maturity of many projects begun in 2008 in the world's leading production areas creates a set of conditions that does not seem encouraging to the launch of major new capital expenditure programs in the immediate future. In steel and glass, the current environment of overcapacity and the problems encountered by manufacturers in emerging countries - China, Turkey and the former Soviet states especially - to access funding does little to encourage the hope of significant market growth in the near term. Despite this less than favorable trading environment, the Group order backlog for the Metals sector, which ended the 2011 financial year at €656 million - a level close to the all-time record of €673 million set in 2007 - provides excellent forward visibility of activity levels in 2012. As in 2011, Fives should also be well positioned to grasp those opportunities presented in a highly selective business context where the focus is on the quality of technologies offered.
ENERGY
€ Millions 2009 2010 2011
Order intake 229.1 286.4 272.7
Order book at Dec. 31 228.4 234.8 217.4
Sales 263.5 284.5 290.2
EBITA 10.6 15.7 9.0
Employees at Dec. 31 1,867 1,953 2,106
The activity : the division designs and supplies a variety of industrial equipment for the energy sector (in particular nuclear piping, cryogenic equipment for hydrocarbon processing and air separation, high- performance combustion systems and bioenergy equipment), which is marketed under the Fives Nordon, Fives Cryogenie, Fives North American and Fives Cail brands.
In the cryogenic equipment segment, the recovery that began at the end of 2010 continued into 2011. On the hydrocarbons market, buoyed up by growth in demand for natural gas, the Group delivered a good commercial performance in the Middle East and Europe, serving customers such as Total, Saïpem and Petrofac. Although slower growing at the outset, the air separation market was driven by dynamic demand in Asia, especially in China (with many orders for Air Liquide), where Fives has its own production plant near Shanghai. As a result, Group order intake grew very strongly compared with the previous year.
In the area of high value-added industrial pipes, Group business streams are driven by maintenance and new-build demand from the nuclear power industry. Although this industry received a powerful shot in the arm with the need to respond to the major energy challenges facing the world (Areva had plans to build around twenty additional EPR power generating plants in France, the USA, the UK, Italy, China and India), the events of spring 2011 in Japan proved a game changer. Many new construction projects have been officially reviewed or have been the subject of delayed confirmation, especially in industrialized countries where public opinion is particularly influential. By contrast, business levels are set to increase over the medium term in nuclear plant maintenance, as a result of scheduled nuclear power plant audits, feedback from Fukushima and the likelihood that permits to extend the life of power plants now in production will very probably be subject to compliance with more demanding criteria. Lastly, against a background in which the nuclear industry no longer seems the preferred route to responding to growing energy needs, capital expenditure has begun to be committed to the conventional power generation and gas markets.

www.fivesgroup.com
19
This situation impacted negatively on the trading environment during 2011: despite the continuation of the Chinese nuclear power program, which generated new primary pipeline orders for a number of power plants, the pace of new plants construction in France has been significantly disrupted as a result of restrictions imposed by the nuclear safety inspection authorities. Although the effects of business generated by increased maintenance should soon be felt, 2011 saw significant slippage in a number of programs as operators waited for the final conclusions of post-Fukushima audit reports. As a result, order intake at Fives Nordon was highly impacted by the slowdown seen in the nuclear power industry. This effect was only partially offset by the performance delivered in other markets, including the gas infrastructure market, where the Group secured a number of orders from TIGF (Total Group) in France.
In the industrial combustion systems segment, the recovery in end-user markets that began in 2010 was confirmed during 2011 in the USA, which is the Group's most important market in this segment. Although activity experienced a series of fits and starts following Standard & Poor’s downgrading of its rating for US government debt at the beginning of the summer, fears over the macroeconomic environment gradually faded and industrial production remained at a good level throughout the year. On the one hand, manufacturers began to release capital expenditure on maintenance projects shelved between mid-2008 and mid-2010; on the other hand, the increasing attention paid to facilities energy efficiency and the introduction of more demanding environmental and technical standards favored capital expenditure aiming at upgrading existing capacity. Against this background, the quality of its technology offer - particularly well-suited to the demanding markets of industrialized countries - enabled Fives North American to deliver a good commercial performance in 2011. In the area of sugar refining equipment and bioenergy, sugar prices remained at a high level throughout the year, and even rose to a level comparable with all-time highs in the second half of the year. Against the background of rising consumption in emerging countries, the leading sugar-producing nations (Brazil, India and Thailand) were unable to meet demand, despite high levels of existing installed capacity. Paradoxically, this situation had only a marginal effect on these countries’ industrial capital expenditure level, since producers focused more closely on improving agricultural yields, having been previously penalized by difficult weather conditions. At the same time, the buoyant nature of the sugar market delayed the launch of planned projects in the bioethanol segment. By contrast, increasing demand encouraged the development of production in the world’s other sugar-producing regions (Africa, Southeast Asia and Central America), enabling the Group to achieve a level of order intake consistent with that of the previous year.
In overall terms, Group order intake for 2011 in the energy market totaled €273 million, reflecting a slight reduction of 5% on the 2010 level,
since the Group's good performance in cryogenic equipment and industrial combustion systems could not entirely offset the slowdown in the industrial pipelines market.
Despite stable sales (+2%), divisional EBITA fell significantly compared with 2010 (-43%). In fact, the results were substantially impacted by the losses incurred by Fives Nordon following the difficulties encountered by the entire industry on new power plant production sites in France (in July, EDF, Areva and Bouygues announced two further years of delay on the Flamanville EPR, bringing its total cost up to €6 billion, compared with the initial estimate of €3.3 billion).
Although the closing order book for the year decreased, the outlook for the division in 2012 seems promising in a market driven by the increasing energy needs of emerging countries and more demanding requirements for energy efficiency and environmental performance.
As the brake on new power plant construction projects has highlighted the necessity of resorting to alternative energy sources, capital expenditure seems set to accelerate in natural gas (gas processing and liquefaction, gas infrastructures, etc.), coal (many coal conversion/non-conventional oil production projects are expected in the Chinese five-year plan, and in India in the longer term), and conventional power plants; a market in which the Group has the acknowledged benefits of powerful technologies and recognized expertise. At the same time, the expected underlying trend towards a focus on maintenance in the nuclear power industry (at least in developed countries) should be favorable for Fives Nordon, where this type of project is the core business. In France, the schedule of work to be carried out on the country’s in-service nuclear power plants has been reviewed upwards in light of the post-Fukushima reports submitted by EDF and Areva to the French Nuclear Safety Authority (ASN) to a value approaching €50 billion for the period 2013-2025.
CEMENT
€ Millions 2009 2010 2011
Order intake 87.6 69.7 243.7
Order book at Dec. 31 119.7 69.4 201.8
Sales 284.2 125.1 111.9
EBITA 22.3 17.3 19.0
Employees at Dec. 31 510 509 500
The activity: the cement division’s offer ranges from supplying isolated equipment such as burners (marketed under the Fives Pillard brand name), grinders and materials separators, to complete grinding shops and turnkey cement plants (under the Fives FCB brand name).

2011 FINANCIAL REPORT
20
ACTIVITY REPORT
The economic environment remained difficult in the cement sector. Penalized by the moribund state of the real estate and construction industries in Europe and the USA, as well as the slowdown in demand seen in India and North Africa, the market for new cement production capacity (outside China) grew by only very little relative to 2009 and 2010. Against a background of significant tensions in the banking market and the need to manage existing debt, the world's leading cement producers were particularly cautious during the year. This operating environment, which has prevailed year after year since the end of 2008, has resulted in three major market trends. Firstly, the major cement manufacturers have limited their capital expenditure to a very few projects of decisive importance for maintaining market share and targeting the fastest-growing emerging regions of Brazil, India and Africa. At the same time, this situation has opened the field for local producers with lower indebtness who see an opportunity to establish and consolidate their domestic market positions, especially in South America, the former Soviet states and the Middle East. Lastly, against the background of this less favorable, and therefore more demanding, market, the quality and performance delivered by the technologies offered are once again the key criteria applied by manufacturers when making capital expenditure decisions.
In this depressed trading environment, Fives demonstrated its ability to respond to these new challenges by attracting orders of €244 million in 2011: a level comparable to that seen in the period 2006 to 2008 and substantially above that of 2010. This total includes turnkey contracts in Brazil for Holcim (which awarded its contract to Fives FCB having been very satisfied with the construction of its Hermosillo cement plant in Mexico) and in Saudi Arabia for a national cement producer. In the market for combustion systems (burners) and individual equipment for the cement industry, the Group was very active during the year, not only in China, the Middle East and North Africa where it has an established presence, but also in Russia, where significant progress was made in 2011.
In operational terms, divisional EBITA rose by 10% despite lower sales, thanks to excellent management of ongoing turnkey contracts: provisional acceptance of the Hermosillo contract for Holcim Apasco in Mexico was granted in March, whilst the warranty periods for the Vietnamese (Thai Nguyen) and Egyptian (Beni Suef) contracts expired in May and June respectively, all of these with excellent outcomes.
The sales performance delivered by the cement division in 2011 also enabled the Group to rebuild its year-end order book (€202 million: a level nearly three times that of the opening order backlog), giving it excellent forward visibility of activity levels in 2012. Over the medium term, the industry's leading players forecast that additional cement production capacity (excluding China) should achieve a sustainable level of between 60 and 75 million tons per year, driven by the infrastructure needs of
emerging countries. The Group has therefore strengthened its commercial and operational structures in order to support future growth in these countries and enhance its position towards local market players. In this context, the January 2012 acquisition of CBL, an Indian company specializing in the design and supply of combustion equipment for the cement and energy industries, should give Fives a foothold in a domestic market with particularly promising prospects for growth. Opportunities may also arise in more mature markets, where the ageing profile of existing cement production facilities is likely to encourage manufacturers to commit capital expenditure to upgrading those installations they wish to keep in production.

www.fivesgroup.com
21

2011 FINANCIAL REPORT
22
CORPORATE GOVERNANCE
THE EXECUTIVE BOARD
Fives is headed by an Executive Board overseen by the Supervisory Board; the number of Executive Board members is established by the Supervisory Board, which has set a minimum of two members and a maximum of five.
The Executive Board currently has four members and is responsible for the management of the company. It has the most extensive powers to act on behalf of Fives under all circumstances, limited only by the company purpose and powers expressly vested by the Supervisory Board and shareholder meetings.
Every member of the Executive Board also have personal responsibility for supervising one or more of the Group’s Operational Divisions and one or several functional Fives departments.
With regard to the Supervisory Board, the Executive Board: Presents a quarterly report on the Group’s performance, together with a revised budget for the current year and, at each year end, an initial budget for the following year;
Within the three months following the financial year end, closes the annual company and consolidated financial statements and provides the same to the Supervisory Board;
Provides the Supervisory Board with the Executive Board report that will be presented to the Annual Ordinary General Meeting ;
Reports on specific issues that could be of major importance for the Group.
The Executive Board meets as often as the company’s interests require.
Executive Board members are appointed and remunerated as provided for by law. Their term of office can be terminated by the General Meeting of shareholders or directly by the Supervisory Board. The Executive Board is appointed for a term of six years. Each Executive Board member shall cease his/her functions on the date of his/her 65th birthday.
Composition of the Executive Board
Frédéric Sanchez52 years old, Chairman of the Executive Board.Appointed on October 3, 2002, his term of office was renewed by the Supervisory Board on September 30, 2008 and will expire on September 29, 2014Main positions held:Various positions in companies affiliated to the Fives group.Member of the Board of Directors of Compagnie des Gaz de Pétrole Primagaz.Chairman of the Supervisory Board of Cameron France Holding SAS.
Martin Duverne55 years old, member of the Executive Board, in charge of the Energy and Logistics operational divisions.Appointed on October 3, 2002, his term of office was renewed by the Supervisory Board on September 30, 2008 and will expire on September 29, 2014.Main positions held Various positions in companies affiliated to the Fives group.
Lucile Ribot45 years old, member of the Executive Board.Appointed on October 3, 2002, her term of office was renewed by the Supervisory Board on September 30, 2008 and will expire on September 29, 2014.Main positions held Various positions in companies affiliated to the Fives group.
Jean-Camille Uring 61 years old, member of the Executive Board.Appointed on March 28, 2012, his term of office will expire on September 29, 2014. Main positions held Various positions in companies affiliated to the Fives group.
THE SUPERVISORY BOARD
The Supervisory Board is composed of at least three and at most eighteen members, except in the case of a merger, in accordance with applicable law.
With six members at December 31, 2011, the Supervisory Board exercises permanent control over the management of the company by the Executive Board. It meets at least four times per year to consider the quarterly report submitted by the Executive Board. It inspects and verifies the documents associated with the corporate and consolidated financial statements submitted to it by the Executive Board within three months of the financial year end.
Throughout the year, it performs the checks and controls it considers appropriate and may request any documents it deems useful in the accomplishment of its role.In 2011, the Supervisory Board met on: March 30, June 28, September 30 and December 15.
The members of the Supervisory Board are appointed and removed from office in the conditions provided for by law. Supervisory Board members are appointed for a term of six years expiring at the end of the Ordinary General Meeting of shareholders called to approve the financial statements for the year ended and held in the year in which the term of office expires.

www.fivesgroup.com
23
The General Meeting shall determine the remuneration, if any, paid to Supervisory Board members. The number of Supervisory Board members aged 70 or over may not exceed one third of the number of Board members.
Composition of the Supervisory Board
Jacques Lefèvre74 years old, Chairman of the Supervisory Board.Appointed on September 14, 2001, his term of office was renewed by the Supervisory Board on March 30, 2007 and will expire at the end of the General Meeting called to approve the 2012 financial statements.Main positions held Member of the Board of Director of Société Nationale d’Investissement.
Guillaume Jacqueau45 years old, Vice-Chairman of the Supervisory Board.Appointed on August 18, 2004, his term of office was renewed by the Supervisory Board on March 25, 2009 and will expire at the end of the General Meeting called to approve the 2014 financial statements.Main positions held Chairman of Equistone Partners Europe SAS.Various positions in companies affiliated to Equistone Partners SAS.
James Arnell42 years old, member of the Supervisory Board.Appointed on July 27, 2006, his term of office was renewed by the General Meeting on June 27, 2012 and will expire at the end of the General Meeting called to approve the 2017 financial statements.Main positions held Member of the Board of Directors of Charterhouse Capital Limited.Various positions in companies affiliated to Charterhouse Capital Partners LLP.
Stéphane Etroy40 years old, member of the Supervisory Board.Appointed on July 27, 2006, his term of office was renewed by the General Meeting on June 27, 2012 and will expire at the end of the General Meeting called to approve the 2017 financial statements.Main positions held Various positions in companies affiliated to Charterhouse Capital Partners LLP.
Fabrice Georget39 years old, member of the Supervisory Board.Appointed on July 27, 2006, his term of office was renewed by the General Meeting on June 27, 2012 and will expire at the end of the General Meeting called to approve the 2017 financial statements.Main positions held Various positions in companies affiliated to Charterhouse Capital Partners LLP.
Vincent Pautet37 years old, member of the Supervisory Board.Appointed on July 27, 2006, his term of office was renewed by the General Meeting on June 27, 2012 and will expire at the end of the General Meeting called to approve the 2017 financial statements.Main positions heldVarious positions in companies affiliated to Charterhouse Capital Partners LLP.
Fives’ governing bodies are assisted in their decision making by various committees, as follows:
THE EXECUTIVE COMMITTEE
To support it in its decision-making, the Executive Board has introduced an Executive Committee whose members include the Group’s key operational and central services managers, as well as Executive Board members.
As the body responsible for consultation, recommendation and implementation, the Executive Committee meets to consider issues submitted to it, and to support the Executive Board in reaching those decisions that fall within its scope of competence. More specifically, the Executive Committee is tasked with making recommendations regarding the direction of the Group’s strategy, the development of its human capital and the issues raised by interentity coordination. It assesses the risks to which the Group is exposed and the actions implemented to control those risks. It also examines and prioritizes the proposals for improvement put forward by the Steering Committee and Coordination Committee. Its tasks include coordinating and monitoring the implementation of Group policies.
The Executive Committee meets at least four times per year in larger or smaller session, depending on the issues to be addressed.
In 2011, the Executive committee met on the following dates: April 1, June 20, September 20 and December 9 and examined the following subjects:
Establishment of consolidated results; Human resources; Development of the Group’s international sales force; Internal and external communications / Group bicentennial; Research & Development policies; Innovation award; Social Corporate Responsibility (CSR) actions follow-up; Redefining of the role of governance bodies; Preparation of a CSR and activity report.

2011 FINANCIAL REPORT
24
CORPORATE GOVERNANCE
Composition of the Executive committee
Daniel Brunelli-Brondex, 51 years old,Head of the Operational Aluminium Division.Benoît Caratgé, 58 years old,Head of the Operational Steel/Glass Division.Jean-Marie Caroff, 50 years old,Head of the International Development Department.Alain Cordonnier, 51 years old,Head of the Operational Cement Division.Michel Dancette, 58 years old,Head of the Corporate Social Responsibility Department.Sylvain Dulude, 49 years old,Head of the North American Region.Denis Hugelmann, 54 years old,Head of the Operational Automotive Division.Jean-Paul Sauteraud, 60 years old,Head of the Group Legal Department.Michelle XY Shan, 46 years old,Head of the Chinese Region.Paule Viallon, 46 years old,Head of the Group Human Resources Department.
THE HEAD OF COUNTRY
All Group Companies operating in the same country (or region) form part of a matrix structure reporting to a Head of Country, whose tasks include:
chairing the Steering Committee (where appropriate), acting as the initial point of contact for Fives’ central services functions and ensuring that Fives’ instructions and directives are understood and enforced,
informing Fives of any difficulties encountered in applying its instructions and directives as a result of specific regional issues,
support Fives in the process of integrating newly acquired companies, managing the relationship between Fives and local stakeholders and coordinating the relationship between these ones and subsidiary companies,
contributing proactively to regional synergies.
THE STEERING COMMITTEES
As part of its commitment to give a say to those on the front line of the business, the Executive Board is forming a series of regional Steering Committees whose prime purpose is to act as the crucible of creativity for the Group.
Their task is to create regional cross-disciplinarity and ensure that the Group's management bodies are fully in touch with operational needs. In each major region, their membership includes subsidiary company CEOs and functional departmental heads from within Fives and/or the region concerned.Steering Committee members are appointed for one year by the Chairman of the Executive Board at the beginning of each year on the basis of current strategic challenges and priorities.Introduced this year in France, North America and China, similar committees will be formed at a future date in other countries to support the Group as it grows.
The Steering Committees meet three or four times per year.
THE COORDINATION COMMITTEE
The Executive Board is forming the Coordination Committee with the intention of boosting cross-functional interaction. This new body is being formed specifically to:
provide overall development support and assistance to Group companies,
act as a channel for informal communication, ensure consistency between the policies and the recommended measures.
The Coordination Committee meets twice or three times per year.
THE ACCOUNTS COMMITTEE
The role of the Accounts committee is to provide information to the Supervisory Board. It is composed of the following Supervisory Board members:
Jacques Lefèvre, Chairman of the Accounts committee.James Arnell, member of the Accounts committee.Fabrice Georget, member of the Accounts committee.The Chairman of the Executive Board, the Chief Financial Officer, the Group Financial Control Director, the Consolidation Director, the Group Treasurer and the company’s Statutory Auditors also attend Accounts committee meetings.

www.fivesgroup.com
25
Its role is primarily to: examine and assess the financial documents issued by Fives in connection with the preparation of the annual and interim company and consolidated financial statements;
advise the Supervisory Board on any changes in accounting principles and policies applied;
examine the manner in which internal and external controls are performed in respect of the company’s consolidated financial statements.
The Accounts committee meets at least twice a year. In 2011, it met on March 30, on June 17 and on September 30.
THE APPOINTMENTS AND REMUNERATION COMMITTEE
The Appointments and Remuneration committee is responsible for making proposals to the Supervisory Board concerning appointments to the Executive Board and the renewal of Executive Board members’ terms of office together with the amount of their remuneration.
It is composed of the following Supervisory Board members:
James Arnell, Chairman of the Appointments and Remuneration committee;Jacques Lefèvre, member of the Appointments and Remuneration committee.
In 2011, the appointments and remuneration committee met on March 30.
INTERNAL CONTROL
The internal control procedures applied within the Group are intended: to ensure that management actions and the conduct of transactions, as well as the conduct of the Group employees, comply with applicable laws and regulations, the guidelines issued by the Group’s governing bodies and its values, standards and internal rules, and
to ensure that the accounting, financial and management information provided to the Group’s governing bodies gives a fair and accurate picture of the Group’s activities and position.
With the prevention and management of the risks deriving from the Group’s activities and the conduct of its staff, the Group’s organization is based on:
the quality, personal involvement and accountability of management teams at each Group company;
coordination by business division; the implementation, as part of concerted action by all Group companies, of the “Directives and Guidelines Policy Book” (which was completely
revised in 2010). This manual is a major risk management tool and provides the basis for the internal limitations set by the Boards of Directors of Group companies on the powers of their Chief Executive Officers and Deputy Chief Executive Officers (or equivalent position).
Every material binding offer is subjected to an in-depth review intended to avoid exposure to risks that could have a significant adverse effect on the financial outcome of the proposed contract or an adverse impact on the business or reputation of the company in a given business sector or geographic region.Similarly, each material contract in progress is reviewed in detail at least once each quarter by the main managers of each Group company so as to make a detailed assessment of contract progress, review the technical, financial and contractual issues involved, and make any relevant decisions.
With regard to the preparation and processing of accounting and financial information, internal control is based on:
implementing professional accounting and financial procedures throughout the Fives group by building on the experience of its staff;
uniform guidelines, accounting methods and consolidation rules; a common integrated consolidation and management application, thus ensuring the consistency of accounting data and management information.
EXTERNAL CONTROL
The Company’s Independent Auditors are: Ernst & Young et Autres, represented by Marc Stoessel. Statutory Auditor, appointed on June 27, 2012.
Deloitte & Associés, represented by Pascal Colin. Statutory Auditor, whose term of office was renewed on June 27, 2012.
Auditex. Substitute Statutory Auditor, whose term of office was renewed on June 27, 2012.
Beas. Substitute Statutory Auditor, whose term of office was renewed on June 27, 2012.
Their terms of office will expire after the General Meeting of shareholders which will approve the 2017 financial statements.
In the context of their legal assignment, the Statutory Auditors carry out a limited review of the consolidated interim financial statements and a detailed audit of the annual company and consolidated financial statements. The company and consolidated financial statements have, to date, been approved without qualifications.

2011 FINANCIAL REPORT
26
FINANCIAL INFORMATION
Share capitalAt December 31, 2011, Fives had a share capital of €102,723,764, composed of 2,185,612 fully paid-up shares with a par value of €47 each.The shares are registered shares.There are no other securities giving access to the capital.
Changes in the share capitalOn December 15, 2011, the share capital was increased by €78,682,032 (from €24,041,732 to €102,723,764) following a €36 rise in the nominal share value.
Share ownershipFives’ main shareholder at December 31, 2011 was FL Investco, which held 99.99% of the share capital.
Stock optionsThe company had not set in place any stock option plan at December 31, 2011.
Dividends / Distribution of reservesThe Ordinary and Extraordinary General Meeting of June 23, 2009, resolved to distribute a total dividend of €19,998,349.80 to shareholders, corresponding to €9.15 per share.No dividends were paid in 2010.The combined general meeting of shareholders held on December 15, 2011 resolved to distribute an extraordinary dividend of €98,352,540, or €45 per share.€78,682,032 of this total was paid on December 15 into a current account, with the remaining balance of €19,670,508 paid on December 16. This current account was paid out in full to settle the liability created by the capital increase transacted on December 15, 2011.
LEGAL INFORMATION
Company name and registered officeFives - 27-29 rue de Provence, 75009 Paris - France
Legal formA French limited company (Société anonyme) with an Executive Boardand Supervisory Board since September 13, 2001.
TermThe term of the company is set at January 1, 2039, unless the company is wound-up early or the term is extended.
Trade and companies registry542 023 841 RCS Paris
Financial yearJanuary 1 to December 31.
Purpose (summary of Article 3 of the Memorandum and Articles of Association)The Company’s object is, directly or indirectly, in France and abroad, all engineering activities in the areas of the production and use of energy, the liquefaction of gas, the production of aluminium, cement, glass, steel and sugar, the automotive industry and logistics and, in this context, all activities relating to the design, development of and completion of projects of all kinds in the form of the providing of services, design offices and engineering advice as well as the design, development and acquisition of all property rights, processes and all industrial manufacturing resources, entering into all licensing agreements or any agreements relating to these assets.
Distribution of profits (summary of Article 23 of the Articles of Association)The General Meeting of shareholders shall have the power to grant each shareholder the option of receiving all or part of the dividend in cash or in shares in accordance with the applicable statutory and regulatory provisions.Dividends or interim dividends shall be paid under the conditions provided for by law.
Conditions for the holding of General Meetings (summary of Articles 18, 19 and 21 of theMemorandum and Articles of Association)General Meetings shall be convened under the conditions laid down by law and chaired by the Chairman of the Supervisory Board or, if unavailable, by whichever member has been designated by the Board. The agenda shall be prepared as provided for by law. General Meetings shall deliberate and decide in the conditions of quorum and majority provided for by law. Voting rights shall be exercised by usufructuaries at Ordinary General Meetings and by bare owners at Extraordinary General Meetings. Shareholders may appoint proxies under the conditions provided for by law.
Decisions made by General Meetings, in accordance with the Memorandum and Articles of Association, shall be binding on all shareholders without exception. They shall be recorded in the minutes signed by the officers of the meeting and kept in a special register initialed and signed as provided for by law, held at the registered office.
Legal documentsAll legal documents relating to the company and notably the Memorandum and Articles of Association, minutes of General Meetings and Statutory Auditors’ reports may be consulted by the shareholders at the company’s registered office.
FINANCIAL AND LEGAL INFORMATION

www.fivesgroup.com
27
NON-FINANCIAL INDICATORS
In addition to its financial performance, Fives continues year-on-year to improve the monitoring of the Group's extra-financial performance. Indicators for innovation, social data, health and safety, environmental performance and program follow up, in particular the business ethics program, are detailed below and in the next pages. These data complement the information provided in the main body of the Annual and CSR report.
1. INNOVATION INDICATORS
2009 2010 2011
R&D expenditure in millions of euros 18.4 19.8 21.2
Breakdown of R&D expenditureCosts of patents and trademarksStandard design and formalization of know-howContinuous improvement of products and processesDevelopment of new products and processesResearch and radical innovation activities
10%16%36%27%11%
9%14%39%27%11%
7%15%41%29%
8%
Patents and trade namesNumber of patents in forceNumber of patent families in forceNumber of first patents registeredOf which percentage of patents relating to energy and environmental performanceNumber of ‘product’ trade names registered
1,343308
3453%
70
1,476336
3453%
86
1,599347
2157%
97
2009 2010 2011 France The Americas Europe (excl. Fr) Asia
Number of research and test centers 16 16 16 10 3 2 1
For companies included in the Group consolidation scope.
The increase in R&D spending continued in 2011 with an expenditure of €21 million. Continuous improvement of products and processes and new product development have significantly raised to reach 70% of the total expenditure in 2011 (against 66% in 2010).In accordance with the Group R&D strategy, the percentage of patents relating to equipment energy and environmental performance is growing, and accounted for nearly 60% of the new patents registered in 2011.

2011 FINANCIAL REPORT
28
NON-FINANCIAL INDICATORS
2. SOCIAL INDICATORS
2009 2010 2011 France The Americas Europe
(excl. France)Asia
Employees 5,514 5,639 6,108 3,519 1,078 912 599
MenWomenPercentage of engineers among women
85%15%
28%
84%16%
28%
84%16%
30%
84%16%
43%
86%14%
12%
85%15%
12%
78%22%
16%
Employees by category
Engineers and managers
Technicians, designers and supervisors StaffOperators
37%
26%15%22%
38%
26%14%22%
38%
25%14%23%
42%
27%10%21%
32%
15%18%35%
27%
28%22%23%
38%
28%18%16%
Employees by age range
Less than 30 From 30 to 39 From 40 to 49 From 50 to 59 60 and more
15%22%28%29%
6%
15%23%27%29%
6%
16%23%26%28%
6%
16%26%26%28%
4%
11%12%25%38%14%
13%18%29%33%
7%
28%35%24%
9%4%
Employees by length of service
Less than 5 From 5 to 10 From 11 to 20 From 21 to 30 31 and more
38%16%20%13%13%
35%19%19%14%13%
40%18%17%12%12%
39%21%17%11%12%
38%12%17%15%19%
33%16%22%20%
9%
61%18%15%4%3%
Employees by region 2009 2010 2011
The AmericasFranceEurope (excluding France)Asia
16%62%15% 7%
17%59%15% 9%
17%58%15%10%
Changes in employee numbers
Number of employees recruited (under all types of contract) 544 843 1,231
Skills and mobility management
Percentage of employees receiving regular appraisal interviewNumber of people having attended "career booster" interviews *Percentage of employees reviewed by the "Cèdre" career management committeeProportion of French subsidiaries where "GPEC"** policy deployment is in progressPercentage of French employees for which the "GPEC"** policy has been deployedPercentage of employees having attended at least one training course
50%72
30%NDND57%
63%88
40%NDND
59%
59%84
35%80%75%60%
For companies included in the Group consolidation scope.* The “career booster” interview may be initiated either by the Group Human Resources Department or individual employees in order to explore their career potential within the Group.** "GEPC": jobs and skills forecast management

www.fivesgroup.com
29
The very good business performance delivered by Fives in 2011 was accompanied by an accelerated pace of recruitment in the Group, with 1,231 new employees recruited during the year. This influx has changed the profile of Group employees by length of service: 40% of employees have now been with the company for fewer than 5 years. This proportion rises to 61% in Asia, due to the 2009 creation of an industrial presence here, the growth of employee numbers in other subsidiaries, and the fact that China's highly-competitive labor market generates a high level of employee turnover.In addressing this range of different contexts and enhancing the appeal of the Group as an employer, the Group Human Resources Department continues to deploy its cross-functional programs, such as the career booster and training initiatives, which aim to identify and retain high-potential individuals.With regard to the Group diversity policy, although the overall percentage of women in the labor force remained unchanged at 16%, the proportion of women engineers and managers grew to 30%. In France, 43% of women are engineers and managers.
INTRODUCTION TO SITE-SPECIFIC DATA AND SAFETY/ENVIRONMENT STATISTICSThe Health, Safety and Environment report covers 99% of Group employees, and includes all those sites employing more than 10 people at the midpoint of 2011, as well as all industrial sites.
BREAKDOWN OF SITES BY TYPE 2009 2010 2011 France The Americas Europe ( excl. Fr) Asia
Number of subsidiaries within the CSR policy scope Total number of sites
Industrial sites(*)OfficesCombined sites(**), regional facilities and test centers
44682221
25
44692221
26
50752323
29
1937119
17
71072
1
141545
6
101317
5
(*) Sites with industrial operations as main activity.(**) Sites combining office activities and an industrial or test-oriented activity.
3. MANAGEMENT SYSTEM
2009 2010 2011 France The Americas Europe
(excl. France)Asia
Quality Certification (ISO 9001)
Number of certified sitesNumber of sites engaged in certification
453
471
482
290
60
100
32
Environmental Certification (ISO 14001)
Number of certified sitesNumber of sites engaged in certificationPercentage of industrial sites certified
124
36%
145
41%
154
43%
71
45%
32
29%
30
75%
21
0%
Safety Certification (compliance with a range of standards)
Number of certified sitesNumber of sites engaged in certificationPercentage of industrial sites certified
143
0%
166
0%
193
13%
151
18%
01
0%
11
25%
30
0%
Health, Safety and Environment (HSE) resources
Number of Health, Safety and Environment FTE* staff in the GroupNumber of HSE representatives in the Group Number of Group HSE auditorsNumber of Group HSE audits per year
ND40
815
46.6451017
31.3 5.1 7.5 8
* FTE: Full-Time Equivalent

2011 FINANCIAL REPORT
30
NON-FINANCIAL INDICATORS
2011 was the first year in which Group companies achieved triple Quality, Safety and Environment certification. Three companies attained this status: one in Italy and two in France.The trend seen in the number of sites awarded ISO 14001 certification reflects and confirms the Group's commitment to environmental performance.The goal of achieving ISO 14001 certification by 2014 has been set for all subsidiary companies operating industrial sites: the rate at which sites achieve certification will therefore accelerate in coming years.In overall terms, management systems continue to be strengthened, and the resources allocated to HSE are becoming increasingly dedicated and long-term. This consolidation of the HSE network has also boosted the exchange of good practices and feedback between business lines.
4. SAFETY INDICATORS
2009 2010 2011
Frequency rate (Number of lost-time accidents (≥1 day) x 1,000,000 / Total number of hours worked)
11.54 8.61 7.57
Severity rate(Number of days lost following accidents (≥1 day) x 1,000 / Number of hours worked)
0.318 0.208 0.165
In 2011, the Group Health and Safety program focused on local-level initiatives through cross audits among sites and workshops and the systematic analysis of lost-time accidents in all subsidiary companies.
The downward trend in accident frequency and accident severity across the Group that began in 2010 continued in 2011, despite a slight downturn in performance during the second half of the year. These good results are the well-earned outcome of major efforts made by Group companies to improve HSE management at company level and deliver further improvements in terms of corporate culture, the provision of information, the way in which workshops and sites are organized and relationships with partners, customers and sub-contractors.
5. ENVIRONMENTAL INDICATORS
2009 2010 2011 France The Americas Europe
(excl. France) Asia
Energy consumption
Electricity in GWhNatural gas and heating oil in GWhTotal energy in GWh
NDNDND
46.263.0109.2
50.658.5109.1
21.923.245.1
17.929.947.8
6.35.011.2
4.40.54.9
Energy costs
Electricity in €000Natural gas and heating oil in €000Total energy in €000
NDNDND
3,3282,1545,482
3,8201,9605,780
1,9011,0522,953
845563
1,408
655313968
41933
452
Water cost and consumption
Water consumption(industrial sites) in m3
Cost of water consumed(industrial sites) in €000
ND
ND
ND
ND
94,756
141

www.fivesgroup.com
31
Despite the significant increase in production and sales achieved in 2011, the overall volume of energy consumed by the Group remained stable.This fact reflects the efforts made by Group companies to improve the energy efficiency of their installations. The mild weather conditions experienced in Europe during 2011 also played their part. Nevertheless, the total energy bill for the Group was higher, due largely to increased electricity prices.
Following the first full year of monitoring industrial site water consumption in 2010, work was done on improving the reliability of these data during 2011, resulting in the ability to produce a consolidated figure for all the water consumed by the Group's industrial sites.
6. BUSINESS ETHICS INDICATORS
2009 2010 2011
Number of languages into which the Group Code of Conduct has been translatedPercentage of companies in which the Code of Conduct has been distributedPercentage of employees accounted for by these companies
282%82%
275%77%
1290%93%
The Code of Conduct was revised and re-written at the end of 2010, and deployed internationally at the beginning of 2011. During 2011, Group compliance with changes in UK law (the introduction of the UK Bribery Act) provided an opportunity to test a training program designed to support the direct distribution of the Code by Group subsidiary companies.
7. CSR INDICATORS
2009 2010 2011
Number of subsidiaries launching a local CSR action planPercentage of employees accounted for by these companies
NDND
12%
625%
Over and above the cross-functional actions initiated by the Group and the actions taken by individual subsidiary companies, an initiative specific to each Group company was rolled out to each management committee during 2011. The priority issues addressed by this initiative are incorporated into the continuous improvement plan of each subsidiary company.

2011 FINANCIAL REPORT
32

www.fivesgroup.com
33
CONSOLIDATED INCOME STATEMENT ...................................... 34
CONSOLIDATED STATEMENT OF COMPREHENSIVE INCOME .............................................................35
CONSOLIDATED BALANCE SHEET................................................ 36
CONSOLIDATED CASH FLOW STATEMENT ............................... 38
CONSOLIDATED STATEMENT OF CHANGES IN SHAREHOLDERS' EQUITY .......................................................... 39
NOTES TO THE CONSOLIDATED FINANCIAL STATEMENTS . 40
1. GENERAL PRINCIPLES ..................................................................... 40
2. ACCOUNTING PRINCIPLES........................................................... 402.1. Statement of compliance ................................................................... 402.2. Basis of preparation of the consolidated financial statements ...412.3. Presentation of the financial statements .........................................412.4. Consolidation methods ........................................................................412.5. Changes in accounting principles .......................................................412.6. Significant estimates and judgments ................................................412.7. Foreign currency transactions ............................................................ 422.8. Translation of the financial statements of entities outside the euro-zone ...................................................... 422.9. Business combinations and goodwill ............................................... 432.10. Research and development costs ...................................................... 432.11. Other intangible assets ....................................................................... 432.12. Property, plant and equipment .......................................................... 442.13. Finance leases ........................................................................................ 442.14. Impairment of property, plant and equipment, intangible assets and goodwill ........................................................... 442.15. Financial assets and liabilities ............................................................ 442.16. Revenue recognition ............................................................................. 462.17. Inventories and work in progress (excluding construction contracts) ................................................... 462.18. Cash and cash equivalents .................................................................. 462.19. Provisions .................................................................................................472.20. Retirement benefits ...............................................................................472.21. Provision for long-service awards ......................................................472.22. Income tax ...............................................................................................472.23. Earnings per share ................................................................................. 48
3. SIGNIFICANT EVENTS OF FINANCIAL YEARS 2010 AND 2011 ..........................................................................48
4. CONSOLIDATION SCOPE ............................................................. 484.1. Changes in consolidation scope in 2011 ........................................ 484.2. Changes in consolidation scope in 2010 ........................................ 48
5. NOTES TO THE CONSOLIDATED FINANCIAL STATEMENTS (in thousands of euros) ............................................................................ 495.1. Operating segment information ..................................................... 495.2. Sales ...................................................................................................... 505.3. Personnel expenses and headcount ................................................. 515.4. Research and development expenses .............................................. 515.5. Other operating income and expenses ...........................................525.6. Amortization included in profit from recurring operations ........525.7. Impairment of property, plant and equipment and intangible assets .........................................................................525.8. Net financial income or expense .....................................................525.9. Income tax expense.............................................................................535.10. Goodwill ............................................................................................... 545.11. Intangible assets ..................................................................................555.12. Property, plant and equipment ........................................................ 565.13. Non-current and current financial assets .......................................575.14. Inventories and work in progress ..................................................... 585.15. Construction contracts ...................................................................... 585.16. Trade receivables .................................................................................595.17. Other current assets ...........................................................................595.18. Cash and cash equivalents ................................................................ 605.19. Consolidated cash flow statement ................................................. 605.20. Shareholders’ equity ...................................................................................615.21. Earnings per share ............................................................................... 625.22. Current and non-current provisions ................................................ 625.23. Current and non-current financial liabilities ................................... 665.24. Other current and non-current liabilities ........................................ 685.25. Leases .................................................................................................... 685.26. Financial risk management ................................................................. 695.27. Value of financial assets and liabilities, by category ....................735.28. Off-balance sheet commitments .......................................................735.29. Related parties ........................................................................................745.30. Auditors’ fees ........................................................................................745.31. Subsequent events ..............................................................................745.32. List of consolidated companies at December 31, 2011 ................75
CONSOLIDATED FINANCIAL STATEMENTS - TABLE OF CONTENTS

2011 FINANCIAL REPORT
34
CONSOLIDATED FINANCIAL STATEMENTS DECEMBER 31, 2011
CONSOLIDATED INCOME STATEMENT
In thousands of euros Notes 2011 2010
Sales 5.2 1,268,312 1,049,257
Cost of sales (988,045) (806,737)
Gross profit 280,267 242,520
Selling expensesAdministrative expensesResearch and development expensesEmployee profit sharing and bonus schemesOther operating income and expensesAmortization of intangible assets related to acquisitions
5.4
5.55.6
(65,205)(111,000)(19,240)
(4,105)456
(4,945)
(63,703)(100,311)
(17,994)(3,337)13,287(2,182)
Profit from recurring operations 76,228 68,280
Restructuring costsImpairment of fixed assetsGain (loss) on disposals and acquisition costs
5.7(723)(846)
330
(3,814)(396)(341)
Operating profit 74,989 63,729
Cost of net financial debtOther financial income and expense
5.85.8
(560)(29)
(1,451)5,511
Net financial income (expense) (589) 4,060
Profit before income tax 74,400 67,789
Income tax expense 5.9 (33,413) (24,775)
Profit for the year 40,987 43,014
Attributable to owners of the GroupAttributable to non-controlling interests
40,419568
42,512502
Earnings per share (in euros) 5.21 18.49 19.45

www.fivesgroup.com
35
CONSOLIDATED STATEMENT OF COMPREHENSIVE INCOME
In thousands of euros 2011 2010
Profit for the year 40,987 43,014
Net change in fair value of available-for-sale financial assetsNet change in fair value of available-for-sale financial assets transferred to incomeNet change in fair value of cash flow hedgesNet change in fair value of cash flow hedges transferred to incomeActuarial gains (losses)Change in foreign currency translation reserveIncome tax on other comprehensive incomeOther comprehensive income for the year, net of income tax
272
18
(6,785)4,1101,422(963)
(38)
156
5297,592(444)7,795
Total comprehensive income for the year 40,024 50,809
Attributable to: - Owners of the Group - Non-controlling interests
39,449575
50,301508
Income tax on net change in fair value of available-for-sale financial assetsIncome tax on net change in fair value of cash flow hedgesIncome tax on actuarial gains (losses)
(97)(6)
1,525
15(52)
(407)
Total 1,422 (444)

2011 FINANCIAL REPORT
36
CONSOLIDATED FINANCIAL STATEMENTS DECEMBER 31, 2011
CONSOLIDATED BALANCE SHEET
Assets
In thousands of euros Notes Dec. 31, 2011 Dec. 31, 2010
Goodwill Intangible assetsProperty, plant and equipmentNon-current financial assetsDeferred tax assets
5.105.115.125.135.9
122,35233,334
108,2939,734
18,941
117,97037,547
105,2397,996
15,133
Non-current assets 292,654 283,885
Inventories and work in progressConstruction contracts in progress, assetsTrade receivablesOther current assetsCurrent financial assetsCurrent tax assetsCash and cash equivalents
5.145.155.165.175.13
5.18
143,714142,481184,733
72,45120,460
3,909240,358
102,481115,222132,02152,0188,0388,374
215,132
Current assets 808,106 633,286
Total assets 1,100,760 917,171

www.fivesgroup.com
37
Shareholders' equity and liabilities
In thousands of euros Notes Dec. 31, 2011 Dec. 31, 2010
Share capitalShare premium and reservesForeign currency translation reserveProfit for the year
102,72490,93610,717
40,419
24,042150,363
6,24042,512
Shareholders' equity attributable to owners of the Group 244,796 223,157
Non-controlling interests 848 2,175
Shareholders' equity 5.20 245,644 225,332
Non-current provisionsNon-current financial liabilitiesOther non-current liabilitiesDeferred tax liabilities
5.225.235.245.9
43,42641,398
1,3314,523
38,95169,481
1,3633,147
Non-current liabilities 90,678 112,942
Current provisionsCurrent financial liabilitiesConstruction contracts in progress, liabilitiesTrade and related payablesCurrent tax liabilitiesOther current liabilities
5.225.235.15
5.24
90,38345,292
202,178212,809
14,207199,570
95,28237,804
113,792173,125
5,560153,334
Current liabilities 764,439 578,897
Total shareholders' equity and liabilities 1,100,760 917,171

2011 FINANCIAL REPORT
38
CONSOLIDATED FINANCIAL STATEMENTS DECEMBER 31, 2011
CONSOLIDATED CASH FLOW STATEMENT
In thousands of euros Notes 2011 2010
Cash and cash equivalents at January 1 214,031 229,813
Profit for the year 40,987 43,014
Change in non-current provisionsAmortization, depreciation and impairmentNet (gain) loss on disposals of assetsOther non-cash income and expense itemsIncome tax expense Cost of net financial debt
(2,310)20,998(1,019)
1,40633,413
560
(17,715)17,100(650)
524,775
1,451
Operating cash flow before change in working capital and income tax 94,035 67,980
Change in working capital Income tax paid
5.19 29,477(21,262)
(17,460)(15,487)
Net cash provided by (used in) operating activities 102,250 35,033
Acquisitions of property, plant and equipment and intangible assetsDisposals of property, plant and equipment and intangible assetsChange in financial assetsEffect of change in consolidation scope
(19,025)1,156
(15,182)(1,062)
(11,656)89
(51)(11,628)
Net cash provided by (used in) investing activities (34,113) (23,246)
Increase (decrease) in share capitalDividends paid by parent companyDividends paid to non-controlling interestsGrants receivedNet increase (decrease) in borrowingsNet interest paid
(19,670)(380)
98(22,970)
(826)
(1,116)
(25,838)(1,495)
Net cash provided by (used in) financing activities (43,748) (28,449)
Effect of exchange rate changes 818 880
Net increase (decrease) in cash and cash equivalents 25,207 (15,782)
Cash and cash equivalents at December 31 5.19 239,238 214,031

www.fivesgroup.com
39
CONSOLIDATED STATEMENT OF CHANGES IN SHAREHOLDERS' EQUITY
In thousands of eurosShare capital
Retained earnings
and reserves
Actuarial gains
(losses) on pensions
Foreign currency
translation reserve
Hedging reserve
Available-for-sale financial assets - fair
value reserve
Equity attributable to owners
of the Group
Non-controlling interests
Total equity
January 1, 2010 24,042 155,387 (5,859) (1,316) (116) (95) 172,043 2,783 174,826
Profit for the year Other comprehensive income
42,512 936
7,586 104
(23)
42,512 8,603
502 6
43,014 8,609
Profit and other comprehensive income
42,512 936 7,586 104 (23) 51,115 508 51,623
Dividends paid Other changes
(1 116) (1 116)
December 31, 2010 24,042 197,899 (4,923) 6,270 (12) (118) 223,158 2,175 225,333
Profit for the year Other comprehensive income
40,419(5,281) 4,124 12 175
40,419(970)
5687
40,987(963)
Profit and other comprehensive income
40,419 (5,281) 4,124 12 175 39,449 575 40,024
Dividends paid Share capital increase Other changes
78,682(98,352)
1,537 322
(98,352)78,682
1,859
(380)
(1,522)
(98,732)78,682
337
December 31, 2011 102,724 141,503 (10,204) 10,716 57 244,796 848 245,644

2011 FINANCIAL REPORT
40
CONSOLIDATED FINANCIAL STATEMENTS DECEMBER 31, 2011
NOTES TO THE CONSOLIDATED FINANCIAL STATEMENTS
1. GENERAL PRINCIPLES
Fives (hereinafter Fives or "the Company") is a private limited liability company (Société Anonyme) with a Management Board and Supervisory Board, incorporated in France and subject to all French legislation governing commercial companies, in particular the legal provisions of the French Commercial Code. The registered office of the Company is located at 27-29 rue de Provence, 75009 Paris, France.
Fives group companies design and supply process equipment, and turnkey production lines and plant facilities for major industrial players worldwide. The Group is uniquely positioned due to its command of proprietary technologies and its expertise in engineering and complex project management.
The consolidated financial statements of the Company comprise the financial statements of companies over which the Company has direct or indirect exclusive control, which are fully consolidated, and the financial statements of jointly controlled companies (joint ventures), which are proportionately consolidated. The single economic entity is referred to as "the Group".
The consolidated financial statements have been prepared in accordance with International Financial Reporting Standards (IFRS), under the responsibility of the Management Board. They were approved by the latter on March 26, 2012. They will be final when approved by the shareholders at their General Meeting on June 27, 2012.
For financial year 2010, the statutory consolidated financial statements were prepared under French Generally Accepted Accounting Principles (French GAAP). They were approved by the Management Board on March 28, 2011 and presented to the Supervisory Board on March 30, 2011. Fives also prepared consolidated financial statements under IFRS, which were approved on September 26, 2011. The reconciliation between the French GAAP and IFRS financial statements is provided herein.The main accounting methods used to prepare the consolidated financial statements are described hereafter.
2. ACCOUNTING PRINCIPLES
2.1. Statement of compliance
The consolidated financial statements of Fives for the financial year ended December 31, 2011 have been prepared in accordance with the
international accounting standards issued by the International Accounting Standards Board (IASB) and adopted by the European Union as at December 31, 2011. The international standards comprise International Accounting Standards (IAS), International Financial Reporting Standards (IFRS) and SIC and IFRIC interpretations.
The accounting principles and valuation methods used by the Group to prepare the consolidated financial statements for the year ended December 31, 2011 are identical to those used to prepare the IFRS consolidated financial statements for the year ended December 31, 2010, with the exception of the accounting standards adopted by the European Union that are mandatory for financial years beginning on or after January 1, 2011.
The Group has not opted for the early adoption of standards and interpretations that are not mandatory for the consolidated financial statements at December 31, 2011.The adoption of the following new standards and interpretations, which are mandatory as of January 1, 2011, has not had a significant effect on the Group's financial position and performance:
IAS 24 (amendment): Related Party Disclosures. This amendment clarifies the definition of a related party.
IAS 32 (amendment): Financial Instruments: Presentation. Classification of Rights Issues.
IFRIC 14 (amendment): Prepayments of a Minimum Funding Requirement. IFRS 3: “Business Combinations”.- Transitional provisions concerning contingent consideration from a
business combination that occurred before the effective date of the revised standard.
- Measurement of non-controlling interests.- Voluntary replacement (or not) of share-based payment awards.
IFRS 7: “Financial Instruments: Disclosures”. Clarification of information required.
IAS 1: “Presentation of Financial Statements”. Clarification of the statement of changes in shareholders' equity.
IAS 27: “Consolidated and Separate Financial Statements”. Transitional provisions relating to the amendments to IAS 21: “The Effects of Changes in Foreign Exchange Rates”, to IAS 28: “Investments in Associates” and to IAS 31: “Interests in Joint Ventures”, following the amendment of IAS 27.
IAS 34: “Interim Financial Reporting”. Significant events and transactions. IFRIC 19: “Extinguishing Financial Liabilities with Equity Instruments”. Amendments to IFRIC 14: “Prepayment of a Minimum Funding Requirement”.
Moreover, the Group has not opted for the early adoption of the following standards, which should be approved by the European Union in 2012 at the earliest:
IFRS 9 and additions: “Financial Instruments” (Phase 1: Classification and measurement of financial assets and financial liabilities) effective as of January 1, 2013.

www.fivesgroup.com
41
IFRS 10: “Consolidated Financial Statements”, effective as of January 1, 2013.
IFRS 12: “Disclosure of interests in other entities”, effective as of January 1, 2013.
IFRS 11: “Joint Arrangements”, effective as of January 1, 2013. IAS 27 R: “Consolidated and Separate Financial Statements”, effective as of January 1, 2013.
IAS 28 R: “Investments in Associates and Joint Ventures”, effective as of January 1, 2013.
IFRS 13: “Fair Value Measurement”, effective as of January 1, 2013. Amendments to IAS 1: “Presentation of items in other comprehensive income (OCI)”, effective for financial years beginning on or after July 1, 2012. For Fives the effective date is January 1, 2013.
Amendments to IAS 19: “Employee Benefits”, for financial years beginning on or after January 1, 2013. For Fives the effective date is January 1, 2013.
All the accounting standards adopted by the European Union are available for viewing on the European Commission's website at the following address: http://ec.europa.eu/internal_market/accounting/ias/index_fr.htm#adopted-commission.
2.2. Basis of preparation of the consolidated financial statements
The Group's consolidated financial statements have been prepared using historical costs, with the exception of the following assets and liabilities, which are stated at fair value:
Financial assets held for trading; Available-for-sale financial assets; Derivative financial instruments.
2.3. Presentation of the financial statements
In accordance with IAS 1 revised: “Presentation of Financial Statements”, current and non-current items are presented separately in the consolidated balance sheet. Generally, assets expected to be realized and liabilities due for settlement in the operating cycle or within twelve months after the reporting date are classified as current. Other assets and liabilities are classified as non-current.
2.4. Consolidation methods
Subsidiaries are companies that are controlled by the Group. They are fully consolidated. Control is the direct or indirect power to govern the financial and operating policies of an entity so as to obtain benefits from its activity.
Control is presumed to exist if the Group holds, either directly or indirectly, more than 50% of voting rights. In assessing control, the Group takes into consideration all potential voting rights that are exercisable at the reporting date.
Joint ventures are economic activities over which the Group has joint control. They are proportionately consolidated in proportion to the percentage interest held by the Group. Joint control is the contractually agreed sharing of control over an economic activity, and exists only when the strategic financial and operating decisions relating to the activity require the unanimous consent of the parties sharing control.
Associates are entities in which the Group has significant influence but not control over the financial and operating policies. Significant influence is presumed to exist when the Group holds 20% or more of the voting power of the entity. Associates are consolidated using the equity method. Investments in associates are initially recognized at cost and adjusted thereafter for the post-acquisition change in the investor’s share of net assets of the investee, less any accumulated impairment losses. Where appropriate, the Group's share of the investee's net income for the financial year is presented in the line item "Share of income from associates" in the income statement.
Companies are consolidated on the basis of their separate financial statements at December 31, restated to comply with Group accounting principles. All transactions between consolidated companies are eliminated.
The list of subsidiaries, joint ventures and associates is provided in note 5.32.
2.5. Changes in accounting principles
The same accounting principles are applied as for previous financial years.
2.6. Significant estimates and judgments
The preparation of the consolidated financial statements requires Group and division management to make judgments, estimates and assumptions, including expectations of future events.
These assessments and estimates are reviewed at each reporting date and the underlying assumptions are adjusted, where appropriate, based on actual results, experience and any other factors given the economic circumstances. Revisions to accounting estimates are recognized in the period in which they are made.

2011 FINANCIAL REPORT
42
CONSOLIDATED FINANCIAL STATEMENTS DECEMBER 31, 2011
The items reported in the Group's future consolidated financial statements may differ from current estimates, based on changes in the assumptions made and economic circumstances at the reporting date.The main assumptions relating to future events, and other sources of estimation uncertainty at the reporting date, which may have a significant risk of resulting in a material adjustment to the carrying amounts of assets and liabilities are presented below.
Recognition of revenue and profit from construction contracts and other long-term service contracts and related provisionsRevenue and profit from construction contracts and long-term service contracts are recognized, based on the percentage-of-completion of costs incurred over estimated final costs. If the contract review reveals a negative profit margin, any expected loss on incomplete work is recognized immediately.
Revenue and profit are recognized on the basis of estimated contract revenue and costs on completion, which are reviewed regularly as the contract work is performed.
Total expected revenue and costs reflect management's most reliable estimate of the expected future economic benefits and obligations arising from the contract.
Estimates of provisions for litigationThe Group regularly identifies and analyzes ongoing litigation and where appropriate, assesses any provisions required, based on the most reliable estimate of the outflow of economic benefits required to settle such obligations at the reporting date.These estimates take into account information available and the range of possible outcomes.
Impairment of non-financial assetsGoodwill and other intangible assets with indefinite useful lives are tested for impairment at least once a year and whenever there is an indication of impairment.Other non-financial assets are tested for impairment when there is an indication that their carrying amount may exceed their recoverable amount.
In assessing value in use, management estimates the future cash flows that the entity expects to obtain from the asset or cash generating unit, and applies an appropriate discount rate to calculate their present value.The main assumptions used by the Group are described in note 2.14 "Impairment of property, plant and equipment, intangible assets and goodwill".
Deferred tax assetsDeferred tax assets relating to tax losses carried forward are recognized to
the extent of the following two criteria: (i) the net amount of deferred tax liabilities for temporary differences and (ii) the probability that future taxable profit will be available against which the benefits of the tax losses can be utilized. To determine the amount of deferred tax assets to be recognized, management is required to estimate the amount and probability of future taxable profit.
Employee benefitsCosts related to defined benefit plans are estimated using the actuarial valuation method. Actuarial valuations are based on assumptions with regard to the discount rate, salary increases, mortality and pension increases. Due to the long-term nature of these plans, there is significant uncertainty with regard to the estimates.
2.7. Foreign currency transactions
Transactions denominated in foreign currencies are translated at the exchange rates effective at the dates of the transactions. In accordance with IAS 21 "Effects of Changes in Foreign Exchange Rates", monetary items are translated using the closing rate effective at the reporting date. The corresponding foreign currency translation gains and losses are recognized in the income statement.
2.8. Translation of the financial statements of entities outside the euro-zone
The Group's consolidated financial statements are presented in euros, which is the parent company's reporting currency. All figures are rounded to the nearest thousand euros.The functional currency of an entity is the currency of the primary economic environment in which the entity operates. In the majority of cases, the functional currency is the local currency.
However, an entity may use a functional currency that differs from the local currency, if its main transactions are denominated in a foreign currency.
The financial statements of foreign entities whose functional currency is not the euro are translated into euros as follows:
balance sheet items are translated into euros using the exchange rate effective at the reporting date;
income statement and cash flow statement items are translated using the average exchange rate for the financial year;
the resulting foreign currency translation differences are recorded directly under equity in the line item "Foreign currency translation reserve".

www.fivesgroup.com
43
2.9. Business combinations and goodwill
In accordance with IFRS 3, business combinations are accounted for using the acquisition method. Under this method, upon the initial consolidation of an entity over which the Group has acquired exclusive control:
the identifiable assets acquired and liabilities assumed are measured at their fair value at the acquisition date;
non-controlling interests are measured either at their fair value (full goodwill) or at their proportionate share of the acquiree's identifiable net assets (partial goodwill).
The accounting policy choice is made on a transaction-by-transaction basis.
At the first consolidation date, goodwill is measured as the difference between:
the fair value of the consideration transferred; the proportionate share in the net amount of identifiable assets acquired and liabilities assumed at the acquisition date.
Where appropriate, measuring non-controlling interests at fair value results in the recognition of full goodwill, as goodwill is adjusted to reflect the amount attributable to non-controlling interests.The purchase price must be finalized and allocated within 12 months of the acquisition date.
In the event of a bargain purchase where the consideration paid is lower than the fair value of the net assets acquired and liabilities assumed, the resulting gain is recognized in profit directly in the income statement.Goodwill is not amortized. In accordance with IAS 36 "Impairment of Assets", goodwill is tested for impairment at least once a year and more frequently if there is an indication of impairment.
The methods used to test for impairment are described in note 2.14.
In addition, the following principles apply to business combinations: where possible, goodwill is allocated to each cash-generating unit likely to benefit from the business combination as of the acquisition date;
contingent consideration in a business combination is recorded at fair value as of the acquisition date and any subsequent adjustment occurring after the purchase price allocation period is recognized in the income statement;
acquisition-related costs are recognized as expenses when incurred; any acquisition or disposal of ownership interests that does not affect control, subsequent to a business combination, is accounted for as an equity transaction and recognized directly in equity in accordance with the revised version of IAS 27;
in the event of the acquisition of additional ownership interests in an associate without obtaining control, the Group maintains the assets acquired and liabilities assumed previously at their carrying amount in the consolidated financial statements.
In the event that control is obtained in a step acquisition, the cost of the business combination includes the previously held equity interest in the acquiree remeasured at its acquisition-date fair value.
2.10. Research and development costs
Research and development costs are expensed in the period they are incurred.Expenditure on development activities is only capitalized if the following criteria are met:
the product or process has been clearly identified and the associated costs can be measured reliably;
the product is technically feasible; the resources required to complete development are available; there is a market for the product or the product will be used internally; the product will generate future economic benefits for the Group either through its sale or internal use.
No development costs were capitalized in the financial years presented, as the development projects under way did not meet the conditions required by IAS 38.
The Group has tax credits relating to its subsidiaries’ research activities, including the research tax credit in France. These tax credits are accounted for as grants and recognized in profit from recurring operations.
2.11. Other intangible assets
Separately acquired intangible assets are recognized at their acquisition cost.
Intangible assets (technologies, brands, customer relationships and order book) acquired as part of business combinations are reported on the balance sheet at fair value, which is determined on the basis of external valuations for the most significant assets and internal appraisals for other assets. The valuation process is performed in accordance with generally accepted accounting principles, based on the income approach. Intangible assets, with the exception of brands and goodwill, are amortized on a straight-line basis over their useful lives, including, where appropriate, any period of protection provided by law or regulations.
The value of amortizable intangible assets is tested whenever there is an indication of impairment. The value of non-amortizable intangible assets (such as brands) is tested at least once a year at the reporting date and whenever there is an indication of impairment.
Allowances for amortization and impairment of intangible assets acquired as part of a business combination are shown as a separate line item in the consolidated income statement.

2011 FINANCIAL REPORT
44
CONSOLIDATED FINANCIAL STATEMENTS DECEMBER 31, 2011
Software and IT licenses are amortized on a straight-line basis over their expected useful lives (between one and five years).
2.12. Property, plant and equipment
Property, plant and equipment are measured at acquisition cost. A depreciation schedule is established for each depreciable asset at the rate at which economic benefits will be derived, given the asset’s expected useful life. In the case of buildings and certain heavy equipment, if several significant components of these assets bring the company economic benefits at different rates, then each component is recognized separately and given its own depreciation schedule. The straight-line depreciation method is generally used.
The useful lives are generally as follows: main structure of buildings (shell and brickwork), depending on the type of construction: 30 to 50 years;
facades, roofing and secondary construction: 20 to 30 years; technical and general improvements: 15 to 20 years; fixtures and fittings: 10 to 15 years; heavy industrial equipment depending on the type of machinery: 15 to 25 years;
other components, light industrial equipment, machinery and tools: 5 to 15 years.
2.13. Finance leases
Assets acquired under finance leases are capitalized when the leases transfer substantially all the risks and rewards incidental to ownership of such assets to the Group. A financial liability is recognized as an offsetting entry for the capitalized asset. Assets held under finance leases are depreciated over their useful lives.
2.14. Impairment of property, plant and equipment, intangible assets and goodwill
The carrying amount of non-current assets (excluding financial assets) is reviewed at each reporting date to identify any impairment losses:
for non-amortizable intangible assets and goodwill, impairment testing is performed at each reporting date, or more frequently when there is an indication of impairment;
for all other assets, impairment testing is performed whenever there is an indication of impairment.
The indicators that trigger impairment testing are external and include factors such as market value and significant changes in the company’s business environment.
Depending on the nature of the assets in question, impairment testing is performed either on each Cash Generating Unit (CGU) or group of CGUs.
CGUs are homogenous groups of assets that generate cash inflows.
For management purposes, goodwill from business combinations is monitored at business segment level, as described in note 5.1. Goodwill is tested for impairment at the level of the CGU representing each segment.
The recoverable amount of a CGU or group of CGUs is based on its value in use.
Value in use for the Group corresponds to the value of the expected future economic benefits arising from the use and disposal of CGUs. It is measured by discounting the expected future cash flows of each CGU or group of CGUs.
The discounted future cash flows are determined on the basis of management’s economic assumptions and operating forecasts in accordance with the following principles:
the cash flows (pretax) are derived from the business plan; the discount rate is determined on the basis of the Group’s weighted average cost of capital (WACC) by an independent expert;
the terminal value is calculated by summing the discounted cash flows to infinity, calculated on the basis of a normative cash flow and perpetual growth rate. The growth rate reflects the potential expansion of markets in which the Group operates and the Group’s competitive position.
Details of the assumptions used are provided in note 5.10.Goodwill impairment is not reversible.
2.15. Financial assets and liabilities
Initial measurementFinancial assets are initially measured at fair value, which is generally the acquisition cost.
Classification and measurement at the reporting dateFinancial assets and liabilities (excluding derivative hedging instruments) are classified under one of the following categories in the balance sheet:

www.fivesgroup.com
45
Category MeasurementRecognition of change
in value
Financial assets at fair value Fair value Income statement
Loans and receivables Amortized cost N/A
Available-for-sale financial assets
Fair value Equity
Held-to-maturity financial assets
Amortized cost N/A
Financial liabilities Amortized cost N/A
Change in fair value of financial assets recognized in the income statementThis category of assets includes:
assets held for trading, which were acquired by the company in order to generate short-term profit;
derivative instruments that are not designated as hedging instruments.
Marketable securities, such as money market funds and mutual funds, are measured at fair value at the reporting date on the basis of their latest quoted market price or net asset value. Any changes in their fair value are recorded under financial income.
Loans and receivablesLoans and receivables are measured at amortized cost at the transaction date, less any impairment losses.
Available-for-sale financial assetsInvestments in non-consolidated associates are accounted for as available-for-sale assets and measured at fair value with unrealized gains and losses recorded under shareholders’ equity, with the exception of long-term unrealized losses, which are recognized in the income statement.
Fair value is based on quoted market prices, when available. When quoted market prices are not available, the Group determines fair value through valuation techniques, such as over-the-counter transactions, discounted cash flow analysis and revalued net assets.
Loans and borrowings Loans and borrowings are initially recognized under financial liabilities at fair value, which corresponds to their issue price, net of any transaction costs incurred.
Subsequently, the difference between the net carrying amount initially recognized and the redemption value is amortized on an actuarial basis using the effective interest rate method. The effective interest rate is the rate that exactly discounts the cash flows associated with the loans and borrowings to the net carrying amount at initial recognition.
Derivative instrumentsThe Group uses derivative instruments to hedge its exposure to market risk.
To cover its exposure to interest rate risk, it primarily uses swaps that change floating rate debt to fixed rate debt.
Foreign exchange risk is hedged by currency forward sales and purchases and by insurance contracted with the French export credit insurance company (Compagnie française d’assurance pour le commerce extérieur – Coface) for French subsidiaries.
Derivative financial instruments are measured at fair value. Fair value is provided by the financial institutions that are counterparties to transactions for interest rate derivatives or calculated using standard valuation methods under market conditions at the reporting date for foreign exchange derivatives. Changes in the fair value of derivative instruments are recognized in the income statement, except for the ineffective portion of derivatives designated as cash flow hedges, which is recognized in equity.
Derivative instruments eligible for hedge accountingThe Group uses the criteria prescribed by IAS 39 to assess whether a derivative instrument qualifies for hedge accounting:
the hedging relation is clearly identified and documented at the inception date of the hedging instrument;
hedging relation effectiveness is demonstrated at the inception of the hedge and at each reporting date, both prospectively and retrospectively.
The majority of the interest rate and foreign exchange derivatives used by Fives qualify as hedging instruments.
The Group classifies hedges by the following types:
Fair value hedgesFair value hedges cover exposure to changes in fair value of a recognized asset or liability or an unrecognized firm commitment to acquire or sell an asset. Changes in the fair value of the hedged item attributable to the hedged risk adjust the carrying amount of the hedged item and are recognized in the income statement. The ineffective portion of the hedge is recognized in operating income and expense or financial income and expense according to the nature of the hedged item; the forward points adjustment is always recognized in net financial income or expense.
Cash flow hedgesCash flow hedges cover highly probable forecast transactions (forecast cash flows or firm contracts) that have not yet been invoiced. If they meet the conditions for cash flow hedge accounting, the changes in cash flows generated by the hedged item are offset by the changes in value of the hedging instrument.

2011 FINANCIAL REPORT
46
CONSOLIDATED FINANCIAL STATEMENTS DECEMBER 31, 2011
The cumulative changes in the fair value of the effective portion of the hedge are recognized as a component of equity and the cumulative changes in the fair value of the ineffective portion (corresponding to an “overhedge” where changes in the fair value of the hedging instrument are greater than changes in the fair value of the hedged item) are recognized in earnings. When the hedged cash flows occur, the amounts recognized in equity are transferred to the income statement, matching the cash flows from the hedged item.
Cash flow hedging is used to account for interest rate hedges.
Derivative instruments not eligible for hedge accountingChanges in the fair value of derivatives that are not eligible for hedge accounting are recognized directly in net financial income or expense.
Such instruments include derivative financial instruments that are used as economic hedges, but which have not been or are no longer documented as hedge accounting relationships.
2.16. Revenue recognition
The Group generates revenue through construction contracts, sales of goods and services rendered in connection with its business activities.
Measurement and presentation of construction contractsIAS 11 defines a construction contract as a contract specifically negotiated for the construction of an asset or a combination of assets that are closely interrelated or interdependent in terms of their design, technology and function or their ultimate purpose. Construction contracts are complex and/or require a high degree of integration, usually involving research work. Contract revenue is conditional on the fulfillment of contractually-agreed performance obligations.
Profit on completion of long-term contracts is estimated based on analyses of costs and revenue on completion, which are revised periodically and regularly over the life of the contract.
Revenue and profit are recognized on a percentage-of-completion basis, as the contract is performed. The stage of completion of each contract is determined by measuring the costs incurred to date over estimated costs to complete.
Penalties for late fulfillment or non-fulfillment of performance obligations are charged to revenue.
Losses on completion are fully recognized as soon as they are foreseen.
For each construction contract, the accumulated amount of costs incurred at the reporting date, plus profit recognized less invoices settled and any losses on completion recognized, is determined on a contract by contract basis. If the amount is positive, it is recorded as an asset under “Construction contracts in progress, assets”. If it is negative, it is recorded as a liability under “Construction contracts in progress, liabilities”.
Completion is recognized upon provisional acceptance (or equivalent event) for contracts involving integrated systems subject to overall performance obligations. A provision is recognized for any remaining expenses that may be incurred to secure full acceptance. A contingency provision is recognized for future warranty costs.
Sales of goods and rendering of servicesSales of goods and the rendering of services are recognized in accordance with IAS 18, which sets out the revenue recognition criteria:
Revenue from the sale of goods such as individual items of equipment or machinery is recognized when the company has transferred to the buyer the significant risks and rewards incidental to ownership of the equipment;
Revenue from the rendering of services is recognized by reference to the stage of completion of the service rendered.
Sales of goods such as individual items of equipment or machinery do not meet the definition of construction contracts. Revenue and profit are recognized when the goods are delivered.
2.17. Inventories and work in progress (excluding construction contracts)
Inventories and work in progress (excluding long-term contracts) are measured using the weighted average cost method, at the lower of acquisition or production cost and net realizable value. An impairment loss is recognized, where appropriate.
2.18. Cash and cash equivalents
Cash and cash equivalents comprise highly-liquid financial instruments and short-term investments. They include bank balances, cash on hand, demand deposits, short-term investments that are subject to an insignificant risk of change in value, and money market funds.

www.fivesgroup.com
47
2.19. Provisions
In accordance with IAS 37 "Provisions, Contingent Liabilities and Contingent Assets", provisions are recognized when the Group has a legal or constructive present obligation toward a third party as a result of a past event, which will probably result in an outflow of resources embodying economic benefits without any associated future consideration. The amount of provisions recognized corresponds to the estimated outflow of resources that will probably be required to settle the obligation.
While construction contracts are in progress, the associated obligations are included in the measurement of profit at completion and are recorded in the line items "Construction contracts in progress, assets” or “Construction contracts in progress, liabilities”.
Upon contract completion, the obligations are recognized as separate line items under liabilities.
Obligations resulting from transactions other than construction contracts are recognized directly under provisions if they meet the above-mentioned criteria.
If the time value of money is significant, the provisions are measured at their present value.
2.20. Retirement benefits
In accordance with local law and practices, the Group participates in retirement plans in the countries in which it operates. For basic retirement plans and other defined contribution plans, the Group expenses the contributions payable when they are due and does not recognize any provisions, as the Group’s commitments do not extend beyond the contributions paid.
For defined benefit plans, the provisions are determined in the following manner:
The actuarial valuation method used is the Projected Unit Credit Method, which assumes that each period of service gives rise to an additional unit of benefit entitlement and measures each unit separately to build up the final obligation. The calculations include assumptions regarding mortality, employee turnover and salary increase rates, as appropriate.
Actuarial gains or losses net of deferred tax are recognized immediately in other comprehensive income, with an offsetting entry in shareholders’ equity, in accordance with the accounting policy provided for in IAS 19 “Employee Benefits”.
The expense for the year relating to the current and past service cost and the gains or losses on plan curtailments or settlements is recognized in operating profit.The interest cost, net of the expected return on plan assets, is recognized in net financial income or expense.
2.21. Provision for long-service awards
Provisions for long-service awards are calculated by combining all award levels, in accordance with IAS 19. The provision is measured for all current employees at the reporting date, based on actuarial assumptions with regard to factors such as seniority, life expectancy and employee turnover. The effects of changes in actuarial assumptions are recognized in earnings.
2.22. Income tax
Income tax comprises current tax expense (income) and deferred tax, calculated in accordance with the tax law effective in the country where earnings are taxable.
Current and deferred tax are recognized in earnings (in the income statement) or in equity if they concern items recognized directly in equity. The effects of changes in the tax rate are recognized in equity or earnings in the financial year the change is adopted or substantially adopted, according to the initial recognition method for the associated deferred taxes.
Current tax expense (income) is the estimated amount of tax payable on taxable profit for the financial year. It is determined using the tax rate effective at the reporting date.
Accounting treatment of the Regional Levy (Contribution Economique et Territoriale)The 2010 French Finance Act, adopted on December 30, 2009, canceled the local business tax (taxe professionnelle) levied on French companies as of 2010 and replaced it with the Regional Levy, which has two components:
Property business tax (Contribution foncière des enterprises - CFE), based on the rental value of the company’s assets subject to property tax. This tax has similar characteristics to the previous local business tax and is accounted for as an operating expense;
Value added business tax (Cotisation sur la valeur ajoutée des entreprises - CVAE), based on the added valued generated by the company. This tax has characteristics similar to corporate income tax under IAS 12.

2011 FINANCIAL REPORT
48
In a Communication (policy document) issued on January 14, 2010, the French National Accounting Board stated that companies should exercise judgment in determining how to classify value added business tax (CVAE). In March 2006 and March 2009, the International Financial Reporting Interpretations Committee (IFRIC) stated that income taxes should be calculated on the basis of the net amount of income minus expense and that this amount (taxable profit) may differ from accounting profit.
For the Group, the value added base used to calculate value added business tax is an intermediary aggregate of net income. Therefore, value added business tax is accounted for in the same way as corporate income tax.
Deferred taxesDeferred taxes are recognized based on temporary differences between the carrying amount and tax bases of assets and liabilities, and for tax losses carried forward. However, no deferred tax is recognized for temporary differences generated by:
goodwill that is not tax-deductible; the initial recognition of an asset or liability in a transaction that is not a business combination, which does not affect accounting profit or taxable profit (tax loss) at the transaction date;
investments in subsidiaries, joint ventures and associates if the Group controls the date at which the temporary differences reverse and it is probable that the differences will not reverse in the foreseeable future.
Deferred tax assets are recognized only if the company’s medium-term earnings forecasts provide reasonable assurance that they can be used to offset future liabilities. Deferred tax liabilities are factored into the amount recognized. The Group ensures that the forecasts used for the recognition of deferred tax assets and liabilities and those used to calculate impairment are consistent.Deferred tax assets and liabilities are offset if the entity has a legal right to offset current tax assets and liabilities and if the deferred tax assets and liabilities relate to taxes levied by the same tax authority.
2.23. Earnings per share
Basic earnings per share are calculated by dividing profit for the year by the weighted average number of shares outstanding during the year.
3. SIGNIFICANT EVENTS OF FINANCIAL YEARS 2010 AND 2011
Economic environment
After the clear upturn in 2010, the world economy recovered further in 2011. In this relatively favorable, yet volatile and uncertain environment, Fives achieved exceptionally high sales in 2011. Group order intake reached an all-time high of €1,674 million, up 37% from 2010 (€1,224 million) and 11% above the previous record in 2007 (€1,503 million).The economic environment was factored into the accounting estimates and assessments. The results of the impairment tests performed in 2011 and 2010 confirmed that there was no impairment to the Group’s goodwill and intangible assets.
Acquisitions
On November 30, 2010 Fives acquired Bronx International Inc. (now Fives Bronx Inc.), together with its British subsidiary Bronx/Taylor Wilson Ltd. (BTW) (now Fives Bronx Ltd.), a world leader in the design and supply of finishing equipment and mechanical processing for pipes and tubes. These companies, which generate sales of approximately €55 million, have been consolidated since December 1, 2010.
4. CONSOLIDATION SCOPE
The list of companies included in the consolidation scope is provided in note 5.32.
4.1. Changes in consolidation scope in 2011
Newly-consolidated companies Cinetic Conveying Iberica.
4.2. Changes in consolidation scope in 2010
Newly-consolidated companies Cinetic Decker Filling K.K.; Fives Bronx, Inc. and Fives Bronx Ltd. (at December 1, 2010); Fives India Engineering & Projects Pvt. Ltd.; Fives Pillard (Tianjin, China) International Trading Co., Ltd.; Fives Stein Manufacturing; Fives Stein Inc.; PSA 2000, PSA 2000 Saudi Arabia Ltd. and FI 2006.
CONSOLIDATED FINANCIAL STATEMENTS DECEMBER 31, 2011

www.fivesgroup.com
49
5. NOTES TO THE CONSOLIDATED FINANCIAL STATEMENTS (in thousands of euros)
5.1. Operating segment information
The operating segments have been determined based on the information provided to the Group’s chief operating decision maker (CODM), for the purposes of operational decision-making.
The Management Board has been identified as the Group’s CODM, responsible for assessing performance and allocating resources to the four operating segments:
Automotive/Logistics: activity mainly serving the automobile and logistics industries; Cement: activity mainly serving the cement industry; Energy/Sugar: activity mainly serving the energy production industry (all forms including nuclear, fossil and renewable); Metals: activity mainly serving the steel and aluminium industries.
These four segments have been identified as the reportable operating segments, in accordance with IFRS 8.
Operating segment information
2011 2010
Automotive/LogisticsCementEnergy/SugarMetals
607,198243,768272,677550,682
399,11569,710
286,346468,830
Total order intake 1,674,325 1,224,001
Automotive/LogisticsCementEnergy/SugarMetals
391,271111,926
290,205474,910
274,402125,086284,429365,340
Total sales 1,268,312 1,049,257
Automotive/LogisticsCementEnergy/SugarMetalsOther
27,77918,989
7,90930,692(9,141)
14,10117,29814,61631,029(8,764)
Total profit from recurring operations 76,228 68,280
Automotive/LogisticsCementEnergy/SugarMetalsOther
5,3181,0826,7366,935
372
5,210979
6,7853,398
350
Total amortization, depreciation and provisions (*) 20,443 16,722
(*) included in profit from recurring operations.

2011 FINANCIAL REPORT
50
CONSOLIDATED FINANCIAL STATEMENTS DECEMBER 31, 2011
The breakdown of non-current assets by operating segment was as follows:
Dec. 31, 2011Automotive /
LogisticsCement Energy / Sugar Metals Other Total
GoodwillIntangible assets, property, plant and equipment
38,97149,996 3,580
62,28855,614
21,09330,172 2,265
122,352141,627
Total allocated assets 88,967 3,580 117,902 51,265 2,265 263,979
Other assets 836,781
Total assets 1,100,760
Dec. 31, 2010Automotive /
LogisticsCement Energy / Sugar Metals Other Total
GoodwillIntangible assets, property, plant and equipment
37,99048,093 3,896
60,43755,499
19,54332,752 2,547
117,970142,787
Total allocated assets 86,083 3,896 115,936 52,295 2,547 260,757
Other assets 656,414
Total assets 917,171
Information on major customersThe Group did not have any customers representing over 10% of sales in financial years 2011 and 2010.
5.2. Sales
The breakdown of sales was as follows:
2011 2010
Construction contract revenueServices renderedSales of goods
678,274117,318
472,720
538,404114,654396,199
Sales 1,268,312 1,049,257
Sales by destination country
2011 2010
FranceEurope (excluding France)Africa and Middle EastAmericasAsia, Oceania and other
223,324171,451
246,295295,412331,830
205,367125,569193,151
218,845306,325
Total 1,268,312 1,049,257

www.fivesgroup.com
51
Sales by origin country
2011 2010
FranceEurope (excluding France)Africa and Middle EastAmericasAsia, Oceania and other
687,732150,41445,568
266,536118,062
603,162154,192
9,102189,656
93,145
Total 1,268,312 1,049,257
5.3. Personnel expenses and headcount
Personnel expenses
2011 2010
Personnel expenses 337,805 309,794
Headcount at December 31
By category 2011 2010
Engineers and managementSupervisory and office staffOther employees
2,2952,3831,430
2,1232,2641,252
Total 6,108 5,639
By type of contract 2011 2010
Permanent contractFixed-term contractApprenticeships and internships
5,485500123
5,178348113
Total 6,108 5,639
5.4. Research and development expenses
2011 2010
Research and development expenses, grossResearch tax credits and grants received
(21,173)1,933
(19,751)1,757
Total (19,240) (17,994)

2011 FINANCIAL REPORT
52
CONSOLIDATED FINANCIAL STATEMENTS DECEMBER 31, 2011
5.5. Other operating income and expenses
The net operating income recognized in 2010 was mainly generated by the termination of the British retirement plan.
5.6. Amortization and depreciation included in profit from recurring operations
Profit from recurring operations included the following amortization and depreciation items:
2011 2010
Included in cost of salesIncluded in overheads and other operating itemsAmortization of intangible assets related to acquisitions
(9,487)(6,011)(4,945)
(8,996)(5,544)(2,182)
Total (20,443) (16,722)
5.7. Impairment of property, plant and equipment and intangible assets
2011 2010
Impairment of property, plant and equipmentGoodwill impairment
(660)(186)
(396)
Total (846) (396)
5.8. Net financial income or expense
Cost of net financial debt
2011 2010
Financial expenses relating to: - gross debt and interest rate swaps - finance leasesOther interest expense
(1,591)(141)
(899)
(2,188)(336)(796)
Interest and related expenses (2,631) (3,320)
Income from marketable securitiesOther interest income
6901,381
7111,158
Interest and related income 2,071 1,869
Total (560) (1,451)

www.fivesgroup.com
53
Other financial income and expense
2011 2010
Income from associates 193 513
Foreign exchange gains (losses)Change in fair value of foreign exchange derivativesImpact of forward points on changes in fair value of foreign exchange derivativesSwap points
2,351(362)
(1,214)10
6,510
82
Foreign exchange gains (losses) 785 6,592
Expenses for retirement and related benefitsNet change in financial provisionsOther financial items
(1,099)641
(549)
(1,222)(193)(179)
Total (29) 5,511
The foreign exchange gains recognized in 2011 and 2010 mainly reflect unrealized foreign exchange gains on the American dollar financing provided to the American subsidiaries in connection with the acquisition of the North American sub-group in 2008 and the Bronx sub-group in 2010 (see note 5.26).
5.9. Income tax expense
Analysis of income tax expense
2011 2010
Current taxNet deferred tax income (expense)
(33,836)423
(17,172)(7,603)
Total (33,413) (24,775)
Effective tax rate
2011 2010
Profit before income tax 74,400 67,789
Theoretical tax expense (at 33.33%)Permanent differencesFrench value added business tax (CVAE)Utilization of previously unrecognized tax lossesUnutilized tax lossesChange in unrecognized temporary differencesEffect of tax rate differencesOther items
(24,800)388
(2,885)2,103
(5,061)(1,072)
(696)(1,390)
(22,596)(635)
(2,224)4,868
(5,405)129
2,255(1,167)
Income tax expense (33,413) (24,775)
Effective tax rate 44.91% 36.55%

2011 FINANCIAL REPORT
54
CONSOLIDATED FINANCIAL STATEMENTS DECEMBER 31, 2011
French current taxFives and its French subsidiaries that are directly or indirectly more than 95%-owned are included in the tax group established in 2007 by FL Investco, described in note 5.32. The tax savings resulting from offsetting the taxable losses of loss-making companies with the taxable profit of profit-making companies are recognized in FL Investco’s financial statements.
Deferred taxesThe breakdown of deferred tax assets and liabilities was as follows:
Dec. 31, 2010
Change recognized in
income statement
Change recognized in
equity
Change in consolidation
scope
Translation differences and other
Dec. 31, 2011
Deferred tax assets
Deferred tax liabilities
Retirement benefitsDeductible goodwillTax losses carried forwardOther
10,164(5,389)
8,676
(937)(1,441)
3,794
1,525
(103)
158(279)
709
10,910597
16,833
(7,706)
(3,757)
Deferred tax assets (liabilities), gross 13,451 1,416 1,422 588 28,340 (11,463)
Unrecognized deferred tax assets (1,466) (993) (2,459)
Offset (6,940) 6,940
Recognized deferred tax assets 11,985 423 1,422 588 18,941 (4,523)
Deferred tax assets (liabilities), net 11,985 14,418
Deferred tax assets are only recognized when it is sufficiently likely that they can be used to offset future liabilities. Unrecognized deferred tax assets amounted to €2,459 thousand at December 31, 2011.
5.10. Goodwill
Dec. 31, 2010Net
Change in consolidation
scopeTransfers Impairment
Price adjustment
Translation differences
Dec. 31, 2011Net
Automotive/LogisticsCementEnergy/SugarMetals
37,990
60,43719,543 1,115 (186)
981
1,851621
38,971
62,28821,093
Total 117,970 1,115 (186) 3,453 122,352
Dec. 31, 2010 Dec. 31, 2011
GrossAccumulated impairment
117,970 122,538(186)
Net 117,970 122,352
The final allocation of the price of the Bronx sub-group increased goodwill by €1,115 thousand.The impairment loss of €186 thousand recognized for the financial year reflects a non-trading entity that is discontinuing its operations.

www.fivesgroup.com
55
In accordance with IAS 36, impairment testing was performed at December 31, 2011. The following assumptions were used: medium-term plan: 2012-2015 terminal value growth rate: 2% discount rate: 10% income tax rate: 33.33%.
No impairment recognition was required.
Sensitivity analysisInterest rate sensitivity The tests were performed based on the following assumptions:
discount rate: 11% (or 1% increase); terminal value growth rate: 1% (or 1% decrease).
Based on this analysis, the results would have remained unchanged.
Cash flow sensitivityThe results of the above-mentioned tests would also have remain unchanged, had future cash flows from any of the Group’s four divisions decreased by 15%.
5.11. Intangible assets
Dec. 31, 2011 Dec. 31, 2010
GrossAccumulated amortization
& impairmentNet Gross
Accumulated amortization
& impairmentNet
Business goodwillInternally developed patentsTechnologies, research and development acquiredBrands acquiredCustomer relationships and other intangibles acquiredOrder book acquiredConcessions, patents and licensesOther intangible assets
2,69281
21,3075,7397,110
5,79713,8863,998
(1,848)(40)
(6,303)(2)
(254)(4,486)
(11,304)(3,039)
84441
15,0045,7376,8561,311
2,582959
2,513
20,8255,6327,1855,165
13,3383,113
(1,848)
(3,642)(2)
(1,508)(10,467)
(2,757)
665
17,1835,6307,185
3,6572,871
356
Total 60,610 (27,276) 33,334 57,771 (20,224) 37,547
The analysis of changes in intangible assets is as follows:
GrossAccumulated amortization &
impairmentNet
Balance at Dec. 31, 2010 57,771 (20,224) 37,547
AcquisitionsDeconsolidations and disposalsAmortization, depreciation and impairmentReclassified itemsChange in consolidation scope Translation differences
1,918(335)
12
1,244
335(6,835)
(14)
(538)
1,918
(6,835)(2)
707
Balance at Dec. 31, 2011 60,610 (27,276) 33,335

2011 FINANCIAL REPORT
56
CONSOLIDATED FINANCIAL STATEMENTS DECEMBER 31, 2011
At December 31, 2010, year-on-year changes in the carrying amount of intangible assets were as follows:
GrossAccumulated amortization
& impairmentNet
Balance at Dec. 31, 2009 33,525 (17,714) 15,811
AcquisitionsDeconsolidations and disposalsAmortization, depreciation and impairmentReclassified itemsChange in consolidation scope Translation differences
1,833(1,031)
(255)23,048
651
1,031(3,465)
255(10)
(321)
1,833
(3,465)
23,038330
Balance at Dec. 31, 2010 57,771 (20,224) 37,547
5.12. Property, plant and equipment
Dec. 31, 2011 Dec. 31, 2010
GrossAccumulated
depreciation & impairment
Net GrossAccumulated
depreciation & impairment
Net
Land and developmentsLeasehold landBuildingsLeasehold buildingsPlant, equipment and machineryLeasehold plant, equipment and machinery Other assetsAssets under constructionAdvances on fixed assets
11,8121,260
86,5339,647
115,450668
37,1152,659
772
(400)
(45,180)(2,767)
(80,152)(395)
(28,119)(610)
11,4121,260
41,3536,880
35,298273
8,9962,049
772
11,9371,260
81,9269,647
107,844668
34,3383,977
239
(361)
(42,766)(2,358)
(74,394)(320)
(26,342)(56)
11,5761,260
39,1607,289
33,450348
7,9963,921
239
Total 265,916 (157,623) 108,293 251,836 (146,597) 105,239
Changes in property, plant and equipment were as follows:
GrossAccumulated depreciation &
impairment Net
Balance at Dec. 31, 2010 251,836 (146,597) 105,239
AcquisitionsDeconsolidations and disposalsDepreciation/ImpairmentReclassified itemsChange in consolidation scopeTranslation differences
16,704(5,820)
(620)16
3,800
4,403(14,708)
993(8)
(1,706)
16,704(1,417)
(14,708)373
82,094
Balance at Dec. 31, 2011 265,916 (157,623) 108,293
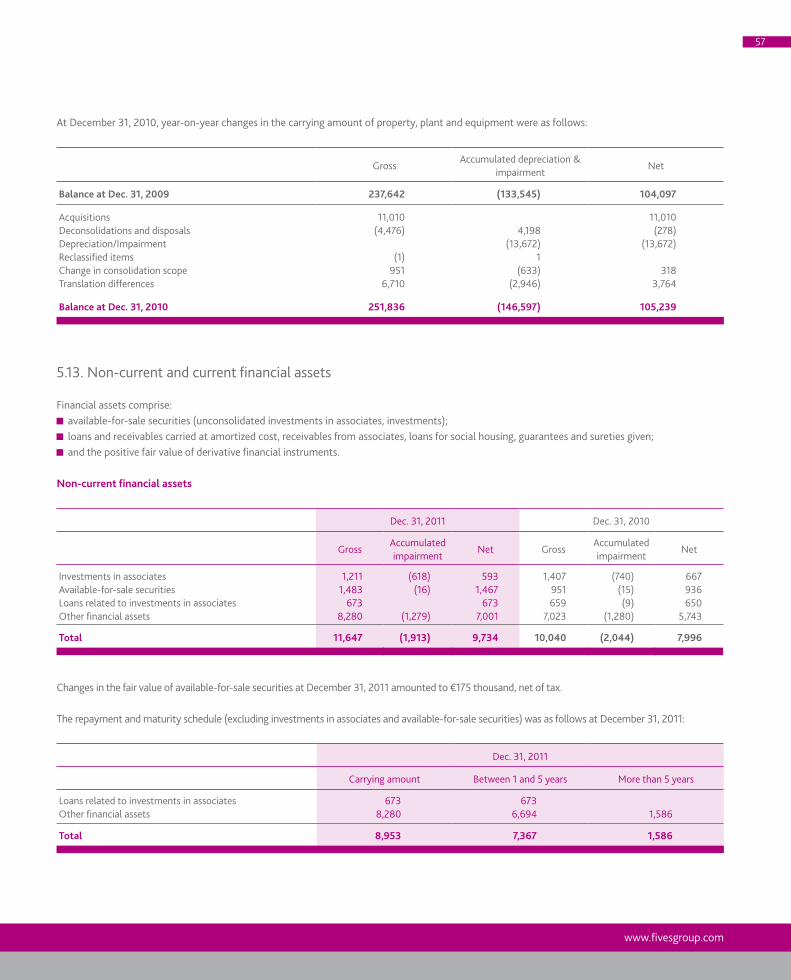
www.fivesgroup.com
57
At December 31, 2010, year-on-year changes in the carrying amount of property, plant and equipment were as follows:
GrossAccumulated depreciation &
impairment Net
Balance at Dec. 31, 2009 237,642 (133,545) 104,097
AcquisitionsDeconsolidations and disposalsDepreciation/ImpairmentReclassified itemsChange in consolidation scopeTranslation differences
11,010(4,476)
(1)951
6,710
4,198(13,672)
1(633)
(2,946)
11,010(278)
(13,672)
3183,764
Balance at Dec. 31, 2010 251,836 (146,597) 105,239
5.13. Non-current and current financial assets
Financial assets comprise: available-for-sale securities (unconsolidated investments in associates, investments); loans and receivables carried at amortized cost, receivables from associates, loans for social housing, guarantees and sureties given; and the positive fair value of derivative financial instruments.
Non-current financial assets
Dec. 31, 2011 Dec. 31, 2010
GrossAccumulated impairment
Net GrossAccumulated impairment
Net
Investments in associatesAvailable-for-sale securitiesLoans related to investments in associatesOther financial assets
1,2111,483
6738,280
(618)(16)
(1,279)
5931,467
6737,001
1,407951659
7,023
(740)(15)(9)
(1,280)
667936650
5,743
Total 11,647 (1,913) 9,734 10,040 (2,044) 7,996
Changes in the fair value of available-for-sale securities at December 31, 2011 amounted to €175 thousand, net of tax.
The repayment and maturity schedule (excluding investments in associates and available-for-sale securities) was as follows at December 31, 2011:
Dec. 31, 2011
Carrying amount Between 1 and 5 years More than 5 years
Loans related to investments in associatesOther financial assets
6738,280
6736,694 1,586
Total 8,953 7,367 1,586

2011 FINANCIAL REPORT
58
CONSOLIDATED FINANCIAL STATEMENTS DECEMBER 31, 2011
At December 31, 2010, it was as follows:
Dec. 31, 2010
Carrying amount Between 1 and 5 years More than 5 years
Loans related to investments in associatesOther financial assets
6597,023
6595,883 1,140
Total 7,682 6,542 1,140
Current financial assets
Dec. 31, 2011 Dec. 31, 2010
GrossAccumulated impairment
Net GrossAccumulated impairment
Net
DerivativesLoans related to investments in associatesLoansAccrued interestOther
4,214840200
915,198
(1)4,214
839200
915,198
7,312635226
101
(146)7,312489226
101
Total current financial assets 20,461 (1) 20,460 8,184 (146) 8,038
5.14. Inventories and work in progress
Dec. 31, 2011 Dec. 31, 2010
GrossAccumulated impairment
Net GrossAccumulated impairment
Net
Raw materialsWork in progress under completed-contract methodSemi-finished and finished goods
54,49786,82619,889
(10,377)(2,358)(4,763)
44,12084,46815,126
42,25655,33120,707
(8,583)(2,493)(4,737)
33,67352,83815,970
Total 161,212 (17,498) 143,714 118,294 (15,813) 102,481
5.15. Construction contracts
Dec. 31, 2011 Dec. 31, 2010
Construction contracts in progress, assetsConstruction contracts in progress, liabilities
142,481(202,178)
115,222(113,792)
Net (59,697) 1,430

www.fivesgroup.com
59
Cumulative information on construction contracts in progress was as follows:
Dec. 31, 2011 Dec. 31, 2010
Costs incurred and profit recognized for construction contracts in progressProgress billings and advancesProvisions for loss at completion
1,329,863(1,387,779)
(1,781)
1,299,281(1,296,013)
(1,838)
Net (59,697) 1,430
5.16. Trade receivables
Dec. 31, 2011 Dec. 31, 2010
GrossAccumulated impairment
Net GrossAccumulated impairment
Net
Trade receivables 195,590 (10,857) 184,733 143,384 (11,363) 132,021
Total 195,590 (10,857) 184,733 143,384 (11,363) 132,021
Changes in the impairment of trade receivables can be analyzed as follows:
Opening balance Allowances ReversalsTranslation differences
Other Closing balance
2011 (11,363) (2,401) 2,511 83 313 (10,857)
2010 (7,470) (4,549) 1,107 (231) (220) (11,363)
The Group’s policy for managing trade receivables is based on the following principles: upstream risk management processes entailing the analysis of receivables risk during the project bid and selection stage; specific provisions for major contracts, including the obligation to hedge risk (commercial and/or political risk) according to criteria relating to contract size, type of receivable, and country category;
regular monitoring of overdue payments during contract performance and early implementation of collection procedures for receivables due.
Allowances for impairment losses are measured on a case-by-case basis taking into account collection risk.
5.17. Other current assets
Dec. 31, 2011 Dec. 31, 2010
VAT and related tax receivablesAdvances and progress paymentsOther receivablesPrepaid expenses
18,62220,54617,45415,829
13,29914,78013,83110,108
Total 72,451 52,018

2011 FINANCIAL REPORT
60
CONSOLIDATED FINANCIAL STATEMENTS DECEMBER 31, 2011
5.18. Cash and cash equivalents
Dec. 31, 2011 Dec. 31, 2010
Cash equivalentsCash
140,90799,451
116,95298,180
Total cash and cash equivalents 240,358 215,132
Cash equivalents comprise money market funds, certificates of deposit and term deposits of less than three months.Cash includes interest-bearing current accounts.
Breakdown of cash and cash equivalents per currency
Euro USD GBP CNY JPY Other Total
Cash equivalentsCash
110,08421,279
29,5634,272 9,943 14,314 14,557
1,26035,086
140,90799,451
Total Dec. 31, 2011 131,363 33,835 9,943 14,314 14,557 36,346 240,358
Foreign exchange swaps (50,589) 29,313 8,740 12,536
Total Dec. 31, 2011 (before swaps) 80,774 63,148 18,683 14,314 27,093 36,346 240,358
Euro USD GBP CNY JPY Other Total
Cash equivalentsCash
82,44623,193
33,07116,079
15217,553 16,210 9,905
1,28315,240
116,95298,180
Total Dec. 31, 2010 105,639 49,150 17,705 16,210 9,905 16,523 215,132
Cash and cash equivalents are mainly held in OECD countries and are available for the Group. The cash-generating wholly-owned subsidiaries in China provide the Group with a substantial share of cash denominated in CNY.
5.19. Consolidated cash flow statement
Cash and cash equivalents, net
Dec. 31, 2011 Dec. 31, 2010
Cash equivalentsCash
140,90799,451
116,95298,180
Cash and cash equivalents, assets 240,358 215,132
Bank overdrafts (1,120) (1,101)
Total 239,238 214,031

www.fivesgroup.com
61
Change in WCR
Variations
Dec. 31, 2011 Dec. 31, 2010Due to business
activityOther *
Inventories and work in progressConstruction contracts in progress, assetsTrade receivablesOther current/non-current assets incl. in working capital Construction contracts in progress, liabilitiesTrade and related payablesOther current/non-current liabilities incl. in working capital
(143,714)(142,481)(184,733)
(72,047)202,178212,809197,401
(102,481)(115,222)(132,021)
(51,361)113,792173,125
149,649
(39,569)(31,771)
(40,449)(23,891)90,60642,93240,804
(1,665)4,512
(12,264)3,205
(2,220)(3,247)
6,948
Working capital requirements before current provisions 69,413 35,481 38,662 (4,732)
Current provisions 90,383 95,282 (9,185) 4,287
Working capital requirements 159,796 130,763 29,477 (445)
*resulting from changes in consolidation scope and foreign currency translation differences.
5.20. Shareholders’ equity
Financial capital management policyThe Group implements a stringent, prudent financial capital management policy to ensure satisfactory returns for shareholders.There are no financial covenants involving the Group’s consolidated equity or the equity of the parent company.
Share capital
Dec. 31, 2011 Dec. 31, 2010
Number of sharesPar value in euros
2,185,61247
2,185,61211
Share capital 102,723,764 24,041,732
On December 15, 2011, the share capital of Fives, which amounted to €24,041,732 divided into 2,185,612 shares with a par value of €11, was increased by a cash payment of €78,682,032 and by increasing the par value of the shares by €36 from €11 to €47.As a result, share capital amounts to €102,723,764 divided into 2,185,612 shares with a par value of €47.
Shareholding structureThe majority shareholder of Fives is FL Investco, which held 99.99% of Fives’ share capital at December 31, 2011, and also at December 31, 2010. FL Investco is controlled by funds managed by Charterhouse General Partners (VIII) Limited.
Dividend paymentIn December 2011, Fives paid an aggregate exceptional dividend of €98,352,540 from retained earnings. The payment was made through the transfer of €78,682,032 to the current account on December 15 and the settlement of the remaining balance of €19,670,508 on December 16. The current account was fully offset by the recognition of a receivable for unpaid subscribed share capital in connection with the share capital increase on December 15, 2011.Fives did not pay any dividends in 2010.

2011 FINANCIAL REPORT
62
CONSOLIDATED FINANCIAL STATEMENTS DECEMBER 31, 2011
5.21. Earnings per share
2011 2010
Profit attributable to owners of the GroupWeighted average number of shares
40,4192,185,612
42,5122,185,612
Earnings per share (in euros) 18.49 19.45
There are no dilutive instruments.
5.22. Current and non-current provisions
Dec. 31, 2010 Allowance UtilizationUnutilized
reversalTranslation differences
Other Dec. 31, 2011
GuaranteesContract litigationFuture losses on contracts Completed contract expensesOther contingency and expense provisions
48,16115,063
14023,248
8,670
29,9931,8581,405
15,916
3,391
(10,399)(1,744)
(614)(11,770)
(3,698)
(25,231)(1,277)
(5,229)
(1,786)
973(14)
14303
189
2,351
50
420
45,84813,886
94522,518
7,187
Total current provisions 95,282 52,563 (28,225) (33,523) 1,465 2,821 90,383
Retirement benefitsLong-service awardsRestructuringIncome tax & employee litigation
37,333544646
428
4,269119381
11
(4,237)(46)
(128)
(113)
(2,365)(54)
(146)
646
(41)
6,251(72)
41,897491753
285
Total non-current provisions 38,951 4,780 (4,524) (2,565) 605 6,179 43,426
In 2010, an amount of €2,667 thousand was reclassified between other contingency and expense provisions and contract litigation
Dec. 31, 2009 Allowance UtilizationUnutilized
reversalTranslation differences
Other Dec. 31, 2010
GuaranteesContract litigationFuture losses on contracts Completed contract expensesOther contingency and expense provisions
46,77312,565
17019,020
7,265
31,8186,876
20,943
3,142
(23,822)(1,159)
(30)(14,595)
(2,945)
(8,732)(777)
(3,690)
(387)
1,453185
638
183
67140
932
(1,255)
48,16117,730
14023,248
6,003
Total current provisions 85,793 62,779 (42,551) (13,586) 2,459 388 95,282
Retirement benefitsLong-service awardsRestructuringIncome tax & employee litigation
51,348468
2,847
496
4,278117
887
(7,625)(87)
(3,378)
(11,364)
(160)
(383)
1,63010
5
(934)36
450
310
37,333544646
428
Total non-current provisions 55,159 5,282 (11,090) (11,907) 1,645 (138) 38,951

www.fivesgroup.com
63
Current provisionsCurrent provisions mainly comprise provisions for guarantees, future losses on contracts excluding construction contracts, and litigation concerning completed contracts.Provisions for guarantees cover the estimated future costs to be incurred over contract warranty periods, after provisional acceptance (or an equivalent event).Known litigation and claims that could affect the Group’s companies were examined at the reporting date and, on the advice of legal counsel, the provisions judged necessary were recognized to cover known risks. Non-current provisionsNon-current provisions mainly comprise provisions for restructuring, provisions for employee benefits and provisions for tax and employee-related litigation. The provision for retirement obligations and other employee benefits reflects the Group’s defined benefit plans currently in place, which include:
French retirement benefits; Italian contractual retirement benefits (TFR); British, German, Japanese, Indian and French supplementary retirement plans; the British (except for Cinetic Landis Ltd.), German and French pension funds have been closed to further accrual and the vested rights thereunder were frozen as of the respective closure dates.
Actuarial assumptions
December 31, 2011 France United Kingdom Japan Germany India
Discount rateExpected return on plan assetsSalary increase rate
4.18%N/A
2.0 - 2.5%
4.6 – 4.7%5.25 - 6.89%
NA
2%2.5%3%
4.66%NANA
8.60%NA5%
December 31, 2010 France United Kingdom Japan Germany India
Discount rateExpected return on plan assetsSalary increase rate (%)
4.5%4.1%
2.0 - 2.5%
5.5%6.55- 7.44%
NA
2%2.5%3%
4.5%NANA
8.20%9%5%
The present value of defined benefit obligations totaled €81,428 thousand at December 31, 2011. Given the fair value of all plan assets, the net liability at December 31, 2011 totaled €44,772 thousand.Net income or expense recognized for the financial year reflects the current service cost, the interest cost of the obligation less the expected return on plan assets, the amortization of past service costs, and gains or losses on plan curtailments or settlements. In total, the expenses and changes in provisions for retirement benefit obligations resulted in a net expense of €1,906 thousand for the financial year, of which an expense of €806 thousand was recognized in profit from recurring operations, and an expense of €1,100 thousand was recognized in financial expense.Net actuarial gains and losses recognized directly in equity for the year amounted to €6,784 thousand, excluding tax.

2011 FINANCIAL REPORT
64
CONSOLIDATED FINANCIAL STATEMENTS DECEMBER 31, 2011
Retirement benefits Supplementary retirement obligations
France Italy United Kingdom Germany Japan India Total
Change in present value of obligation
Present value of obligation at January 1Current service costInterest costEmployee contributions paidPlan amendmentsPlan curtailments/settlementsNewly consolidated Benefits paidActuarial (gain) lossForeign exchange gains and losses
16,878998771
(1,246)709
2,668
77
(216)
49,3631,8512,737
637
(856)2,0561,173
3,00659
130
(367)(10)
6,0579227
(3,420)
(1,336)(2)
(542)
154198
(21)(56)
50(20)
78,1263,0193,750
637
(3,420)(21)
(4,077)2,803
611
Present value of obligation at December 31, 2011 18,110 2,529 56,961 2,818 876 134 81,428
Change in fair value of plan assets
Fair value of plan assets at January 1Net return on plan assetsEmployer contributions paidEmployee contributions paidPlan curtailments/settlementsNewly consolidated Benefits paidForeign exchange gains and losses
35,249(1,326)
2,360637
(856)524
2,452(10)
(1,055)
(1,336)(51)
646
15
(23)6
37,765(1,330)
2,375637
(1,055)
(2,215)479
Fair value of plan assets at December 31, 2011 36,588 68 36,656
Components of amounts recognized in the financial statements
Net obligationUnrecognized past service costs
18,110(2,875)
2,529 20,374 2,818 876 65 44,772(2,875)
Net provision recognized in the balance sheet at December 31, 2011
15,235 2,529 20,374 2,818 876 65 41,897
Components of net expense (income) recognized for financial year 2011
Current service costInterest costExpected return on plan assetsAmortization of past service costsAmortization of actuarial gains and losses(Gains) losses related to plan curtailments/settlements
998771
152
771,8512,737
(2,628)
59130
9227
(16)
(2,365)
198
(6)
3,0193,750
(2,650)152
(2,365)
Net expense (income) recognized in the income statement for financial year 2011
1,921 77 1,960 189 (2,262) 21 1,906
Change in provisions for retirement and other benefits
Provisions at January 1Employer contributions paidNet expense (income) recognized Benefits paid directly by the employerNewly consolidated Net actuarial gains and lossesForeign exchange gains and losses
13,851
1,921(1,246)
709
2,668
77(216)
14,114(2,360)
1,960
6,011649
3,006
189(367)
(10)
3,604
(2,262)
24(490)
90(15)
21(33)
50(48)
37,333(2,375)
1,906(1,862)
6,784111
Provisions recognized in the balance sheet at December 31, 2011
15,235 2,529 20,374 2,818 876 65 41,897

www.fivesgroup.com
65
In 2010, the changes were as follows:
Retirement benefits Supplementary retirement obligations
France Italy United Kingdom Germany Japan India Total
Change in present value of obligation
Present value of obligation at January 1Current service costInterest costEmployee contributions paidPlan amendmentsPlan curtailments/settlementsNewly consolidated Benefits paidActuarial (gain) lossForeign exchange gains and losses
14,126859619
3,103
(1,537)(292)
2,829
99
(260)
79,9331,6692,569
565
(38,308)
(1,162)1,4622,635
3,26475
145
(313)(165)
4,760338
99
440(562)(107)1,089
1823912
(130)2922
105,0942,9803,543
5653,103
(38,308)440
(3,964)927
3,746
Present value of obligation at December 31, 2010 16,878 2,668 49,363 3,006 6,057 154 78,126
Change in fair value of plan assets
Fair value of plan assets at January 1Net return on plan assetsEmployer contributions paidEmployee contributions paidPlan curtailments/settlementsNewly consolidated Benefits paidForeign exchange gains and losses
166
(166)
51,1852,2342,3615,333
565(26,944)
(1,162)1,677
7532
(80)
2,22577
(104)333
(562)484
958
(2)19
(54)(2)
53,7462,3222,2575,685
565(26,944)
(2,024)2,159
Fair value of plan assets at December 31, 2010 35,249 2,453 64 37,766
Components of amounts recognized in the financial statements
Net obligationUnrecognized past service costs
16,878(3,027)
2,668 14,114 3,006 3,604 90 40,360(3,027)
Net provision recognized in the balance sheet at December 31, 2011
13,851 2,668 14,114 3,006 3,604 90 37,333
Components of net expense (income) recognized for financial year 2010
Current service costInterest costExpected return on plan assetsAmortization of past service costsAmortization of actuarial gains and losses(Gains) losses related to plan curtailments/settlements
859619
76
991,6692,569
(2,234)
(11,364)
75145(3)
33899
(77)
3912
(8)
2,9803,543
(2,322)76
(11,364)
Net expense (income) recognized in the income statement for financial year 2010
1,554 99 (9,360) 217 360 43 (7,087)
Change in provisions for retirement and other benefits
Provisions at January 1Employer contributions paidNet expense (income) recognized Benefits paid directly by the employerNewly consolidated Net actuarial gains and lossesForeign exchange gains and losses
13,960
1,554(1,371)
(292)
2,829
99(260)
28,748(5,333)(9,360)
(899)958
3,189
217(233)
(167)
2,535(333)
360
440(3)
605
87(19)
43(76)
3223
51,348(5,685)(7,087)(1,940)
440(1,329)
1,586
Provisions recognized in the balance sheet at December 31, 2010
13,851 2,668 14,114 3,006 3,604 90 37,333

2011 FINANCIAL REPORT
66
CONSOLIDATED FINANCIAL STATEMENTS DECEMBER 31, 2011
Invested plan assets by type of investment
2011 2010
Amount % Amount %
Shares Bonds and other debt securitiesReal estate investmentsMoney market investmentsDiversified funds
19,6012,5174,7612,2517,527
53.47%6.87 %
12.99 %6.14 %
20.53 %
20,5923,124
4,6051,6737,772
54.53 %8.27 %
12.19 %4.43 %
20.58 %
Fair value of invested plan assets 36,657 100.00 % 37,766 100.00 %
Present value of defined benefit obligation
Dec. 31, 2011 Dec. 31, 2010
Present value of defined benefit obligationFair value of invested plan assets
81,428(36,656)
78,126(37,766)
Net liability 44,772 40,360
Sensitivity analysisThe present value of post-retirement benefits is sensitive to changes in the discount rate. The table below shows the effect of a 25 basis point decrease in discount rates on the present value of the defined benefit obligation:
2011
k€ % du DBO
FranceUnited KingdomGermanyJapanIndia
4473,044
10533
3
2.47 %5.34 %3.73 %3.77 %2.24 %
5.23. Current and non-current financial liabilities
Dec. 31, 2011 Dec. 31, 2010
Non current Current Total Non current Current Total
Bank loansFinance leasesOther financial liabilitiesAccrued interestDerivative instruments, liabilities Bank overdrafts
29,7446,3925,262
24,556770
13,232273
5,3411,120
54,3007,162
18,494273
5,3411,120
54,0537,162
8,266
25,619739
7,056846
2,4431,101
79,6727,901
15,322846
2,4431,101
Total financial liabilities 41,398 45,292 86,690 69,481 37,804 107,285
In financial year 2010, €2,480 thousand were reclassified from other current liabilities and trade payables to financial liabilities.

www.fivesgroup.com
67
Bank loans consist mainly of the loan for the acquisition of the North American sub-group in 2008 (€36.75 million at December 31, 2011) and loans to Fives Cinetic (€9.35 million, USD 7.6 million and GBP 1.94 million at December 31, 2011) from the bank syndicate led by the Royal Bank of Scotland (RBS). The early repayment clauses relating to these bank loans did not apply at December 31, 2011.Bank borrowings from RBS were contracted at floating interest rates. Fixed-for-floating interest rate swaps were set up in September 2011 to hedge the interest rate risk on the euro-denominated portion of the borrowings for the period from January 31, 2012 to January 31, 2013.In addition, when market conditions allow, the Group sets up basis swap transactions (floating-for-floating interest rate swaps) in order to benefit from banks’ arbitrage on the short-term yield curve. Interest payment periods are then selected in order to perfectly match the basis swap features (one month for the basis swap transactions at December 31, 2011).
Breakdown of fixed and floating rate financial liabilities (before hedging)
Dec. 31, 2011 Dec. 31, 2010
Fixed rate Floating rate Total Fixed rate Floating rate Total
Bank loansFinance leasesOther financial liabilitiesBank overdrafts
8
17,955273
54,2927,162539
54,3007,162
18,494273
290
10,998846
79,3827,9014,325
79,6727,901
15,323846
Total financial liabilities 18,236 61,993 80,229 12,134 91,608 103,742
Other financial liabilities mainly comprise a loan contracted by Fives from FL Investco and the loan denominated in American dollars granted by the vendors of Bronx International Inc.
Breakdown of financial liabilities per currency
Dec. 31, 2011 Dec. 31, 2010
Euros USD GBP Total Euros USD GBP Total
Bank loansFinance leasesOther financial liabilitiesBank overdrafts
46,1067,162
12,312169
5,875
6,18382
2,319
22
54,3007,162
18,494273
63,7867,901
6,342659
11,384
8,981150
4,502
37
79,6727,901
15,323846
Total financial liabilities 65,748 12,140 2,341 80,229 78,688 20,515 4,539 103,742
The bank loans denominated in American dollars and pounds sterling correspond to tranches A3 and A4 of the loan subscribed by Fives Cinetic from the bank syndicate led by the Royal Bank of Scotland.

2011 FINANCIAL REPORT
68
CONSOLIDATED FINANCIAL STATEMENTS DECEMBER 31, 2011
5.24. Other current and non-current liabilities
Other non-current liabilities
Dec. 31, 2011 Dec. 31, 2010
Other liabilitiesPrepaid income
426905
413950
Total 1,331 1,363
Other current liabilities
Dec. 31, 2011 Dec. 31, 2010
Tax and social security payablesAmounts due on acquisitions of fixed assetsPrepayments received on service contractsOther payablesPrepaid income
88,0313,49871,106
30,9805,955
71,2125,051
56,68117,2713,120
Total 199,570 153,334
For financial year 2010, -€1,458 thousand of trade payables were reclassified in other current liabilities.
5.25. Leases
Finance leasesProperty, plant and equipment held under finance leases comprised the following:
Dec. 31, 2011 Dec. 31, 2010
GrossAccumulated
depreciation & impairment
Net GrossAccumulated
depreciation & impairment
Net
Leasehold landLeasehold buildingsLeasehold plant, equipment and machinery
1,2609,647
668(2,767)
(395)
1,2606,880
273
1,2609,647
668(2,358)
(320)
1,2607,289
348
Total leaseholds 11,575 (3,162) 8,413 11,575 (2,678) 8,897
The schedule of future minimum lease payments is shown in the table below:
Dec. 31, 2011 Dec. 31, 2010
Less than one yearBetween one and five yearsMore than five years
7704,3302,062
7392,7944,368
Value of future minimum lease payments 7,162 7,901

www.fivesgroup.com
69
Operating leasesThe schedule of future minimum lease payments is shown in the table below:
Dec. 31, 2011 Dec. 31, 2010
Less than one yearBetween one and five yearsMore than five years
8,57816,391
3,142
7,75615,621
3,153
Value of future minimum lease payments 28,111 26,530
5.26. Financial risk management
Financial risk is managed in accordance with the risk management policy established by the Management Board. Each operating entity is responsible for identifying, assessing and hedging its exposure to financial risk.To manage its exposure to market risk, the Group uses derivative financial instruments, which are recognized in the balance sheet at their fair value.The fair value of derivative financial instruments at the reporting date comprised the following:
2011 2010
Assets Liabilities Assets Liabilities
Interest rate derivative instrumentsCash flow hedging derivative instrumentsDerivative instruments not eligible for hedge accounting
32 31305
22
20
Foreign exchange derivative instrumentsFair value hedging derivative instrumentsDerivative instruments not eligible for hedge accounting
4,12656
4,592413
6,0341,274
1,546877
Interest rate risk
Dec. 31, 2011 Dec. 31, 2010
Fixed rate Floating rate Total Fixed rate Floating rate Total
Gross debt before hedgingFixed rate swaps
18,236 61,993 80,229 12,13456,552
91,608(56,552)
103,742
Gross debt after hedging 18,236 61,993 80,229 68,686 35,056 103,742
The majority of the Group’s debt is comprised of bank loans bearing interest at floating rates. The Group uses fixed-for-floating swaps on a case-by-case basis to hedge interest rate risk. The bank loans were maintained at floating rates in 2011 after the January 31, 2011 repayment, due to the downward trend then sharp drop in interest rates over the financial year. A hedge was set up in September 2011 for the period from January 2012 to January 2013 (€30.6 million until July 2012 then €24.5 million as of August 2012).
Basis swaps (floating-for-floating interest rate swaps) are also used for hedging in order to reduce the overall cost of financial debt. The contractual streams of payments on both types of swaps are exchanged with the streams of interest payments on the hedged loans. The interest payment periods are then selected in order to perfectly match the basis swap features.

2011 FINANCIAL REPORT
70
CONSOLIDATED FINANCIAL STATEMENTS DECEMBER 31, 2011
All the fixed rate swaps in place qualify as cash flow hedges. The basis swaps also qualify as cash flow hedges to the extent of the amount hedged at fixed rates.The amount deferred in equity is recognized in earnings when the interest streams from the hedged loans affect earnings.As there were no fixed rate swaps effective for interest payment periods at December 31, 2011, changes in the fair value of the basis swaps were recognized directly in earnings, generating an expense of €303 thousand for the financial year. The expense mainly comprised accrued interest on the six-month Euribor leg of the basis swap in place at the reporting date.
The majority of cash and cash equivalents have been invested at floating interest rates (such as Eonia-indexed money market funds) or in fixed rate instruments such as short-term deposits or certificates of deposit with a maximum three-month maturity.
Analysis of interest rate sensitivityThe Group is exposed to the risk of interest rate fluctuations on its earnings due to:
cash flows relating to floating rate debt, after interest rate hedging instruments; cash flows relating to floating rate investments; changes in the fair value of derivative instruments that do not qualify as hedges.
Changes in the value of interest rate derivative instruments that qualify as cash flow hedges are recognized directly in equity and do not affect the income statement.
The following sensitivity analysis of 2012 earnings to interest rate risk was based on the following assumptions: The carrying amount of loans and borrowings at December 31, 2011 decreases at January 31, 2012, July 31, 2012 and January 31, 2013 reflecting the contractual repayments of the bank loan to the syndicate represented by the Royal Bank of Scotland; the Euribor reference rate is set at December 31, 2011 and applies to the semiannual interest rate resets at January 31 and July 31. The final payment at July 31, 2012 of the A3 tranche in American dollars and the A4 tranche in pounds sterling applies the rate set in January 2012. Therefore, there is no longer any interest rate sensitivity risk on the Libor borrowings denominated in American dollars and pounds sterling.
The fixed rate swaps only comprise those in place at December 31, 2011, which include the swaps covering financial year 2012 (€30.6 million from January 2012 to July 2012, then €24.5 million from July 2012 to January 2013).
The basis swaps only comprise those in place at December 31, 2011, which include the swaps effective for the period from January 31, 2012 to July 31, 2012 for €30.6 million.
Cash and cash equivalents, per currency and interest rate, remain constant year-on-year compared with December 31, 2011.
Sensitivity effect
+ 1% - 1%
Floating rate debtInterest rate hedging instrumentsFloating rate cash investmentsFair value of derivative instruments not eligible for hedge accounting
(231)104
1,497
231(104)(647)
Effect on profit for 2012 1,370 (520)
The sensitivity of earnings to interest rate risk mainly concerns the component “Floating rate cash investments”, as in terms of financial liabilities only the A2 tranche of the senior bank loan and the finance leases are exposed to interest rate risk.The interest rate sensitivity of the fair value of fixed rate swaps and basis swaps qualifying as cash flow hedges for financial year 2012 does not affect earnings.
Foreign exchange (currency) riskLoans and borrowings denominated in foreign currenciesLoans and borrowings are mainly issued in the functional currency of each company. There is no material foreign exchange risk related to foreign currency denominated loans.

www.fivesgroup.com
71
In addition, the Group financed the acquisition of the American companies in Euros, its reporting currency, either through equity (Fives Bronx Inc. in 2010), or partially through debt (Fives North American Inc. in 2008). The associated payments are refinanced by long-term loans denominated in American dollars contracted by the operating companies acquired.The Group uses derivative instruments to hedge the majority of the EUR/USD exchange risk generated by forecast cash flows relating to these loans for the financial year. The remaining nominal amount exposed to exchange rate risk, which was translated at the EUR/USD exchange rate effective at the reporting date for the purposes of the financial statements, amounted to USD 131.5 million net of hedges at December 31, 2011.
Exchange rate risk on operating profitThe Group is mainly exposed to exchange rate risk on its net sales positions arising from export contracts denominated in currencies other than the functional currency of the contracting companies.The main currency pairs subject to exchange rate risk are EUR/USD, GBP/EUR, GBP/USD and USD/CAD.The Group uses natural hedges to limit its exposure to exchange rate risk on operating profit by purchasing in the currency or currencies used for sales, on a contract by contract basis.Fives hedges the net residual exchange rate risk when the risks arise mainly though currency futures and/or by entering into insurance contracts with the French export credit insurance company (Compagnie française d’assurance pour le commerce extérieur – Coface) for its French subsidiaries.
Analysis of exchange rate sensitivityThis analysis excludes the effects of translating the financial statements of Group entities into the reporting currency (euro).The nominal value of the acquisition loans denominated in American dollars, after hedging, amounted to USD 131.5 million at December 31, 2011, which corresponds to €101.6 million after translation using the exchange rate effective at the reporting date. Total exposure in terms of principal and annual interest, net of hedges was USD 135.8 million in 2012, which corresponds to €104.9 million after translation using the exchange rate effective at December 31, 2011.
Exposure at December 31, 2011 of American dollar loans, estimated nominal amount and interest for 2012An increase of 10 basis points in the EUR/USD exchange rate would have a negative effect of €7.5 million on profit for 2012. A decrease of 10 basis points would increase profit by €8.8 million.
10 bp decrease Exchange rate 10 bp increase
Exchange rate at Dec. 31Net debt after hedging
1.1939 113,704
1.2939 104,916
1.3939 97,389
Effect on profit for 2012 8,788 (7,527)
Estimated exposure at December 31, 2011 of American dollar loan cash flows for 2012Expected cash flows relating to these loans for 2012 (semi-annual interest payments and repayment of principal) net of hedges amount to USD 10.2 million, which corresponds to €7.8 million after translation using the exchange rate effective at December 31, 2011. A 10 basis point increase or decrease in the EUR/USD exchange rate would decrease or increase cash flows for the year by -€0.6 million and +€0.7 million respectively.
10 bp decrease Exchange rate 10 bp increase
Exchange rate at Dec. 312012 cash flows after hedging
1.1939 8,505
1.2939 7,848
1.3939 7,285
Effect on profit for 2012 impacting cash flow 657 (563)
Foreign exchange risk on sales contracts is usually hedged by financial instruments that are eligible for fair value hedge accounting. The hedged items relating to such contracts are measured at the hedge coverage rates.

2011 FINANCIAL REPORT
72
CONSOLIDATED FINANCIAL STATEMENTS DECEMBER 31, 2011
Companies regularly measure the effectiveness of foreign exchange (currency) hedges in relation to changes in the underlying.Given the hedges recognized at December 31, 2011, the Group does not expect that a change in exchange rates will have a material impact on forecast earnings.
Liquidity riskFives closely monitors liquidity risk for the Group and each of its subsidiaries by the regular implementation of Group financial reporting procedures.The following analysis concerns the contractual obligations relating to loans and borrowings in terms of interest payable and Group commitments arising from the interest rate derivatives recognized under balance sheet assets and liabilities.Expected future cash flows are calculated on the basis of the remaining contractual maturities of the associated financial liabilities. Future interest payments at floating rates are set on the basis of the most recent coupon for the current period and on the basis of the rate set at the reporting date for cash flows relating to future dates.The future cash flows reported have not been discounted.
Balance sheet carrying amount
< 1 yearBetween 1 and 2 years
Between 2 and 3 years
Between 3 and 4 years
Between 4 and 5 years
> 5 years
Non-derivative financial instrumentsBank loansOther loans and borrowingsFinance leases
54,30018,494
7,162
24,55613,236
770
17,4943,349
640
12,250284679
465705
4432,306
7172,062
Total non-current loans and borrowings 79,956 38,562 21,483 13,213 1,170 2,749 2,779
Interest on non-current loans and borrowings 1,651 985 413 171 216 71
DerivativesFixed-for-floating rate swapsBasis swaps
(27)355
10
Interest rate hedging derivatives 328 10
Based on data available at the reporting date, future cash flows are not expected to occur earlier or the amounts to differ significantly from those indicated in the maturity schedule.This analysis excludes non-derivative financial assets recognized in the balance sheet, such as cash and cash equivalents and trade receivables, which amounted to €240 million and €185 million respectively at December 31, 2011.
Credit riskCredit risk is the risk that one party to a financial liability will cause a loss for the other party by failing to pay for its obligation. The Group is exposed to credit risk in its operating activities (mainly trade receivables) and financing activities due to the deposits, foreign exchange hedges and other financial instruments contracted with banks and financial institutions.
Risk relating to trade receivablesThe Group believes that there is limited risk that counterparty default could significantly affect its financial position and profit. Its counterparties generally have high credit ratings and sufficient financial capacity to meet their contractual obligations.In certain circumstances the Group uses insurance to cover 90% of counterparty risk on contracts.
Risk relating to other financial assetsThe Group uses derivatives to reduce its overall exposure to the foreign exchange risk and interest rate risk arising from its ordinary business activities. Derivative transactions are only entered into on organized markets or over-the-counter markets with leading operators, without counterparty risk.

www.fivesgroup.com
73
Risk relating to cash and cash equivalentsAt December 31, 2011 and December 31, 2010 cash and cash equivalents were invested through first rank banking counterparties.
5.27. Value of financial assets and liabilities, by category
The valuation methods used are described in the accounting principles. The Group has not identified any differences between the carrying amount and market value of balance sheet items, for all categories and levels of fair value.
The Group distinguishes three categories of financial instruments based on two fair value measurement methods (quoted prices and other valuation techniques):
Level 1: financial instruments with quoted prices traded in active markets; Level 2: financial instruments the fair value of which is determined based on valuation techniques using observable inputs; Level 3: financial instruments the fair value of which is determined using a valuation technique that is not based on or only partially based on observable market data (input based on assumptions and not on observable prices or other market data).
AFS investments and money market funds are classified as level one financial instruments and interest rate and exchange rate derivative instruments are classified as level two.
5.28. Off-balance sheet commitments
Guarantees and sureties
Dec. 31, 2011 Dec. 31, 2010
Commitments givenCommitments received
319,745110,033
260,08254,734
Guarantees and sureties refer to commitments given or received to finance contracts in progress and to the associated performance bonds.
PledgesTo secure the bank loan taken out on July 27, 2006 (principal and accrued interest at December 31, 2011 of €17.7 million), Fives Cinetic pledged the equity securities it holds in certain subsidiaries. Fives agreed to act as joint guarantor for all amounts owed by Fives Cinetic and pledged the shares it owns in Fives Cinetic to the bank syndicate as security.
To secure the bank loan taken out in July 2008 (amounting to €36.7 million including accrued interest at December 31, 2011) to acquire the North American businesses, Fives also pledged the note receivable it holds against Fives North American Combustion, Inc.

2011 FINANCIAL REPORT
74
CONSOLIDATED FINANCIAL STATEMENTS DECEMBER 31, 2011
5.29. Related parties
Related parties mainly comprise: Fives shareholders; joint ventures; unconsolidated entities; members of the Management Board.
There were no material transactions with related parties other than those described herein.
Remuneration of the executive officersIn 2011, the aggregate direct and indirect remuneration paid by Fives and its subsidiaries to the eleven members of the Group’s Executive Committee amounted to €3,822 thousand.No defined retirement benefits have been set up by any entity of the Group for members of the Executive Committee.
5.30. Auditors’ fees
Total fees charged by the statutory auditors of Fives and its subsidiaries for financial years 2011 and 2010, as presented in the consolidated financial statements, amounted to:
2011 2010
Statutory audit
Other work TotalStatutory
auditOther work Total
DeloitteErnst & YoungGrant Thornton
475638282
112289214
587927497
444597175
139209
66
583806240
Total 1,395 615 2,010 1,215 414 1,629
5.31. Subsequent events
No events occurred between the reporting date and the approval date that could have a significant impact on the consolidated financial statements for financial year 2011.

www.fivesgroup.com
75
5.32. List of consolidated companies at December 31, 2011
Consolidated Companies LocationConsolidation
MethodVoting Rights
Owner-ship
Fives * Paris, France Parent Company
AUTOMOTIVE/LOGISTICS
Fives Cinetic * Paris, France FC 99.99 99.99
Cinetic Assembly * Montévrain, France FC 99.99 99.99
Cinetic Automation * Héricourt, France FC 99.96 99.96
Cinetic Automation Corp. United States FC 100.00 99.99
Cinetic Decker Filling K.K. Japan FC 100.00 99.99
Cinetic DyAG Corp. United States FC 100.00 99.99
Cinetic Filling * Le Bignon, France FC 99.99 99.99
Cinetic Giustina S.r.l. Italy FC 100.00 99.99
Cinetic Landis Corp. United States FC 100.00 99.99
Cinetic Landis Ltd. United Kingdom FC 100.00 99.99
Cinetic Machining * Saint-Laurent-les-Tours, France FC 99.99 99.99
Cinetic Service * Montévrain, France FC 100.00 99.99
Cinetic Conveying Iberica Spain FC 100.00 99.99
Cinetic Service Slovakia s.r.o. Slovakia FC 100.00 99.99
Cinetic Sorting Corp. United States FC 100.00 99.99
Cinetic Sorting K.K. Japan FC 100.00 99.99
Cinetic Sorting S.p.a. Italy FC 100.00 99.99
Cinetic Transitique * Grigny, France FC 99.98 99.98
Fives Cinetic S.r.l. Italy FC 100.00 99.99
Fives Inc. United States FC 100.00 99.99
CEMENT
Fives FCB * Villeneuve d’Ascq, France FC 99.99 99.99
Cementos Plantas Construcciones SA de C.V. Mexico FC 99.90 99.90
Cement Process Technologies Egypt Egypt FC 99.00 99.00
Fives Pillard Marseille, France FC 85.18 85.18
Fives Pillard España S.A. Spain FC 67.00 57.07
Fives Pillard (Tianjin) International Trading Co., Ltd. China FC 100.00 85.18
Pillard Feuerungen GmbH Germany FC 47.50 40.46
ENERGY/SUGAR
Fives Cail * Villeneuve d’Ascq, France FC 99.99 99.99
Fives Cail KCP Ltd. India PC 50.00 40.00
Fives Fletcher Ltd. United Kingdom FC 100.00 99.99
Fives Lille do Brasil Ltda. Brazil FC 100.00 99.99
Fletcher Smith Inc. United States FC 100.00 99.99
Fives Energie * Paris, France FC 100.00 100.00
Fives North American Combustion France, SAS * Marseille, France FC 100.00 100.00
Fives North American Combustion Netherlands B.V. Netherlands FC 100.00 100.00
Fives North American Combustion UK, Ltd. United Kingdom FC 100.00 100.00
North American Combustion Holdings, Ltd. United Kingdom FC 100.00 100.00
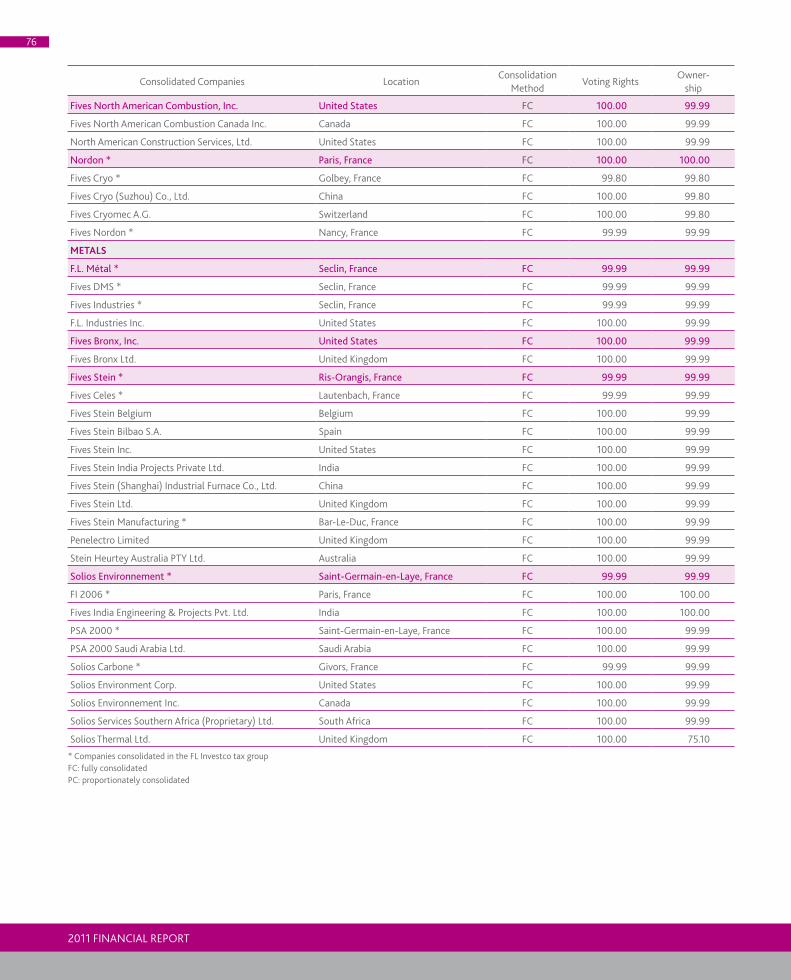
2011 FINANCIAL REPORT
76
Consolidated Companies LocationConsolidation
MethodVoting Rights
Owner-ship
Fives North American Combustion, Inc. United States FC 100.00 99.99
Fives North American Combustion Canada Inc. Canada FC 100.00 99.99
North American Construction Services, Ltd. United States FC 100.00 99.99
Nordon * Paris, France FC 100.00 100.00
Fives Cryo * Golbey, France FC 99.80 99.80
Fives Cryo (Suzhou) Co., Ltd. China FC 100.00 99.80
Fives Cryomec A.G. Switzerland FC 100.00 99.80
Fives Nordon * Nancy, France FC 99.99 99.99
METALS
F.L. Métal * Seclin, France FC 99.99 99.99
Fives DMS * Seclin, France FC 99.99 99.99
Fives Industries * Seclin, France FC 99.99 99.99
F.L. Industries Inc. United States FC 100.00 99.99
Fives Bronx, Inc. United States FC 100.00 99.99
Fives Bronx Ltd. United Kingdom FC 100.00 99.99
Fives Stein * Ris-Orangis, France FC 99.99 99.99
Fives Celes * Lautenbach, France FC 99.99 99.99
Fives Stein Belgium Belgium FC 100.00 99.99
Fives Stein Bilbao S.A. Spain FC 100.00 99.99
Fives Stein Inc. United States FC 100.00 99.99
Fives Stein India Projects Private Ltd. India FC 100.00 99.99
Fives Stein (Shanghai) Industrial Furnace Co., Ltd. China FC 100.00 99.99
Fives Stein Ltd. United Kingdom FC 100.00 99.99
Fives Stein Manufacturing * Bar-Le-Duc, France FC 100.00 99.99
Penelectro Limited United Kingdom FC 100.00 99.99
Stein Heurtey Australia PTY Ltd. Australia FC 100.00 99.99
Solios Environnement * Saint-Germain-en-Laye, France FC 99.99 99.99
FI 2006 * Paris, France FC 100.00 100.00
Fives India Engineering & Projects Pvt. Ltd. India FC 100.00 100.00
PSA 2000 * Saint-Germain-en-Laye, France FC 100.00 99.99
PSA 2000 Saudi Arabia Ltd. Saudi Arabia FC 100.00 99.99
Solios Carbone * Givors, France FC 99.99 99.99
Solios Environment Corp. United States FC 100.00 99.99
Solios Environnement Inc. Canada FC 100.00 99.99
Solios Services Southern Africa (Proprietary) Ltd. South Africa FC 100.00 99.99
Solios Thermal Ltd. United Kingdom FC 100.00 75.10
* Companies consolidated in the FL Investco tax group FC: fully consolidatedPC: proportionately consolidated
www.fivesgroup.com
77
Statutory Auditors’ Report - Consolidated financial statements Year Ended December 31, 2011
To the Shareholders,
In compliance with the appointment entrusted to us by your annual general meeting, we hereby report to you, for the year ended 31 December 2011, on:
the audit of the accompanying consolidated financial statements of FIVES ; the justification of our assessments; the specific verification required by law.
These consolidated financial statements have been approved by the Executive Board. Our role is to express an opinion on these consolidated financial statements based on our audit.
I. Opinion on the consolidated financial statementsWe conducted our audit in accordance with professional standards applicable in France; those standards require that we plan and perform the audit to obtain reasonable assurance about whether the consolidated financial statements are free of material misstatement. An audit includes examining, using sampling techniques or other methods of selection, evidence supporting the amounts and disclosures in the consolidated financial statements. An audit also includes evaluating the appropriateness of accounting policies used and the reasonableness of accounting estimates made, as well as the overall presentation of the consolidated financial statements. We believe that the audit evidence we have obtained is sufficient and appropriate to provide a basis for our opinion.In our opinion, the consolidated financial statements give a true and fair view of the assets and liabilities and of the financial position of the Group as at 31 December 2011 and of the results of its operations for the year then ended in accordance with International Financial Reporting Standards as adopted by the European Union.
II. Justification of our assessmentsIn accordance with the requirements of article L.823-9 of the French Commercial Code (Code de commerce) relating to the justification of our assessments, we bring to your attention the following matters:
Goodwill is tested using the method described in the notes 2.6 and 2.14 to the consolidated financial statements. We have examined the implementation of this impairment test, the estimation of the future cash flows and the assumptions made, and we have ensured that notes 2.6 and 2.14 to the consolidated financial statements provide adequate information in this regard.
Income or losses on long-term contracts are recognized using to the percentage of completion method, based on the estimated costs at completion, that are reviewed periodically and regularly throughout the life of the contract following to the principles detailed in notes 2.6 and 2.16 to the consolidated financial statements. These estimates are made project by project under the supervision of the companies’ general management. Based on the information we received, our work consisted in reviewing the processes set up, assessing the data and assumptions used as a basis for these estimates and comparing the accounting estimates of the previous periods with corresponding actual figures.
Deferred tax assets are recognized when mid-term forecasts ensure the reasonableness of recoverability as indicated in notes 2.6 and 2.22 to the consolidated financial statements. We have examined the financial forecasts and the assumptions used, and we have ensured that notes 2.6 and 2.22 to the financial statements provide adequate information in this regard.
These assessments were made as part of our audit of the consolidated financial statements taken as a whole, and therefore contributed to the opinion we formed which is expressed in the first part of this report.
III. Specific verificationAs required by law we have also verified, in accordance with professional standards applicable in France, the information presented in the group's management report.We have no matters to report as to its fair presentation and its consistency with the consolidated financial statements.
Neuilly-sur-Seine and Paris - La Défense, March 29, 2012
ERNST & YOUNG AUDIT1-2 place des Saisons - 92400 Courbevoie - Paris-La Défense 1
SAS (French simplified joint stock company) with variable capital
Statutory Auditors and Member of the Compagnie Régional de Versailles
DELOITTE & ASSOCIÉS185 avenue Charles-de-Gaulle - 92524 Neuilly-sur-Seine Cedex
SA (French limited liability company) capitalized at €1,723,040
Statutory Auditors and Member of the Compagnie Régional de Versailles
The Statutory auditorsERNST & YOUNG AUDITMarc Stoessel
DELOITTE & ASSOCIÉSPascal Colin

2011 FINANCIAL REPORT
78

www.fivesgroup.com
79
Draft resolutions (extract) 80
ORDINARY ANNUAL GENERAL MEETING OF JUNE 27, 2012

2011 FINANCIAL REPORT
80
ORDINARY ANNUAL GENERAL MEETING OF JUNE 27, 2012
FIRST RESOLUTION
The General Meeting,
having heard the reports of the Executive Board and the Supervisory Board as well as the Statutory Auditor’s general report;
and after reviewing the company financial statements;
approves the company’s financial statements for the year ended December 31, 2011 as presented to the Meeting and the transactions reflected in such financial statements or described in the reports and which show a net profit of €61,639,189.46.
The General Meeting also approves the non tax-deductible expenses and costs amounting to €36,531.
SECOND RESOLUTION
The General Meeting, acting on a proposal from the Executive Board, resolves to allocate the period’s profit of €61,639,189.46 as follows:
to the legal reserve € 3,081,959.47 the balance to retained earnings € 58,557,229.99
Total € 61,639,189.46
The General Meeting notes that the dividends paid in respect of the previous three years were as follows:
Year Number of shareDividendper share
Total dividend paid
2008 2,166,108 (*) 9.15 € 19,998,349.80 €
2009 2,185,612 - -
2010 2,185,612 - -
(*) excluding own shares
In addition, it is to be noted that the combined general meeting of shareholders held on December 15, 2011 resolved to distribute an extraordinary dividend of €98,352,540 or €45 per share.
THIRD RESOLUTION
The General Meeting,
having heard the reports of the Executive Board and the Supervisory Board as well as the Statutory Auditors’ report on the consolidated financial statements for the year ended December 31, 2011;
and after reviewing the consolidated financial statements;
approves the consolidated financial statements for the year ended December 31, 2011 as presented to the meeting and the transactions reflected in such financial statements or described in the reports, showing net profit, Group share of €40,419 thousand.
FOURTH RESOLUTION
Having heard the Statutory Auditors’ special report on regulated agreements governed by Article L. 225-86 of the French commercial code, the General Meeting approves the report and the agreements referred to in the report.
FIFTH RESOLUTION
The General Meeting renews the appointments of the following Supervisory Board members for a period of six years; that period ending on completion of the Ordinary Annual General Meeting convened to approve the financial statements for the 2017 financial year:
James ARNELL, Fabrice GEORGET, Stéphane ETROY, Vincent PAUTET.
Draft resolutions (extract)

www.fivesgroup.com
81
SIXTH RESOLUTION
The General Meeting:
reappoints DELOITTE & ASSOCIES as statutory auditors appoints ERNST & YOUNG ET AUTRES, whose registered office is Paris La Défense 1, 1-2 place des Saisons, 92400 Courbevoie, registered in the Nanterre companies register under number 438 476 913, as new statutory auditors in place of Ernst & Young Audit
reappoints AUDITEX as substitute statutory auditors reappoints BEAS as substitute statutory auditors
for a period of six years; that period ending on completion of the Ordinary Annual General Meeting convened to approve the financial statements for the 2017 financial year.
SEVENTH RESOLUTION
On the basis of the preceding resolutions, the General Meeting fully and unreservedly discharges the Members of the Executive Board from their management duties in respect of the financial year ended December 31, 2011, and the members of the Supervisory Board in respect of their appointments and duties.

FivesFrench limited company (Société Anonyme)with Executive Board and Supervisory BoardShare capital €102,723,764Registered office: 27-29 rue de Provence, 75009 Paris (France)Tel: +33 (0)1 45 23 75 75 - Fax: +33 (0)1 45 23 75 71E-mail: [email protected]
542 023 841 R.C.S. PARIS - APE 7010Z
Edited by the Communication Department of Fives
Fotography : Fives, Le SquareCopyright © 2012 - Fives - All rights reserved
This document is printed on condat silk, certified PEFC (Programme for the Endorsement of Forest Certification) paper, guaranteeing the long-lasting management of forests.Inks used are plant-based, with an alcohol-free dampening solution.