detecting and assessing desertification using...
TRANSCRIPT

Arekhi and komaki / Environmental Resources Research 3, 2 (2015) 121
Environmental Resources Research Vol. 3, No. 2, 2015
GUASNR
Detecting and Assessing Desertification using Landscape Metrics in GIS Environment (Case Study: Ain-e-khosh
Region, Iran)
S. Arekhi*1, B. Komaki2
1Department of Geography, Human Sciences College, Golestan University, Gorgan, Iran 2Department of Arid Zone management, Faculty of Rangeland and Watershed , Gorgan University of Agricultural Sciences and Natural Resources (GUASNR), Gorgan, Iran
Received: February 2014 ; Accepted: December 2014
Abstract
In Iran, desertification and landscape fragmentation are occurring as a result of demographic pressure, agricultural expansion, government policies and environmental factors such as drought. In this study, land use/cover and landscape change dynamics were investigated using satellite remote sensing (RS) and geographical information system (GIS). Landscape metrics were derived from land use/cover maps of the years 1977 and 2007 to indicate desertification in the study area, Ain-e-khosh region, Iran. Using Ain-e-khosh region as a case, this study aims to test landscape metrics capability in indicating desertification and analyzing temporal fragmentation changes. The temporal change analysis of fragmentation provides detailed characterization of desertification processes. Poor rangeland and barren land areas have become more fragmented and are characterized by the proliferation of much smaller and less connected patches. Results show a decrease in poor rangeland with an increase of agricultural land and sand plate areas. This suggests that anthropogenic activities driven by agricultural expansion are among the main causes of landscape fragmentation, leading to landscape degradation in the study area. This study demonstrates effectiveness of the RS and the GIS in detecting, assessing, mapping, monitoring and generating essential quantitative information on desertification. Keywords: Land use/cover types, Desertification, Landscape metrics, Ain-e-khosh desert, Ilam province, Iran1
*Corresponding author; [email protected]

122 Arekhi and komaki / Environmental Resources Research 3, 2 (2015)
1. Introduction Land use/cover change is a dynamic, widespread and accelerating process,
mainly driven by natural phenomena and anthropogenic activities, which in turn causes changes that impact humans (Agarwal et al., 2002; Liu et al., 2003). The rapid land use/cover change, unprecedented in human history especially in developing countries, is continuously transforming landscapes, thereby threatening global sustainability and livelihood systems (Singh et al., 2001). Iran, like many other countries, in the arid and semi-arid region is exposed to environmental degradation problems, especially in the center, south and western parts (UNEP, 2001). Some of the main causes of environmental degradation in Iran are overgrazing, misuse of the plant coverage, and sand dune formation. The movable sand dunes have direct effects on the infrastructure such as highways, railways, irrigation canals, agricultural soils, soil erosion, sand storms, as well as the direct negative effect on the environment and human health (FRWO1, 2004). The continuous use of unsustainable practices has caused a further soil and plant deterioration. Estimates show that 85% of the total land in Iran is under arid and semi-arid conditions and 20% of this land is subject to desertification (FRWO, 2004). Of major concern is landscape fragmentation due to desertification. Desertification-land degradation in arid, semi-arid and dry sub-humid areas is becoming one of the world’s more serious environmental problems (Glenn et al., 1998). Nowadays, desertification has already become one of the world’s most serious environmental problems and its assessment represents an instrumental component in developing global and regional action plans aiming at preventing and/or eradicating this environmental threat.
The Ain-e-khosh desert in Ilam Province has become one of Iran’s more severely desertified ecological regions since few decades ago and represents a serious source of sandstorms that increasingly plague the western part of the country. Desertification in Ain-e-khosh area is principally driven by intensification of agricultural activities and misuse of natural resources, which cause deficiency of surface water resources in the region (FRWO, 2004).
Earth observation satellites provide valuable data for studies of landscape changes since they provide synoptic and repetitive observations, capture information on a broad range of the electromagnetic spectrum, and are available since 1970s, and their ease of access low cost (Millette et al., 1995; Poudel, 2008; Wundram and Löffler, 2008).Therefore, using remote sensing for monitoring changes in desert landscapes may provide a way to identify landscape changes (Bayarsaikhan et al., 2009; Weiss and Walsh, 2009). Monitoring approaches of the Iranian desert landscapes are yet scarce and few studies cover similar landscapes in Iran.
1. Forest, Range, and Watershed Management Organization

Arekhi and komaki / Environmental Resources Research 3, 2 (2015) 123
Landscape ecology considers vegetation as a mosaic of patches with unique landform, species composition and disturbance gradient (Ravan et al., 1998). Johst and Huth (2005) such that succession after disturbance generates a mosaic of patches in different successional stages. However, the effects of disturbance on patches may show up in the form of increase distance from other patches and their connectivity. Spatial and temporal understanding of a landscape is required to aid research and management of these characteristic patches. In characterizing a landscape to identify disturbance, GIS has proven effective in landscape ecology by mapping disturbance zones in ecosystems, quantifying their impact on biodiversity and detecting land cover changes over a period of time. The landscape metrics, based on the geometric properties of the landscape elements, are indicators that are widely used to measure several aspects of the landscape structure and spatial pattern, and their variation in space and time (Li et al., 2005). These metrics have been used in landscape monitoring, including landscape changes (Lausch and Herzog, 2002; Peng et al., 2010; Petrov and Sugumaran, 2009; Rocchini et al., 2006), assessing impacts of management decisions and human activities (Geri et al., 2010; Lin et al., 2010; Narumalani et al., 2004; Proulx and Fahrig, 2010), supporting decisions on landscape and conservation planning (Leitão and Ahern, 2002; Sundell-Turner and Rodewald, 2008), and analyzing landscape and habitat fragmentation (Hargis et al., 1998; Zeng and Wu, 2005). Landscape metrics derived from land use and land cover maps have been used to quantify environmental change in arid and semi-arid regions (Kepner et al., 2000; Jia et al., 2004). Spatial heterogeneity has been shown to be one of the most reliable indicators of desertification (Schlesinger et al., 1990). In this research, landscape metrics and spatial heterogeneity indicators are combined to model desertification changes in Ain-e-khosh region, Iran.
Landscape metrics are mainly applied to categorical/ thematic maps, such as maps of land use, land cover or vegetation, which can be derived from historical maps, aerial photographs and remote sensing data. The digital nature of the information of land cover obtained from satellite imagery enables the derivation of a potentially large number of metrics, which is advantageous (Haines-Young and Chopping, 1996). The landscape structure and spatial pattern can be analyzed through composition and configuration (Leitão and Ahern, 2002; Leitão et al., 2006). Metrics related to composition, measure landscape features like proportion, richness, evenness or dominance of different patch types or classes; metrics relative to configuration consider spatial attributes related to geometry, distribution and spatial relationships of different patches in the landscape (Gustafson, 1998; Leitão and Ahern, 2002). A great variety of landscape metrics have been developed in the past decades (Gustafson, 1998; McGarigal and Marks, 1995). Thus the selection of the appropriate metrics and their interpretation should be performed carefully to avoid redundancy (Cushman et al., 2008; Leitão et al., 2006; Uuemaa et al., 2009).

124 Arekhi and komaki / Environmental Resources Research 3, 2 (2015)
The objective of the present study is to detect, characterize, and quantify the changes in terms of land use/ cover and landscape in an area subjective to desertification in the Ain-e-khosh region, Iran. In the present study, remote sensing techniques are applied in order to analyze land cover change from 1977 to 2007 using Landsat MSS (1977) / ETM+ (2007) images interpretation and to assess landscape structure change through FRAGSTATS software as a spatial pattern analysis program (McGarigal et al., 2002a). 2. Materials and methods 2.1. Study Area characteristics
The study area is located in the Ain-e-khosh region, Province of Ilam, West of Iran (47º 64’ - 48º 03’ E and 32º 14’- 32º 46’ N) (Figure 1), where most precipitation falls between January and February. The mean annual rainfall is about 272 mm with a high inter-annual variability. In this desert environment, the hottest and coldest months are July and January, respectively, with mean annual temperature of 25.6°C. The wind is dry and generally cold and strong, blowing at great velocities sometimes reaching more than 108 km/h (Zehtabian, 2008). The area covers about 77646.85 hectares.
Figure 1. Location of the study area

Arekhi and komaki / Environmental Resources Research 3, 2 (2015) 125
2.2. Data sources and Methodology Three data sources are considered in this study, namely, remotely sensing
images, topographic, and ancillary data. The topographic map has a scale of 1:50,000. Three types of ancillary data are used including aerial photographs (1/20,000) provided by national cartographic center, a vegetation map at a scale of 1:250,000 and a current land use map (1:10,000) supplied by FRWO (2004). The analysis of spatio-temporal changes in Ain-e-khosh landscape is based on two land use/cover maps derived from the implementation of a supervised classification over two satellite images, which are selected within the Landsat historical archive: Landsat MSS of March 12th, 1977 and Landsat ETM+ of April 6th, 2007 (path 179/ row 38). The dates of these two images are chosen to be as close as possible to the same vegetative season. The Landsat ETM+ (2007) image has a spatial resolution of 30 m, but the Landsat MSS (1977) image has a spatial resolution of 57 m. Hence, the spatial resolution of the MSS images was converted to 30 m using the nearest neighbor resampling algorithm (Richards and Jia, 2006). This downscaling procedure provided for comparability among the images, but did not increase details. All visible and infrared bands (except the thermal infrared band of ETM+) were employed in image classification. The 1:25,000 digital topographic maps of the national cartographic center of Iran were used for geo-referencing of the two images.
The satellite image pre-processing and analysis was completed using Idrisi Andes version 15.0 software. The same software was also used for generating change maps. ArcGIS version 9.2 provided by ESRI was used for visual interpretation, map preparation, and analysis. FRAGSTASTS version 3.3 (McGarigal et al., 2002b) was employed for calculating the selected landscape metrics.
Based on the main land use/ cover types of the region, four land cover classes including agricultural land, poor range land, barren land and sand plate types were identified. The supervised classification was performed using a maximum likelihood algorithm (Richards and Jia, 2006). To support the classification procedure, training areas were selected per class in each satellite image. These areas were identified over pixels of well-known land use/ cover to provide a reference spectral signature per class. The selection of training areas per image allowed minimizing the impact of the differences at the time of acquisition of the two Landsat images. A mode filter 3*3 was applied to the classification-derived maps to reduce the effect of noise pixels produced by the classification procedure. The training and testing data for the supervised classification and accuracy assessment were collected using false color composite, aerial photographs (1/20,000) and fieldwork approximating to a random sampling. The data samples were then split into two subsets as the training data (2.19% of total area ) and the test data (2.11% of total area).

126 Arekhi and komaki / Environmental Resources Research 3, 2 (2015)
Following the classification of the 1977 and 2007 images, a post-classification comparison change detection algorithm was applied to determine changes in land use/cover between 1977 and 2007. Post classification comparison proved to be the most effective approach for change detection, because each data is separately classified, thereby minimizing the problem of normalizing for atmospheric and sensor differences between the two dates (Jensen, 2005). The post classification approach provides ‘‘from–to’’ change information, and the kind of land use transformations that have occurred can be easily calculated. 2.3. Landscape metrics
Selected landscape metrics were used to characterize the spatial heterogeneity, fragmentation and complexity of the landscape. The software FRAGSTATS version 3.3 (McGarigal and Marks, 1995) was used to extract the landscape metrics from each land use map of 1977 and 2007. FRAGSTATS computes metrics for each patch in the landscape mosaic (patch), each patch type (class) in the mosaic, and for the landscape mosaic as a whole (landscape). The metrics are selected from those available in the software FRAGSTATS.
In order to simplify interpretation, the following metrics were considered (Forman, 1995; Riitters et al., 1995; Griffith et al., 2000):
(A) Class area (CA): It represents the total area per patch, class or landscape. (B) Percentages of landscape (PLAND): It is equal to the percentage of the
patch type in the landscape. The metric of PLAND provides a general representation of landscape composition, specifically how much of the landscape comprises a particular patch type in the study area.
(C) Number of patches (NP): It corresponds to the number of patches per class or landscape. It is also a measure of landscape configuration that indicates the level of subdivision of each class or landscape.
(D) Mean patch size (MPS): This is a quantity that represents the average size of patches from a specific class. Like the NP, this metric also measures the subdivision of the class or landscape.
(E) Total edge (TE): It is equivalent to the sum of length of all edge segments for the class.
(F) Edge density (ED): This is the sum of edge segment lengths for the class divided by total landscape area.
(G) Mean shape index (MSI): This equals to the sum of the patch perimeter (m) divided by the square root of patch area (m2) for each patch of the corresponding patch type, which is divided by the number of the same patch types. Furthermore, it quantifies the geometric complexity of the shapes at several landscape levels. The highest values of the index represent the greater complexity of the landscape.

Arekhi and komaki / Environmental Resources Research 3, 2 (2015) 127
(H) Area weighted mean shape index (AWMSI): It equals to the sum across all patches of the corresponding patch type, of each patch perimeter (m) divided by the square root of patch area (m2), multiplied by the patch area (m2), divided by total class area. AWMSI quantifies the geometric complexity of the shapes at several landscape levels. The highest values of the index represent the greater complexity of the landscape.
(I) Mean perimeter fractal dimension (MPFD): This metric measures the shape complexity and its values range from 1 to 2, where 1 represents patches with simple perimeters like squares and it approaches 2 when patch shapes become more convoluted.
(J) Mean proximity index (MPI): Average proximity index for all patches in a class. Proximity index is calculated as the sum of the ratio of patch size to nearest neighbor edge-to-edge distance for all patches within a specified search radius. MPI is expected to decrease over time as patches become smaller and more isolated.
(K) Contagion and interspersion metrics (IJI): It is a measure of class aggregation of patches. IJI approaches 0 when the distribution of adjacencies among unique patch types becomes increasingly uneven. IJI=100 when all patch types are equally adjacent to all other patch types.
(L) Shannon’s diversity index (SHDI): It is a measure of configuration that quantifies the distribution of area among patch types according to the following formula:
s SHDI = ∑ - (Pi * ln Pi) i=1
Pi = fraction of the entire population made up of species i S = numbers of species encountered ∑ = sum from species 1 to species S (M) Shannon’s evenness index (SHEI): It is a measure of evenness of patch
types and dominance which is calculated using the following formula:
Pi = proportion of the landscape occupied by patch type (class) i. m = number of patch types (classes) present in the landscape, excluding the
landscape border if present. Comparison of some metrics computed from classified maps derived from
Landsat MSS downscaled to 30-30 m and Landsat ETM+ poses some problems concerning the spatial scaling effect. This effect is particularly sensitive for metrics related with fragmentation, like NP, MPS (García-Gigorro and Saura, 2005; Wu, 2004). Several authors refer to the use of scaling laws to predict metrics values at multiple scales and provide ways to overcome this problem (Saura and Castro,

128 Arekhi and komaki / Environmental Resources Research 3, 2 (2015)
2007; Wu, 2004). Herein, we found little would be gained by their use because the value of a metric in a certain spatial resolution could only be obtained by computing the scaling laws fitting on aggregated data (since fine scale maps are not available for 1977), which would imply the increasing of errors. Therefore, the interpretation of the metrics results was implemented carefully in terms of fragmentation for 1977 data and their comparability with data from 2007.
3. Results 3.1. Classification results
The land use maps for 1977 and 2007 are presented in Figures 2 and 3, and the change in area of the two land use classes during one interval are shown in Table 1 and Figure 4. Once the classification of each image is performed, and the land use/cover maps for each period of study are obtained, then the first step is to quantify each land use/cover class extension over the total area (Table 1). Results show that most of the landscape in Ain-e-khosh is occupied by poor rangeland, averaging 65.3% of the area and the vegetation is typically associated with the grazing common lands. In the period 1977 to 2007, the vegetation classes with greater changes in area were agriculture (+20.1%) and poor rangeland (-21%) (Table 1). Classes related with barren land and sand plates showed a little decrease and increase (-1.8 and +2.8), respectively. Agricultural lands are likely to have increased from areas of poor rangeland and barren land. Such an increase in the agricultural area between 1977 and 2007 relates to the observed increase in population and dam construction in the study area. Between 1977 and 2007, sand plates showed an increase of 2.8 %. In other words, poor rangeland is largely the dominant land use/cover type in the study area in both periods, followed by barren land, agriculture, and sand plates.
Figure 2. Land use/ cover classification map of study area,
using Landsat MSS 1977.

Arekhi and komaki / Environmental Resources Research 3, 2 (2015) 129
Figure 3. Land use/ cover classification map of study area, using Landsat ETM+ 2007.
Table 1.Area and percentage of change in different land use/cover classes of 1977 and 2007.
Year Class
1977 (area in ha) Percentage (%) 2007
(area in ha) Percentage (%) 1977-2007 Difference (%)
Agriculture 2616.77 3.3 18157.49 23.4 +20.1 Poor range land 58866.57 75.8 42578.68 54.8 -21 Barren land 14466.85 18.6 13112.19 16.8 -1.8 Sand plates 1696.66 2.1 3798.49 4.9 +2.8 Total 77646.85 100 77646.85 100 0
Figure 4. Areas of land use/ cover classes of the Ain-e-khosh region
130 Arekhi and komaki / Environmental Resources Research 3, 2 (2015)
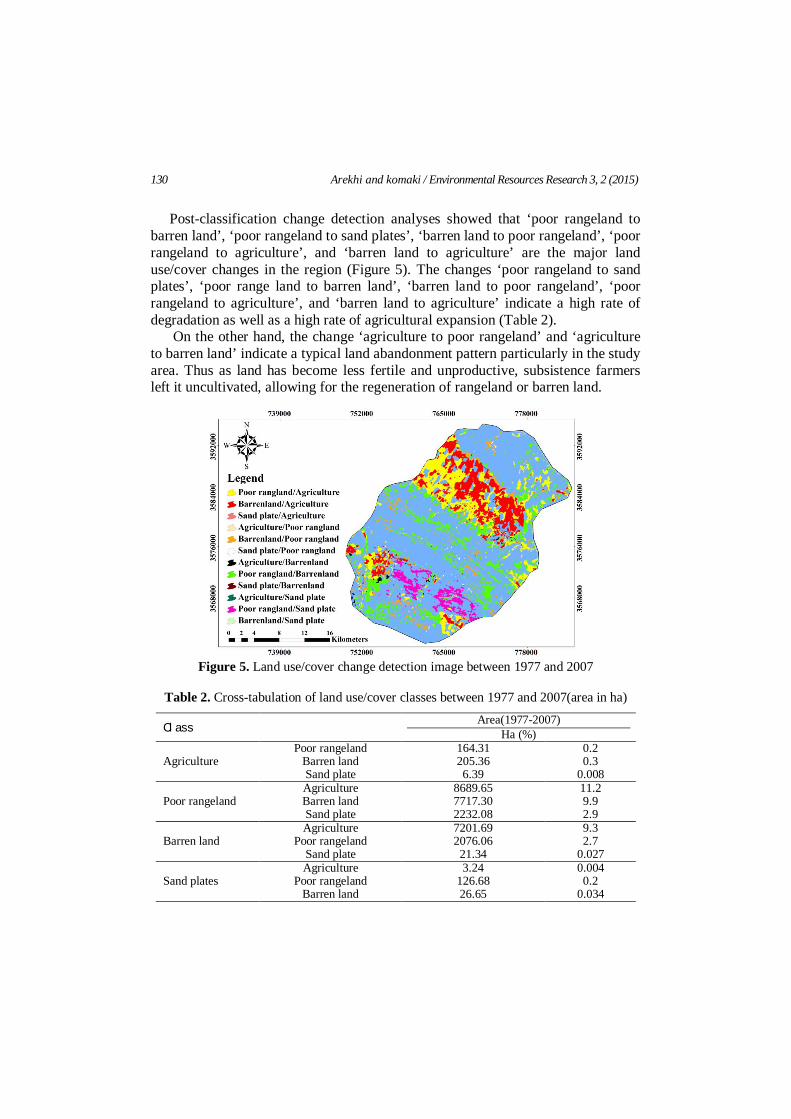
Post-classification change detection analyses showed that ‘poor rangeland to barren land’, ‘poor rangeland to sand plates’, ‘barren land to poor rangeland’, ‘poor rangeland to agriculture’, and ‘barren land to agriculture’ are the major land use/cover changes in the region (Figure 5). The changes ‘poor rangeland to sand plates’, ‘poor range land to barren land’, ‘barren land to poor rangeland’, ‘poor rangeland to agriculture’, and ‘barren land to agriculture’ indicate a high rate of degradation as well as a high rate of agricultural expansion (Table 2).
On the other hand, the change ‘agriculture to poor rangeland’ and ‘agriculture to barren land’ indicate a typical land abandonment pattern particularly in the study area. Thus as land has become less fertile and unproductive, subsistence farmers left it uncultivated, allowing for the regeneration of rangeland or barren land.
Figure 5. Land use/cover change detection image between 1977 and 2007
Table 2. Cross-tabulation of land use/cover classes between 1977 and 2007(area in ha)
Class Area(1977-2007) Ha (%)
Agriculture Poor rangeland
Barren land Sand plate
164.31 205.36 6.39
0.2 0.3
0.008
Poor rangeland Agriculture Barren land Sand plate
8689.65 7717.30 2232.08
11.2 9.9 2.9
Barren land Agriculture
Poor rangeland Sand plate
7201.69 2076.06
21.34
9.3 2.7
0.027
Sand plates Agriculture
Poor rangeland Barren land
3.24 126.68 26.65
0.004 0.2
0.034
Arekhi and komaki / Environmental Resources Research 3, 2 (2015) 131
Error matrices used to assess classification accuracy are summarized for both periods in Table 3. For the 1977 land use map, accuracy assessment result shows an overall accuracy of 86.92% and a kappa coefficient of agreement of 0.84 (Table 3). According to Landis and Koch (1977) all land use classes are accurately classified. In terms of producer’s accuracy or user’s accuracy, all classes are above 80%. For all land use classes, the conditional kappa coefficients of agreement exceeded 0.84.
For the 2007 land use map, accuracy assessment result indicates an overall classification accuracy of 83.41% and a kappa coefficient of agreement of 0.91 (Table 3). The classification result is accurate and acceptable (Landis and Koch 1977). When examining the producer’s accuracies, all land use classes appear above 78.23. In terms of the user’s accuracy each class exhibit above 77.27. On the other hand, the conditional kappa statistics for each land use class exceeds 0.81. Differences in areas between 1977 and 2007 are affected by classification errors, but the classification overall accuracy is larger than 80% for both images, which is acceptable for highly fragmented landscapes (Bayarsaikhan et al., 2009; Millette et al., 1995). Table 3. Accuracy statistics for the classification results
Year Class
MSS-1975 ETM+-2007 Producer's accuracy User' accuracy Producer's
accuracy User' accuracy
Agriculture 88.54 90.35 85.75 84.44 Poor rangeland 82.09 84.22 80.70 83.67 Barren land 86.43 83.34 82.82 81.89 Sand plate 82.10 80.10 78.23 77.27 Overall accuracy 86.92 83.41 Kappa coefficient 84.33 81.92
4.2. Landscape metrics at class level
Land use/cover maps are the source of landscape metrics computation at class level and at landscape level by means of FRAGSTATS software. Table 4 shows the most relevant landscape metrics calculated at class level for the entire study area and for the most changing classes. For the analysis and the comprehension of landscape metrics at class level, it is advisable not to analyze just a landscape metric but rather a set of metrics to better understand and describe the dynamics of ecosystems and landscape structures. However, care should be exercised the metrics are not correlated.
Poor rangeland in the study area represents the major class of the landscape. In this regard, during the period 1977–2007, CA and the percentage of PLAND decreased from 58546.43 to 42447.5 and 75.8 to 54.8, respectively, NP increased from 163 to 269, and MPS decreased from 359.18 to 157.8.This indicates that

132 Arekhi and komaki / Environmental Resources Research 3, 2 (2015)
larger units are now shrinking to lower levels. This translates into a degradation of the vegetation and the corollary is the division of large initial units into smaller ones. Meanwhile, MSI and AWMSI increased from 1.35 to 1.38 and 11.14 to 11.41. Shape complexity relates to the geometry of patches whether they tend to be simple and compact or irregular and convoluted (Table 4).
Also, the analysis of barren land indicated that the CA and PLAND decreased (from 14356.86 to 13003.36 and 18.6 to 16.8). Meanwhile, NP increased from 410 to 706, while the MPS decreased from 35.02 to 18.42, and the MSI and AWMSI increased from 1.34 to 1.35 and 2.92 to 3.59, respectively. Mean perimeter fractal dimension (MPFD) mainly measures the shape complexity (Table 4) and its values range from 1 to 2, where 1 represents patches with simple perimeter like squares and it approaches 2 when patch shapes become more convoluted. For the two classes of poor rangeland and barren land, MPFD values have increased. In addition, for the above mentioned two land use/cover classes, the mean proximity index and the interspersion and juxtaposition index of the patches decreased, indicating less uniform landscape configuration. The changes in these two metrics reflect that the distribution of poor rangeland and barren land in the study area was more fragmented in 2007 (Table 4).
Meanwhile, the study showed an increase of agriculture land in terms of CA and PLAND (from 2887.03 to 18231.73 and 3.3 to 23.4, respectively), NP (from 210 to 3342), TE (from 319753.54 to 625265.48) and ED (from 4.13 to 8.07) during the period 1977 to 2007. Increasing NP suggests the agriculture growth is characterized by dispersion. TE and ED increased between 1977 and 2007, thus indicating an increase in the total length of the edge of the agriculture patches, as due to land use fragmentation. The agricultural areas showed growth in a concentrated way, as new cropland areas generally occurred in the voids of the core or adjacent to existent agriculture patches. In addition, MSI and AWMSI showed an increase from 1.27 to 1.32 and 2.1 to 4.23, respectively, indicating an increase in the shape complexity. Shape complexity relates to the geometry of patches whether they tend to be simple and compact or irregular and convoluted (Table 4).
Finally, the analysis of sand plate indicated that NP significantly decreased from 160 to 57, while MPS increased from 10.54 to 66.55 and CA increased from 1686.16 to 3793.45. This combination of results shows that new sand plate formation generally occurred in the voids of the core or adjacent to existing sand plate patches indicating that sand plates grow in a concentrated way. Also, the decrease in MSI (from 1.29 to 1.28) and AWMSI (from 2.66 to 2.40) of the sand plate class show a decrease in the shape complexity. For two classes of agriculture and sand plates, MPFD values have decreased. For agriculture, MPFD value has decreased from 1.36 in 1977 to 1.35 in 2007. Also, for above mentioned two land use/covers, the mean proximity index and the interspersion and juxtaposition index of the patches increased, indicating more uniform landscape configuration. The

Arekhi and komaki / Environmental Resources Research 3, 2 (2015) 133
changes in these two metrics reflect that the distribution of agricultural lands and sand plates in the study area was more continuous in distribution and existence of a more uniform landscape configuration in 2007 (Table 4). Table 4. Landscape metrics at class level, 1977 and 2007
year Land categories Metrics
CA PLAND Nump MPS ED TE MSI AWMSI MPFD MPI IJI
1977
Agriculture 2887.03 3.3 352 8.2 4.13 319753.54 1.27 2.1 1.36 5473.20 38.33 Poor rangeland 58546.43 75.8 163 359.18 14.61 1131961.5 1.35 11.14 1.33 18237.45 33.68
Barren land 14356.86 18.6 410 35.02 11.4 883613.94 1.34 2.92 1.30 1491.09 51.92 Sand plate 1686.16 2.1 160 10.54 1.71 132704 1.29 2.66 1.36 1248.32 64.32
2007
Agriculture 18231.73 23.4 337 54.1 8.07 625265.48 1.32 4.23 1.35 7157.87 40.42 Poor rangeland 42447.5 54.8 269 157.8 17.45 1351613.03 1.38 11.41 1.34 17554.31 31.54
Barren land 13003.36 16.8 706 18.42 14.26 1104422.19 1.35 3.59 1.33 457.23 46.30 Sand plate 3793.45 4.9 57 66.55 1.49 115521.23 1.28 2.4 1.32 1278.34 67.54
4.3. Landscape metrics at landscape level
Table 5 shows the most relevant landscape metrics calculated at landscape level for the study area. As in Table 5, during the 1977 to 2007, NP in the study area increased (from 1085 to 1369), edge density and total edge increased (from 31.86 to 41.26 and 2468032.98 to 3196821.93, respectively), and MPS decreased (from 71.41 to 56.59), and finally MSI (from 1.31 to 1.35) and AWMSI (from 7.86 to 9.22) increased, indicating that the landscape has undergone considerable fragmentation. SHDI is used as a relative index for comparing landscapes. The SHEI values increased from 0.53 in 1977 to 0.81 in 2007, indicating higher observed diversity in time (Table 5).
Table 5. Landscape metrics at landscape level, 1977 and 2007.
Class 1977 2007 SDI 0.73 1.12 SEI 0.53 0.81 AWMSI 7.86 9.22 MSI 1.31 1.35 TE 2468032.98 3196821.93 ED 31.86 41.26 MPS 71.41 56.59 NumP 1085.00 1369.00
4. Conclusion
This paper describes analysis in terms of land use/cover and landscape change by means of remote sensing (RS) and geographic information system (GIS) techniques in an area prone to desertification in Ain-e-khosh, Iran, during the period 1977–2007. For this purpose, a set of land use/cover and landscape metrics

134 Arekhi and komaki / Environmental Resources Research 3, 2 (2015)
was setup, and a quantitative characterization of changes was performed. The combination of remote sensing data, GIS and landscape metrics is helpful in providing techniques to monitor land use/cover and landscape evolution. The analysis showed that the landscape of the study area, Ain-e-khosh, Iran, is dominated by poor rangeland, followed by barren land, agricultural land, and sand plates. Accordingly, during the study period (1977–2007), poor rangeland and barren land decreased, while agriculture and sand plate areas increased. The agriculture areas showed growth in a concentrated way, as new cropland areas generally occurred in the voids of the core or adjacent to existent agricultural patches.
It also quantifies the land use/cover transformation condition, mainly due to conversion from poor rangeland and barren land to agriculture and from poor rangeland to barren land and sand plate. The structure of the landscape in Ain-e-khosh region has changed significantly during the 30 years. Poor range land and barren land areas have become more fragmented and are characterized by the proliferation of much smaller and less connected patches. This was demonstrated by the change in various landscape metrics in both class and landscape levels. In most cases, landscape fragmentation increased as a consequence of intensified agriculture due to dam construction and population growth. So, the procedure adopted answered some of the important questions about the changes that occurred in the area. Among such questions were location, magnitude, directions of changes and the spatial characteristics of the area. Further research is needed in order to better understand the evolution of land use/cover of the landscape in areas in which land degradation and desertification processes occur. Despite the difficulties in classification of vegetation classes from RS data, the mechanisms developed for monitoring and analysis shown in this study have potential to be used in other desert areas with high landscape fragmentation and diverse land use patterns. References Agarwal, C., Green, G.M., Grove, J.M., Evan, T.P., and Schweik, C.M. 2002. A review and
assessment of land use change models: Dynamics of space, time and human choice. USDA (Forest Services), Technical Report. NE-29.
Bayarsaikhan, U., Boldgiv, B., Kim, K.R., Park, K.A., and Lee, D. 2009. Change detection and classification of land cover at Hustai National Park in Mongolia. International Journal of Applied Earth Observation and Geoinformation. 11: 273-280.
Cushman, S., McGarigal, A.K., and Neel, M.C. 2008. Parsimony in landscape metrics: strength, universality, and consistency. Ecological Indicators. 8: 691-703.
Forman, R.T.T., 1995. Land Mosaics: The Ecology of Landscapes and Regions. Cambridge University Press, Cambridge.
FRWO (Forest, Range, and Watershed Management Organization). 2004. National action program for combating desertification and mitigation of drought impacts. Iran: Tehran.

Arekhi and komaki / Environmental Resources Research 3, 2 (2015) 135
García-Gigorro, S., and Saura, S. 2005. Forest fragmentation estimated from remotely sensed data: is comparison across scales possible? Forest Science. 51: 51-63.
Geri, F., Amici, V., and Rocchini, D. 2010. Human activity impact on the heterogeneity of a Mediterranean landscape. Applied Geography. 30: 370-379.
Glenn, E., Smith, M.S., and Squires, V. 1998. On our failure to control desertification: implications for global change issues, and a research agenda for the future. Environmental Science Policy. 1:71–78.
Griffith, J.A., Martinko, E.A, and Price, K.P. 2000. Landscapestructure analysis of Kansas at three scales. Landscape Urban Plan, 52, 45–61.
Gustafson, E.J. 1998. Quantifying landscape spatial pattern: what is the state of art? Ecosystems. 1: 143-156.
Haines-Young, R., and Chopping, M. 1996. Quantifying landscape structure: a review of landscape indices and their application to forested landscapes. Progress in Physical Geography. 20: 418-445.
Hargis, C.D., Bissonette, J.A., and David, J.L. 1998. The behavior of landscape metrics commonly used in the study of habitat fragmentation. Landscape Ecology, 13, 167-186.
Jensen, J.R., 2005. Introductory digital image processing: a remote sensing perspective (third edition). Prentice-Hall, Englewood Cliffs.
Jia, B.Q., Zhang, Z.Q., Ci, L.J., Ren, Y.P., Pan, B.R., and Zhang, Z. 2004 Oasis land-use dynamics and its influence on the oasis environment in Xinjiang, China. Journal of Arid Environment. 56:11–26.
Johst, K., and Huth, A. 2005. Testing the intermediate disturbance hypothesis: when will there be two peaks of diversity?. Diversity and Distributions. 11: 111–120.
Kepner, W.G., Watts, C.J., Edmonds, C.M., Maingi, J.K., Marsh, S.E., and Luna, G. 2000. A landscape approach for detecting and evaluating change in a semi-arid environment. Environ Monitoring Assess. 64:179–195.
Landis, J., and Koch, G.G. 1977. The measurement of observer agreement for categorical data. Biometrics. 33: 159–174.
Lausch, A., and Herzog, H. 2002. Applicability of landscape metrics for the monitoring of landscape change: issues of scale, resolution and interpretability. Ecological Indicators. 2: 3-15.
Leitão, A.B, and Ahern, J. 2002. Applying landscape ecological concepts and metrics in sustainable landscape planning. Landscape and Urban Planning. 59: 65-93.
Leitão, A.B, Miller, J., Ahern, J., and McGarigal, K. 2006. Measuring landscapes. A planner’s handbook. Washington/London: Island Press/Covelo.
Li, X., He, H.S., Bu, R., We, Q., Chang, Y., and Hu, Y. 2005. The adequacy of different landscape metrics for various landscape patterns. Pattern Recognition. 38: 2626-2638.
Lin, Y., Han, G., Zhao, M., and Chang, S.X. 2010. Spatial vegetation patterns as early signs of desertification: a case study of a desert steppe in Inner Mongolia, China. Landscape Ecology. 10: 1519-1527.
Liu, J., Daily, G.C., Ehrlich, P.R., and Luck, G.W. 2003. Effects of household dynamics on resource consumption and biodiversity. Nature. 421: 530–533.
McGarigal, K., Cushman, S.A., Neel, M.C., and Ene, E. 2002a. FRAGSTATS: spatial pattern analysis program for categorical maps. Computer software program produced by

136 Arekhi and komaki / Environmental Resources Research 3, 2 (2015)
the authors at the University of Massachusetts, Amherst. Available at the following web site: www.umass.edu/landeco/research/fragstats/fragstats.html.
McGarigal, K., Cushman, S.A., Neel, M.C., and Ene, E. 2002b. FRAGSTATS: Spatial Pattern Analysis Program for Categorical Maps. Computer Software Program, University of Massachusetts, Amherst, Mass, USA.
McGarigal, K., and Marks, B.J. 1995. FRAGSTATS: Spatial pattern analysis program for quantifying landscape structure. Carvallis: Forest Science Department, Oregon State University.
Millette, T.L., Tuladhar, A.R., Kasperson, R.E., and Turner, B.L. 1995. The use and limits of remote sensing for analysing environmental and social change in the Himalayan Middle Mountains of Nepal. Global Environmental Change. 5: 367-380.
Narumalani, S., Mishra, D.R., and Rothwell, R.G. 2004. Change detection and landscape metrics for inferring anthropogenic processes in the greater EFMO area. Remote Sensing of Environment. 91: 478-489.
Peng, J., Wangb, Y., Zhang, Y., Wu, J., Li, W., and Li, Y. 2010. Evaluating the effectiveness of landscape metrics in quantifying spatial patterns. Ecological Indicators. 10: 217-223.
Petrov, A.N., and Sugumaran, R. 2009. Quantifying spatiotemporal dynamics of agricultural landscapes using remotely sensed data and landscape metrics. Geocarto International. 24: 223-240.
Poudel, K. 2008. Promoting geographic information and earth observation applications for the sustainable development of the Hindu Kush-Himalayan (HKH) region. In Paper presented at the Mountain GIS e-Conference: Geographic Information & Earth Observation for the Sustainable Development. International Centre for Integrated Mountain Development (ICIMOD).
Proulx, R., and Fahrig, L. 2010. Detecting human-driven deviations from trajectories in landscape composition and configuration. Landscape Ecology, 10, 1479-1487.
Ravan, S.A., Roy, P.S., and Sharma, C.M. 1998. Accuracy evaluation of digital classification of Landsat TM data-An approach to include phenological stages of tropical dry deciduous forest. International Journal of Ecology and Environmental Science. 22: 33–43.
Richards, J.A., and Jia, X. 2006. Remote sensing digital image analysis. An introduction (5th ed.). Dordrecht: Springer.
Riitters, K.H., O’Neill, R.V.O., Hunsaker, C.T., Wickham, J.D., Yankee, D.H., Timmins, S.P., Jones, K.B., and Jackson, B.L. 1995. A factor analysis of landscape pattern and structure metrics. Landscape Ecology. 10: 23–39.
Rocchini, D., Perry, G.L.W., Salerno, M., Maccherini, S., and Chiarucci, A. 2006. Landscape change and the dynamics of open formations in a natural reserve. Landscape and Urban Planning. 77: 167-177.
Saura, S., and Castro, S. 2007. Scaling functions for landscale pattern metrics derived from remotely sensed data: are their subpixel estimates really accurate? Photogrammetry & Remote Sensing. 62: 201-216.
Schlesinger, W.H., Reynolds, J.F., Cunningham, G.L., Huenneke, L.F., Jarreli, W.M., Virginia, R.A., and Whitford, W.G. 1990. Biological feedbacks in global desertification. Science. 247: 1043–1048.

Arekhi and komaki / Environmental Resources Research 3, 2 (2015) 137
Singh, R.B., Fox, J., and Himiyama, Y. 2001. Land Use and Cover Change. Science Publishers, Inc: NH.
Sundell-Turner, N.M., and Rodewald, A.D. 2008. A comparison of landscape metrics for conservation planning. Landscape and Urban Planning, 86: 219-225.
UNEP. 2001. The Mesopotamian marshlands: the demise of an ecosystem. Early Warning and Technical Assessment Report, UNEP/DEWA/TR.01–3. http://www.grid.unep.ch/activities/ sustainable/tigris/mesopotamia.pdf (accessed May 2003).
Uuemaa, E., Antrop, M., Roosaare, J., Marja, R., and Mander, Ü. 2009. Landscape metrics and indices: an overview of their use in landscape research. Living Reviews in Landscape Research. 3: 1-28.
Weiss, D.J., and Walsh, S.J. 2009. Remote sensing of mountain environments. Geography Compass. 3: 1-21.
Wu, J. 2004. Effects of changing scale on landscape pattern analysis: scaling relations. Landscape Ecology. 19: 125-138.
Wundram, W., and Löffler, J. 2008. High-resolution spatial analysis of mountain landscapes using a low-altitude remote sensing approach. International Journal of Remote Sensing. 29: 961-974.
Zehtabian, G.R., Ahmadi, H., and Azadnia, F. 2008. Investigation of soil and water indices and factors on desertification of Ain-e-khosh' s Dehloran. Pajouhesh and Sazandegi. 81:162-169.
Zeng, H., and Wu, X.B. 2005. Utilities of edge-based metrics for studying landscape fragmentation. Computers, Environment and Urban Systems. 29: 159-178.
