developing an equity scorecard university of dar es salaam, tanzania, february 2007
TRANSCRIPT
Developing an Equity Scorecard
University of Dar es Salaam, Tanzania, February 2007
What is a Scorecard?
Scorecards provide quantitative measures of complex processes
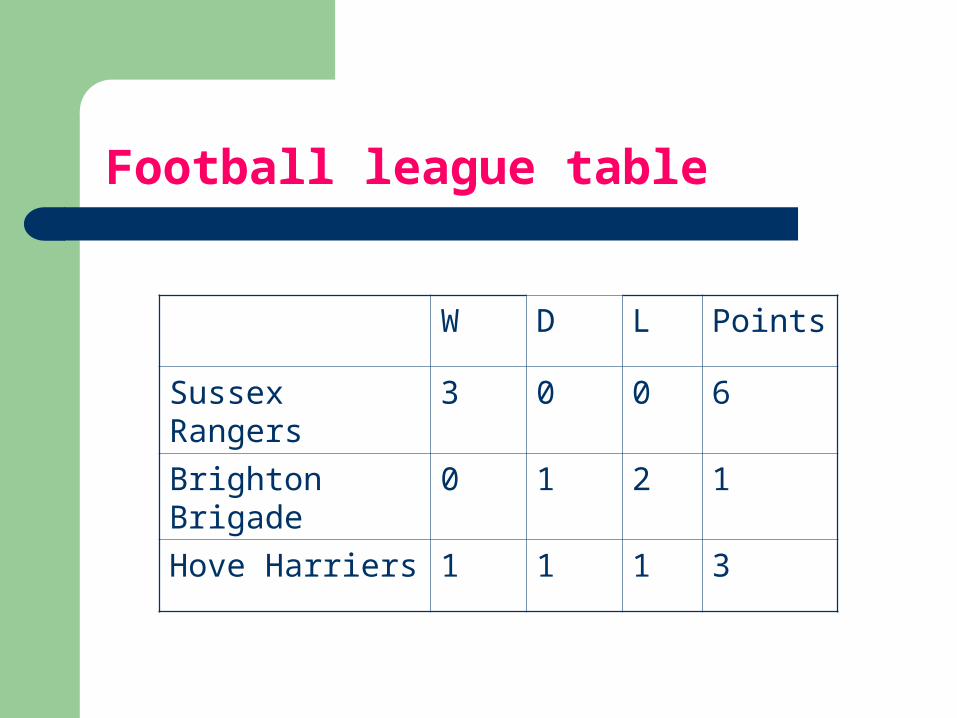
Football league table
W D L Points
Sussex Rangers 3 0 0 6
Brighton Brigade 0 1 2 1
Hove Harriers 1 1 1 3
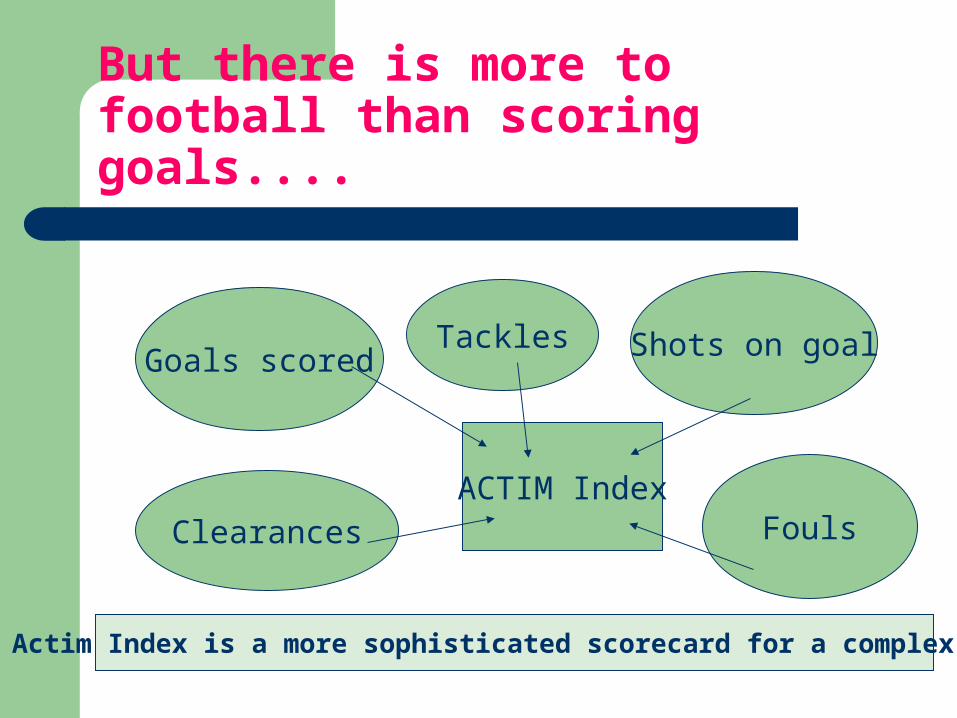
But there is more to football than scoring goals....
Goals scored Shots on goal
ClearancesACTIM Index
Fouls
Tackles
The Actim Index is a more sophisticated scorecard for a complex process
Scorecards are used to measure other complex processes too
Often used in public sector organisations and private sector businesses (e.g. Balanced Scorecard)
They are also increasingly used to measure the performance of education systems, especially how equitable these systems are.
Equity Scorecards in education
Measure institutional performance in terms of educational outcomes of the students, not just access (admissions) and participation (enrolment)
Tools for institutional accountability Innovative because institutions are rarely measured in
terms of equity in education outcomes Focus on outcomes can help us explore how well
universities are preparing students to participate in the knowledge economy.
Examples of Equity Scorecards in Education
Diversity Scorecard, University of Southern California:
measures how well institutions in Southern California are doing in terms of equitable access, retention and achievement for students from different race groups.
Equity Scorecards
Gender Equality And Education Scorecard, Beyond Access Project, London:
measures how well different countries are doing in terms of equitable access, participation and achievement in primary education for girls and boys.
Equity Scorecards
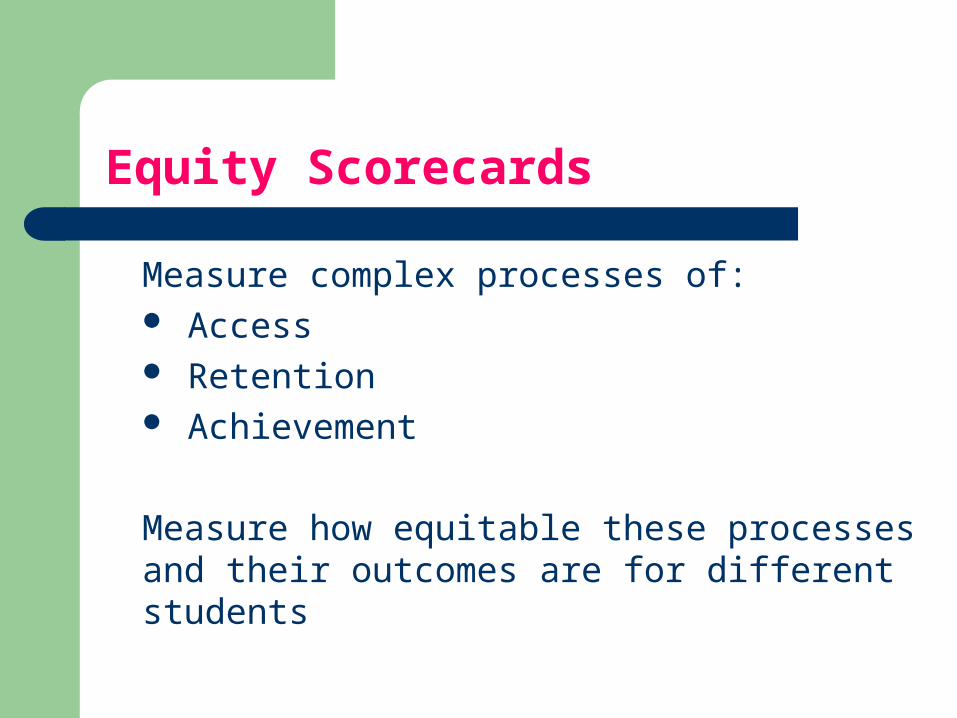
Measure complex processes of: Access Retention Achievement
Measure how equitable these processes and their outcomes are for different students
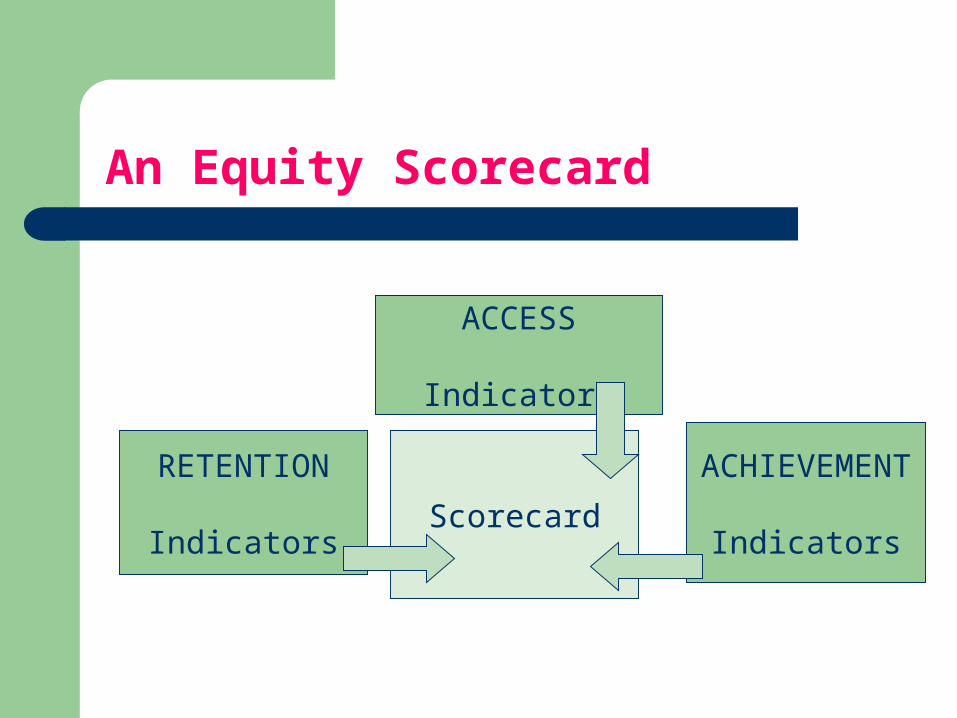
An Equity Scorecard
ACCESS
Indicators
RETENTION
Indicators
ACHIEVEMENT
IndicatorsScorecard
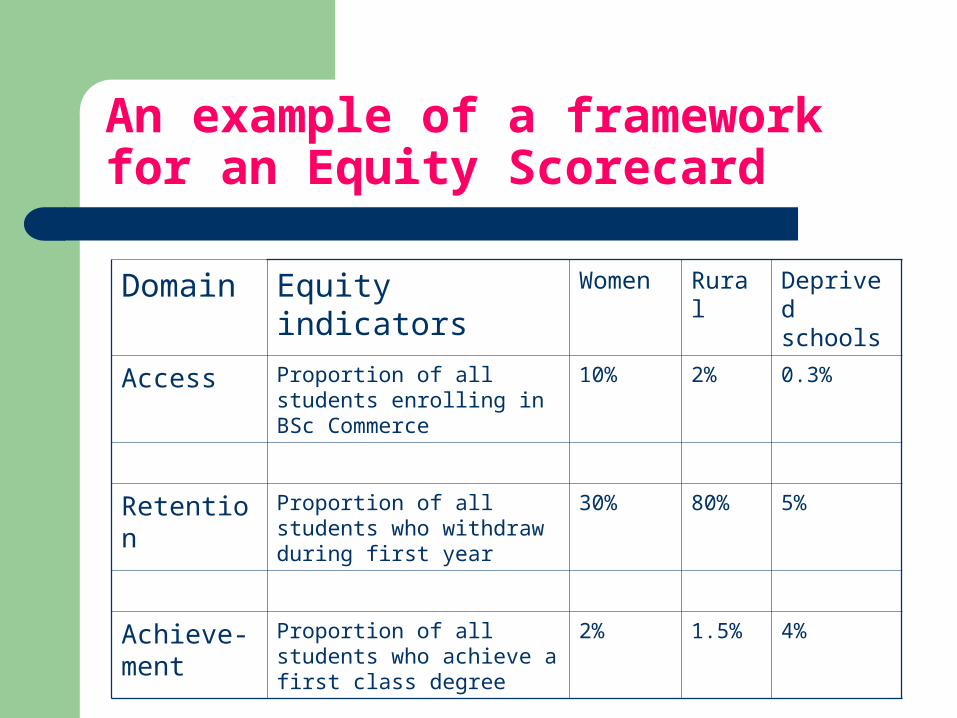
An example of a framework for an Equity Scorecard
Domain Equity indicators Women Rural Deprived schools
Access Proportion of all students enrolling in BSc Commerce
10% 2% 0.3%
Retention Proportion of all students who withdraw during first year
30% 80% 5%
Achieve-ment
Proportion of all students who achieve a first class degree
2% 1.5% 4%
Equity indexes
Indicators on their own do not easily reveal relative inequity
Equity indicators on a scorecard may be re-analysed to produce equity indexes
An equity index combines indicators and can be used to make comparisons
Equity indexes reveal patterns of relative equity/ inequity Equity indexes are designed to make specific
comparisons and so can have a theoretical ‘ideal’ score (e.g. perfect equity = 1).
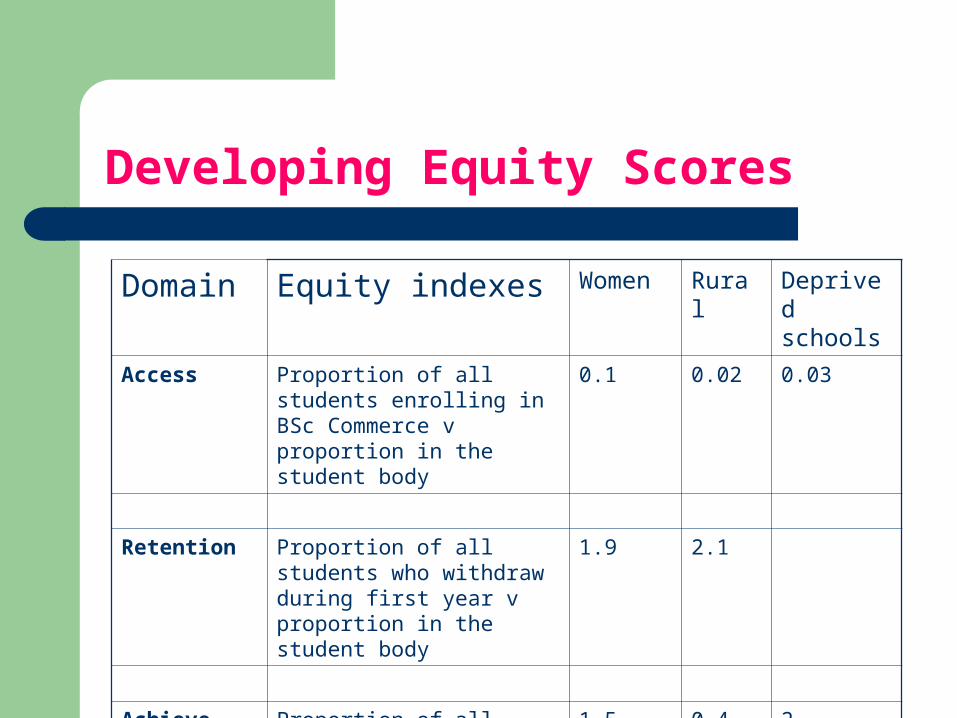
Developing Equity Scores
Domain Equity indexes Women Rural Deprived schools
Access Proportion of all students enrolling in BSc Commerce v proportion in the student body
0.1 0.02 0.03
Retention Proportion of all students who withdraw during first year v proportion in the student body
1.9 2.1
Achieve-ment
Proportion of all students who achieve a first class degree v proportion in the student body
1.5 0.4 2
Value of Scorecards
Encourage data to be analysed in new ways (e.g. disaggregated by gender / socio-economic background etc)
Reveal (hidden) patterns of inequity between students If measured across time, can reveal changing patterns Can be useful in comparative work between institutions Raises awareness of inequity within an institution Can provide information about where to target strategic
interventions Can mobilise action for change
How will we develop the Equity Scorecard?
Action research approach Practitioners as researchers Researchers in partnership with the Equity
Scorecard Group An iterative process of statistical data
collection, analysis, identification of gaps, more collection, analysis....
Practices that build a learning organisation
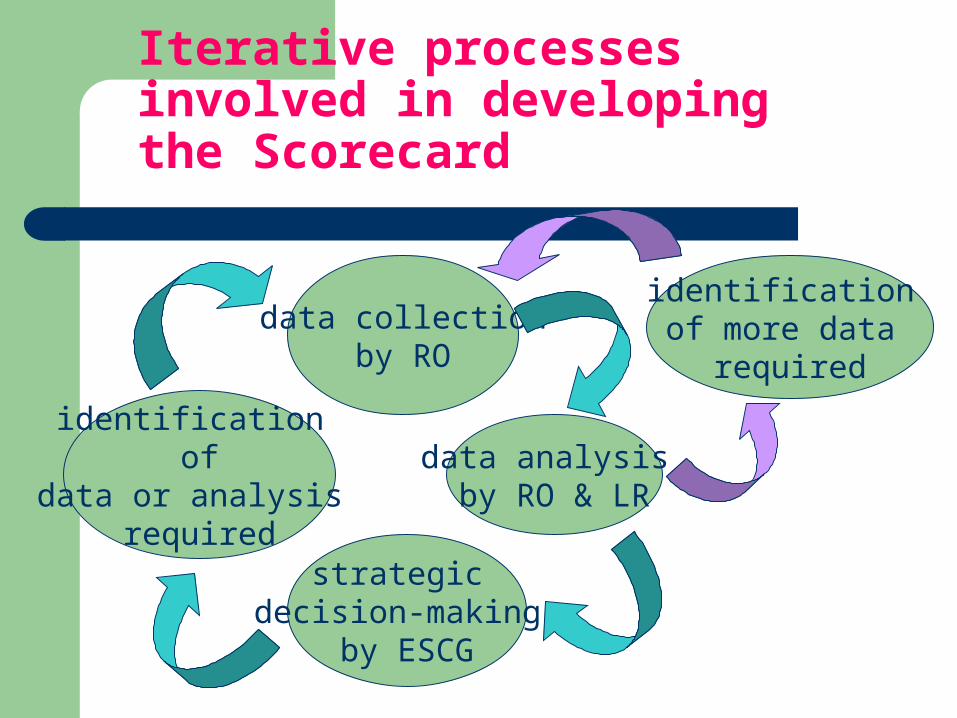
Iterative processes involved in developing the Scorecard
data collectionby RO
data analysis by RO & LR
strategic decision-making
by ESCG
identification of
data or analysis required
identification of more data
required
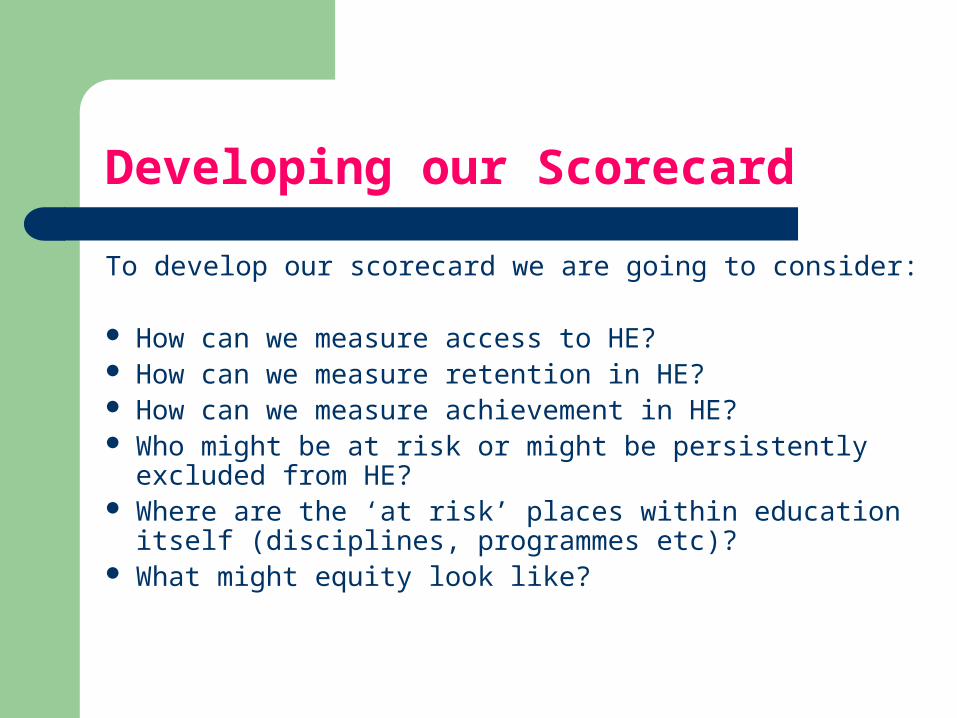
Developing our Scorecard
To develop our scorecard we are going to consider:
How can we measure access to HE? How can we measure retention in HE? How can we measure achievement in HE? Who might be at risk or might be persistently excluded
from HE? Where are the ‘at risk’ places within education itself
(disciplines, programmes etc)? What might equity look like?
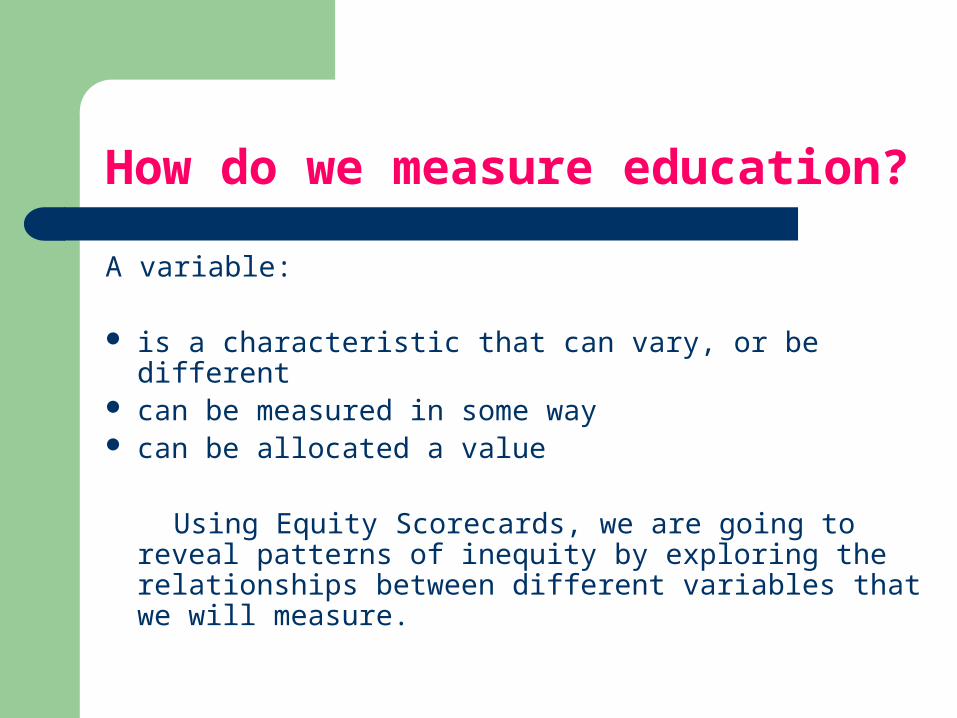
How do we measure education?
A variable:
is a characteristic that can vary, or be different can be measured in some way can be allocated a value
Using Equity Scorecards, we are going to reveal patterns of inequity by exploring the relationships between different variables that we will measure.
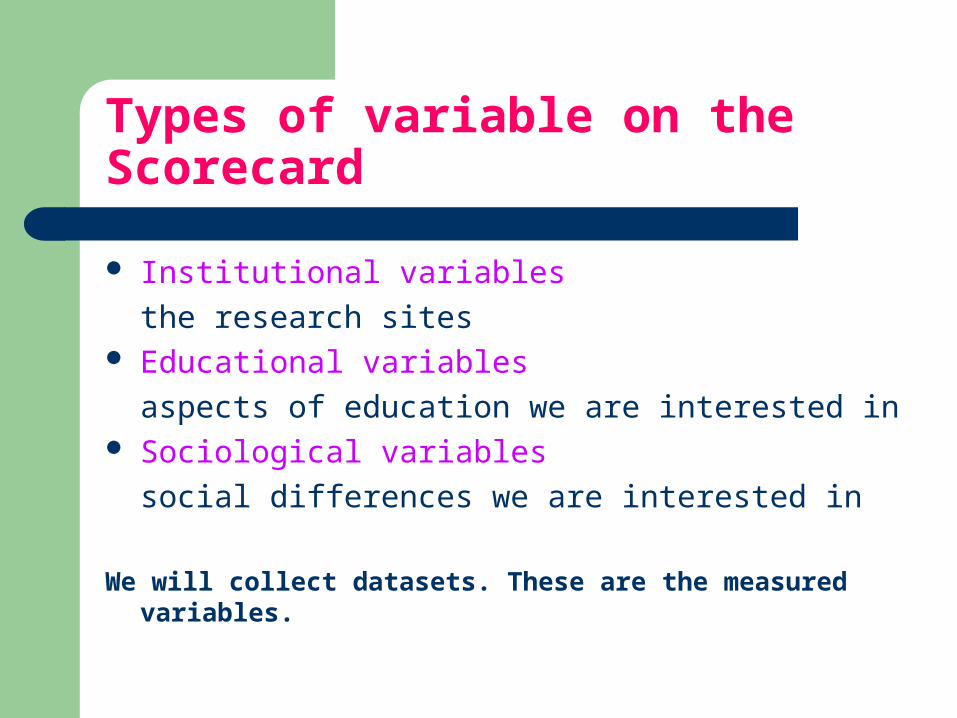
Types of variable on the Scorecard
Institutional variables
the research sites Educational variables
aspects of education we are interested in Sociological variables
social differences we are interested in
We will collect datasets. These are the measured variables.
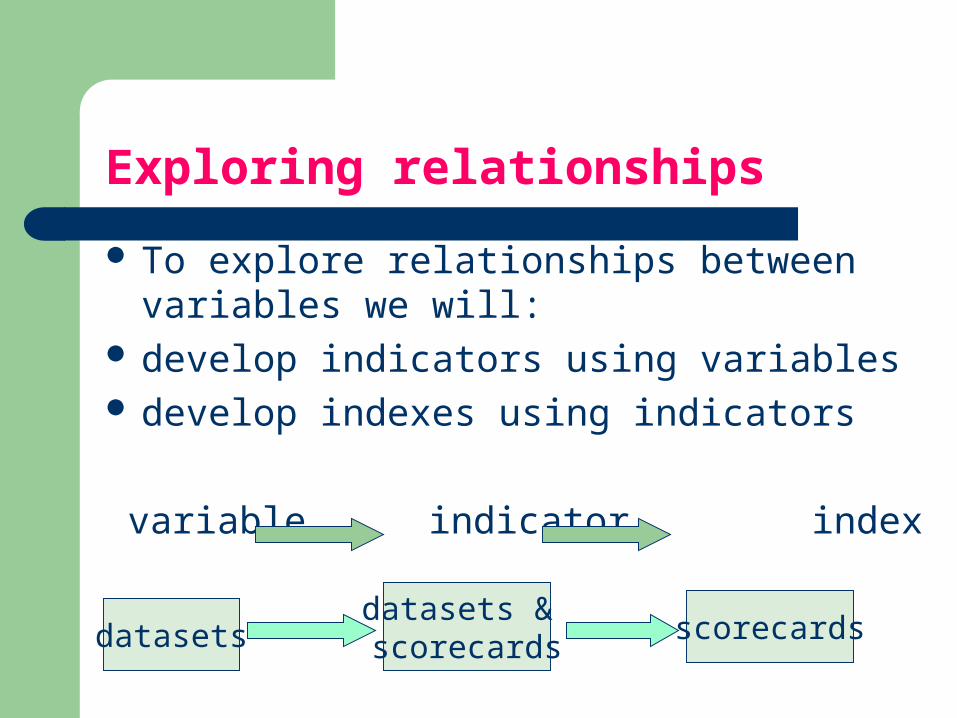
Exploring relationships
To explore relationships between variables we will:
develop indicators using variables develop indexes using indicators
variable indicator index
datasetsdatasets & scorecards
scorecards
Workshop activity - to build a Scorecard
We are going to make choices about which variables and relationships we will explore
Which education variables i.e. which education outcomes are we more interested in?
Which social variables i.e. which social groups are we most interested in?