developing practical phosphorus and potassium tissue test
TRANSCRIPT

Developing Practical Phosphorus and Potassium Tissue Test Recommendations and Utilizing Struvite in Modern Alfalfa Systems Norberg, S.1, E. Mackey2, S. Fransen3, J. Harrison4, D. Llewellyn5, and L. Whitefield6
1Washington State University WSU Franklin County Extension Office 404 W. Clark Street Pasco, WA 99301 Phone: 509-545-3511 Fax: 509-545-2130 Email: [email protected] 2 Washington State University Graduate Student 2606 W. Pioneer Puyallup, WA 98371 Phone: 509-335-5523 Fax: 253-445-4569 Email: [email protected]
3WSU IAREC 24106 N. Bunn Rd. Prosser, WA 99350-9687 USA Phone: 509-786-9266 Fax: 509-786-9370 Email: [email protected]
4Washington State University 2606 West Pioneer, Puyallup, WA 98371 Phone : 253-445-4638 Fax : 253-445-4569 e-mail: [email protected] 5Washington State University Extension ASLB 220 P.O. Box 646310 Pullman, WA 99164-6310 Phone: 509-335-8759 Fax : 509-335-1082 E-mail: [email protected]
6 Washington State University Livestock Nutrient Management Program 2606 W. Pioneer Puyallup, WA 98371 Office: 253-445-4562 Fax: 253-445-4569

Abstract: (Limit 200-300 words) Tissue testing whole alfalfa plants at harvest provides opportunities to direct nutrient decision making more accurately. Critical levels developed allow in-season recommendations and applications and would save producers time and effort since growers are already taking samples for hay quality. Three experiments were designed including: P Study with differing rates of P2O5 using monoammonium phosphate (MAP); including: 0, 30, 60, 120, 240 lbs./acre on an 8.1 ppm P soil (Olson P method); K Study: differing rates of K2O using potassium sulfate: 0, 40, 80, 160, 240, 320 lbs. K2O/acre; Struvite Study (magnesium ammonium phosphate, MgNH4PO4 · 6 H2O)- application at 144 lbs. of P2O5 /acre in differing ratios of MAP / Struvite in alfalfa including: 100:0, 75:25, 50:50, 37.5:62.5, 25:75, 12.5: 87.5, 0:100 and an unfertilized check. Results from the P Study showed that 140 and 165 lb/acre P2O5 maximized gross revenue after fertilizer costs for $150 and $200/ton alfalfa, respectively. Optimum phosphorus alfalfa tissue concentration was 0.24-0.25 for first cut, 0.28 - 0.29 for second cut, and 0.26-0.27 for third cut for alfalfa hay price of $150 and $200 per ton respectively. Applications of P2O5
decreased hay quality via increased aNDF, lignin, and decreased non fiber carbohydrates, there by emphasizing the need for precision nutrient management to maximize profit. The K Study started with a 101, 74, and 80 ppm potassium in the soil at 0-12, 12-24 and 24-36 inch depths (ammonium acetate method) which interestingly did not provide a yield response. Replacing or supplementing MAP with struvite had no effect on first cut or first year yield or phosphorus content. The Struvite study showed that even under very low phosphorus situations, MAP could be replaced with struvite on a P2O5 basis with no impact on yield or phosphorus content in the hay.
Introduction:
Most inorganic phosphorus (P) fertilizers are derived from phosphate rock, where 98% of the reserves are in other countries; with the USA only holding 2% (Stewart 2002, USGS 2013). Dairy farms accumulate P through manure and each farm has a unique need for P outlets and removal to reach a whole farm P nutrient balance (WA Dept. of Ecology). In contrast, alfalfa (Medicago sativa) producers need to reverse the trend of declining soil test P content to maintain high crop yield and quality. To compound the problem, just a few years ago the price of commercial P fertilizers soared to record high prices, and will likely to do so again as reserves diminish and struggle to accommodate increasing demand. A viable solution is the adoption of technology to capture P from liquid manure in the form of ‘struvite’, a slow release form of P based fertilizer. Current PNW struvite NPK fertilizer has an analysis of (6 – 29 – 0) including 16% magnesium. Struvite is easy to handle and transport due to its low moisture content, and has a sand-like appearance. More research is needed in the use of struvite in alfalfa and would supplement the efforts of a recent federal USDA -NRCS-CIG grant titled “Mobile System for Nutrient (Phosphorus) Recovery and Cost Efficient Nutrient Transport”.
With high P and K fertilizer costs it is important to apply required nutrients calibrated to one foot soil tests. Alfalfa plants can remove potassium and other nutrients from much deeper depths creating disproportional inaccuracy crop response and soil test results. Tissue testing provides the opportunity to direct nutrient decision making based on accurate critical levels for in-season recommendations that could include possible applications between cuttings or through fertigation. California scientists have developed the alfalfa tissue testing protocols; however producers are not adopting them because the test uses the middle third of alfalfa at one-tenth bloom for P & K (Meyer et al., 2008). One-tenth bloom is well past dairy quality hay stages for most PNW producers, making this California recommendation impractical. Alfalfa tissue testing has been proposed in New Mexico, which recommended a wide range from 2.0 to 3.5% K in the upper ⅓ of the plant at early bloom (Flynn et al., 1999). The current PNW alfalfa fertilizer guide states a critical level of 2.0 to 2.5% for the whole plant at first bloom but needs

further refinement (Koenig et al., 1999). Research conducted in Israel suggests maximum alfalfa yield K levels should remain above 2.5% at harvest (Kafkafi et al., 1977). This research and others reveal P & K concentrations decline with crop maturity indicating the importance of the timing of tissue testing.
Fertilizer is the largest single expense in an irrigated alfalfa budget for the western U.S. Even at modest rates, fertilizer can easily reach over $216 per acre with P & K being the largest component (Norberg and Neibergs, 2014). More K is removed from the soil by alfalfa than any other nutrient (Koenig and Barnhill, 2006). Alfalfa can remove 8 lb.P2O5 and 54 lb. K2O per ton of alfalfa produced (Koenig, et al., 2009), which for yields of 10 tons per acre attainable by excellent producers in the PNW, result in 80 lb.P2O5
and 540 pounds K2O removable per acre per year. We are proposing to use the harvest time of mid to late bud stage (typical harvest timing for first cutting) and use the whole plant which could be taken at the same time and using the same method currently being used for quality analysis. We have selected first cutting, the one most desired by the dairy industry and because it’s the most likely cutting to be nutrient limiting due to cold soils, but we are proposing to test all alfalfa cuttings. Struvite provides a slow release option we believe would work best in combinations with faster release forms such as mono-ammonium phosphate (MAP).
Research was conducted near Prosser, Washington on a low phosphorus testing soil 8.1 ppm (Olson method) and 90 ppm potassium soil (ammonium acetate method) to: 1) Develop and calibrate phosphorus (P2O5; P Study) & potassium (K2O; K Study) nutrient recommendations for bud stage alfalfa using tissue testing for maximum profit, yield and direct comparison to current soil testing recommendations; 2) Compare efficacy of combinations of MAP and struvite (Struvite Study; magnesium ammonium phosphate, MgNH4PO4 · 6 H2O) for fertilization of alfalfa; 3) Evaluate quality of hay samples at different P and K rates and tissue concentrations.

Materials and Methods:
We established three experiments with two with a low P soil test field (Phosphorus Rate & Struvite”and one on a low K soil test field (Potassium Rate). Studies were in a randomized complete block design with four replications at establishment of a spring stand of alfalfa and harvested 3 times in 2018. Fertilizer was applied at the beginning of the study once and incorporated with tillage. The experiments’ treatments and descriptions are listed below.
“Phosphorus rate” – Studying the influence of rates of P2O5 of MAP; including: 0, 30, 60, 120, 240 lb/acre to develop\refine tissue testing recommendations for P.
“Potassium Rate” - Response of alfalfa to six differing rates of Potassium Sulfate: 0, 40, 80, 160, 240, 320 lb K2O/acre to develop\refine tissue testing recommendations for K.
“Struvite” - Alfalfa response to six mixtures of MAP:Struvite in alfalfa: 0:0 100:0, 75:25, 50:50, 37.5:62.5, 25:75, 12.5: 87.5 0:100; to determine if any quick release P is needed to supplement the slower release of P in struvite for spring planted alfalfa.
Sturvite and MAP was applied according to treatments desired with a Gandy drop spreader after calibration.
Tissue samples were analyzed for P & K by Inductively Coupled Plasma Atomic Emission Spectroscopy (ICP). Yield results were compared to P & K concentrations to determine critical values required for maximum yield and economic returns. Calibration of P & K shortages compared to optimum rate at harvest along with P & K concentrations of tissue samples pulled to determine appropriate fertilizer recommendations for each cutting or averaged over cuttings if similar results are found.
To determine the maturity at harvest we used the maturity ratings of Muller and Teuber (2007) where: “growth stage 2” is late vegetative stage when stem length is greater than 12 inches; no visible buds, flower or seed pods; “growth stage 3” is early bud when 1-2 nodes have visible buds and have no flowers or seed pods and “growth stage 4” is late bud when ≥ 3 nodes have visible buds, with no flowers or seed pods. “Growth stage 5” early Flower is when one node with open flower; no seed pods. “growth stage 6” late flower when ≥ 2 nodes with open flowers; no seed pods. Growth stage of ten stems was determined and average growth stage of the plot calculated.
Plots for the experiment were harvested with a flail harvester (Carter Manufacturing) for 33 inches wide and 25 foot long. Subsamples were taken weighed, dried and weighted again for harvest moisture and dry matter yield determination.
These experiments determined how P & K status affects feed quality and value as stated in objective 3. To accomplish this at each harvest, whole plant samples were collected from each treatment plot at bud stage. All harvested samples were dried at in forced air ovens at 60оC until no weight loss occurred. Samples were ground through a Wiley Mill (Thomas Scientific, Swedesboro, NJ) to 2 mm in length, then ground with Udy Cyclone Sample Mill (Udy Corporation, Fort Collins, CO) to 1 mm before scanning and prediction for DM, CP, ADF, NDF, ash, starch, fat and TDN by FOSS 6500 Near Infrared Reflectance Spectroscopy (NIRS) using 20% of samples for wet lab validation by the methods of Shenk et.al., 1989 (NIRS Consortium).

Ground samples were utilized for both nutrient and forage quality analysis. Total digestible nutrients (TDN) and relative forage quality (RFQ) were estimated from the values obtained from the wet chemistry analysis.
Plots for the experiment were harvested with a flail harvester (Carter Manufacturing) for 33 inches wide and 25 foot long. Subsamples were taken and dried for harvest moisture and dry matter yield determined.
Statistical analysis was run in SAS using Proc GLM. A covariate (growth stage) was used in the struvite experiment to eliminate any affect on the quality parameters.
Results and Discussion:
Phosphorus Rate Experiment:
A visual difference was apparent between the plots with no application of phosphorus and soil containing 8.2 ppm P and the plots fertilized with 240 lb/acre of P2O5 of monoammonium phosphate (MAP; Figure 1.). Yield increased from 1.67 to 2.0 tons of dry matter/acre first cutting (Contrast linear P<0.0010) and from 5.7 to 6.4 tons/acre for the first year by applying 120 lb/acre P2O5, a difference of 0.33 and 0.69 tons acre, for first cut and first year, respectively. Almost half of the yield increase due to phosphorus occurred during the first cutting when the soil is cooler making phosphorus less available. Economic analysis of gross revenue after fertilizer cost (GRAFC) showed that the optimum rate of P2O5
was 140 and 165 lb P2O5 /acre, assuming $560/ton of MAP ($0.538/lb of P2O5), and an alfalfa hay priced at $150 and $200/ton of alfalfa hay, respectively (Figure 3). These rates correspond to phosphorus alfalfa hay levels of 0.24-0.25% for first cut, 0.28 - 0.29% for second cut, and 0.26-0.27% for third cut for alfalfa hay price of $150 and $200 per ton, respectively. Alfalfa tissue phosphorus concentration decreases with maturity and critical values for whole plants or hayed samples at the early-bud stage should be 30% and 12% higher than values for 10% bloom alfalfa for bud and late bud stages, respectively (Orloff et. al, 2012). Thus, the numbers we found 0.24-0.29% minus 30% would result in 0.17% to 0.2% which most current publications consider deficient (Koenig, 2009).
Quality of alfalfa was significantly affected by rate of P2O5 in many parameters including: aNDF, lignin, and non-fiber carbohydrates (NFC), which influenced relative feed value and relative feed quality and nutrient value per ton (St‐Pierre and Weiss method) (Table 1. and Figure 4.). Increased yield with phosphorus application more than offset the lost revenue per ton and the highest per acre value for 2018 was with the 120 lb P2O5 /acre rate. Changes in aNDF appear to be very closely related to lignin changes as the percentages closely follow each other with increasing phosphorus rate (Figure 5.). Phosphorus is important for bud formation and may have increased stem to leaf ratio in the hay and yield. Maturity of the alfalfa was not significant in the analysis by increasing phosphorus rate but exhibited a similar pattern to lignin content (Figure 6.) and we know that as the plant matures more lignin is formed so some quality loss could be due to advanced maturity in higher phosphorus rate plots. These results show that for long term sustainability and profitability fertilizing precision is required to maximize alfalfa quality.
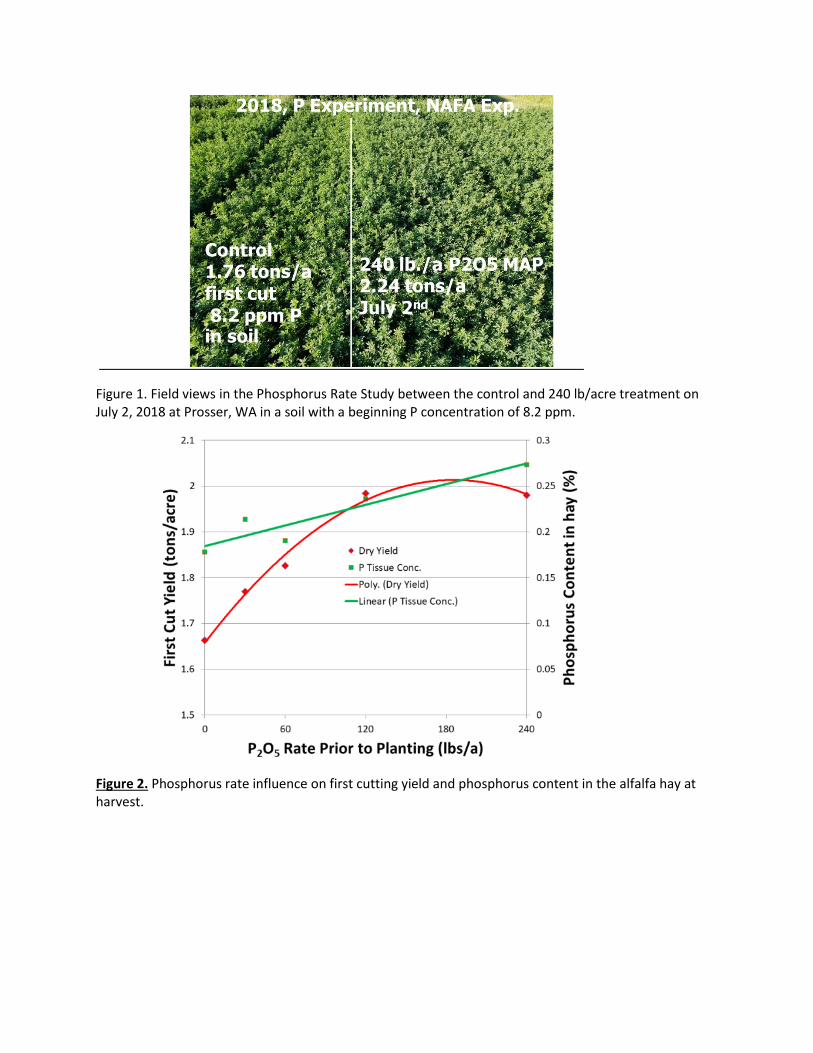
Figure 1. Field views in the Phosphorus Rate Study between the control and 240 lb/acre treatment on July 2, 2018 at Prosser, WA in a soil with a beginning P concentration of 8.2 ppm.
Figure 2. Phosphorus rate influence on first cutting yield and phosphorus content in the alfalfa hay at harvest.

Figure 3. Economic analysis of gross revenue after fertilizer cost showed that the optimum rate of P2O5
was 140 and 165 lb P2O5 /acre which maximized gross revenue (GR) minus fertilizer cost assuming $560/ton of MAP ($0.538/lb of P2O5) and an alfalfa hay price of $150 and $200/ton of alfalfa hay, respectively.
Figure 4. Influence of phosphorus rate on the nutrient value of alfalfa value per ton (St‐Pierre and Weiss method) and per acre for the 2018 season.

Table 1. Quality parameters including neutral detergent fiber (aNDF), lignin, non-fiber carbohydrates (NFC), relative feed value (RFV), relative feed quality (RFQ), nutrient value per ton and per acre as influenced by rate of P2O5 per acre. Nutrient value was calculated using method described by St‐Pierre and Weiss, 2011.
aNDF Lignin NFC RFV RFQ Nutrient
Value Nutrient
Value First Yr.
P2O5 Rate/Acre % % % unit % $ / Ton $ /Acre
0 34.92 5.72 34.70 171.54 182.53 276.47 1788.89
30 36.29 5.92 33.74 162.97 172.39 266.79 1709.19
60 35.57 5.80 34.77 167.74 176.27 271.26 1865.95
120 35.52 5.82 34.30 168.58 179.35 273.48 1985.46
240 37.73 6.25 33.14 155.59 164.38 257.61 1928.84
LSD 1.75 0.30 1.20 10.54 12.15 13.14 234.615
CV 5.89 6.2 4.3 7.7 8.4 5.9 15.34585
ANOVA Rate (P< Value)
0.0251
0.0103 0.0453 0.0354 0.0425 0.0534 NS
Contrast Rate Linear (P<Value)
0.006 0.002 0.0217 0.011 0.016 0.016 0.0667
Figure 5. Influence of phosphorus rate on average aNDF and lignin content in the alfalfa hay at harvest. As phosphorus rate increased lignin increased very closely to aNDF.

Figure 6. Influence of phosphorus rate on average growth stage index and lignin content in the alfalfa hay at harvest. Similar response only peaks at later than lignin.

Potassium Rate Experiment:
The experiment started with soil depths of 0-12, 12-24 and 24-36 inch containing 101, 73 and 79 ppm potassium in the soil (ammonium acetate method), respectively. Alfalfa yields were not responsive to fertilizer K applications (Figure 7). Potassium content without fertilizer applied averaged over cuttings 1.5% potassium and linearly increased as potassium rate was increased (Figure 7), commonly known as luxury consumption. The 1.5% tissue concentration of whole tops and no yield reduction conflict with current PNW recommendations of a critical concentration for sufficiency of 2.0 – 2.5% at first bloom (PNW0611 Guide). Our cuttings were at growth stage 3.4, 3.2, and 2.5 for cuts one, two, and three, respectively which is early bud for first two cuttings and late vegetative stage for the third cut. Orloff et.al, 2012 in California found that potassium tissue values for early-bud stage alfalfa and late-bud stage alfalfa should be about 20% and 12% higher than for 10% bloom alfalfa, respectively. Our research using their method would have a 1.2% potassium which does correspond with sufficiency with University of California recommendations (Meyer et. al, 2007). Further research is needed to determine the critical level of potassium at bud stage as yield was not limiting. Excess potassium applications are unprofitable both from fertilizer cost and decreased quality of hay. The 240 lb K2O treatment pulled 308 lb K from the soil and was 155% of potassium removed from the unfertilized control. Current PNW soil testing recommendation would have been 100 lb K2O /acre and according to our regression line would have resulted in a tissue concentration of 1.8% potassium. The K2O treatment 240 lb/acre had a negative influence on hay quality and decreased RFV and RFQ and increased lignin (data not shown).
Figure 7. Potassium rate influence on potassium content of alfalfa forage at harvest in 2018. Potassium content is a typical of luxury consumption of this nutrient.

Struvite Experiment:
Yield and phosphorus content of alfalfa was not affected by replacing MAP with struvite during first cutting or first year on this very low P testing soil having 10.8, 5.7, 3.7 ppm P in the top 0-12, 12-24, and 24-36 inch depths (Figure 8 and 9). The only quality parameter that was significant was fat content in the forage (Table2). Further research needs to determine if this occurs consistently.
Figure 8. First cutting yield and phosphorus content as influenced by struvite replacing monoammonium phosphate (MAP) at a single rate of 144 lb P2O5 per acre (recommended rate for this low phosphorus soil.

Figure 9. First year total yield and average phosphorus content as influenced by struvite replacing monoammonium phosphate (MAP) at a single rate of 144 lb P2O5 per acre (recommended rate for this low phosphorus soil).
Table 2. Fat in the harvested forage was influenced as MAP was replaced with struvite.
Phosphorus Source Fat
Struvite Percent %
0 2.23
25 2.19
50 2.28
62.5 2.17
75 2.22
87.5 2.17
100 2.12
CV 4.2
ANOVA Rate (P<Value) 0.0051
Contrast Rate Linear (P<Value) 0.0122
Contrast Rate Quadratic (P<Value) 0.0397

Management Suggestions/Conclusions From The First Year:
Optimum P alfalfa tissue phosphorus content based on first year of the experiment should be
between 0.24-0.28 and 0.25-0.29 when the alfalfa hay price of $150 and $200 per ton,
respectively.
First year data show that struvite can be used alone or in combination with monoammonium
phosphate (MAP) when put on prior to planting and incorporated without a yield loss even on a
soil averaging 8.1 ppm (Olson Method).
Excessive phosphorus of potassium has a negative effect on hay quality and can affect aNDF,
lignin, RFV, RFQ, and nutrient value of hay ($/ton).
Acknowledgements: Funding for this study was provided by the U.S. Alfalfa Farmer Research Initiative of the National Alfalfa & Forage Alliance and USDA -NRCS-CIG grant titled “Mobile System for Nutrient (Phosphorus) Recovery and Cost Efficient Nutrient Transport
References:
Koenig, R.T., D. Horneck, T. Platt, P. Petersen, R. Stevens, S. Fransen, B. Brown. 2009. Nutrient Management Guide for Dryland and Irrigated Alfalfa in the Inland Northwest. Pacific Northwest Extension Publication PNW0611.
Meyer, R.D.; D.B. Marcum, S.B. Orloff, J.L. Schmierer. 2007. IN (C.G. Summers and D.H. Putnam, eds.), Irrigated Alfalfa management for Mediterranean and Desert zone. Chapter 6. University of California agriculture and Natural Resources Publication 8289. See http://alfalfa.ucdaavis.edu/IrrigatedAlfalfa
Muller, S.C., L.R. Teuber. 2007. Alfalfa Growth and Development. IN (C.G. Summers and D.H. Putnam, eds.), Irrigated alfalfa management for Mediterranean and Desert zone. Chapter 3. University of California Agriculture and Natural Resources Publication 8289. See http://alfalfa.ucdaavis.edu/IrrigatedAlfalfa
N. St‐Pierre (st‐[email protected]), Professor, Department of Animal Sciences, The Ohio State University, 221 Animal Science Building, 2027 Fyffe Ct., Columbus, OH‐43210; W. P. Weiss, Professor, Department of Animal Sciences, The Ohio State University – Ohio Agricultural Research and Development Center, Wooster, OH; In: Proceedings, 2011 Western Alfalfa & Forage Conference, Las Vegas, NV, 11‐13 December, 2011. UC Cooperative Extension, Plant Sciences Department, University of California, Davis, CA 95616.
Orloff, S., D. Putnam, C. DeBen, A. Biscaro. 2012. Improved Methods for Nutrient Tissue Testing in Alfalfa. Final Report (Project #11-0469-SA) to Fertilizer and Research and Education Program
Shenk, J.S., M.O. Westerhaus, and SM. Abrams. 1989. Protocol for NIRS calibration: monitoring analysis results and recalibration, p. 104-110. In: G.C. Marten, J.S. Shenk, and F.E. Barton (eds.), Near infrared reflectance spectroscopy (NIRS): forage quality analysis. USDA Agr. Handbook No. 643, (revised). U.S. Government Printing Office, Washington, D.C.
Keywords: Alfalfa, Phosphorus, Potassium, Struvite, Yield, Hay Quality