development of a partial-admission axial turbine for a
TRANSCRIPT
* corresponding author(s) 1 DOI: 10.17185/duepublico/48887
3rd European supercritical CO2 Conference September 19-20, 2019, Paris, France
2019-sCO2.eu-129
DEVELOPMENT OF A PARTIAL-ADMISSION AXIAL TURBINE FOR A TENS-KWE UNDER SUPERCRITICAL CO2 CONDITION
Jongjae Cho* Korea Institute of Energy
Research Daejeon, South Korea
Email:[email protected]
Hyungki Shin Korea Institute of Energy
Research Daejeon, South Korea
Junhyun Cho Korea Institute of Energy
Research Daejeon, South Korea
Bongsu Choi Korea Institute of Energy
Research Daejeon, South Korea
Beomjoon Lee Korea Institute of Energy
Research Daejeon, South Korea
Chulwoo Roh Korea Institute of Energy
Research Daejeon, South Korea
Ho-Sang Ra Korea Institute of Energy
Research Daejeon, South Korea
Young-Jin Baik Korea Institute of Energy
Research Daejeon, South Korea
ABSTRACT The development of a tens-kWe turbo generator that uses
supercritical carbon dioxide (sCO2) cycle technology at the lab scale is described herein. The design concept for the turbo-generator involves using commercially available components to reduce the developmental time and to increase the reliability of the machine. The developed supercritical partial-admission CO2 turbine has a single-stage axial-type design with a 73-mm rotor mean diameter. The design of the sCO2 turbine uses impulse and partial admission. The design concept can reduce the axial force and rotational speed, and also secure the processability of the turbine. We simulated the flow of the designed sCO2 turbine. To increase the simulation accuracy, a real gas property table is coupled with the CFD solver. The turbine performance test apparatus and test results are described; then, the turbine is continuously operated for 4 hours 12 minutes. The maximum turbine power is 22.9 kW, and the maximum electric power is 12.6 kWe.
INTRODUCTION The supercritical carbon dioxide (sCO2) power cycle is gaining increasing attention as a technology that can potentially replace the conventional power cycle. One of the major advantages of the sCO2 power cycle is that it reduces the turbomachinery size because of the high density of the supercritical phase [1]. The power cycles of sCO2 have the potential to attain significantly higher cycle efficiencies compared with a conventional stream Rankine cycle [2]. High cycle efficiency will automatically lead to low fuel cost and low water usage; for fossil fuel heat sources, it will lead to low greenhouse gas emissions. Furthermore, the sCO2 cycles operate at high pressures throughout the cycle, thereby generating a high-density
working fluid. Owing to this, equipment size and plant footprint are reduced, thereby reducing the capital cost [2].
Numerous studies have been conducted on the sCO2 cycle and the essential components of this cycle. Table 1 summarizes the specifications for sCO2 power turbines derived from various studies. Sandia National Lab (SNL) developed a 250-kWe sCO2 power generation test loop [3-5]. Bechtel Marine Propulsion Corporation (BMPC) developed a 100-kWe sCO2 Brayton cycle integrated systems test loop [7-9]. Tokyo Institute of Technology (TIT) developed a 10-kWe sCO2 power generation test loop [10]. Southwest Research Institute (SwRI) and GE Global Research have been designing a 10-MWe sCO2 turbo-expander; they are also building a 1-MWe test facility to test the design with a reduced capacity [11]. Echogen developed an 8-MWe sCO2 power generation system for waste heat recovery, and this system has generated 2.4 MWe of power [12].
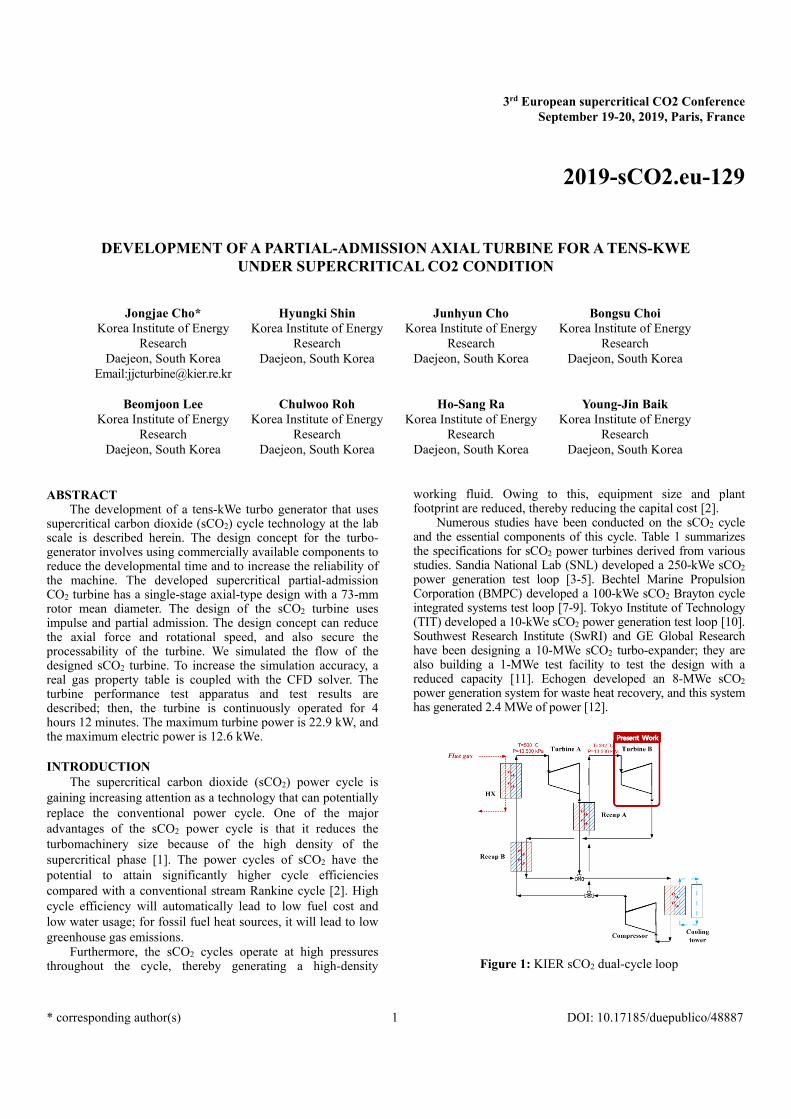
Figure 1: KIER sCO2 dual-cycle loop
2 DOI: 10.17185/duepublico/48887
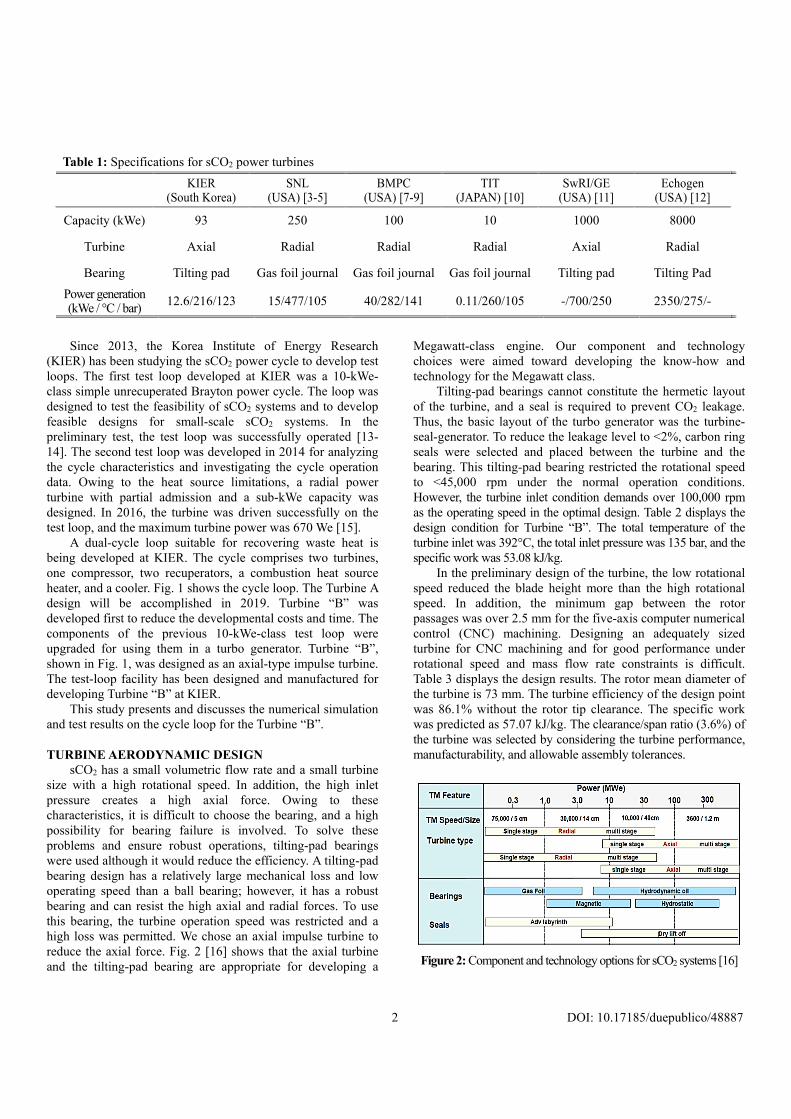
Since 2013, the Korea Institute of Energy Research (KIER) has been studying the sCO2 power cycle to develop test loops. The first test loop developed at KIER was a 10-kWe-class simple unrecuperated Brayton power cycle. The loop was designed to test the feasibility of sCO2 systems and to develop feasible designs for small-scale sCO2 systems. In the preliminary test, the test loop was successfully operated [13-14]. The second test loop was developed in 2014 for analyzing the cycle characteristics and investigating the cycle operation data. Owing to the heat source limitations, a radial power turbine with partial admission and a sub-kWe capacity was designed. In 2016, the turbine was driven successfully on the test loop, and the maximum turbine power was 670 We [15]. A dual-cycle loop suitable for recovering waste heat is being developed at KIER. The cycle comprises two turbines, one compressor, two recuperators, a combustion heat source heater, and a cooler. Fig. 1 shows the cycle loop. The Turbine A design will be accomplished in 2019. Turbine “B” was developed first to reduce the developmental costs and time. The components of the previous 10-kWe-class test loop were upgraded for using them in a turbo generator. Turbine “B”, shown in Fig. 1, was designed as an axial-type impulse turbine. The test-loop facility has been designed and manufactured for developing Turbine “B” at KIER. This study presents and discusses the numerical simulation and test results on the cycle loop for the Turbine “B”. TURBINE AERODYNAMIC DESIGN sCO2 has a small volumetric flow rate and a small turbine size with a high rotational speed. In addition, the high inlet pressure creates a high axial force. Owing to these characteristics, it is difficult to choose the bearing, and a high possibility for bearing failure is involved. To solve these problems and ensure robust operations, tilting-pad bearings were used although it would reduce the efficiency. A tilting-pad bearing design has a relatively large mechanical loss and low operating speed than a ball bearing; however, it has a robust bearing and can resist the high axial and radial forces. To use this bearing, the turbine operation speed was restricted and a high loss was permitted. We chose an axial impulse turbine to reduce the axial force. Fig. 2 [16] shows that the axial turbine and the tilting-pad bearing are appropriate for developing a
Megawatt-class engine. Our component and technology choices were aimed toward developing the know-how and technology for the Megawatt class. Tilting-pad bearings cannot constitute the hermetic layout of the turbine, and a seal is required to prevent CO2 leakage. Thus, the basic layout of the turbo generator was the turbine-seal-generator. To reduce the leakage level to <2%, carbon ring seals were selected and placed between the turbine and the bearing. This tilting-pad bearing restricted the rotational speed to <45,000 rpm under the normal operation conditions. However, the turbine inlet condition demands over 100,000 rpm as the operating speed in the optimal design. Table 2 displays the design condition for Turbine “B”. The total temperature of the turbine inlet was 392°C, the total inlet pressure was 135 bar, and the specific work was 53.08 kJ/kg. In the preliminary design of the turbine, the low rotational speed reduced the blade height more than the high rotational speed. In addition, the minimum gap between the rotor passages was over 2.5 mm for the five-axis computer numerical control (CNC) machining. Designing an adequately sized turbine for CNC machining and for good performance under rotational speed and mass flow rate constraints is difficult. Table 3 displays the design results. The rotor mean diameter of the turbine is 73 mm. The turbine efficiency of the design point was 86.1% without the rotor tip clearance. The specific work was predicted as 57.07 kJ/kg. The clearance/span ratio (3.6%) of the turbine was selected by considering the turbine performance, manufacturability, and allowable assembly tolerances.
Figure 2: Component and technology options for sCO2 systems [16]
Table 1: Specifications for sCO2 power turbines
KIER
(South Korea) SNL
(USA) [3-5] BMPC
(USA) [7-9] TIT
(JAPAN) [10] SwRI/GE
(USA) [11] Echogen
(USA) [12]
Capacity (kWe) 93 250 100 10 1000 8000
Turbine Axial Radial Radial Radial Axial Radial
Bearing Tilting pad Gas foil journal Gas foil journal Gas foil journal Tilting pad Tilting Pad
Power generation (kWe / °C / bar)
12.6/216/123 15/477/105 40/282/141 0.11/260/105 -/700/250 2350/275/-
3 DOI: 10.17185/duepublico/48887
Table 2: Turbine “B” design conditions
Specific work kJ/kg 53.08
Inlet total pressure bar 135
Inlet total temperature °C 392
Pressure ratio (PRTT) - 1.75
Rotational speed rpm under 45,000
Table 3: Turbine “B” preliminary design results
Nozzle vane height mm 8.36
Rotor blade height mm 8.36
Rotor mean diameter mm 73
Rotational speed rpm 45,000
Partial-admission ratio % 100
Specific work kJ/kg 57.07
Efficiency (ηTT) * % 86.1
* without rotor tip clearance NUMERICAL ANALYSIS Based on the preliminary design results, a numerical analysis was performed to determine the final design of the turbine using the commercial computational fluid dynamic (CFD) solver ANSYS CFX [17]. We also used the Reynolds-averaged Navier−Stokes two-equation model: the k-ω shear stress transport of Menter [18]; wall functions were also applied. For the analysis, we resolved the boundary layer to an approximate average y+ value of 3. The total mesh size was set to approximately 6.1 million.
Figure 3: Numerical domain and mesh
The inlet boundary condition was defined by the total pressure and temperature. The outlet boundary condition was defined by the static pressure. At the wall boundary condition, non-slip and adiabatic wall boundary conditions were applied. A mixing-plane model was defined between the interface of the stationary and rotating zones. CFD analysis was performed under conditions of full admission because of the computational cost. Fig. 3 shows the numerical domain and the
boundary conditions of Turbine “B”. The CFD was performed based on real gas characteristics using the NIST REFPROP software.
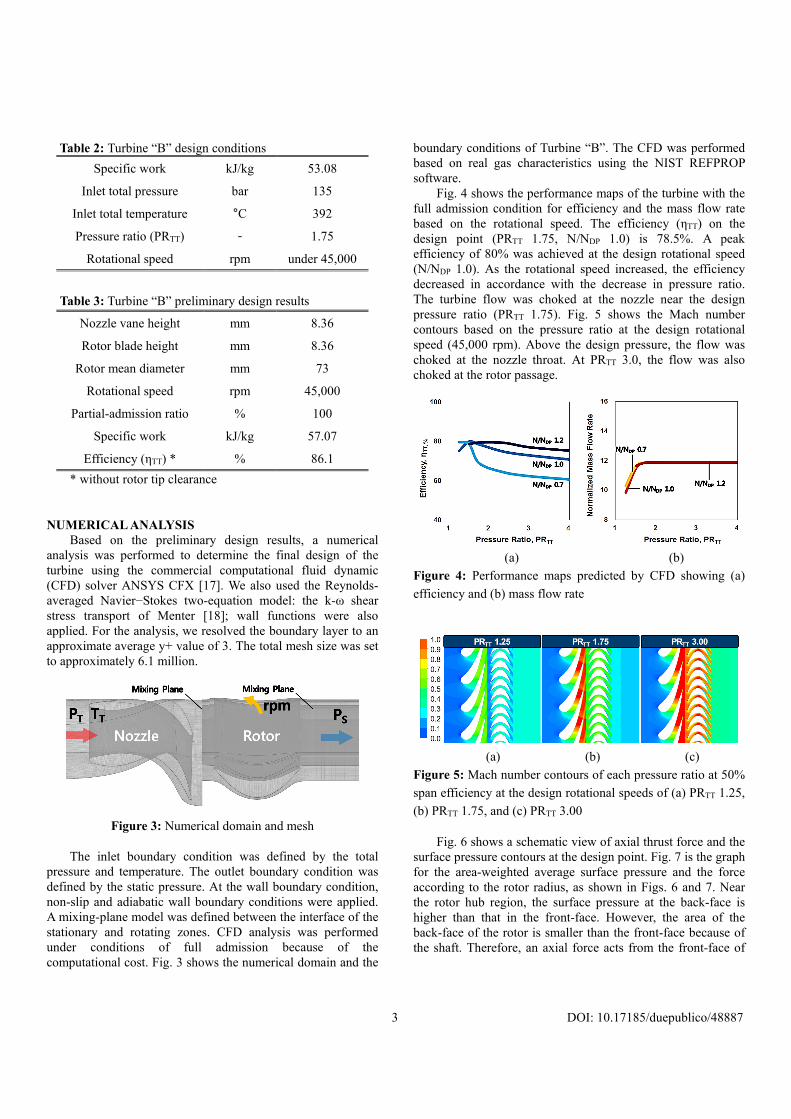
Fig. 4 shows the performance maps of the turbine with the full admission condition for efficiency and the mass flow rate based on the rotational speed. The efficiency (ηTT) on the design point (PRTT 1.75, N/NDP 1.0) is 78.5%. A peak efficiency of 80% was achieved at the design rotational speed (N/NDP 1.0). As the rotational speed increased, the efficiency decreased in accordance with the decrease in pressure ratio. The turbine flow was choked at the nozzle near the design pressure ratio (PRTT 1.75). Fig. 5 shows the Mach number contours based on the pressure ratio at the design rotational speed (45,000 rpm). Above the design pressure, the flow was choked at the nozzle throat. At PRTT 3.0, the flow was also choked at the rotor passage.
(a) (b)
Figure 4: Performance maps predicted by CFD showing (a)
efficiency and (b) mass flow rate
(a) (b) (c)
Figure 5: Mach number contours of each pressure ratio at 50%
span efficiency at the design rotational speeds of (a) PRTT 1.25,
(b) PRTT 1.75, and (c) PRTT 3.00
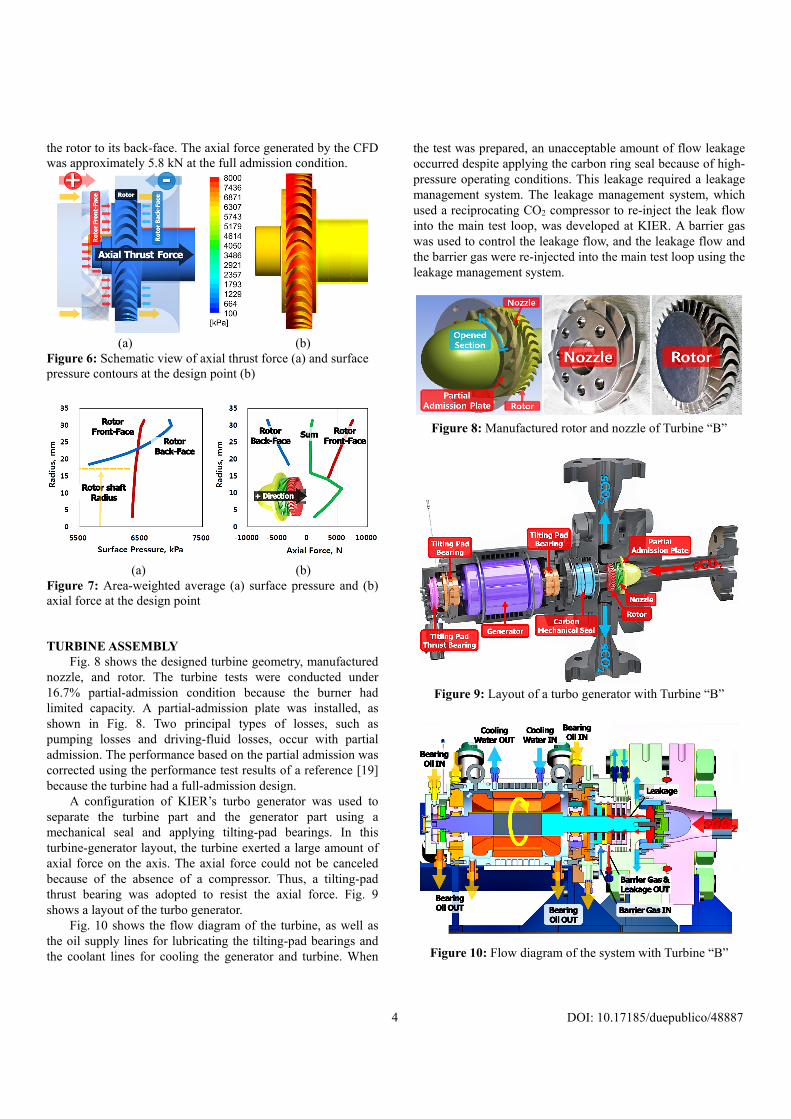
Fig. 6 shows a schematic view of axial thrust force and the surface pressure contours at the design point. Fig. 7 is the graph for the area-weighted average surface pressure and the force according to the rotor radius, as shown in Figs. 6 and 7. Near the rotor hub region, the surface pressure at the back-face is higher than that in the front-face. However, the area of the back-face of the rotor is smaller than the front-face because of the shaft. Therefore, an axial force acts from the front-face of
4 DOI: 10.17185/duepublico/48887
the rotor to its back-face. The axial force generated by the CFD was approximately 5.8 kN at the full admission condition.
(a) (b)
Figure 6: Schematic view of axial thrust force (a) and surface pressure contours at the design point (b)
(a) (b) Figure 7: Area-weighted average (a) surface pressure and (b) axial force at the design point TURBINE ASSEMBLY
Fig. 8 shows the designed turbine geometry, manufactured nozzle, and rotor. The turbine tests were conducted under 16.7% partial-admission condition because the burner had limited capacity. A partial-admission plate was installed, as shown in Fig. 8. Two principal types of losses, such as pumping losses and driving-fluid losses, occur with partial admission. The performance based on the partial admission was corrected using the performance test results of a reference [19] because the turbine had a full-admission design.
A configuration of KIER’s turbo generator was used to separate the turbine part and the generator part using a mechanical seal and applying tilting-pad bearings. In this turbine-generator layout, the turbine exerted a large amount of axial force on the axis. The axial force could not be canceled because of the absence of a compressor. Thus, a tilting-pad thrust bearing was adopted to resist the axial force. Fig. 9 shows a layout of the turbo generator.
Fig. 10 shows the flow diagram of the turbine, as well as the oil supply lines for lubricating the tilting-pad bearings and the coolant lines for cooling the generator and turbine. When
the test was prepared, an unacceptable amount of flow leakage occurred despite applying the carbon ring seal because of high-pressure operating conditions. This leakage required a leakage management system. The leakage management system, which used a reciprocating CO2 compressor to re-inject the leak flow into the main test loop, was developed at KIER. A barrier gas was used to control the leakage flow, and the leakage flow and the barrier gas were re-injected into the main test loop using the leakage management system.
Figure 8: Manufactured rotor and nozzle of Turbine “B”
Figure 9: Layout of a turbo generator with Turbine “B”
Figure 10: Flow diagram of the system with Turbine “B”
5 DOI: 10.17185/duepublico/48887
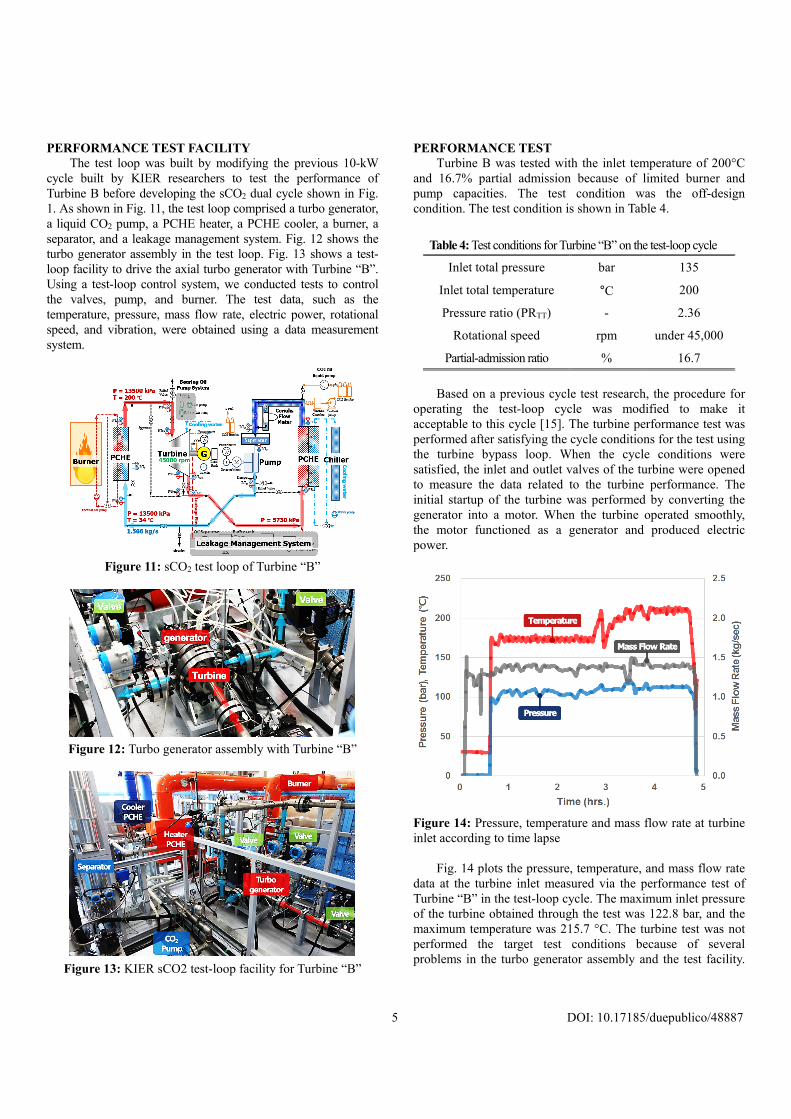
PERFORMANCE TEST FACILITY The test loop was built by modifying the previous 10-kW
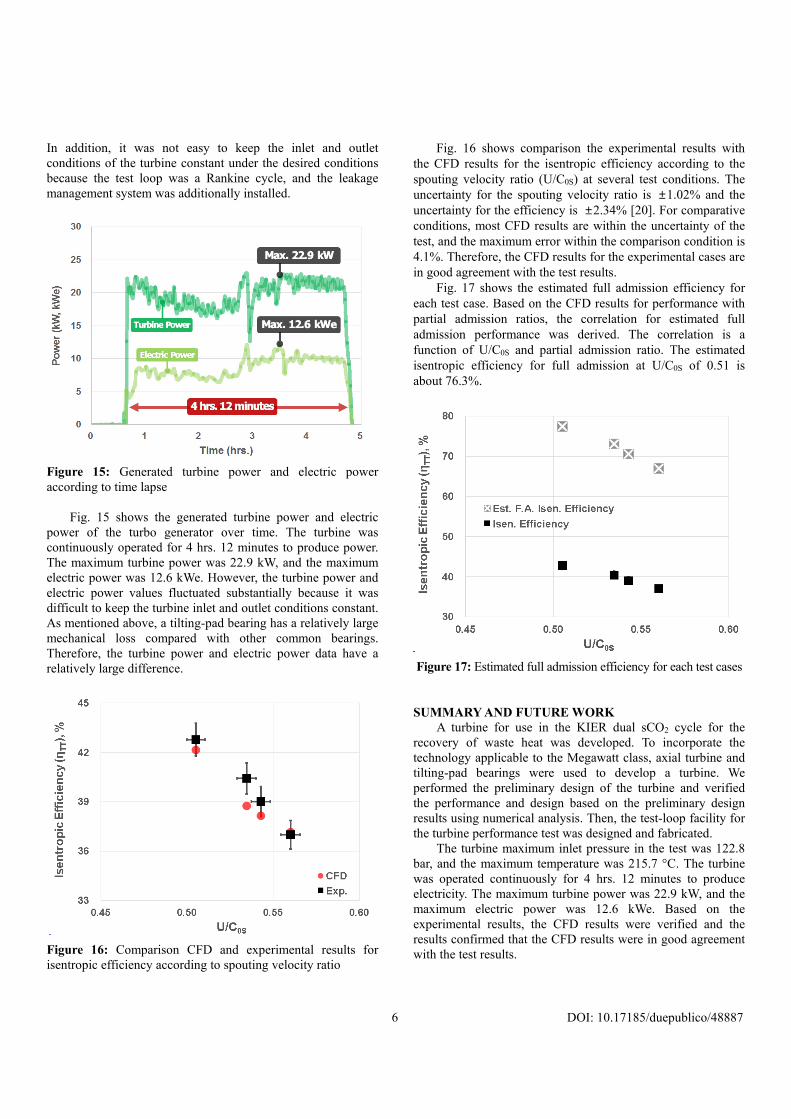
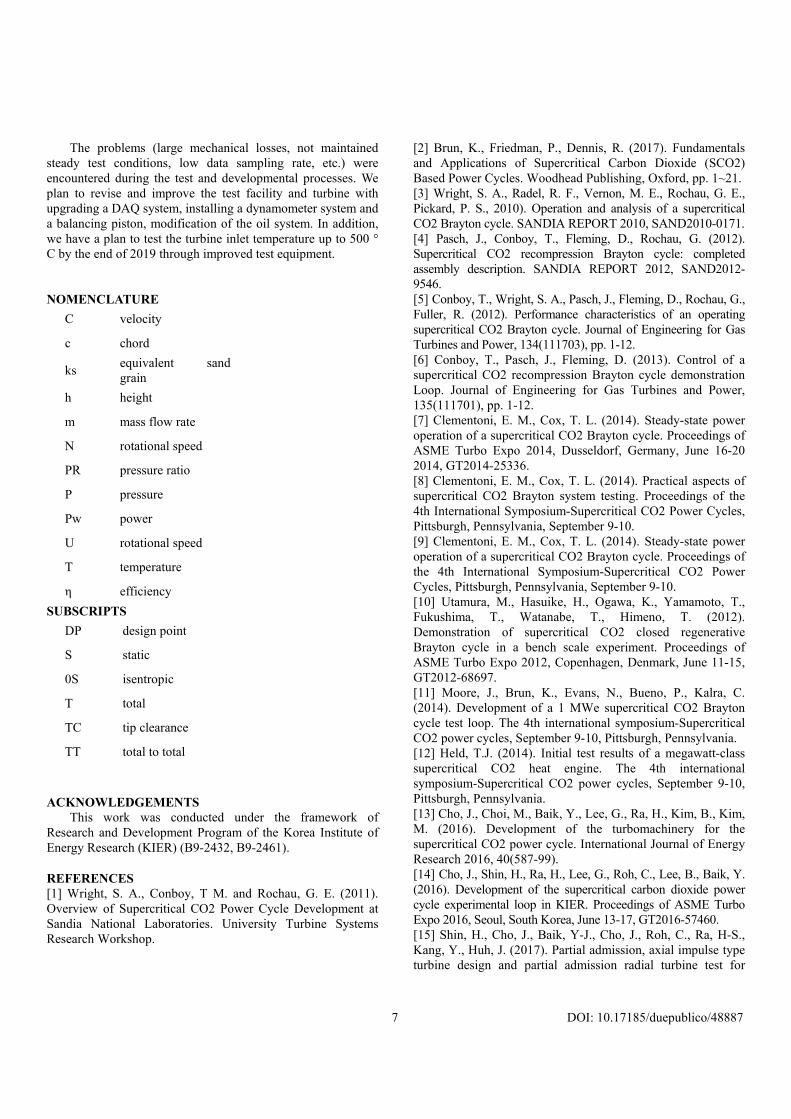
cycle built by KIER researchers to test the performance of Turbine B before developing the sCO2 dual cycle shown in Fig. 1. As shown in Fig. 11, the test loop comprised a turbo generator, a liquid CO2 pump, a PCHE heater, a PCHE cooler, a burner, a separator, and a leakage management system. Fig. 12 shows the turbo generator assembly in the test loop. Fig. 13 shows a test-loop facility to drive the axial turbo generator with Turbine “B”. Using a test-loop control system, we conducted tests to control the valves, pump, and burner. The test data, such as the temperature, pressure, mass flow rate, electric power, rotational speed, and vibration, were obtained using a data measurement system.
Figure 11: sCO2 test loop of Turbine “B”
Figure 12: Turbo generator assembly with Turbine “B”
Figure 13: KIER sCO2 test-loop facility for Turbine “B”
PERFORMANCE TEST Turbine B was tested with the inlet temperature of 200°C
and 16.7% partial admission because of limited burner and pump capacities. The test condition was the off-design condition. The test condition is shown in Table 4.
Table 4: Test conditions for Turbine “B” on the test-loop cycle
Inlet total pressure bar 135
Inlet total temperature °C 200
Pressure ratio (PRTT) - 2.36
Rotational speed rpm under 45,000
Partial-admission ratio % 16.7
Based on a previous cycle test research, the procedure for
operating the test-loop cycle was modified to make it acceptable to this cycle [15]. The turbine performance test was performed after satisfying the cycle conditions for the test using the turbine bypass loop. When the cycle conditions were satisfied, the inlet and outlet valves of the turbine were opened to measure the data related to the turbine performance. The initial startup of the turbine was performed by converting the generator into a motor. When the turbine operated smoothly, the motor functioned as a generator and produced electric power.
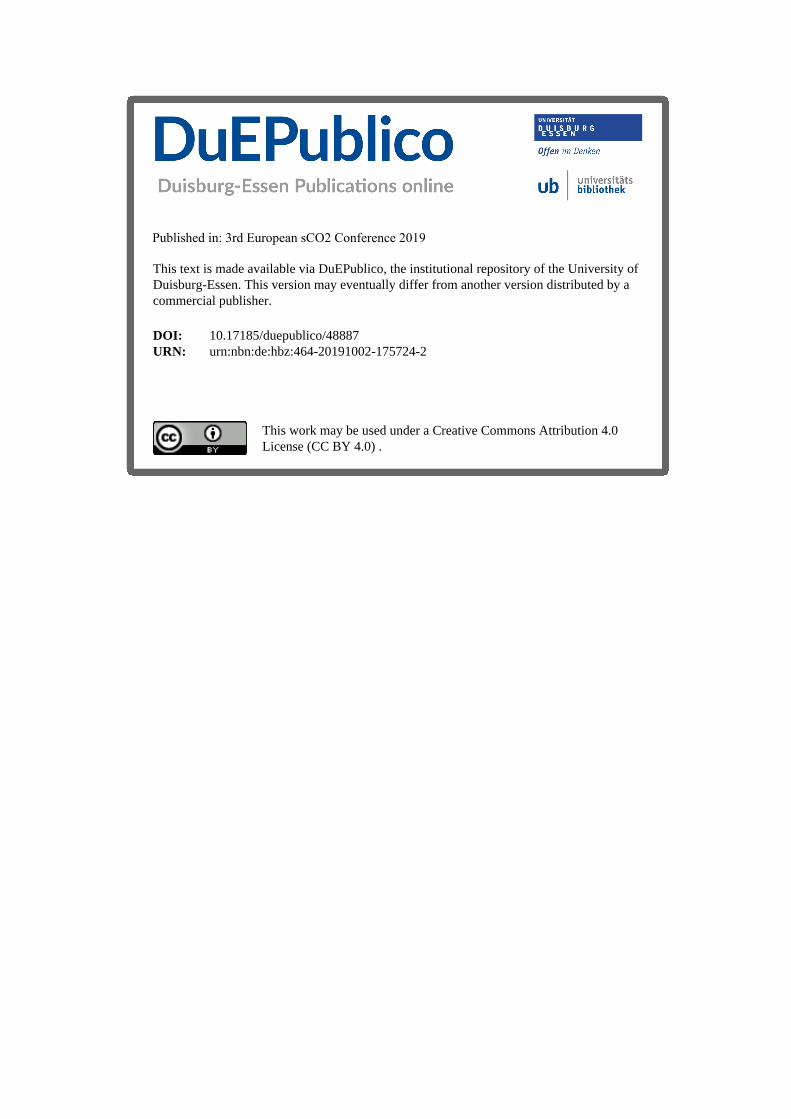
Figure 14: Pressure, temperature and mass flow rate at turbine inlet according to time lapse
Fig. 14 plots the pressure, temperature, and mass flow rate
data at the turbine inlet measured via the performance test of Turbine “B” in the test-loop cycle. The maximum inlet pressure of the turbine obtained through the test was 122.8 bar, and the maximum temperature was 215.7 °C. The turbine test was not performed the target test conditions because of several problems in the turbo generator assembly and the test facility.
6 DOI: 10.17185/duepublico/48887
In addition, it was not easy to keep the inlet and outlet conditions of the turbine constant under the desired conditions because the test loop was a Rankine cycle, and the leakage management system was additionally installed.
Figure 15: Generated turbine power and electric power according to time lapse
Fig. 15 shows the generated turbine power and electric
power of the turbo generator over time. The turbine was continuously operated for 4 hrs. 12 minutes to produce power. The maximum turbine power was 22.9 kW, and the maximum electric power was 12.6 kWe. However, the turbine power and electric power values fluctuated substantially because it was difficult to keep the turbine inlet and outlet conditions constant. As mentioned above, a tilting-pad bearing has a relatively large mechanical loss compared with other common bearings. Therefore, the turbine power and electric power data have a relatively large difference.
Figure 16: Comparison CFD and experimental results for isentropic efficiency according to spouting velocity ratio
Fig. 16 shows comparison the experimental results with the CFD results for the isentropic efficiency according to the spouting velocity ratio (U/C0S) at several test conditions. The uncertainty for the spouting velocity ratio is ±1.02% and the uncertainty for the efficiency is ±2.34% [20]. For comparative conditions, most CFD results are within the uncertainty of the test, and the maximum error within the comparison condition is 4.1%. Therefore, the CFD results for the experimental cases are in good agreement with the test results.
Fig. 17 shows the estimated full admission efficiency for each test case. Based on the CFD results for performance with partial admission ratios, the correlation for estimated full admission performance was derived. The correlation is a function of U/C0S and partial admission ratio. The estimated isentropic efficiency for full admission at U/C0S of 0.51 is about 76.3%.
Figure 17: Estimated full admission efficiency for each test cases
SUMMARY AND FUTURE WORK
A turbine for use in the KIER dual sCO2 cycle for the recovery of waste heat was developed. To incorporate the technology applicable to the Megawatt class, axial turbine and tilting-pad bearings were used to develop a turbine. We performed the preliminary design of the turbine and verified the performance and design based on the preliminary design results using numerical analysis. Then, the test-loop facility for the turbine performance test was designed and fabricated.
The turbine maximum inlet pressure in the test was 122.8 bar, and the maximum temperature was 215.7 °C. The turbine was operated continuously for 4 hrs. 12 minutes to produce electricity. The maximum turbine power was 22.9 kW, and the maximum electric power was 12.6 kWe. Based on the experimental results, the CFD results were verified and the results confirmed that the CFD results were in good agreement with the test results.
7 DOI: 10.17185/duepublico/48887
The problems (large mechanical losses, not maintained steady test conditions, low data sampling rate, etc.) were encountered during the test and developmental processes. We plan to revise and improve the test facility and turbine with upgrading a DAQ system, installing a dynamometer system and a balancing piston, modification of the oil system. In addition, we have a plan to test the turbine inlet temperature up to 500 ° C by the end of 2019 through improved test equipment.
NOMENCLATURE C velocity
c chord
ks equivalent sand grain
h height
m mass flow rate
N rotational speed
PR pressure ratio
P pressure
Pw power
U rotational speed
T temperature
η efficiency
SUBSCRIPTS DP design point
S static
0S isentropic
T total
TC tip clearance
TT total to total
ACKNOWLEDGEMENTS This work was conducted under the framework of
Research and Development Program of the Korea Institute of Energy Research (KIER) (B9-2432, B9-2461).
REFERENCES [1] Wright, S. A., Conboy, T M. and Rochau, G. E. (2011). Overview of Supercritical CO2 Power Cycle Development at Sandia National Laboratories. University Turbine Systems Research Workshop.
[2] Brun, K., Friedman, P., Dennis, R. (2017). Fundamentals and Applications of Supercritical Carbon Dioxide (SCO2) Based Power Cycles. Woodhead Publishing, Oxford, pp. 1~21. [3] Wright, S. A., Radel, R. F., Vernon, M. E., Rochau, G. E., Pickard, P. S., 2010). Operation and analysis of a supercritical CO2 Brayton cycle. SANDIA REPORT 2010, SAND2010-0171. [4] Pasch, J., Conboy, T., Fleming, D., Rochau, G. (2012). Supercritical CO2 recompression Brayton cycle: completed assembly description. SANDIA REPORT 2012, SAND2012-9546. [5] Conboy, T., Wright, S. A., Pasch, J., Fleming, D., Rochau, G., Fuller, R. (2012). Performance characteristics of an operating supercritical CO2 Brayton cycle. Journal of Engineering for Gas Turbines and Power, 134(111703), pp. 1-12. [6] Conboy, T., Pasch, J., Fleming, D. (2013). Control of a supercritical CO2 recompression Brayton cycle demonstration Loop. Journal of Engineering for Gas Turbines and Power, 135(111701), pp. 1-12. [7] Clementoni, E. M., Cox, T. L. (2014). Steady-state power operation of a supercritical CO2 Brayton cycle. Proceedings of ASME Turbo Expo 2014, Dusseldorf, Germany, June 16-20 2014, GT2014-25336. [8] Clementoni, E. M., Cox, T. L. (2014). Practical aspects of supercritical CO2 Brayton system testing. Proceedings of the 4th International Symposium-Supercritical CO2 Power Cycles, Pittsburgh, Pennsylvania, September 9-10. [9] Clementoni, E. M., Cox, T. L. (2014). Steady-state power operation of a supercritical CO2 Brayton cycle. Proceedings of the 4th International Symposium-Supercritical CO2 Power Cycles, Pittsburgh, Pennsylvania, September 9-10. [10] Utamura, M., Hasuike, H., Ogawa, K., Yamamoto, T., Fukushima, T., Watanabe, T., Himeno, T. (2012). Demonstration of supercritical CO2 closed regenerative Brayton cycle in a bench scale experiment. Proceedings of ASME Turbo Expo 2012, Copenhagen, Denmark, June 11-15, GT2012-68697. [11] Moore, J., Brun, K., Evans, N., Bueno, P., Kalra, C. (2014). Development of a 1 MWe supercritical CO2 Brayton cycle test loop. The 4th international symposium-Supercritical CO2 power cycles, September 9-10, Pittsburgh, Pennsylvania. [12] Held, T.J. (2014). Initial test results of a megawatt-class supercritical CO2 heat engine. The 4th international symposium-Supercritical CO2 power cycles, September 9-10, Pittsburgh, Pennsylvania. [13] Cho, J., Choi, M., Baik, Y., Lee, G., Ra, H., Kim, B., Kim, M. (2016). Development of the turbomachinery for the supercritical CO2 power cycle. International Journal of Energy Research 2016, 40(587-99). [14] Cho, J., Shin, H., Ra, H., Lee, G., Roh, C., Lee, B., Baik, Y. (2016). Development of the supercritical carbon dioxide power cycle experimental loop in KIER. Proceedings of ASME Turbo Expo 2016, Seoul, South Korea, June 13-17, GT2016-57460. [15] Shin, H., Cho, J., Baik, Y-J., Cho, J., Roh, C., Ra, H-S., Kang, Y., Huh, J. (2017). Partial admission, axial impulse type turbine design and partial admission radial turbine test for

8 DOI: 10.17185/duepublico/48887
SCO2 cycle. Proceedings of ASME Turbo Expo 2017: Turbomachinery Technical Conference and Exposition, GT2017-64369, June 26-30, 2017, Charlotte NC. [16] Fleming, D., Conboy, T., Pash, J., Rochau, G., Fuller, R., Holschuh, T., Wright, S. (2013). Scaling considerations for a mulit-megawatt class supercritical CO2 Brayton cycle and commercialization. Sandia National Laboratories, Albuquerque, NM. [17] ANSYS® (2017). ANSYS CFX User Guide, Release 18.1. ANSYS, lnc. [18] Menter, F. (1994). Two-equation eddy-viscosity turbulence model for engineering applications. AIAA Journal, 32(8), pp. 1598-1605. [19] Kohl, R., Herzig, H. and Whitney, W. (1949). Effects of partial admission performance of a gas turbine. NACA Technical Note, No. 1807, Lewis Flight Propulsion Laboratory. [20] Coleman, H.W., and Steele, W.G. (1999). Experimentation and uncertainty analysis for engineers, 2nd Ed., John Wiley & Sons, New York
This text is made available via DuEPublico, the institutional repository of the University ofDuisburg-Essen. This version may eventually differ from another version distributed by acommercial publisher.
DOI:URN:
10.17185/duepublico/48887urn:nbn:de:hbz:464-20191002-175724-2
This work may be used under a Creative Commons Attribution 4.0License (CC BY 4.0) .
Published in: 3rd European sCO2 Conference 2019