development of low carbon society scenarios for iskandar...
TRANSCRIPT

JST-JICA 2010 Technical Cooperation Project
UTM, IRDA, PTHM and JPBD Malaysia Kyoto U, Okayama U and NiES Japan
Development of Low Carbon Society
Scenarios for Iskandar Malaysia AIM workshop
Pullman Hotel Bangkok Nov 19, 2010

Planning Tools for LCS (2010) 2
On going Region specific studies
Communication and feedbacks of LCS study to real world

POINTS OF DISCUSSION
• Development LCS sustainable future – Political will and Institutional commitment
– Modeling experts – External and internal
• Research sponsorship and expertise SATREPS project
• How to communicate research project with stakeholders/ Policy makers
• What are the current sustainable issues ?
- to obtain view points from policy makers and implementing agency of the
research project.
3/9

LCS Scenario development
• Development LCS sustainable future
– Quantification of variables
– Modeling experts – External and internal
– Vision - Political will and Institutional commitment
4/9

MALAYSIA: KEY ECONOMIC DEVELOPMENT CORRIDORS
IM NCER
ECER
SCORE SDC
Why IM?

6
• The 2011 Budget, with the aim to position Malaysia
as a developed and high-income economy with
inclusive and sustainable development, will continue
to ensure that the most conducive socio-
economic environment is created through the
Government Transformation Programme (GTP) to
underpin growth.
The 10th Malaysia Plan Building an environment that enhances Quality
of Life New urbanism and compact city Growth concentrated in urban conurbation Safe city initiatives Developing climate resilient growth policy Adaptation measures Mitigation measures Incentives for RE and EE Improving Solid waste management Conserving forest Reducing emission to improve air quality
1 MALAYSIA CHARTING DEVELOPMENT
TOWARDS A HIGH INCOME NATION
NATIONAL VISION

COP 15 – Malaysia’s target
• Prime Minster of Malaysia, Y.A.B Dato’ Sri Mohd Najib bin Tun Abdul Razak, in COP15 last year at Copenhagen, Denmark, proposed to reduce CO2 emission intensity in Malaysia to 40 per cent by the year 2020 compared with its 2005 levels, subject to assistance from developed countries.
•
7/9
COP15 on Dec 17, 2009 at Copenhagen, Denmark

CASE STUDY –ISKANDAR MALAYSIA
8

Iskandar
Development
Region
Case study
Iskandar Development Region
2,216 km2
Population 1,353,200

10
The Iskandar Malaysia Vision Economic Growth
“To develop Iskandar Malaysia into a strong and sustainable metropolis of international standing”
Population 1.4 million 3.1 million
Per capita GDP (RM) 51,765 108,850
GDP (RM) 70 billion 325.5 billion
Employment 0.610 million 1.428 million
Year 2005 Projected (2025)

Socio Economic Scenario of IM 222005 2025 2025/2005
Population 1,353,200 3,005,815 2.2
No. of households 317,762 751,454 2.4
GDP (mil RM) 37,641 176,224 4.7
GDP per capita (RM/capita) 27,817 58,628 2.1
Gross output (mil RM) 121,431 474,129 3.9
Primary industry (mil RM) 1,860 5,375 2.9
Secondary industry (mil RM) 83,502 263,444 3.2
Tertiary industry (mil RM) 36,069 205,309 5.7
Floor space for commercial (mil m2) 6.8 19.3 2.8
Offices 1.3 1.7 2.9
Shops 5.7 16.3 2.9
Hospitals & Schools 0.6 1.2 2.1
Passenger transport demand (mil p-km) 3,816 8,677 2.3
Freight transport demand (mil t-km) 1,652 5,303 3.1 11

12
LCS scenario study using ExSS
Trip per person
Trip distance
Wage Income
Export by goods
Government expenditure
Investment
Import ratio
Input coefficient matrix
Labor productivity Labor participation ratio
Household size
Consumption
pattern
Demographic composition
Taxation and
social security
Floor area per output
Freight generation per
output
Transport distance
Modal share
Modal share
Energy service demand
per driving force
Fuel share
Energy efficiency
CO2 emission factor
IO
analysis Output by
industry
Consumption
Labor demand Population
Number of
household
Output of
commercial
industry
Commercial
building floor
area
Freight
transport
demand
Passenger
transport
demand
Population
Energy demand
CO2 emission
Output of
manufacturing
industry
Carbon sink
Methodology developed by Shimada et.al (2006), Gomi et. Al (2007)

232%
Energy Demand By Sector
Energy demand in IM is projected to increase from 3,286 ktoe (toe: tonne oil equivalent) in 2005 to 10,936 ktoe in 2025 for the BaU case (BaU: business as usual)
Industry is expected to be 6,635 ktoe and will maintain the largest share of 61%.
13
240 1,091 649 382
978 685 1,733
6,635
3,494
359
790
253
572
1,442
834
0
2,000
4,000
6,000
8,000
10,000
12,000
2005 2025 BaU 2025 CM
Energ
y d
em
an
d (
kto
e)
.
Freight transport
Passengertransport
Industry
10,936
5,915
3,286

1,729
4,978
788
1,209
3,854
3,694
447
193
60
61
33
289
1,844
964
0
2,000
4,000
6,000
8,000
10,000
12,000
2005 2025 BaU 2025 CM
Energ
y d
em
an
d (
kto
e)
.
Coal
Hydro power
Solar & windpowerBiomass
Energy Demand by Energy Sources
14
Increase in demand for natural gas (3.2 times) the consumption in 2005.
Energy sources such as biomass, solar and wind power will be newly introduced for primary energy in 2025 CM case.

15
1,468 7,715
2,972 2,419
7,195
3,802 6,035
24,832
10,897 1,015
1,672
447
1,615
4,070
1,481
0
5,000
10,000
15,000
20,000
25,000
30,000
35,000
40,000
45,000
50,000
2005 2025 BaU 2025 CM
GH
G e
mis
sio
ns (
ktC
O2)
.
Freight transport
Passengertransport
Industry
Commercial
45,484
19,589
12,552
GHG Emissions in IM are projected to increase from 12,552 ktoe CO2 (2005) to 45,484 ktoe CO2 (2025 BaU)
Industry Sector will increase 4.1 times in total as compared to 2004 in GHG emission . (54%of total GHG emission in 2025 BaU)
GHG emissions per capital : 9.3 tonnes of CO2 /capita (2005) to 15.1 tonnes /capita (2025 BaU ), with CM will be reduced to 6.5 tonnes of CO2/capita.
GHG Emission By Sector

Potential Mitigation in IM
16
12552
45483
19162
4463
10831
777 3510
5521
623
0
5,000
10,000
15,000
20,000
25,000
30,000
35,000
40,000
45,000
50,000
2005 2025 BaU 2025 CM
GH
G e
mis
sio
ns
/re
du
cti
on
s (
kt-
CO
2)
Transport demand management
Fuel shifting
Efficiency improvement (buildings)
Efficiency improvement (transport)
Efficiency improvement (industry)
Efficiency improvement (powersector)
GHG emissions
Em
issio
n R
ed
uctio
ns
57%
262%
52%

17
Mitigation measures and policies for buildings
(residential and commercial)
Energy-efficient
buildings
Mitigation of GHG emissions from
Residential and Commercial sector
Energy efficiency improvement
of equipments
Renewable energy
(PV)
Goal
Measures
Energy efficiency improvement Means Lowering CO2 intensity
Policies
Environmental
performance standard and
evaluation of buildings
Adjustment of tax rate of
fixed asset tax
Low interest loans to
investment to energy
efficient buildings
Environmental
performance standard of
equipments
Environmental labeling
Education and
information service
Green purchasing policy
Subsidy to
introduce
photovoltaic
power generation
system
17

18
Mitigation measures & policies
for transport & land use
Mitigation of GHG emissions from Transport
Compact
city
Renewable energy
(Bio fuel)
Goal
Measures
Means Transport demand
management
Policies
Urban planning
Transport planning
Tax rate adjustment to fixed asset
Investment to public transport
Lowering CO2
intensity
Public transport
(bus & train)
Energy efficiency
improvement
Environmental performance
standard of vehicles
Tax rate adjustment to energy
efficient vehicles
Promotion of bio fuel
Energy efficient
vehicles
18

19
Mitigation measures & policies for industry
Operation
improvement
Mitigation of GHG emissions from
Primary & Secondly industries
Energy efficiency
improvement of
equipments
Increasing share
of natural gas
Goal
Measures
Energy efficiency
improvement Means Lowering CO2
intensity
Policies
Subsidy to investment to energy
efficient equipments
Promotion of technology transfer
Low interest loans to investment to
energy efficient equipments 19
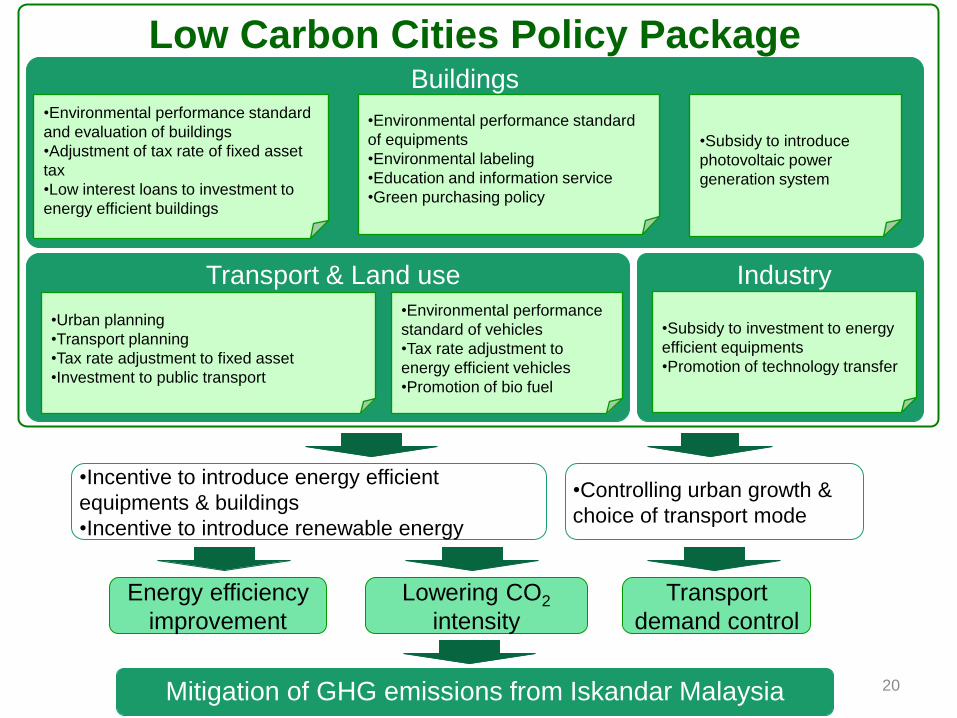
Mitigation of GHG emissions from Iskandar Malaysia
Energy efficiency
improvement
Lowering CO2
intensity
Transport
demand control
•Incentive to introduce energy efficient
equipments & buildings
•Incentive to introduce renewable energy
•Environmental performance standard
and evaluation of buildings
•Adjustment of tax rate of fixed asset
tax
•Low interest loans to investment to
energy efficient buildings
•Environmental performance standard
of equipments
•Environmental labeling
•Education and information service
•Green purchasing policy
•Subsidy to introduce
photovoltaic power
generation system
•Urban planning
•Transport planning
•Tax rate adjustment to fixed asset
•Investment to public transport
•Environmental performance
standard of vehicles
•Tax rate adjustment to
energy efficient vehicles
•Promotion of bio fuel
•Subsidy to investment to energy
efficient equipments
•Promotion of technology transfer
Buildings
Transport & Land use Industry
Low Carbon Cities Policy Package
•Controlling urban growth &
choice of transport mode
20

Mitigation Measures
21

RESEARCH PROJECT SPONSOR
• SATREPS PROJECT
• STAKEHOLDERS
– IRDA
– TOWN AND COUNTRY PLANNING DEPARTMENT
– MALAYSIAN GREEN TECHNOLOGY CORPORATION
– UTM
22/9

Planning Tools for LCS (2010) 23
What is the SATREPS (Science and Technology Research Partnership for Sustainable Development )
• SATREPS is a research program intending to promote international joint research through collaborating Japan’s advanced S&T and Official Development Assistance (ODA), as a symbol of promoting Science and Technology Diplomacy. It is conducted in collaboration between JST and JICA supported by Ministry of Education, Culture, Sports, Science and Technology (MEXT) and Ministry of Foreign Affairs (MOFA), Japan.
• This program is to entails promotion of international joint research targeting global issues and envisaging future utilization of research outcomes.
• Implemented through collaboration with Official Development Assistance (ODA), the aim of the program is to acquire new knowledge leading to resolution of global issues.
• Such international joint research under the program will also address the research and development of capacity and contribute to the sustained research activities in developing countries.

Kyoto University
Chief: Yuzuru MATSUOKA
National Institute for Environmental Studies
Chief: Mikiko KAINUMA
Okayama University
Chief: Takeshi FUJIWARA
Universiti Teknologi
Malaysia
Chief:Ho Chin Siong
• Data collection of Iskandar Malaysia, Information collection and
database development of Low-carbon options in Malaysia
• Capacity building of Malaysian officers
• Methodology to create LCS scenarios which is appropriate for Malaysia is developed.
• LCS scenarios are created and utilized for policy development in IM.
• Co-benefit of LCS policies on air pollution and on recycling-based society is quantified in IM.
• Organizational arrangement of UTM to conduct trainings on LCS scenarios for Malaysia and Asian countries is consolidated,
and a network for LCS in Asia is established.
• Capacity building and technology transfer to researchers and government officers in developing and newly emerging countries
through development of low-carbon city scenarios
• Developing a network between researchers and government officers those who are studying or in charge of low-carbon policy in
Asia
• Share the models and tools developed in this study and findings from the experience internationally through institutions such as
IPCC
• Necessity of drastic reduction of national GHG
emissions
• Necessity of scenarios/roadmaps for achieving
LCS at local/city level
• Solving environmental and social problems
associated with rapid economic growth
Joint study with Malaysia Needs of Malyasia
• General management of research activity
• Development & improvement of models for estimating LCS visions
and roadmaps
• Developing models, estimation and quantification of co-benefit of
mitigating air pollution
Output
Outcome, impact
• Consolidating organizational arrangement of UTM to
conduct trainings on LCS scenarios for Malaysia and
Asian countries
• Establishi Network for LCS in Asia
• Quantitative estimation of GHG emissions from
waste management
• Development and proposal of waste
management plan which is consistent with the
LCS scenario
• Iskandar Regional Development Authority (IRDA)
• Town and Country Planning Department (JPBD)
• Malaysia Green Technology Corporation (PTHM)
Collaborators in
Malaysia

GANTT CHART
25/9
Sub theme and Research Activities 1st Year 2nd Year 3rd Year 4th Year 5th Year
1. Development of Low Carbon Society Scenario in Asian Cities
1-1 Description of national level long-term low carbon society scenario
1-2 Evaluation of energy systems as counter measures
1-3 Development of low carbon society vision of regional / city level for 2030
, Iskandar (Malaysia)
1-4 Development of the policy road map toward low carbon society by back casting
model (BCM)
2. Quantitative estimation of the ancillary benefit of a low carbon society policies
2-1 Quantitative estimation of the mitigation effect to the urban air pollution impact
by a low carbon society policies
2-2 Optimization of solid waste management and quantitative estimation of
co-benefit which suit with a low carbon society scenarios
2-3 Model development and quantitative estimation on conquest of poverty and
other social problem relevant to low carbon society policies
3. Detail analysis for policy implementation, and capacity building
3-1 Compilation of the manual for development of low carbon city scenarios
3-2 Implementation of the low carbon policies by collaboration with a local
authorities.
3-3 Organization of Asian Low Carbon City Network
Completion of a long-term scenario
Completion of a middle-term scenario
Completion of an option database
Completion of a policy road map
Completion of concrete policies
The proposal of waste managementsystem
Quantitative estimation of the ancillary benefit to a social problem
Quantitative estimation of the ancillary benefit to air pollution
The organization of the Network
Completion of a manual

Project Purpose
• To develop Methodology for creating Low-Carbon Society scenarios
• To apply research findings and use the methodology and in Malaysia, and also to disseminate the ideas to other Asian countries.
26/9

2.0 Outputs
• To develop Methodology to create LCS scenarios which is appropriate for Malaysia
• To create LCS scenarios and incorporate LCS in the development plan for policy implementation in IM.
• To quantify the Co-benefit of LCS policies on air pollution and recycling-based society in IM.
• to conduct trainings on LCS scenarios in UTM for urban managers/researchers from Malaysia and other Asian countries
• To establish a network for LCS in Asia
27/9
28
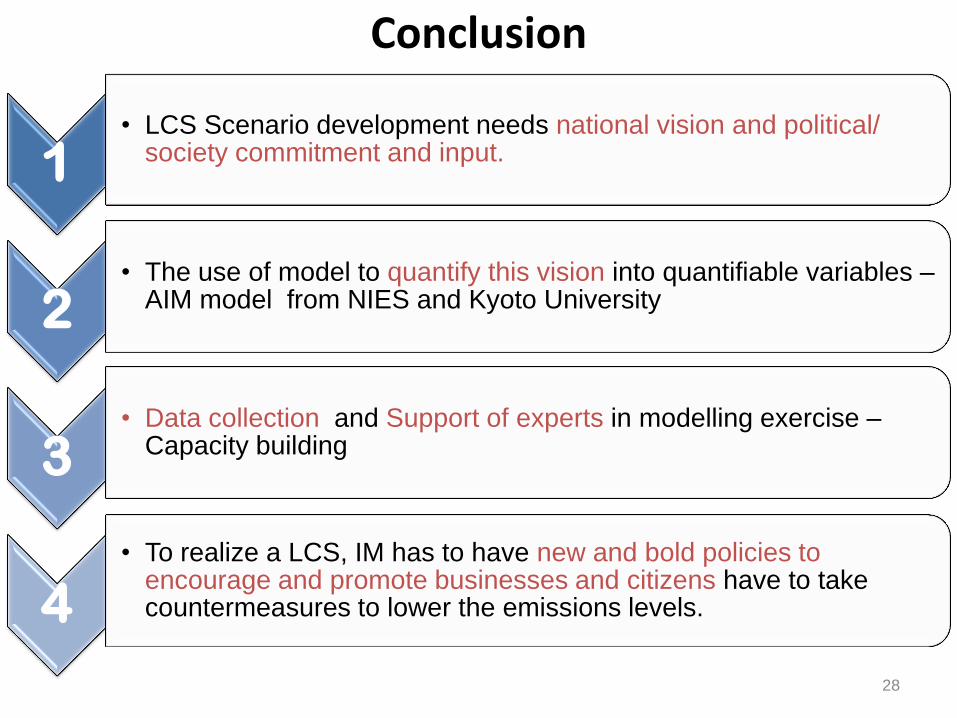
Conclusion
1 • LCS Scenario development needs national vision and political/
society commitment and input.
2 • The use of model to quantify this vision into quantifiable variables –
AIM model from NIES and Kyoto University
3 • Data collection and Support of experts in modelling exercise –
Capacity building
4 • To realize a LCS, IM has to have new and bold policies to
encourage and promote businesses and citizens have to take countermeasures to lower the emissions levels.

THANK YOU FOR THE ATTENTION.
29 29