development of novel advanced flow control...
TRANSCRIPT
Development of Novel Advanced
Flow Control Systems on
Centrifugal Microfluidic
Platforms for Nucleic Acid
Testing
Jennifer Gaughran, B.Sc. (Hons)
School of Physical Sciences
Dublin City University
A thesis submitted to Dublin City University for the degree of
Doctor of Philosophy (Ph.D.)
Research Supervisor
Prof. Jens Ducrée
January 2016

ii
Declaration
I hereby certify that this material, which I now submit for assessment
on the programme of study leading to the award of Doctor of Philosophy,
is entirely my own work, and that I have exercised reasonable care to
ensure that the work is original, and does not to the best of my
knowledge breach any law of copyright, and has not been taken from the
work of others save and to the extent that such work has been cited and
acknowledged within the text of my work.
Signed: _______________________________
ID No.:57530978
Date: ______________________
iii
For my parents,
Sandra and Stephen

iv
Acknowledgements
There are so many people I would like to thank and inevitably
many more that I have forgotten at this moment. I can only hope that
they know they are greatly appreciated.
First of all, I would like to thank my supervisor Prof. Jens Ducrée
for giving me the opportunity to work in his group and for the advice
and direction during my PhD.
My sincerest thanks to all the Microfluidics Group, past and
present, who helped me along the way and made my time working in our
lab so enjoyable. I’d particularly like to thank Nikolay for all his help
and advice at the beginning of my PhD, Charles and Macdara for their
highly useful insights and Lorcan for always having the answer to my
questions. Special mention must go to Dave Kinahan, who not only proof
read this document for me, but has been my sounding board and shared
with me his considerable knowledge, as well as some excellent book
recommendations.
I have to thank all the highly talented students who worked with
me during their internships with the microfluidics group. Their
enthusiasm and help with building all those discs will be forever
appreciated. I would especially like to thank Dave Boyle who is one of
the hardest workers I have ever met and has a very bright future.
v
Thank you to all those in the Biomedical Diagnostics Institute
who I worked with in my time in DCU, particularly to the members of
S252 for keeping me company during my long hours at the spin stand.
Many thanks to Declan McGlade for answering my endless
stream of questions when I began my work with graphene oxide.
Thank you to all the members of the DCU School of Physics who
have been such a huge part of my time in DCU. My sincerest thanks to
Prof. Enda McGylnn and Prof. Colette McDonagh for their excellent
advice and for always having an open door. Thanks to the technical and
administrative staff in the School, in particular Lisa for always knowing
where the form was supposed to go and for the excellent Christmas
parties.
I am very grateful to the entire Bio-AT team, in particular
Christine, Joan and Jane, for not only giving me this opportunity but for
all the support and encouragement throughout my entire PhD. They
also introduced me to all the other Bio-AT students, who I would also
like to thank both for their friendship and for answering all my biology
questions. I’d particularly like to thank Tríona for all of her support and
help.
Thanks to all the postgrads in my office for their friendship of the
last few years and for making every day fun. There are too many to
name but I will mention Dan, Stephen, Paul, May, Danielle, Éanna and
Leanne.
vi
I’ve made and managed to hang onto some of the best friends
during my PhD and I would like to sincerely thank them for their
support. To Damien, who started out as a friend and became much more,
thank you for the support and the laughter. To Mary and Sam, thank
you for feeding me and for all the chats. To Ciarán, thank you for your
friendship and for answering all my ‘what now’ questions. Finally, a
specially mention must go to Adam, who has been my friend, roommate
and sounding board for the past four and a half years. Thank you for
listening to me give the same talks over and over again and for the
many nights of TV watching and tea.
And most of all special thanks go to my family. To my brothers
Glenn and Matthew, who have given me great support for years and
who have always been there for me. To Eileen and Jonathan, for their
constant encouragement and always telling me ‘you’ll get there’.
Most of all I would like to thank my parents, without whom none
of this would have been possible. They believed in me every step of the
way and they showed me there was nothing I couldn’t do. I am eternally
grateful for everything you have done for me and for the constant,
unwavering support. As promised, I dedicate this one to the both of you.

vii
Table of Contents
Acknowledgements ................................................................................ iv
Table of Contents ................................................................................. vii
Glossary…. ............................................................................................ xiv
List of Figures ...................................................................................... xvi
List of Tables ........................................................................................ xix
List of Publications ............................................................................... xx
Awards….. .......................................................................................... xxvii
Abstract…. ......................................................................................... xxviii
Chapter 1 Introduction .......................................................................... 1
1.1 Overview .............................................................................. 1
1.1.1 Point of Care Diagnostics ............................................... 1
1.1.2 Technological Advancements in POC Systems ............. 3
1.2 Motivations and Objectives ................................................. 5
1.3 Centrifugal Microfluidics ..................................................... 6
1.4 Microfluidic Flow Control .................................................... 8
1.4.1 Passive Valving .............................................................. 9
1.4.1.1 Capillary valving .................................................... 10
1.4.1.2 Hydrophobic valving .............................................. 12
1.4.1.3 Siphon valving ........................................................ 12
1.4.2 Active Valving using Functional Materials ................ 13
1.4.3 Routing ......................................................................... 15
viii
1.4.4 Pumping ........................................................................ 16
1.4.5 Mixing ........................................................................... 17
1.4.6 Metering ....................................................................... 18
1.5 Nucleic Acid Testing in Microfluidics ............................... 18
1.5.1 Nucleic Acids ................................................................ 19
1.5.2 Nucleic Acid Testing Stages ......................................... 20
1.5.2.1 Extraction ............................................................... 20
1.5.2.2 Purification ............................................................. 21
1.5.2.3 Detection ................................................................. 22
1.5.3 Microfluidic Advancements in NA Testing ................. 23
1.6 Outline of Thesis ................................................................ 24
Chapter 2 Materials and Methods ..................................................... 27
2.1 Fabrication of Parts ........................................................... 27
2.1.1 Materials ....................................................................... 28
2.1.2 Fabrication Processes ................................................... 29
2.1.2.1 Laser Machining .................................................... 30
2.1.2.2 CNC Machining ...................................................... 32
2.1.2.3 Knife Cutting .......................................................... 34
2.1.2.4 3D Printing ............................................................. 35
2.1.3 Cleaning Procedure ...................................................... 35
2.1.4 Assembly ....................................................................... 36

ix
2.2 Biological Sample Preparation .......................................... 38
2.2.1 Bacterial Cell Culture .................................................. 38
2.2.2 DNA Purification Procedure ........................................ 38
2.3 Testing ................................................................................ 42
2.4 Characterisation Techniques ............................................ 43
2.4.1 Disc Analysis ................................................................ 43
2.4.1.1 3D Microscope ........................................................ 44
2.4.1.2 Scanning Electron Microscopy............................... 44
2.4.2 Bioanalysis.................................................................... 46
2.4.2.1 BioAnalyzer ............................................................ 46
2.4.2.2 Nanodrop ................................................................ 47
2.4.2.3 Fluorescence Detection of DNA ............................. 49
2.4.2.4 Cell Counting ......................................................... 51
2.5 Conclusion .......................................................................... 53
Chapter 3 Solvent Selective Router for Centrifugally Automated
Solid-Phase Purification of RNA ....................................................... 54
3.1 General Introduction ......................................................... 54
3.2 Working Principle .............................................................. 56
3.2.1 Valve Design ................................................................. 56
3.2.2 Proof-of-Principle Router ............................................. 58
3.2.3 Combination Valve ....................................................... 60

x
3.3 Router for RNA Extraction ................................................ 64
3.3.1 System Design .............................................................. 64
3.3.2 Fluidic Operation ......................................................... 66
3.4 Materials and Methods ...................................................... 68
3.4.1 Disc Fabrication and Assembly ................................... 68
3.4.2 MCF7 Cell Culture ....................................................... 69
3.4.3 Benchtop Lysis and RNA Extraction ........................... 70
3.5 Results and Discussion ...................................................... 71
3.5.1 Fluidic Analysis ............................................................ 71
3.5.2 On-disc RNA Purification ............................................ 74
3.6 Automated Solvent-Selective Routing .............................. 80
3.7 Conclusions ........................................................................ 82
Chapter 4 Characterisation of Graphene Oxide Membrane
Properties for Advanced Microfluidic Flow Control .................... 83
4.1 General Introduction ......................................................... 83
4.2 Graphene Oxide Tab Fabrication ...................................... 86
4.2.1 Measuring the Thickness of a GO Tab ........................ 88
4.3 Investigation of GO Properties .......................................... 91
4.3.1 Air Impermeability ....................................................... 92
4.3.2 Solvent Selectivity ........................................................ 95
4.3.3 GO Wetting Capabilities .............................................. 98

xi
4.3.4 Characterisation of GO Tabs ..................................... 101
4.4 Conclusions ...................................................................... 104
Chapter 5 Graphene Oxide Enabled Centrifugo-Pneumatic
Routing of Flows for Nucleic Acid Purification ........................... 105
5.1 General Introduction ....................................................... 105
5.2 System Design .................................................................. 107
5.2.1 Evolution from First Design ...................................... 107
5.2.2 Working Principle ...................................................... 110
5.3 Materials and Methods .................................................... 113
5.3.1 Disc Fabrication and Assembly ................................. 113
5.3.2 DNA Preparation........................................................ 114
5.4 Results and Discussion .................................................... 115
5.4.1 Fluidic Operation ....................................................... 115
5.4.2 On-disc DNA Purification .......................................... 118
5.4.2.1 DNA Interaction with GO Membrane ................. 119
5.4.2.2 DNA Solid Phase Purification using GO Router 120
5.5 Conclusions ...................................................................... 124
Chapter 6 Event-triggered Graphene Oxide Router for
Automated Nucleic Acid Purification ............................................ 125
6.1 General Introduction ....................................................... 125
6.1.1 Event-triggered Valving Mechanisms ....................... 126
6.2 System Design .................................................................. 127

xii
6.2.1 Evolution from first design ........................................ 127
6.2.2 Working Principle ...................................................... 131
6.3 Materials and Methods .................................................... 135
6.3.1 Disc Fabrication and Assembly ................................. 135
6.3.2 DNA Preparation........................................................ 137
6.4 Experimental Results ...................................................... 137
6.4.1 Fluidic Operation ....................................................... 137
6.4.2 On-disc Automated DNA Purification ....................... 142
6.5 Discussion ........................................................................ 143
6.6 Conclusion ........................................................................ 146
Chapter 7 Nucleic Acid Extraction Systems ................................. 147
7.1 General Introduction ....................................................... 147
7.2 Fluid-fluid Extraction of Total RNA ............................... 147
7.2.1 Evolution of System Design ....................................... 149
7.2.2 Working Principle ...................................................... 152
7.2.3 Materials and Methods .............................................. 155
7.2.3.1 Disc Fabrication ................................................... 155
7.2.3.2 Off-Chip Sample Processing ................................ 156
7.2.4 Results and Discussion .............................................. 157
7.2.4.1 Fluidic Validation ................................................ 157
7.2.4.2 Mixing Test........................................................... 159
xiii
7.2.4.3 TRI Reagent Extraction Test ............................... 160
7.2.4.4 Biological Analysis ............................................... 162
7.2.4.5 Inconsistency in Milling Technology ................... 164
7.2.4.6 Event-triggered µHomogenizer System .............. 166
7.3 Mechanical Cell Lysis of Nucleic Acids ........................... 171
7.3.1 System Design ............................................................ 173
7.3.2 Working Principle ...................................................... 175
7.3.3 Bio-Analysis Possibilities ........................................... 178
7.4 Conclusion ........................................................................ 179
Chapter 8 Conclusion and Future Work ........................................ 180
8.1 Conclusions ...................................................................... 180
8.2 Future Work ..................................................................... 183
8.2.1 Further Investigation of GO Capabilities ................. 184
8.2.2 Increase of NA Purification Yield .............................. 184
8.2.3 NA Extraction Advancement ..................................... 186
8.2.4 Design of Full Sample-to-Answer System ................. 186
References............................................................................................. 188
Appendix A: List of Materials and Manufactures ........................ 200
xiv
Glossary
µTAS micro Total Analysis Systems
ADF Aqueous Dissolvable Film
ADF Annular Dark-Field
AFM Atomic Force Microscopy
BF Bright-field
BSE Backscattered Electrons
cDNA Complimentary DNA
CFU Colony Forming Units
CNC Computer Numerical Control
COP Cyclo-olefin polymer
CVD Chemical Vapour Deposition
DF Dissolvable Film
DF Dissolvable Film
DFV Dissolvable Film Valve
DMEM Dulbecco's Modified Eagle Medium
DNA Deoxyribonucleic acid
dsDNA Double Stranded DNA
DXF Drawing eXchange Format
Eaq Elute Collection Chamber
EB Elution Buffer
EDTA Ethylenediaminetetraacetic acid
EGOR Event-triggered Graphene Oxide Router
EtOH Ethanol
GO Graphene Oxide
HM Hydrophobic Membrane
HMV Hydrophobic Membrane Valve
IPA Isopropanol
L Loading Chamber
LAMP Loop-mediated isothermal amplification
xv
LB Luria-Bertani
LE Elution Loading Chamber
LO Organic Loading Chamber
LoaD Lab-on-a-Disc
LS Sample Loading Chamber
LUOs Laboratory Operating Units
n Number of repeats
NA Nucleic Acid
NC Numerical Control
ODF Organic Dissolvable Film
PCR Polymerase Chain Reaction
PDMS Poly(dimethylsiloxane)
PMMA Poly(methyl methacrylate)
POC Point of Care
PSA Pressure Sensitive Adhesive
PTFE Polytetrafluoroethylene
qPCR Real-time PCR
RIN RNA Integrity Number
rRNA ribosomal RNA
RT-PCR Reverse Transcription PCR
S/N Signal to Noise
SE Secondary Electrons
SEM Scanning Electron Microscope
SPP Solid Phase Purification
ssDNA Single-stranded DNA
TE Buffer Tris EDTA Buffer
TRI Trizol
Tris Trisaminomethane
Waq Aqueouse Waste Chamber
Worg Organic Waste Chamber
xvi
List of Figures
Figure 1.1 Example of technological advancements in POC
diagnostics……………………………………….......... 4
Figure 1.2 Example of simple method of flow control………… 9
Figure 1.3 Microfluidic valving systems………………………... 10
Figure 1.4 Centrifugo-Pneumatic DF valving…………………. 14
Figure 1.5 Operation of pneumatic pump…………………….... 17
Figure 2.1 Example of assembly process using hard polymer. 30
Figure 2.2 Equipment used for microfluidic disc fabrication.. 31
Figure 2.3 Equipment used for microfluidic disc assembly…. 37
Figure 2.4 Protocol of purification of DNA using QIAquick®
PCR Purification kit. ............................................... 39
Figure 2.5 Comparison of standard Buffer PE volume versus
reduced Buffer PE volume…………………………... 41
Figure 2.6 Test point set-up……………………………………… 42
Figure 2.7 Image of uneven cut of PSA channel………………. 43
Figure 2.8 Typical absorbance spectra of nucleic acid……….. 48
Figure 2.9 Droplet stretched on pedestal of Nanodrop
spectrophotometer to give a 1 mm pathlength…… 49
Figure 2.10 Grid structure of haemocytometer cell counter….. 52
Figure 3.1 Protocol for total RNA isolation from breast
cancer cells (MCF7 cell line) using Trizol regent
(TRI)…………………………………………………….. 56
Figure 3.2 Principle of fluid routing………………………....... 58
Figure 3.3 Routing of aqueous and organic flows using HM
tab……………………………………………………..... 59
Figure 3.4 Combo valve designs……………………………….... 60
Figure 3.5 Working principle of combo valve in simple router
structure……………………………………………….. 62

xvii
Figure 3.6 Working principle of flow router showing fluidic
tests……………………………………………………... 65
Figure 3.7 Exploded view of disc assembly…………………….. 69
Figure 3.8 Spin frequency of the disc versus time for RNA
extraction protocol………………………………….… 72
Figure 3.9 Schematic of the fluidic capacitance, dissolution
of the DF (yellow) and routing of the aqueous
flow……………………………………………………… 74
Figure 3.10 Electropherograms showing solid-phase
purification efficiency on-disc……………………..... 76
Figure 3.11 Electropherogram of the total RNA purified on-
disc from four different aliquots of MCF7 cells….. 79
Figure 3.12 Fluidic operation of automated solvent selective
router…………………………………......................... 81
Figure 4.1 Illustration of the unique properties of GO………. 85
Figure 4.2 Vacuum filtration set-up…………………………….. 86
Figure 4.3 GO tab assembly and characterisation……………. 87
Figure 4.4 Various methods for determining membrane
thickness and variation across the surface……….. 89
Figure 4.5 Design for measuring GO impermeability to air… 93
Figure 4.6 Design for testing the solvent selectivity of the
GO............................................................................. 96
Figure 4.7 Design for testing the GO wetting capability…….. 98
Figure 4.8 Effect of wetting GO tab on its air impermeability
and mechanical strength…………………………….. 100
Figure 4.9 Change in burst pressure required for the
passage of fluid with varying water
concentrations in IPA………………………………… 102
Figure 4.10 Change in burst pressure required for the
passage of 100% water with varying membrane
thicknesses…………………………………………….. 103
xviii
Figure 5.1 Evolution of design of centrifugo-pneumatic
router which incorporates a GO router……………. 108
Figure 5.2 Illustration and image of siphon issues…………… 109
Figure 5.3 Working principle of the GO router………………... 112
Figure 5.4 Exploded view of disc assembly............................... 114
Figure 5.5 Spin frequency profile of GO router versus time
for DNA purification protocol……………………….. 116
Figure 5.6 Experiment demonstrating solvent-selective rout-
ing of flows by the phase- and solvent-selective
GO membrane…………………………………………. 118
Figure 5.7 Comparison of DNA interaction with GO
membrane for a range of DNA concentrations…… 120
Figure 5.8 Comparison of normalised DNA signal from SPP
using benchtop spin column setup and GO router. 122
Figure 6.1 Working principle of event-triggered logical flow
control system………………………………………….
127
Figure 6.2 Evolution and component parts of design of
event-triggered GO router…………………………... 128
Figure 6.3 Working principle of the EGOR…………………….. 133
Figure 6.4 Exploded view of EGOR disc assembly……………. 136
Figure 6.5 Spin frequency profile of EGOR versus time for
automated DNA purification protocol……………... 138
Figure 6.6 Stroboscopic image sequence showing the
automated solvent-selective routing of flows…….. 141
Figure 6.7 Comparison of normalised DNA signal from SPP
using benchtop spin column setup and EGOR…… 143
Figure 7.1 Separation of RNA from whole blood procedure…. 148
Figure 7.2 Evolution of design of µHomogenizer from
original design………………………………………… 150
Figure 7.3 Contamination of extracted aqueous phase in
collection chamber……………………………………. 151
Figure 7.4 Working principle of µHomogenizer……………….. 154

xix
Figure 7.5 Exploded view of µHomogenizer disc……………… 156
Figure 7.6 Spin frequency profile of µHomogenizer versus
time……………………………………………………… 158
Figure 7.7 Fluidic mixing validation test of µHomogenizer…. 160
Figure 7.8 Image sequence of aqueous phase extraction from
whole blood using TRI_reagent…………………….. 161
Figure 7.9 Spectra obtained from analysis of E. coli spiked
blood using Nanodrop………………………………... 163
Figure 7.10 Variation in milled siphon depth for three
different discs using CNC milling machine………. 166
Figure 7.11 Design of event-trigger µHomogenizer……………. 167
Figure 7.12 Image sequence of operating principle of event-
triggered µHomogenizer……………………………... 170
Figure 7.13 Schematic of cross-section of flow driven mill……. 172
Figure 7.14 Exploded view of stator rotor disc design…………. 174
Figure 7.15 Schematic of stator rotor disc……………………….. 175
Figure 7.16 Schematic of stator rotor holder which attached
to the spin stand………………………………………. 177
List of Tables
Table 3.1 Summary of electropherogram for the above
samples.…………………………………….................. 76
Table 7.1 Average amount of total RNA extracted from
whole blood spike with E. coli, using
µHomogenizer and conventional benchtop
methods………………………………………………… 162
Table 7.2 Spectrophotometer ratios based on absorbance
values from analysis of E. coli spiked blood........... 162
xx
List of Publications
Papers
1. Jennifer Gaughran, David Boyle, James Murphy, Robert Kelly
and Jens Ducrée. Phase-Selective Graphene Oxide Membranes for
Advanced Microfluidic Flow Control. Nature Microsystems and
NanoEngineering, 2:16008, 2016. Selected as feature article on
journal cover. (Chapter 3)
2. Nikolay Dimov, Eoin Clancy, Jennifer Gaughran, David Boyle,
Darren Mc Auley, Macdara Glynn, Thomas Barry, Louise Barrett,
Terry J. Smith, and Jens Ducrée. Solvent-selective fluid routing
for centrifugally integrated solid-phase extraction of
RNA. Microfluidics & Nanofluidics, 18(5-6):859–871, 2015.
(Chapter 4)
3. Jennifer Gaughran, Robert Kelly and Jens Ducrée. Graphene
Oxide Enabled Centrifugo-Pneumatic Routing of Flows for Nucleic
Acid Purification. [In preparation] (Chapter 5)
4. Jennifer Gaughran, David Kinahan and Jens Ducrée. Event-
triggered Graphene Oxide Router for Automated Nucleic Acid
Purification. [In preparation] (Chapter 6)
5. Jennifer Gaughran, Nikolay Dimov, Eoin Clancy, Barry Glynn,
Thomas Barry, David Kinahan, Terry J. Smith and Jens Ducrée.
Rotationally automated fluid-fluid extraction of total RNA on-disc
for early-stage point-of-care diagnostics from whole blood. [In
preparation] (Chapter 7)
xxi
Conference Manuscripts
1. Jennifer Gaughran and Jens Ducrée. Graphene oxide enabled
centrifugo-pneumatic routing of flows. In Proceedings of the 18th
International Conference on Solid-State Sensors, Actuators
& Microsystems (Transducers 2015), June 21–25, Anchorage,
Alaska, USA, pages 331–334, 2015. (Oral). (Chapter 4)
2. Jennifer Gaughran, David Boyle, James Murphy, and Jens
Ducrée. Graphene oxide membranes for phase-selective
microfluidic flow control. In Proceedings of the 28th IEEE
International Conference on Micro Electro Mechanical Systems
(MEMS 2015), January 18 – 22, Estoril, Portugal, pages 2–4,
2015. (Oral). (Chapter 5)
3. Jennifer Gaughran, Nikolay Dimov, Eoin Clancy, Thomas
Barry, Terry Smith and Jens Ducrée. Multi-stage, solvent-
controlled routing for automated on-disc extraction of total RNA
from breast cancer cell line homogenate. In Proceedings of
the 17th International Conference on Solid-State Sensors,
Actuators & Microsystems (Transducers 2013), June 16–20,
Barcelona, Catalonia, Spain, pages 305–308, 2013. (Chapter 3)
4. Nikolay Dimov, Jennifer Gaughran, Eoin Clancy, Thomas
Barry, Terry Smith, and Jens Ducrée. Automated on-disc total
RNA extraction from whole blood towards point-of-care for early-
stage diagnostics. In Proceedings of the 17th International
Conference on Solid-State Sensors, Actuators & Microsystems
(Transducers 2013), June 16–20, Barcelona, Catalonia, Spain,
pages 2548–2551, 2013. (Oral). (Chapter 7)
5. Nikolay Dimov, Jennifer Gaughran, Darren Mc Auley, David
Boyle, David J. Kinahan, and Jens Ducrée. Centrifugally
automated solid-phase purification of RNA. In Proceedings of the
27th IEEE International Conference on Micro Electro Mechanical

xxii
Systems (MEMS 2014), January 26 – 30, San Francisco,
California, USA, pages 260–263. IEEE, 2014. (Chapter 3)
6. Charles Nwankire, Elizaveta Vereshchagina, Jennifer
Gaughran, Mary O’Sullivan, Nikolay Dimov, Chandra Kumar
Dixit, Maria Kitsara, Lorcan Kent, Gerson Aguirre, Macdara
Glynn, David Kinahan, Robert Burger, Daniel Kirby, and Jens
Ducrée. Multi-force, multi-phase, multi-material, multi-
component, multi-dimensional, multi-scale, multi-functional,
multi-purpose microfluidic lab-on-a-disc platforms.
In Microfluidics Conference 2012 (μFlu’12) – 3rd European
Conference on Microfluidics held in Heidelberg, Germany,
December 03–05, 2012. Long oral presentation. (Chapter 3)
7. Jennifer Gaughran, David Kinahan, Rohit Mishra and Jens
Ducrée. Solvent-selective membranes for automating sequential
liquid release of nucleic acid purification protocols on a simple
spindle motor. [Submitted to 20th International Conference on
Miniaturized Systems for Chemistry and Life Sciences (μTAS
2016), October 9–13, Dublin, Ireland]. (Chapter 6)
8. Jennifer Gaughran, Robert Kelly, David Kinahan, and Jens
Ducrée. Disc-embedded grinding mill towards process-integrated
hydro-mechanical cell lysis on centrifugal microfluidic platforms.
[Submitted to 20th International Conference on Miniaturized
Systems for Chemistry and Life Sciences (μTAS 2016), October 9–
13, Dublin, Ireland]. (Chapter 7)
Book Chapters:
1. Robert Burger, Maria Kitsara, Jennifer Gaughran, Charles
Nwankire, and Jens Ducrée. Novel approaches in immunoassays,
chapter Automation of immunoassays through centrifugal lab-on-
xxiii
a-disc platforms, pages 72–92. Future Science Group, London,
UK, 2014.
2. Rohit Mishra, Jennifer Gaughran, David Kinahan and Jens
Ducrée. Functional membranes for enhanced rotational flow
control on centrifugal microfluidic platforms. Reference Module in
Materials Science and Materials Engineering. Elsevier Inc. [In
preparation, expected publication August ‘16]
Additional Publications during PhD term:
1. Kevin T Sweeney, Edmond Mitchell, Jennifer Gaughran,
Thomas Kane, Richard Costello, Shirley Coyle, Noel E O’Connor
and Dermot Diamond. Identification of sleep apnea events using
discrete wavelet transform of respiration, ECG and accelerometer
signals. Body Sensors Network (BSN), 2013 IEE International
Conference.
2. Monika Czugala, Robert Gorkin III, Thomas Phelan, Jennifer
Gaughran, Vincenzo Fabio Curto, Jens Ducrée, Dermot
Diamond, and Fernando Benito-Lopez. Optical sensing system
based on wireless paired emitter detector diode device and ionogels
for lab-on-a-disc water quality analysis. Lab on a Chip,
12(23):5069–5078, 2012.
3. Charles Nwankire, Di sien S. Chan, Jennifer Gaughran, Tríona
O’Connell, Robert Burger, Robert Gorkin III, and Jens Ducrée.
Fluidic automation of nitrate and nitrite bioassays in whole blood
by dissolvable-film based centrifugo-pneumatic actuation. Sensors,
13(9):11336–11349, 2013.
xxiv
Oral Presentation
1. Jennifer Gaughran and Jens Ducrée. Graphene oxide enabled
centrifugo-pneumatic routing of flows. In Proceedings of the 18th
International Conference on Solid-State Sensors, Actuators
& Microsystems (Transducers 2015), June 21–25, Anchorage,
Alaska, USA, pages 331–334, 2015.
2. Jennifer Gaughran, David Boyle, James Murphy, and Jens
Ducrée. Graphene oxide membranes for phase-selective
microfluidic flow control. In Proceedings of the 28th IEEE
International Conference on Micro Electro Mechanical Systems
(MEMS 2015), January 18 – 22, Estoril, Portugal, pages 2–4,
2015.
3. Nikolay Dimov, Jennifer Gaughran, Eoin Clancy, Thomas
Barry, Terry Smith, and Jens Ducrée. Automated on-disc total
RNA extraction from whole blood towards point-of-care for early-
stage diagnostics. In Proceedings of the 17th International
Conference on Solid-State Sensors, Actuators & Microsystems
(Transducers 2013), June 16–20, Barcelona, Catalonia, Spain,
pages 2548–2551, 2013.
4. Charles Nwankire, Elizaveta Vereshchagina, Jennifer
Gaughran, Mary O’Sullivan, Nikolay Dimov, Chandra Kumar
Dixit, Maria Kitsara, Lorcan Kent, Gerson Aguirre, Macdara
Glynn, David Kinahan, Robert Burger, Daniel Kirby, and Jens
Ducrée. Multi-force, multi-phase, multi-material, multi-
component, multi-dimensional, multi-scale, multi-functional,
multi-purpose microfluidic lab-on-a-disc platforms.
In Microfluidics Conference 2012 (μFlu’12) – 3rd European
Conference on Microfluidics held in Heidelberg, Germany,
December 03–05, 2012.
xxv
5. Jennifer Gaughran and Jens Ducrée. Just a Pinprink: The Next
Generation of Disease Detection. Institute of Physics, Ireland
Frontiers of Physics Conference, Dublin, 2014. Invited speaker.
6. Jennifer Gaughran. Spinning a Yarn: Quick and Easy disease
detection. SFI Annual Summit, Athlone, Ireland 2014. Invited
speaker.
7. Jennifer Gaughran and Jens Ducrée. Micro-opto-fluidic
Biosensors for Advanced Global Diagnostics. Bio-Analysis and
Therapeutics (Bio-AT) Research Day, Royal College of Surgeons
Ireland, June 2012.
8. Jennifer Gaughran and Jens Ducrée. Automated On-Disc Total
RNA Extraction from Whole Blood towards Point-of-Care Early
Stage Diagnosis. Bio-Analysis and Therapeutics (Bio-AT)
Research Day, Dublin City University, June 2014.
Poster Presentations
1. Jennifer Gaughran, Nikolay Dimov, Eoin Clancy, Thomas
Barry, Terry Smith and Jens Ducrée. Multi-stage, solvent-
controlled routing for automated on-disc extraction of total RNA
from breast cancer cell line homogenate. In Proceedings of
the 17th International Conference on Solid-State Sensors,
Actuators & Microsystems (Transducers 2013), June 16–20,
Barcelona, Catalonia, Spain, pages 305–308, 2013.
2. Nikolay Dimov, Jennifer Gaughran, Darren Mc Auley, David
Boyle, David J. Kinahan, and Jens Ducrée. Centrifugally
automated solid-phase purification of RNA. In Proceedings of the
27th IEEE International Conference on Micro Electro Mechanical
Systems (MEMS 2014), January 26 – 30, San Francisco,
California, USA, pages 260–263. IEEE, 2014.

xxvi
3. Jennifer Gaughran and Jens Ducrée. Multi-stage, solvent-
controlled routing for automated on-disc extraction of total RNA
from breast cancer cell line homogenate. Bio-Analysis and
Therapeutics (Bio-AT) Research Day, IT Tallaght, June 2013.
4. Jennifer Gaughran and Jens Ducrée. Graphene Oxide
Membranes for Phase-Selective Flow Control. Bio-Analysis and
Therapeutics (Bio-AT) Research Day, NUI Maynooth, June 2015.
5. Jennifer Gaughran, Nikolay Dimov, Eoin Clancy, Thomas
Barry, Terry Smith, and Jens Ducrée. Multi-stage, solvent-
controlled routing for automated on-disc extraction of total RNA
from breast cancer cell line homogenate. BOC School of Physical
Sciences, Poster Competition, Dublin City University, 2015.
6. Jennifer Gaughran, Nikolay Dimov, Eoin Clancy, Thomas
Barry, Terry Smith, and Jens Ducrée. Multi-stage, solvent-
controlled routing for automated on-disc extraction of total RNA
from breast cancer cell line homogenate. Institute of Physics
Ireland, Annual meeting, Dun Laoghaire, 2014.

xxvii
Awards
1. Winner of the National Thesis in Three 2014 Competition.
2. Winner of the Tell-It-Straight 2014 Competition.
3. Winner Institute of Physics Ireland, Rosse Medal 2014.
4. Outstanding Student Paper Finalist, IEEE International
Conference on Micro Electro Mechanical Systems (MEMS) 2015.
5. 3rd Prize at BOC Physics Poster Presentation Competition 2015.

xxviii
Abstract
Development of Novel Advanced Flow Control Systems on Centrifugal
Microfluidic Platforms for Nucleic Acid Testing
Jennifer Gaughran, B.Sc. (Hons)
In this work the development of novel flow control methods in
centrifugal microfluidic systems for the nucleic acid testing are
demonstrated. Nucleic acids make excellent biomarkers for the
identification of numerous diseases, but their detection is a lengthy and
labour intensive process. Centrifugal microfluidics has emerged as a
highly useful tool in the area of biomedical diagnostics; however there
are still limitations when it comes to sample preparation on these Lab-
on-a-Disc systems. This is especially important in nucleic acid testing,
where the main bottleneck in performing these processes on microfluidic
devices is in sample preparation. Nucleic acid testing can be broken into
three stages; extraction, purification and detection. To this end, this
work outlines the development of two novel centrifugal routing systems
for nucleic acid purification, through the integration of functional
materials. The first is a solvent-selective router which integrated two
solvent specific membrane valves. The capability of the system to purify
total RNA with significant integrity and concentration was shown. The
second system integrated multi-layer Graphene Oxide (GO) membranes
into our Lab-on-a-Disc devices. Using this, two unique properties of the
GO were investigated; its solvent selectivity and air impermeability.
Finally, a novel, centrifugo-pneumatic scheme for solvent-selective
routing of organic and aqueous flows was demonstrated. Also shown is
the development of two separate extraction platforms. The first was a
centrifugo-pneumatic ‘µHomogenizer’, which implements a 3-phase fluid
extraction protocol of RNA. This system integrates chemical lysis and
separation of the RNA containing aqueous phase and shows significant
improvement over its time-consuming and labour intensive benchtop
alternate. The second was the development of a mechanical lysis method
that utilises a rotor stator grinding mill driven by the spindle motor.
This system can be used for general lysis of a wide range of bacteria but
would be of significant benefit for armoured cells.
1
Chapter 1
Introduction
1.1 Overview
1.1.1 Point of Care Diagnostics
In recent years a substantial push in disease detection has been
moving away from the traditional centralised laboratory approach to
Point of Care (POC) diagnostics approach. A POC system is a laboratory
standard test which is designed to be used in-situ, directly at the site of
patient care (1). This could comprise of anywhere from a physician’s
office, to an ambulance, to emergency room and even patient’s homes. It
has a significant benefit when used in poor resource areas like the
developing world, where people may have to travel great distances to
receive medical care. If the test can be run and the disease diagnosed
then and there, this would allow for much better and more tailor

2
treatments. There are numerous other significant benefits to the
development of POC systems, for example:
1. Personalised medical treatment, designed to fit the individual
patient’s needs, not just the standard group treatment.
2. De-centralisation of laboratory testing. There would be a
reduced need for centralised labs.
3. Early disease detection. Though the benefits of early
diagnosis is somewhat in question for diseases like cancer,
early identification of other disease types such as bacterial
meningitis has significant benefits for patient prognosis, as
well as reduction in long term neurological defects (2), (3).
4. Shorter sample-to-answer time, allowing faster treatment of
disease.
5. Reduction of cost. There would be a reduction in sample and
reagent consumption as well as a reduction in emergency
room time and outpatient clinical visits, ensuring optimum
usage of professional time.
It is clear, however, that in order to implement these practices
and receive these benefits POC systems must meet certain criteria (4):
1. The systems must be at least as effective as the current
laboratory standard.
3
2. It must be straightforward and easy to use. Extensive
training or instruction should not be required for its
operation.
3. The system should be fully automated and require minimal
user input.
4. The system should be cost-effective. This aspect is essential if
POC technologies are to be used in developing regions.
In order to achieve these goals POC systems must condense the
complex fluid handling processes, normally performed manually, into
simple automated devices. Microfluidic systems offer a means of
achieving this.
1.1.2 Technological Advancements in POC Systems
Perhaps the most successful POC diagnostic device used today is
glucose test strips, which are used to measure glucose levels in the blood
and is now one of the main tools in managing diabetes. This simple test
allows patients to make decisions about their diet and medication
dosage by giving patients their glucose levels in a matter of seconds (5).
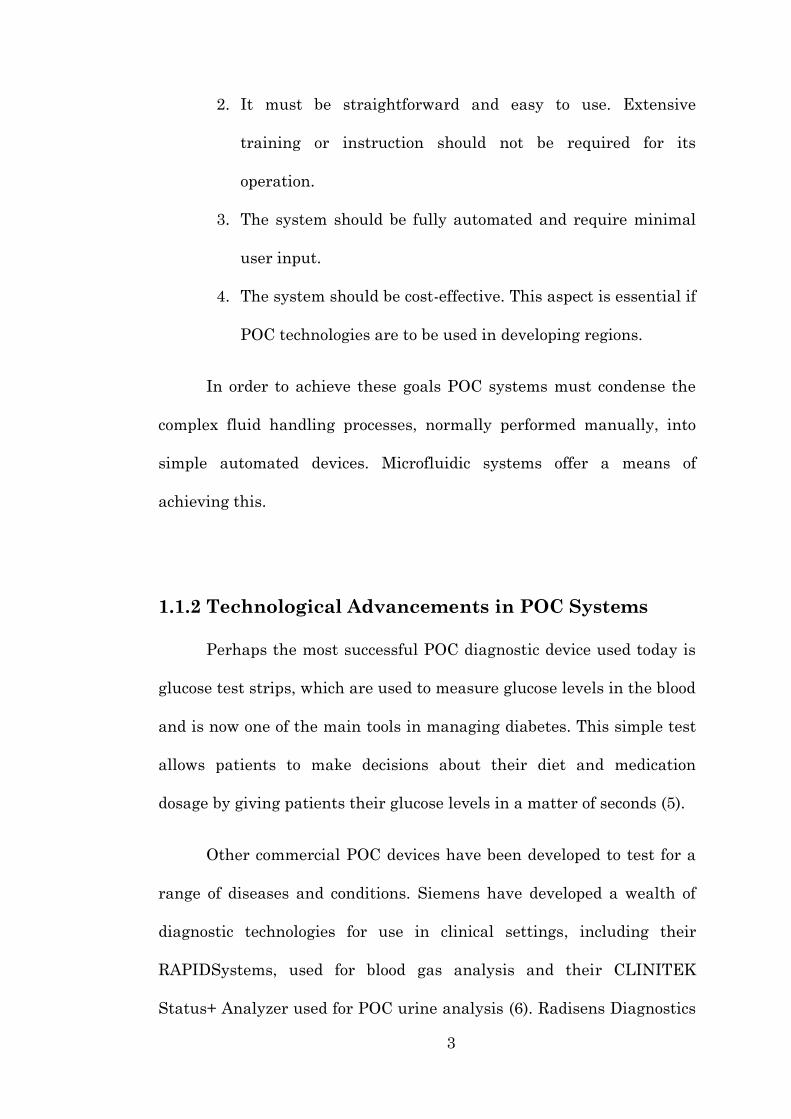
Other commercial POC devices have been developed to test for a
range of diseases and conditions. Siemens have developed a wealth of
diagnostic technologies for use in clinical settings, including their
RAPIDSystems, used for blood gas analysis and their CLINITEK
Status+ Analyzer used for POC urine analysis (6). Radisens Diagnostics
4
have developed their Gemini™ platform, a multimode system that uses
centrifugal microfluidics to detect for various chronic diseases, e.g.
chronic diabetes, heart disease and thyroid function (7). The Piccolo
Xpress® by Abaxis uses a lab-on-a-disc system which can perform up to
15 different tests simultaneously in approximately 12 minutes (8).
Multiplexing of immunoassays on-disc (9) and parallelized biochemical
analysis have also been demonstrated (10).
Figure 1.1: Example of technological advancements in POC diagnostics. a)
Piccolo Xpress® by Abaxis (8). b) Gemini™ platform by Radisen (7).
There has been an increasing demand in recent years for POC
diagnosis and monitoring of patients using Nucleic Acids (NA), DNA and
RNA. These are arguably some of the most difficult tests to perform in a
POC environment as there are considerably more sample pre-treatment
steps than with other bio-testing methods such as immunoassays (11).
5
Lee et al. developed a new NA based assay which is integrated
into a cartridge system for HIV-1 (12). A simple rotary microsystem
developed by Park et al. enabled the purification of RNA from viral
lysate with frequency-controlled release of reagents (13). By pre-storing
reagents through their gelification, Sun et al. were able to enhance the
capabilities of reagent storage for POC analysis (14). The emergence of
alternative detection techniques such as isothermal amplification have
also helped to advance NA testing of diseases like malaria (15).
These are just some of the advancements being made in this area
and a recent review by Chin et al. stated that there are over 32
companies currently active in the field of POC diagnostics (16).
1.2 Motivations and Objectives
With the increasing need for robust, automated sample-to-answer
devices for POC diagnostics, especially in the area of NA testing,
systems must be developed to combat the difficult and time-consuming
sample preparation procedures. As sample preparation is the greatest
bottleneck in NA testing, the aim of this thesis is to address this issue.
The ultimate goal is to develop advanced flow control mechanisms for
microfluidic systems capable of performing the complex fluid handling
requirements of NA testing (notably cell lysis and purification), all using
simple and automated devices. In particular this work focuses on:
6
1. The investigation and integration of functional materials
within centrifugal microfluidic structures and using those
materials for advanced flow control.
2. Use of these functional materials for solid phase purification
of nucleic acids.
3. Development of nucleic acid extraction solutions.
1.3 Centrifugal Microfluidics
Microfluidics deals with the science and technology of fluid flows
on the micron or submicron scale (17). Centrifugal microfluidics is an
area of science which has been of interest for the past 40 years. The
concept of it is a simple one, through the spinning of a disc, which as has
been fabricated to contain microscopic structures, fluid is propelled from
the centre of the disc due to centrifugal forces.
The main force involved in centrifugal microfluidics is the
centrifugal force, f𝜔, where
𝑓𝜔 = 𝜌𝑟𝜔2 (eqn. 1.1)
where ρ is the mass density of the fluid, r is the radial position and ω is
the angular velocity of the disc. This force is always directed out from
the centre of the disc. Another less influential force is the Coriolis force,
fc,
𝑓𝑐 = 2𝜌𝜔𝑣 (eqn. 1.2)
7
where v is the planar velocity of the fluid, and the Euler force, fE,
𝑓𝐸 = 𝜌𝑟𝑑𝜔
𝑑𝑡 (eqn. 1.3)
where d𝜔/dt represents the angular acceleration. All these factors,
among others (such as the capillary force which will be discussed later),
affect the way in which fluids flow when put on a disc (18).
Centrifugal microfluidics has emerged as highly useful tool in the
area biomedical diagnostics as many of the necessary processing steps in
fluidic analysis, such as mixing or metering of the fluids, can be
miniaturised and incorporated into these Lab-on-a-Disc (LoaD)
technologies. Also because of this miniaturisation multiple analysis
steps can be incorporated onto the one disc, which has allowed for the
development of sample-to-answer systems or micro total analysis
systems (μTAS).
The advantage of using centrifugal microfluidics over traditional
microfluidics is that propulsion of fluids can be achieved without the use
of many external technologies. A simple motor can generate all the
forces necessary to move the fluid through the disc. Other fluidic
functions like valving, which will be discussed in detail below, have also
been incorporated into the discs. Also, with developments in both the
materials and manufacturing technologies of these discs, a cheap and
fast method of testing can be achieved (19).

8
1.4 Microfluidic Flow Control
Due to the ubiquitous nature of the centrifugal field during ro-
tation, flow control constitutes a particular challenge on integrated
LoaD platforms. For example, in the design shown in Figure 1.2a, there
are fluids stored in all three of the chambers, which need to be released
sequentially to the bottom chamber. That will not be possible in the
current configuration, as all three fluids are experiencing the same
force, as they are at radially equal distances. However, if the radial
distance of the chamber is increased (Fig. 1.2b), then the fluids farther
out from the centre will experience a greater force and so flow first. This
constitutes a simple example of flow control but the coordination of
sequential or parallelised Laboratory Unit Operations (LUOs) (such as
the sample and reagent storage) requires more complex, high-
performance flow control such as: valving, routing, pumping, metering
and mixing.

9
Figure 1.2: Example of simple method of flow control. a) Each of the three
chambers on the disc is experiencing the same force and so all three fluids will
flow simultaneously. b) By increasing the radial distance of the chambers
sequential release of the three fluids can be achieved.
1.4.1 Passive Valving
It is commonly known that valving is perhaps the most important
flow control method in centrifugal microfluidics. There are many
different systems that can be used as valves, each with their own
advantages and inefficiencies. The main systems will be examined here.
They can be broken down into two groups: passive and active valves.
Passive valving systems include capillary valving, siphoning and

10
hydrophobic valving. These types of valves are controlled primarily by
the rotational frequency of the disc, its surface properties and channel
design (20). However, these valving schemes only control the fluid
phase, but not its vapour, thus making them unsuitable for long-term
reagent storage, which would be a common requirement of fully
automated commercial point-of-use systems.
Figure 1.3: Microfluidic valving systems. A) Shows a capillary valve, B) shows
a hydrophobic valve and C) shows a siphon valve. The operations of these
valves are described below (19).
1.4.1.1 Capillary valving
Capillary valving is perhaps the most commonly used type of
valve (Fig. 1.3A). It is based on a balance between the centripetal force
and surface tension force (20). With hydrophilic microchannels fluids
can be transported using capillary action. The rotation of the disc can
aid with this action. When the fluid encounters a transition from a small
11
microchannel into a larger chamber, a large surface tension force
develops. At this point, if the centrifugal force is less than that of the
surface tension force, the flow of the fluid will cease. In order for this
stoppage to be overcome, the rotation of the disc must be increased,
therefore increasing the centrifugal force. At some spin speed, known as
the burst frequency, the surface tension force is overcome and the fluid
will continue to flow. In this way the flow through the disc can be
controlled simply by varying its rotational frequency (21). Much
research has been done into investigating the parameters of the burst
frequency (22). The burst frequency is given by the Equ. 1.4,
𝜐(𝐻𝑧) =1
𝜋√
𝜎|𝑐𝑜𝑠Θ|
𝜌�̅�Δ𝑟𝑑 (eqn. 1.4)
where ν is the burst frequency, σ is the surface tension of the fluid, Θ is
the contact angel at the interface between the small microchannel and
the larger chamber, ρ is the density of the fluid, 𝑟 is the mean radial
position of the interface, ∆𝑟 is the length of the liquid plug and d is the
diameter of the microchannel (18).
There are some limitations involved with using capillary valves.
The first of these is the need for the surfaces to be hydrophilic and
therefore the disc needs to be surface treated. Though this can be done
at the assembly stage, the process is not permanent and does wear-off
after some time. Also, the burst frequency of the valves can limit the
spin profiles of the disc, as it does not allow for high spin frequency
operations (23).
12
1.4.1.2 Hydrophobic valving
Another method for stopping fluid flow is the use of a hydrophobic
valve. The idea of this system is quite simple. A small hydrophobic patch
is placed along the channel as shown in Figure 1.3B. There are two
different methods for using hydrophobic valves, the first is the
narrowing of a hydrophobic channel and the second is the hydrophobic
patch placed in functional areas in the microchannels of the structure
which impedes the flow of the fluid (19). As with the capillary valving,
increasing the rotational speed to a certain burst frequency will allow
the fluid to flow again (21). However, also like with the capillary valve,
hydrophobic valves burst at relatively low frequencies not allowing for
any high spin speed operations.
1.4.1.3 Siphon valving
The siphon structure, as shown in Figure 1.3C, can be used as
both a means to transport the fluid around the disc and as a valve (19).
The siphon consists of a fluid filled chamber connected to a siphon
channel which first extends higher than the radial position of the
chamber then back down to another chamber at lower radial position
(21).
At high rotational speeds the level of the fluid in the initial
chamber and in the siphon channel is maintained at a constant level.
The centrifugal force keeps the meniscus front below the level of the
13
fluid in the chamber (19). When the spin speed is slowed down the
centrifugal force is no longer strong enough to stop the capillary action
in the siphon channel and meniscus front moves up and over the crest
and down to the entrance of the radially lower chamber. The siphon
channel is now primed (21). The rotational speed is then increased again
allowing the entirety of the fluid to flow to the second chamber.
Siphon valving is useful when high initial spin speeds are
necessary; however, siphoning requires that the siphon chamber be
primed using capillary action, therefore the channel must also be
hydrophilic. Also, a siphon structure requires a lot of surface area on the
disc (19).
Siegrist et al. took steps towards a more integrated system by
implementing a robust serial siphoning method of fluid handling (23).
1.4.2 Active Valving using Functional Materials
Active valves rely on the use of sacrificial materials for functional
enhancement of microfluidic systems. Sacrificial valves are destructible
barrier layers that can be placed strategically throughout the structure
and can be used for functions such as long term on-board fluid storage
(20). These physical-barrier based flow control elements are removed on
demand by physical or chemical stimuli (24), (25). Wax valves, for
instance, can be actuated by exposure to a heat source (25). Another

14
example is hydrogels, which can act as valves actuated by size change in
the presence of water (26).
Figure 1.4: Centrifugo-Pneumatic DF valving. A) Structural design of DF valve
in disc design. B) Actuation of DF valve under centrifugal field. C)
Demonstration of DF valve operation using coloured dyes. Adapted from
Gorkin et al. 2012 (24).
Gorkin et al. used a dissolvable-film material which opens upon
contact with the on-board fluid in conjunction with a pneumatic
structure to develop a novel valving system on a centrifugal microfluidic
platform (Fig. 1.4) (24). Kinahan et al. advanced this sacrificial
technology to an event-triggered valving paradigm which allows for
more dynamic control of fluids on a centrifugal microfluidic platform
(27). Mishra et al. recently integrated a sacrificial lipophilic membrane

15
which dissolved in the presence of a suitable oleophilic (a substance
which has an affinity for oils) solvent, but remained intact in the
presence of water. This allowed for the implementation of an enzyme-
linked immunosorbent assay (ELISA) (28).
1.4.3 Routing
Fluidic routing to direct flow to a selected output at a junction
between a waste and an elution outlet is critical for centrifugally
implemented automation, especially in the area of nucleic acid
purification where the sequence of fluids must be passed through a
single channel, but each of these fluids must be routed away from the
final collection chamber. Kim et al. developed a flow switch by using a
capillary valve upstream of an open chamber and unique 3D junction
geometry (29). A similar router, solely controlled by the rotationally
actuated hydrodynamic Coriolis pseudo-force, was reported by Brenner
et al. (30). This virtual routing concept was further sophisticated by
Haeberle et al. who successfully extracted DNA from calf thymus using
silica beads by alternating the sense of rotation (31). Automated
extraction of human genomic DNA is demonstrated by Kloke et al. who
implement novel ball-pen pierceable seals to route the sample lysate
through an integrated silica membrane in a Lab Tube platform (32).
16
1.4.4 Pumping
Centrifugal pumping provides a means to regulate flow rates of a
fluid around the structure, without the use of any external pumps. The
basic principle is that by changing the rotational frequency of the disc,
the flow patterns of a fluid can be manipulated. Pumping on a
centrifugal disc is based mostly on the rotational speed, radial distance
from the centre of the disc and channel geometry (21).
Centrifugal pumping also holds an advantage over other chip
based pumping, such as electrokinetic platforms (33), in that it is not
heavily dependent on the physicochemical properties of the fluid, for
example, pH levels, ionic strength or chemical composition (34). Also it
doesn’t require large high voltage power supplies (19). A number of
different fluids have been pumped using this system such as, aqueous
solutions, solvents and biological samples (e.g., blood, milk, urine).
A method has also been shown which allows for pumping of fluids
back towards the centre of the disc, using pneumatic energy (35). The
method was developed in order to overcome some of the limitations
involved in the centrifugal microfluidics process, namely space
constraints and the one directional motion within a centrifugal system.
The structure of this system consists of two chambers: an intake
chamber connected by a microchannel to a compression chamber. The
operation of the system is shown in Figure 1.5 below.

17
Noroozi et al. have used pneumatic pumping as a method for
mixing and accurate metering of reagents (36).
Figure 1.5: Operation of pneumatic pump. a) Fluid is loaded into the loading
chamber, b) the disc is spun, the fluid moves down the channel and begins to
fill the structure, c) the fluid creates a seal trapping the air, d) the disc is spun
faster and the air is compressed and e) the spin speed is decreased allowing the
trapped air to push the fluid back up the channel [18].
1.4.5 Mixing
Mixing is a necessary part of biomedical diagnostics but some
problems occur when this has to be done on the microscopic scale (19).
The problem arises due to the fact that the Reynolds number in small
chambers is very low (36). The Reynolds number relates the ratio of the
inertial forces to the viscous forces. In microfluidics, this number is
usually less than 10, which means that the viscous forces play a
significant part in the characteristics of the fluid flow (17). This low
number also means that mixing within microfluidic structures can be

18
limited to diffusion mixing, which can be very slow (19). This process can
take as much as seven minutes (37).
Methods for overcoming this problem have been investigated such
as: the use of rapid oscillation of the disc (37), or the introduction of
paramagnetic beads which are deflected by stationary magnetics on the
surface of the disc (18). A combination of these two processes can
decrease mixing times to as little as one second (37).
1.4.6 Metering
Fluid metering is a necessary step for testing of reagents in a
microfluidic system. In its simplest terms volume metering is done using
an overflow principle i.e. the fluid fills into a chamber of a certain size
and the rest is passed on to some waste area (18).
1.5 Nucleic Acid Testing in Microfluidics
Microfluidic devices have significant advantages for uses with
biological analysis, e.g. high throughput, small volume and shorter time-
scales. Microfluidics can be used for a wide range of biological testing
including immunoassays testing (38), cell capture and separation (39)
and single cell analysis (40). While many of these biological methods
address specific needs for disease detection, often times these tests only
give positive results at a late stage of the disease. For example, when
19
detecting circulating tumour cells (CTCs), a tumour has already begun
to break-up and metastasize around the body. With immunoassays there
is a delay between when the patient is infected and when the body
begins the production of antibodies to a detectable level. It is important,
therefore, to develop tests capable of detecting diseases in a shorter time
period. Nucleic acid testing can offer this. For an infectious agent NA
testing has an analytical sensitivity of at least three orders of magnitude
higher than immune reactions, cell culture or virus isolation and with
considerably shorter timescale (41).
1.5.1 Nucleic Acids
Nucleic acids are chains of nucleotides that are biological
molecules essential for known forms of life, including deoxyribonucleic
acid (DNA) and ribonucleic acid (RNA). Both DNA and RNA make
excellent biomarkers for the detection of numerous diseases. The
usefulness of DNA as a marker has been widely known for some time
(42), but the benefits of using RNA is a more recent find. RNA can be a
more viable option for the detection of viruses or pathogens than DNA,
for example when looking at the pathogen viability as RNA is less stable
than DNA (43). One class of RNA species that has recently received a lot
of attention is microRNA. These are non-coding small RNAs which are
involved in regulating gene-expression. Their dysregulation has been
shown to be involved in a significant number of human diseases
20
including cancer (44). For the detection of bacterial infections, ribosomal
RNA (rRNA), most particularly 16S rRNA is the gold standard.
1.5.2 Nucleic Acid Testing Stages
Nucleic acid testing can be broken down into three stages:
extraction, purification and detection.
1.5.2.1 Extraction
Extraction involves the rupturing of the cells (known as cell lysis)
in order to collect the desired nucleic acid. There are numerous different
methods depending on the type of cell being lysed and the type of nucleic
acid you wish to extract.
Different types of cells have different cell-wall structures, which
can exist in a wide range from very fragile to very tough. The tougher
the cell-wall, the more shear force that is required to disrupt it.
Mammalian cells and Gram-negative bacteria tend to be more shear-
sensitive. Yeast and other fungi, as well as Gram-positive bacteria tend
to have more rigid cell walls and require more rigorous methods of
disruption (45).
The first isolation of DNA was achieved by Friedrich Miescher in
1869 and has since become a routine procedure in bioanalysis (46). Cells
must first be lysed using one of four main methods: non-mechanical
21
disruption such as the use of detergents or freeze thawing,
ultrasonication, high pressure homogenization or mechanical grinding
(45).
For RNA a phenol-chloroform extraction procedure is usually
observed. Commercial products are available for this procedure, such
Trizol Reagent (TRI_Reagent). The cells are mixed with the
TRI_Reagent and homogenized. The solution separates into phases: an
aqueous phase, an interphase and an organic phase. The aqueous phase
contains the RNA, the interphase retains the DNA and proteins and the
organic phase retains the phenol from the lysate (47).
After the sample has been extracted it must be purified before
detection.
1.5.2.2 Purification
Purification involves the cleaning of the extracted nucleic acid
sample so that it is ready for detection. Through the course of this work
the well-established Boom chemistry for solid-phase purification of the
nucleic acids was used (48). This process involves three steps:
1. Mixing the extracted sample with a solid-phase (usually silica
beads) under chaotropic conditions. A chaotropic agent (such
as guanidinium thiocyanate which was originally used by

22
Boom et al.) is a substance which alters the surface structure
of NAs making them capable of binding to the silica beads.
2. Washing the silica beads to remove contaminants. This
usually involves multiple washes of the organic solutions
isopropanol (IPA) and ethanol (EtOH). A drying step can help
to enhance this.
3. Finally, the bound NA must be removed from the beads and
re-suspended in a solution for detection. The NAs are eluted
into a buffer (such as TE Buffer) which has low salt
concentration and a pH > 7, which are the optimum conditions
for NA separation from the silica beads.
The purified sample is now ready for detection.
1.5.2.3 Detection
There are various detection methods depending on the level of
accuracy and the information required about the sample.
The simplest method of NA detection is absorbance spectroscopy.
It is a simple quantitation method used to determine the concentration
of DNA or RNA in a solution, as well as its purity. NAs absorb strongly
at 260 nm and proteins at 280 nm, therefore the ratio between the two
gives information about the purity of the sample. This will be discussed
in greater detail in Section 2.4.2.2. Alternately, NA molecules can be

23
fluorescently tagged which can improve the sensitivity of the
measurement.
The most widely used method of NA detection is Polymerase
Chain Reaction (PCR). This is an amplification technique capable of
taking a single copy of DNA and generating thousands or millions of
copies of that particular DNA sequence. Quantitative Real-time PCR
(qRT-PCR) can measure the accumulative effect of the amplification
process as the reaction is taking place. This coupled with a fluorescently
labelled probe hybridization used for the detection of a specific DNA
sequence allows for very accurate DNA detection. For the detection of
RNA, Reverse Transcription PCR (RT-PCR) is used. This creates a
complementary DNA (cDNA) sequence from the RNA and amplifies it
(49).
Other methods of detection include using isothermal amplification
techniques such as nucleic acid sequence-based amplification (NASBA)
or Loop-mediated amplification (LAMP). These techniques require
heating the sample to a single temperature (instead of the cycling
procedure required for PCR), which can reduce assay times (43).
1.5.3 Microfluidic Advancements in NA Testing
Microfluidics is of considerable use for NA testing. There have
been some significant developments in this area. For nucleic acid
detection using microfluidic devices, sample preparation remains the
24
biggest bottleneck (41). Haeberle et al. used a centrifugally driven
system which routed the flows based on the Coriolis pseudo force which
allowed the recovery of 16% of the DNA (31). Using centrifugal
microfluidics, Cho et al. presented a device capable of one-step DNA
extraction of pathogen-specific DNA from whole blood (50). A system
was devised which significantly reduced the detection time (from 5 days
to 30 minutes) of a common food-borne pathogen by combining an eight-
chambered microfluidic chip with an optical reader and LAMP (51), (52).
These are just some examples of the use of microfluidics for
nucleic acid testing. However, there is still significant room for
advancement in this area, particularly with a focus on automation of
sample preparation procedures.
1.6 Outline of Thesis
This thesis describes the development of novel flow control
methods on centrifugal microfluidic discs to automate the numerous
sample preparation steps of nucleic acid testing. A particular emphasis
is given to the inclusion and characterisation of functional materials
within the discs. These functional materials can help to enhance fluid
flow control through their solvent selective properties. A brief outline of
the remainder of the thesis is as follows:
25
Chapter Two, describes in detail the fabrication technologies used
to manufacture the microfluidic discs (Laser ablation and CNC milling),
as well as the cleaning and assembly process. The various materials
used are discussed as well as the testing procedures. The
characterisation techniques are discussed, including bio-analysis
methods used throughout this work.
Chapter Three deals with the development of a solvent selective
router for centrifugally automated solid phase purification of RNA. The
design of a solvent-selective valving scheme is shown, along with the
advancement of the system from a simple router to a fully automated
design. The capability of the system to purify RNA to a high integrity is
shown.
Chapter Four looks at the inclusion of Graphene Oxide (GO), as a
functional material, in microfluidic systems. A method for inclusion of
the GO membranes in polymeric microfluidic devices is described. The
GO membranes are characterised using microfluidic structures and
their range of unique capabilities is investigated. GO membranes are
completely impermeable to organic solutions, air and oils, but yields to
aqueous solutions above a certain threshold frequency.
Chapter Five shows the inclusion of the GO membranes as a flow
control element in a centrifugo-pneumatic router. The evolution of the
design of the system is shown, as well as its capability to purify DNA.
The interaction of DNA with the GO membranes is also investigated.

26
Chapter Six shows the continued development of the GO router to
a fully automated system capable of purifying DNA in less than eight
minutes. The system incorporates an event-triggered design which uses
three different functional materials to significantly reduce the labour
intensive sample preparation requirements of DNA purification.
Chapter Seven looks at two separate methods for NA extraction.
The first is a novel centrifugo-pneumatic ‘µHomogenizer’, which
implements a 3-phase fluid extraction protocol of RNA. This system
builds on the work of Linares et al. (53) to integrate chemical lysis and
separation of the RNA containing aqueous phase and show significant
improvement of its time-consuming and labour intensive benchtop
alternate. The second is the development of a mechanical lysis method
that utilises a rotor stator grinding mill driven by the spindle motor.
This system could be used for general lysis of a wide range of bacteria
but would be of significant benefit for armoured cells.
Chapter Eight outlines the final general conclusions of the thesis
and includes some suggestions for further work on the topics in the
thesis.

27
Chapter 2
Materials and Methods
The experimental work can be broken down into four stages: disc
fabrication, biological sample preparation, disc testing and
characterisation.
This chapter deals with the general materials and methods only.
Anything specific to the individual disc designs will be discussed in the
relevant results chapters. A full list of all materials and manufacturers
is given in Appendix A.
2.1 Fabrication of Parts
The fabrication process has three steps: designing the layers,
fabrication of parts and complete disc assembly. All designs were drawn
using SolidWorks 2010 – 2015 (54).

28
2.1.1 Materials
There are many choices of materials for lab-on-a-chip systems,
each with a different range of properties (55). Initially microfluidic chips
were generally made from silicon or glass substrates. The use of these
materials at the time was well known, and the optical transparency of
glass was a highly desirable property (56). However, both of these
materials were limited by their high cost and their harmful and
complicated manufacturing procedures (57). The use of polymers such as
Poly(methyl methacrylate) (PMMA) and Poly(dimethylsiloxane) (PDMS)
were introduced as a replacement. Polymers are low-cost, disposable and
far less complicated to fabricate (58). The microfluidic devices described
in this report were fabricated from the polymer Poly(methyl
methacrylate) (PMMA) or Cyclo-olefin polymer (COP) - Zeonor®.
PMMA is one of the most widely used polymers in microfluidics
and is the least hydrophobic of the common plastic materials. It is low
cost and so excellent for disposable microfluidic chips. It also has rigid
mechanical properties and excellent optical transparency (56). PMMA
can also be patterned effectively using laser ablation (59). PMMA is
opaque to light transmission in the UV range, which can limit some of
its sensing capabilities (60).
Zeonor® has excellent optical transparency (92% in the visible
range 400-800nm) and is more chemically resistant than PMMA (61). As
a relatively new type of thermoplastic it has low impurities which make
29
it highly useful medical equipment and biological analyse (62). However,
the Zeonor® is more costly than PMMA and cannot be cut using a 30 W
laser cutter, which makes it poor choice for rapid prototyping
techniques.
The polymer layers are held together using Pressure Sensitive
Adhesive (PSA). PSA is a class of adhesives which is used in adhesive
tape. These adhesives are thin films of polymer which experience
adhesive energy of ~100J/m2 (63). Once attached these adhesives cannot
be used again (17).
The discs shown in Chapters 3, 4, 5 and Section 7.3 were
fabricated from PMMA with PSA and the discs used in Section 7.2 were
fabricated from Zeonor with PSA.
2.1.2 Fabrication Processes
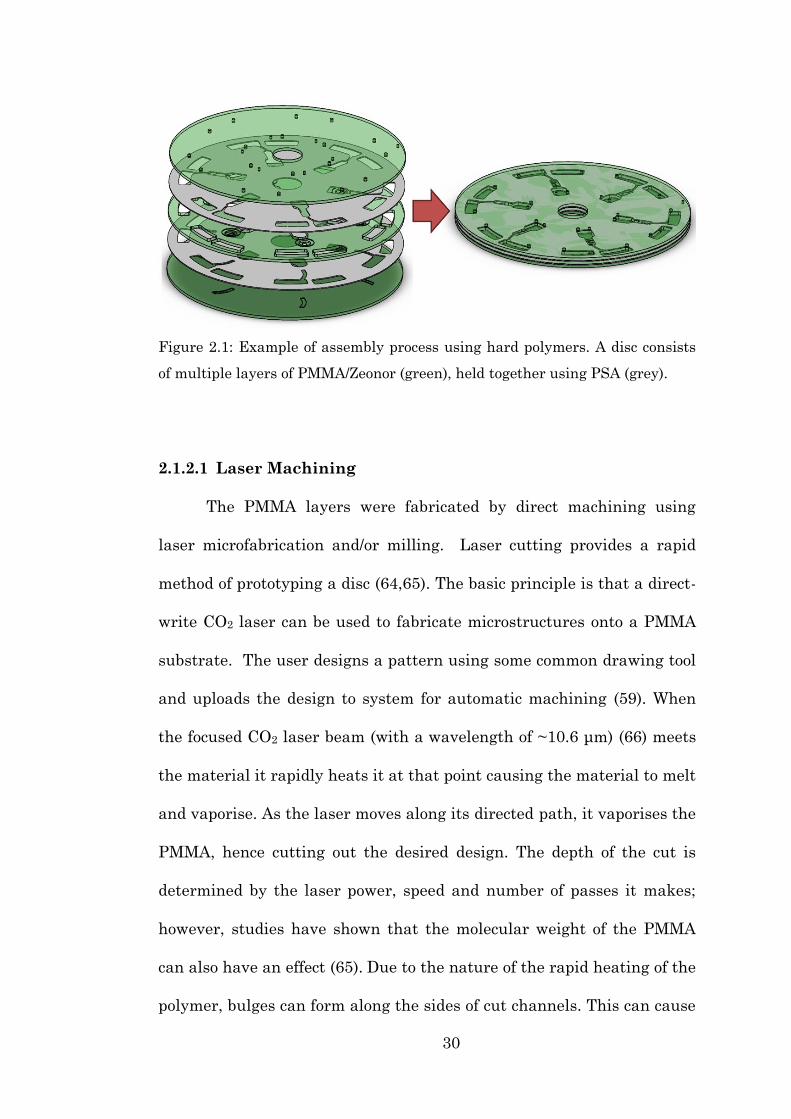
In general the polymer layers (PMMA or Zeonor) of the discs were
fabricated by laser machine or Computer Numerical Control (CNC)
milling (Fig.2.1). They were assembled together using PSA on an
alignment rig and rolled with a laminator for sealing. The specifics of
each of the fabrication processes are discussed in detail below.
30
Figure 2.1: Example of assembly process using hard polymers. A disc consists
of multiple layers of PMMA/Zeonor (green), held together using PSA (grey).
2.1.2.1 Laser Machining
The PMMA layers were fabricated by direct machining using
laser microfabrication and/or milling. Laser cutting provides a rapid
method of prototyping a disc (64,65). The basic principle is that a direct-
write CO2 laser can be used to fabricate microstructures onto a PMMA
substrate. The user designs a pattern using some common drawing tool
and uploads the design to system for automatic machining (59). When
the focused CO2 laser beam (with a wavelength of ~10.6 μm) (66) meets
the material it rapidly heats it at that point causing the material to melt
and vaporise. As the laser moves along its directed path, it vaporises the
PMMA, hence cutting out the desired design. The depth of the cut is
determined by the laser power, speed and number of passes it makes;
however, studies have shown that the molecular weight of the PMMA
can also have an effect (65). Due to the nature of the rapid heating of the
polymer, bulges can form along the sides of cut channels. This can cause

31
issues when bonding the PMMA to other layers of the disc. Chung et al.
have proposed a means of reducing this problem by attaching a cover
layer on top of the PMMA which is being cut (67).
The laser cutting machine used for this work was an Epilog Zing
16 (Epilog Laser, USA). It has a working area of 406 x 305 mm and a
maximum material thickness of 114 mm. It has a digitally controlled,
air-cooled 30 W CO2 laser (Fig. 2.2a).
Figure 2.2: Equipment used for microfluidic disc fabrication. a) Laser cutter
used to cut polymer layers of the disc. b) CNC milling machine used for
precision cutting of polymer layers. c) Knife cutter used for cutting the PSA
layers of the disc.
a b
c
32
The procedure for operating the laser cutter is as follows. First a
large sheet of PMMA was placed onto the support material within the
device. The plastic packaging on the PMMA sheet was removed before
use, as it would not allow for a clean cut with the laser. The focus and
origin position of the laser were set on the device and the lid was closed.
For safety, an exhaust vent fan was activated to remove any harmful
fumes. The machine was now ready for cutting. Next a DXF file was
uploaded to the CorelDraw software. Any final adjustments were made
to the software and the file was sent to the laser cutter by clicking the
‘Print’ button. Finally, pressing the ‘GO’ button on the laser cutter
machine initiates the cut.
2.1.2.2 CNC Machining
For designs which require more precise machining a Computer
Numerical Control (CNC) milling machine was used (Fig 2.2b). CNC is
the development of Numerical Control (NC) which is the technique of
controlling a machine’s movements and other functions by instructions
in the form of a code. CNC is the term used when those instructions are
supplied by a computer (68).
CNC machining can be performed on a range of substrates
including metals and polymers and is useful in the production of smooth,
precise features. A vertical spinning tool bit is used to engrave chambers
and channels into the substrate surface (69).

33
The machine used for this work was a Roland Modela MDX-40A
(Roland DG Corporation, Japan). It is a mid-range device with three
axis of movement and a workable area of 305 x 305 mm. Its mechanical
resolution is 0.002 mm/step (70). The size and shape of the features to be
milled are controlled by the built in software and designs can be
uploaded from a DXF file. The minimum feature size is limited by the
tool part, which is Ø 0.1 mm.
The benefit of CNC milling is in its increased precision over laser
machining and it has been shown to be capable of generating devices on-
par with their commercial counterparts (71). However, when compared
with laser machining it is a very slow process. Coolant must be
manually supplied regularly during the milling process to combat the
build-up of swarf. Swarf is formed when the supply of coolant is
inadequate, causing the tool to overheat and melt the polymer substrate
onto the tool surface, thus changing its shape and reducing the accuracy
of the cut (69).
For these reason the CNC was used only when precision cutting
was required and for use with the Zeonor substrates that cannot be cut
using the laser cutter.
The procedure for operating the CNC is as follows. When cutting
discs the substrates must first be cut to the Ø 120 mm size with a Ø
15.05 mm inner hole. In the case of PMMA this was performed on the
laser cutter and with Zeonor, the substrates were purchased that way.

34
The cut disc was then adhered to the CNC stage in the provided disc
slot. The disc was adhered to the surface of the stage using a hot glue
gun, around the edges of the disc and in the centre. Next, the desired
tool part was loaded into the machine. On the software, the X-Y position
was set, as was the Z-position. Finally, coolant was added to the disc
surface. The coolant was topped-up/replaced at regular intervals
through the cutting process.
2.1.2.3 Knife Cutting
The PSA layers were cut using a precision knife cutter (Fig 2.2c).
The machine used for this work was a Graphtec Craft Robo Pro
(Graphtec America Inc., USA). The PSA sheet was adhered to a
moderately ‘sticky’ carrier sheet and inserted into the knife cutter
machine. The origin was set on the machine and the RoboPro software
was used to upload a DXF file. The central loading hole and the
alignment holes were set to double cut by copy and pasting the lines in
the software. When the design was ready to cut, it was sent to the knife
cutter using the ‘Cut’ option on the software. The cut force was adjusted
on the cut dialog screen depending on the thickness of the PSA being
cut.
35
2.1.2.4 3D Printing
3D printing is a method by which a solid free form 3D model can
be built using three dimensional CAD data sets. It is referred to as a
rapid prototyping method as it can complete parts without the need for
additional assembly. The machine builds the structure based on data
from the CAD drawing, laying down successive layers of material and in
this way building a model up from a series of cross-sections (72). He et
al. recently 3D printed microchannels using a 3D printer to build a
sugar scaffold used as the structure in a PDMS cast chip (73).
The 3D printer used for this work was a Dimension uPrint Plus
(Stratasys, Germany). It has a build size of 203.2 × 203.2 × 152.4 mm, a
layer thickness of 0.254 mm and a resolution of 0.254 mm. It was used
to make a holder unit which will be discussed in detail in Section 7.3.2.
2.1.3 Cleaning Procedure
The polymer layers were cleaned using an Ultrasonic bath (Grant
Instruments, Cambridgeshire, UK) which removed any particulates
which may have been attached to the discs. This step is also important
for any biological testing. First the discs were placed within a sealed
container, with 2% Micro90 solution in DI water. The container was
placed into the sonicator at 50 ⁰C for 30 min. The discs were then
removed from the sonicator and rinsed with DI water. The Micro90
solution was replaced with DI water and the discs were returned to the
36
sonicator for another 30 min at 50 ⁰C. The discs were once again
removed and rinsed with DI water. They were then blown dry under
nitrogen stream to reduce drying time and residual water marks. The
discs were then placed in the oven for one hour at 80 ⁰C.
The PSA layers were cleaned with a wipe and 70 % Isopropanol.
2.1.4 Assembly
Once all parts have been cut and cleaned they were assembled to
form a disc. This process was done under clean room conditions and the
required equipment is shown below in Figure 2.3. The PMMA layers
were adhered to the PSA layers using transfer film as backing support.
Once all layers were assembled they were passed through a heated
roller multiple times, in order to ensure good adhesion. The disc was
then ready for testing.

37
Figure 2.3: Equipment used for microfluidic disc assembly. a) Image of the
various instruments required for the assembly process. b) Illustration of the
assembly rig used to align the various layers of a disc.
a
b
38
2.2 Biological Sample Preparation
2.2.1 Bacterial Cell Culture
E.coli cells were cultured in Luria-Bertani (LB) medium overnight
at 37⁰C and 400 rpm, 1 mL was transferred from the stock solution into
9 mL of fresh LB. The bacteria were collected in their log phase reaching
a density of 3.75 × 10⁴ colony forming units (CFU) per mL, based on a
plate count.
2.2.2 DNA Purification Procedure
As a means of testing the viability of some of the systems
discussed in the upcoming chapters for nucleic acid purification a
QIAquick® PCR Purification Kit (Qiagen, Manchester, UK) was used.
The kit contains a series of Buffers (PB, PE and EB) which have been
developed to optimise DNA binding, washing and elution through a
silica membrane. It can be used for the efficient recovery of single- or
double-stranded DNA fragments from 100 bp (base pairs) to 10 kb
(kilobase).
The kit contains spin columns which consist of a silica membrane
and collection tube. The protocol is shown in Figure 2.4. The sample is
mixed in a 1:5 ratio with Buffer PB, which contains high concentrations
of guanidine hydrochloride and isopropanol. The solution is passed
through the silica membrane using a centrifuge (Mikro 200R, Hettich,
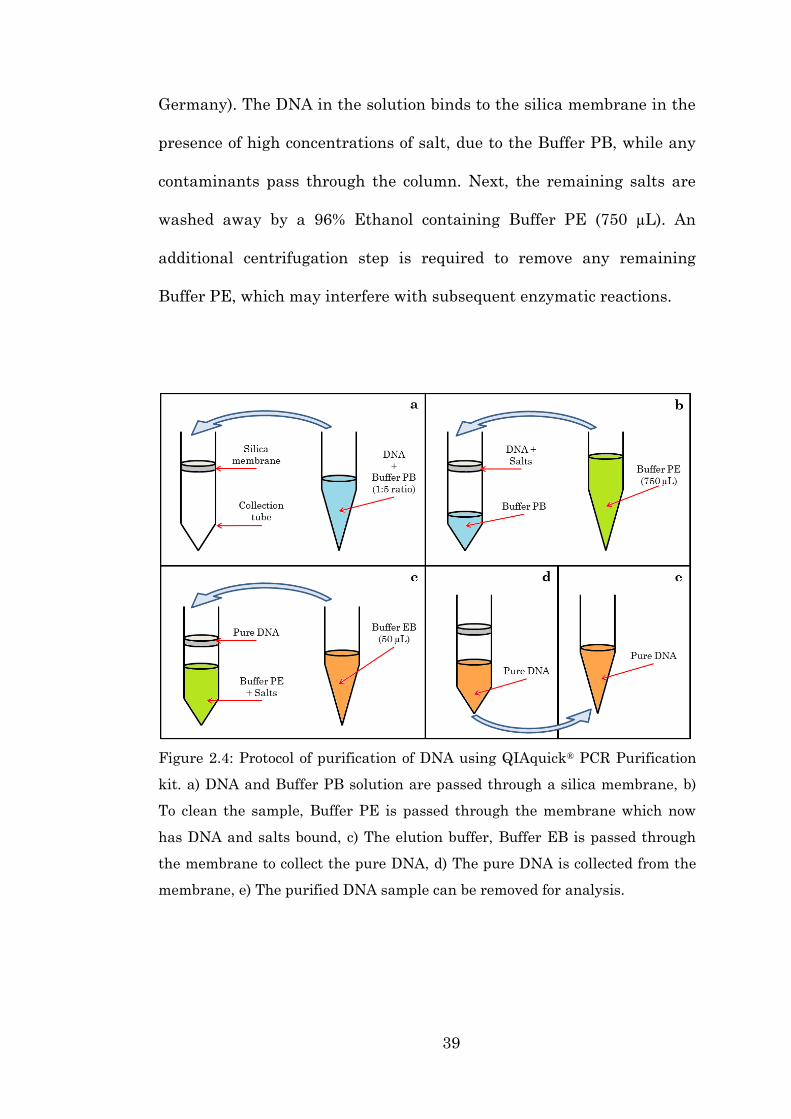
39
Germany). The DNA in the solution binds to the silica membrane in the
presence of high concentrations of salt, due to the Buffer PB, while any
contaminants pass through the column. Next, the remaining salts are
washed away by a 96% Ethanol containing Buffer PE (750 µL). An
additional centrifugation step is required to remove any remaining
Buffer PE, which may interfere with subsequent enzymatic reactions.
Figure 2.4: Protocol of purification of DNA using QIAquick® PCR Purification
kit. a) DNA and Buffer PB solution are passed through a silica membrane, b)
To clean the sample, Buffer PE is passed through the membrane which now
has DNA and salts bound, c) The elution buffer, Buffer EB is passed through
the membrane to collect the pure DNA, d) The pure DNA is collected from the
membrane, e) The purified DNA sample can be removed for analysis.

40
Finally, the DNA is eluted in a low-salt buffer solution, Buffer EB
(50 µL). The elution efficiency is highly dependent on the salt
concentration and pH of the elution buffer and unlike with binding is
best performed under basic conditions and low-salt concentrations. The
Buffer EB contains 10 mM Tris-Cl, pH 8.5, with maximum elution
efficiency being achieved between pH 7.0 and 8.5.
All centrifugation steps are carried out at 13,000 rpm, at room
temperature for 60 seconds. For DNA purification on-disc, the Qiaquick
buffer solutions were used and the silica membrane was replaced with
acid-washed silica beads. One other variation when using the disc was
the reduction in volume of the Buffer PE wash. In the standard
benchtop protocol a 750 µL volume is used. This is a far too large a
quantity to use in the small microstructures of the discs. Therefore, two
60 µL Buffer PE washes were instead used on the disc. In order to
ensure that this would not adversely affect the results, the spin column
procedure was performed with the original and reduced volumes. The
collected final samples were then analysed using fluorescence (Section
2.4.2.3). The outcome is shown in Figure 2.5.
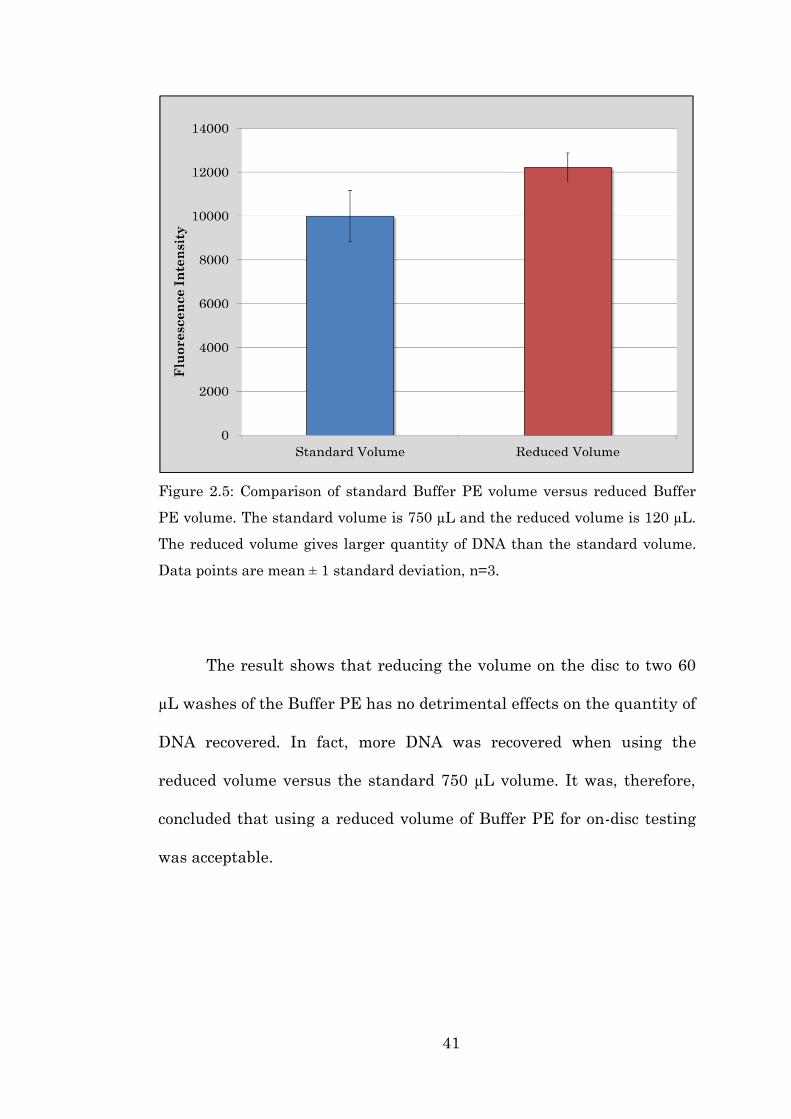
41
Figure 2.5: Comparison of standard Buffer PE volume versus reduced Buffer
PE volume. The standard volume is 750 µL and the reduced volume is 120 µL.
The reduced volume gives larger quantity of DNA than the standard volume.
Data points are mean ± 1 standard deviation, n=3.
The result shows that reducing the volume on the disc to two 60
µL washes of the Buffer PE has no detrimental effects on the quantity of
DNA recovered. In fact, more DNA was recovered when using the
reduced volume versus the standard 750 µL volume. It was, therefore,
concluded that using a reduced volume of Buffer PE for on-disc testing
was acceptable.
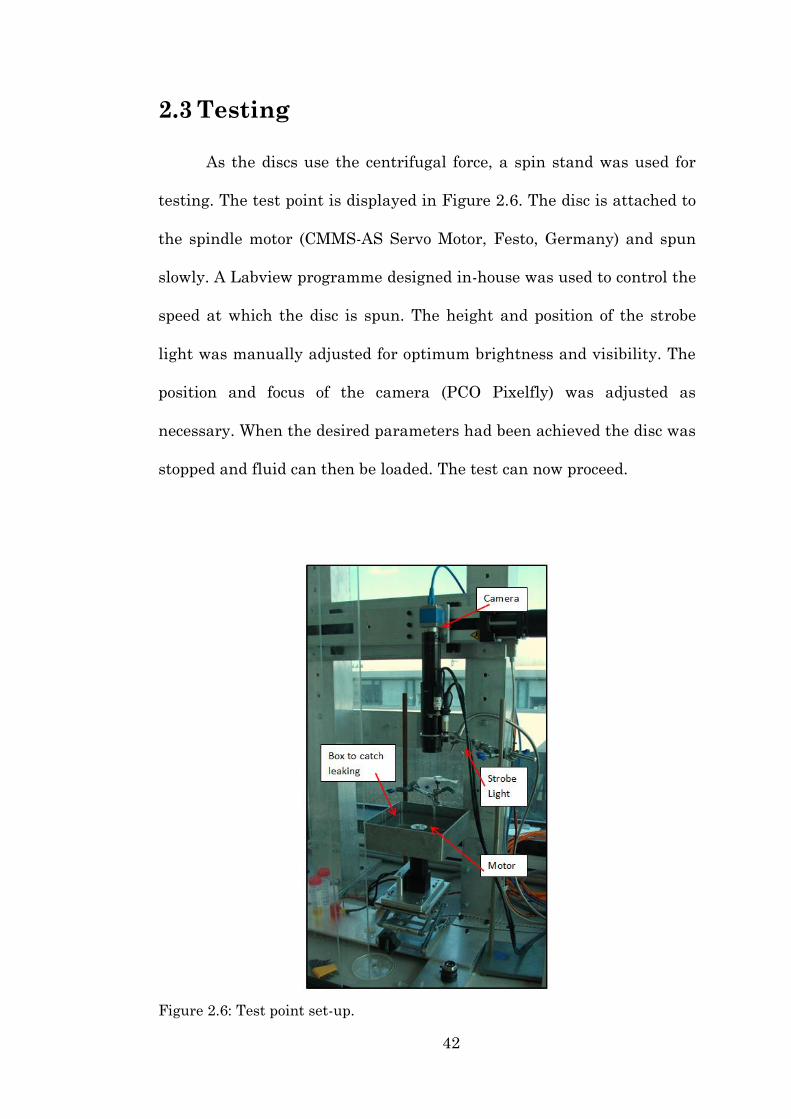
42
2.3 Testing
As the discs use the centrifugal force, a spin stand was used for
testing. The test point is displayed in Figure 2.6. The disc is attached to
the spindle motor (CMMS-AS Servo Motor, Festo, Germany) and spun
slowly. A Labview programme designed in-house was used to control the
speed at which the disc is spun. The height and position of the strobe
light was manually adjusted for optimum brightness and visibility. The
position and focus of the camera (PCO Pixelfly) was adjusted as
necessary. When the desired parameters had been achieved the disc was
stopped and fluid can then be loaded. The test can now proceed.
Figure 2.6: Test point set-up.
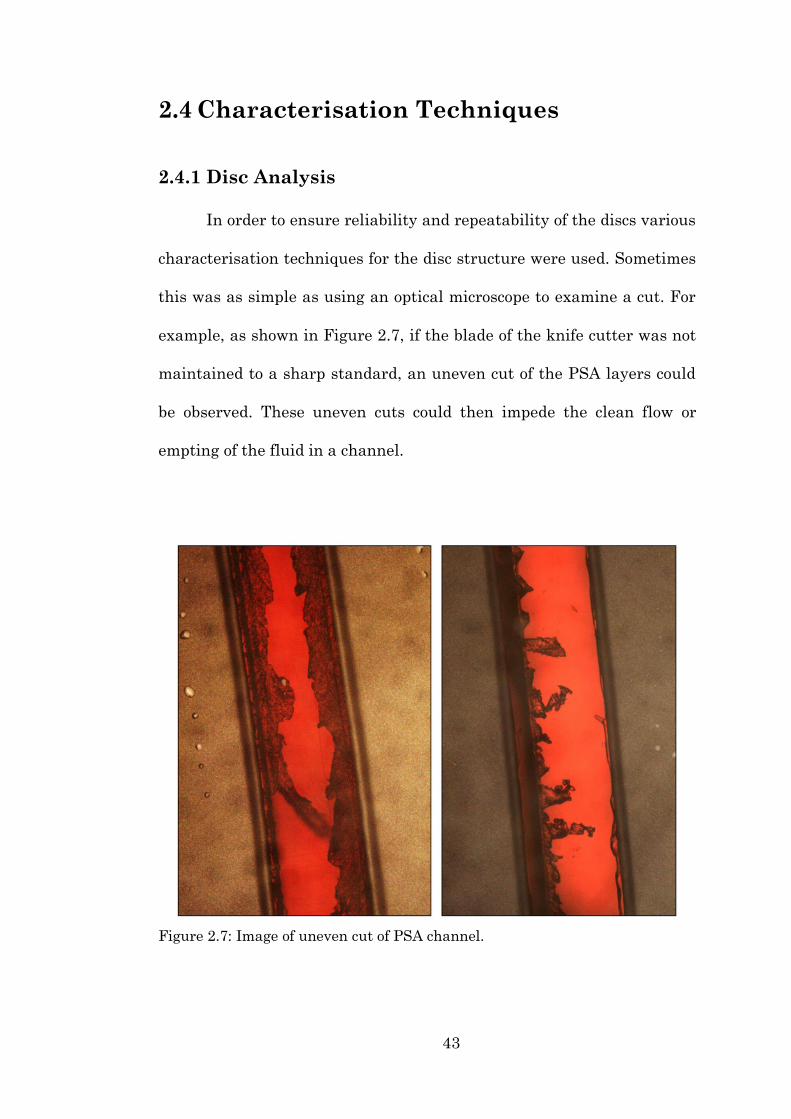
43
2.4 Characterisation Techniques
2.4.1 Disc Analysis
In order to ensure reliability and repeatability of the discs various
characterisation techniques for the disc structure were used. Sometimes
this was as simple as using an optical microscope to examine a cut. For
example, as shown in Figure 2.7, if the blade of the knife cutter was not
maintained to a sharp standard, an uneven cut of the PSA layers could
be observed. These uneven cuts could then impede the clean flow or
empting of the fluid in a channel.
Figure 2.7: Image of uneven cut of PSA channel.
44
2.4.1.1 3D Microscope
3D microscopy is digital microscopy technique which takes high-
resolution images of a sample by taking cross-sectional images and
stitching the images together to form a three dimensional structure.
The 3D microscope used in this work was a Keyence, VHX-5000
series, Digital Microscope (Keyence, Illinois, USA). It has an 18
megapixels × 3CMOS camera and a resolution range of 1600 × 1200 to
4800 × 3600. It has a frame rate of 50 fps for fast operating and
processing and a magnification range of 1x to 5000x (74).
2.4.1.2 Scanning Electron Microscopy
Scanning Electron Microscopy (SEM) refers to an instrument
which uses a beam of high-energy electrons to image the surface of a
sample. It is widely used for characterisation of surfaces, materials and
devices to give surface topography information (75).
In SEM, a beam of high energy electrons interact with the atoms
of the sample under investigation, giving information about its
morphology and composition, as well as other physical properties and
traits. An SEM is typically made-up of an electron gun, various beam
deflection coils, a detector and display or recording device. Tungsten is
usually the source of choice for the filament of the electron gun due to its
high melting point and low vapour pressure. Other emitters include
lanthanum hexaboride cathodes. Current passes through the source,
45
emitting the electron beam. The beam with an energy range of 0.5 to 40
eV is focused through the magnetic deflection coils or scanning coils and
a final magnetic lens. This deflects the beam in the x and y axis by
applying a small current to the coils, so that it scans over the sample
surface. A SEM also typically contains an objective lens, used to focus
the small probe on the sample surface (75).
The electrons interact with the sample producing a number of
different signals which can be interpreted to give information. It allows
for the simultaneous acquisition of bright-field (BF), annular dark-field
(ADF) and secondary electron (SE) images. With BF and ADF,
transmitted electrons are used to generate the image. This gives
structural information about the sample’s interior. In contrast, SE
which is the most common mode of imaging with SEM, are formed when
incident electrons collide with the outer shell electrons in the sample,
ejecting these electrons. These secondary electrons are usually low
energy and give topographical information about the sample surface.
Electrons directed away from the surface of the inelastic scattering
process are known as backscattered electrons (BSE) and are dependent
on the mass of the atoms in the sample; higher atomic mass means more
BSE. This mode therefore gives information about the composition of the
sample (75).
The SEM used in these experiments was a Hitachi S-3400
(Hitachi Ltd, Japan).

46
2.4.2 Bioanalysis
2.4.2.1 BioAnalyzer
The concentration and integrity of the purified total RNA was
determined by capillary electrophoresis (RNA 6000 Pico kit, BioAnalyzer
2100, Agilent technologies, USA) as per the manufacturers’ instructions.
Electrophoresis is a technique used to separate DNA and RNA
fragments by size and charge. NA molecules move through an
electrophoretic gel under an electric field. The negatively charged NA
molecules move through the gel with the shorter molecules moving
faster and farther. In this way it is possible to receive information about
the NA molecules being detected.
The quality of the purified RNA was assessed by the RIN (RNA
Integrity Number). This is given by a built-in algorithm of the Agilent
Expert Software. The RIN algorithm analyses the entire electrophoretic
trace generated from an RNA sample. The algorithm builds regression
models using indicated peak positions, heights, areas, area ratios, S/N
ratio, maximum and minimum values, and waviness of the
electropherogram trace to assign a 1–10 score (76). RIN score of 1 means
the sample is degraded, and 10 scores for completely intact RNA.
According to the description of Agilent, the RIN algorithm is developed
to utilize neural networks and adaptive learning in conjunction with a
large database of eukaryote (organisms whose cells contain a nucleus)

47
total RNA samples. The RIN score is largely independent of the amount
of RNA used and the origin of the sample.
2.4.2.2 Nanodrop
In order to quantify nucleic acid presence in samples a UV-Vis
spectrophotometer was used. Nucleic acids absorb ultraviolet light in
known ways. In a spectrophotometer, the sample is exposed to light at
260 nm and the transmitted light is detected. The more light that is
absorbed by the sample indicates a greater nucleic acid concentration.
For quantification purposes the built in software uses a modified Beer-
Lambert equation to calculate the sample concentration c,
𝑐 =(𝐴 ∗ 𝜀)
𝑏 (𝑒𝑞𝑛. 2.1)
Where c is the nucleic acid concentration in ng/µL, A is the absorbance
in machine units, ε is the wavelength-dependent extinction coefficient in
ng-cm/µL and b is the pathlength in cm. A typical absorbance spectrum
is shown in Figure 2.8.
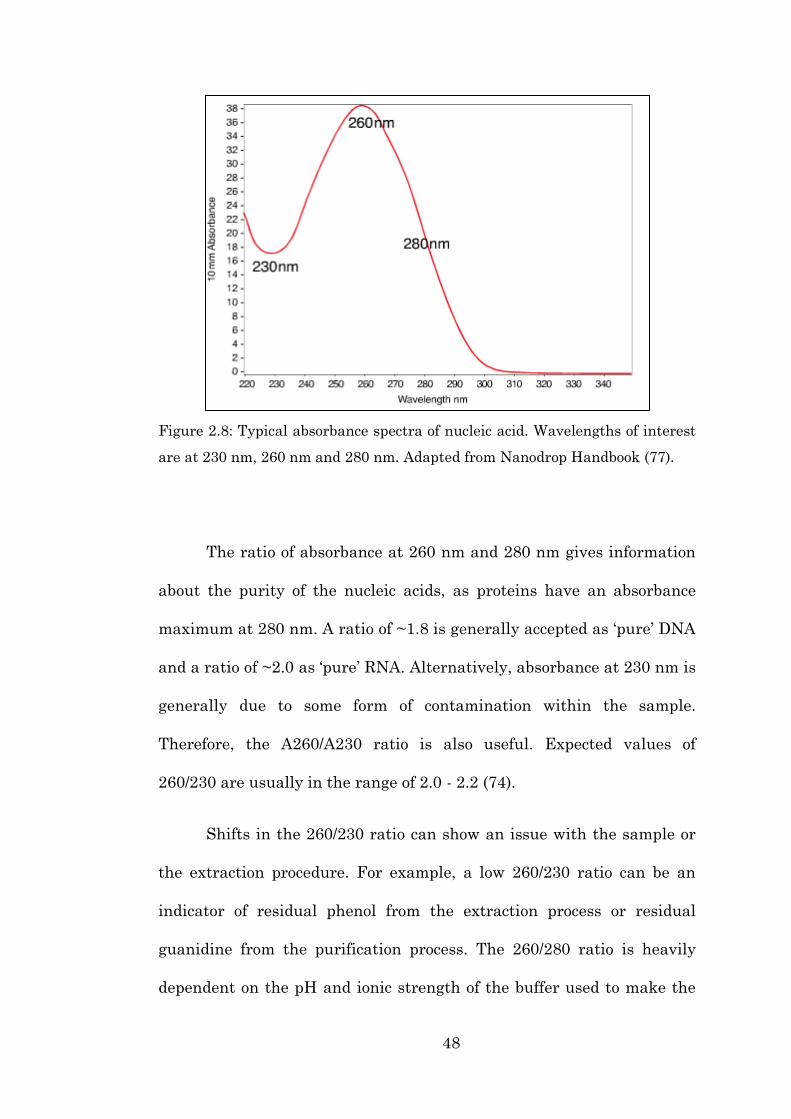
48
Figure 2.8: Typical absorbance spectra of nucleic acid. Wavelengths of interest
are at 230 nm, 260 nm and 280 nm. Adapted from Nanodrop Handbook (77).
The ratio of absorbance at 260 nm and 280 nm gives information
about the purity of the nucleic acids, as proteins have an absorbance
maximum at 280 nm. A ratio of ~1.8 is generally accepted as ‘pure’ DNA
and a ratio of ~2.0 as ‘pure’ RNA. Alternatively, absorbance at 230 nm is
generally due to some form of contamination within the sample.
Therefore, the A260/A230 ratio is also useful. Expected values of
260/230 are usually in the range of 2.0 - 2.2 (74).
Shifts in the 260/230 ratio can show an issue with the sample or
the extraction procedure. For example, a low 260/230 ratio can be an
indicator of residual phenol from the extraction process or residual
guanidine from the purification process. The 260/280 ratio is heavily
dependent on the pH and ionic strength of the buffer used to make the

49
sample measurement. Acid solutions under represent the ratio by 0.2 -
0.3, while basic solutions over represent it by 0.2 – 0.3. Also a low
260/280 ratio may indicate low concentration (> 10 ng/µL) of nucleic acid
(78).
The spectrophotometer used in this work was a Nanodrop 2000c
(Thermo Scientific, Ireland). The pedestal measurement of the device
requires only 0.5 – 2 µL of sample. The droplet is suspended between the
pedestals and stretched to form a known pathlength (Fig. 2.9). Optical
fibres are embedded within the upper and lower measurement surfaces.
The device has a wavelength range of 190 – 840 nm and a wavelength
accuracy of 1 nm. It has a lower limit of detection of 2 µg/mL for dsDNA
and an upper concentration limit of 15,000 µg/mL.
Figure 2.9: Droplet stretched on pedestal of Nanodrop spectrophotometer to
give a 1 mm pathlength. Adapted from Nanodrop Handbook (77).
2.4.2.3 Fluorescence Detection of DNA
In order to detect the quantity of DNA present post-purification a
Quant-iT™ PicoGreen® dsDNA Assay (Life Technologies, Dublin,
50
Ireland) was used. The kit allows the detection of as little as 25 pg/ml of
dsDNA in a background of RNA, ssDNA and free nucleotides and is
orders of magnitude more sensitive than UV absorption methods. It uses
a standard spectrofluorometer and fluorescein excitation and emission
wavelengths (excite at 480 nm and emission intensity measured at 520
nm). The kit has a linear detection range which extends over four orders
of magnitude from 25 pg/mL to 1000 ng/mL.
The DNA is suspended in a TE Buffer solution (10 mM Tris-HCl,
1mM EDTA, pH 7.5). The buffer comes as 20X TE Buffer solution which
must be diluted down to 1X TE Buffer using sterile, DNase-free water.
The Quant-iT™ PicoGreen® dsDNA dye used for fluorescence
must be prepared on the day of the experiment. The aqueous working
solution is acquired by making a 200-fold dilution of the concentrated
DMSO solution in 1X TE Buffer. The solution should be prepared in a
plastic container, instead of glass as it may absorb to the glass surface,
and must be protected from light as it is susceptible to
photodegradation.
To analyse the sample, a 1:1 quantity of sample and dye is placed
into a clear 96-well plate (Nunclon MicroWell, Sigma Aldrich). The
solutions are allowed to incubate for five minutes in the dark, and then
the plate was placed into the spectrofluotometer plate reader (Tecan
Safire 2, Tecan Group Ltd, Switzerland). The plate reader performs a
fluorescence intensity scan, exciting at 485 nm and detecting emission at

51
520 nm. The software outputs a fluorescence intensity signal for each of
the 96-wells.
2.4.2.4 Cell Counting
In order to identify the number of cells in a suspension a
haemocytometer was used. This gives the number of cells in a given
volume and is counted by direct examination under a microscope. The
haemocytometer is a glass chip which has a precise grid carved into it
(Fig 2.10). A cover slip is placed on top of the grid area, until Newton’s
rings are visible. This indicates that a chamber of precise depth has
been formed. Haemocytometers were originally developed for counting
blood cells but have also been designed for counting bacterial cells, as
was used in this work. The ruled grid area consists of 9 large square,
each 0.05 × 0.05 mm = 0.0025 mm2. The depth of the chamber is 0.01
mm. This gives a volume of each large square as 0.0025 mm2 × 0.01 mm
= 2.5 × 10⁻⁵ mm3. The four corner squares are subdivided into 16 smaller
squares and the centre square into 25 smaller squares (with each of
those 25 squares divided into a further 25 squares).

52
Figure 2.10: Grid structure of haemocytometer cell counter. Each of the 9
larger squares has an area of 0.0025 mm2.
A 7 µL volume of cell suspension is placed at the edge of the
coverslip so as to allow the solution to flow into the chamber by capillary
action. The slide is then viewed under an optical microscope. Depending
on the size of the cells under examination, the optimum area of the grid
is identified: the outer squares for large cells and the central squares for
small cells. The cells within a given square are counted, using a
predetermined method, i.e. count the cells within the square and those
touching the top and left line, but not those touching the bottom and
right lines. This procedure is repeated for a number of squares and the

53
average number of cells per square is calculated. The volume of a square
is a known quantity so the number of cells per mL can be identified (79).
2.5 Conclusion
The various methods for fabricating, testing and characterising
the microfluidic systems used as part of this work were given. The main
fabrication techniques are laser ablation and CNC milling. All testing of
the discs was performed on a spinstand. Structural analysis of the discs
and their components was performed using an optical microscope, 3D
microscope and SEM. Analysis of the biological samples collected from
the various devices was achieved using a BioAnalyzer, Nanodrop,
platereader and haemocytometer.

54
Chapter 3
Solvent Selective Router
for Centrifugally
Automated Solid-Phase
Purification of RNA
3.1 General Introduction
As discussed in detail in Chapter One nucleic acid testing is of
vast interest to the scientific community. The process can be broken
down into three stages: extraction, purification and detection. One of the
most common methods of purification is Solid-Phase Purification (SPP).
For the course of this work we used the well-established Boom chemistry
method (48). Nucleic acid purification has been implemented on
centrifugal microfluidics with relative success (31). One of the
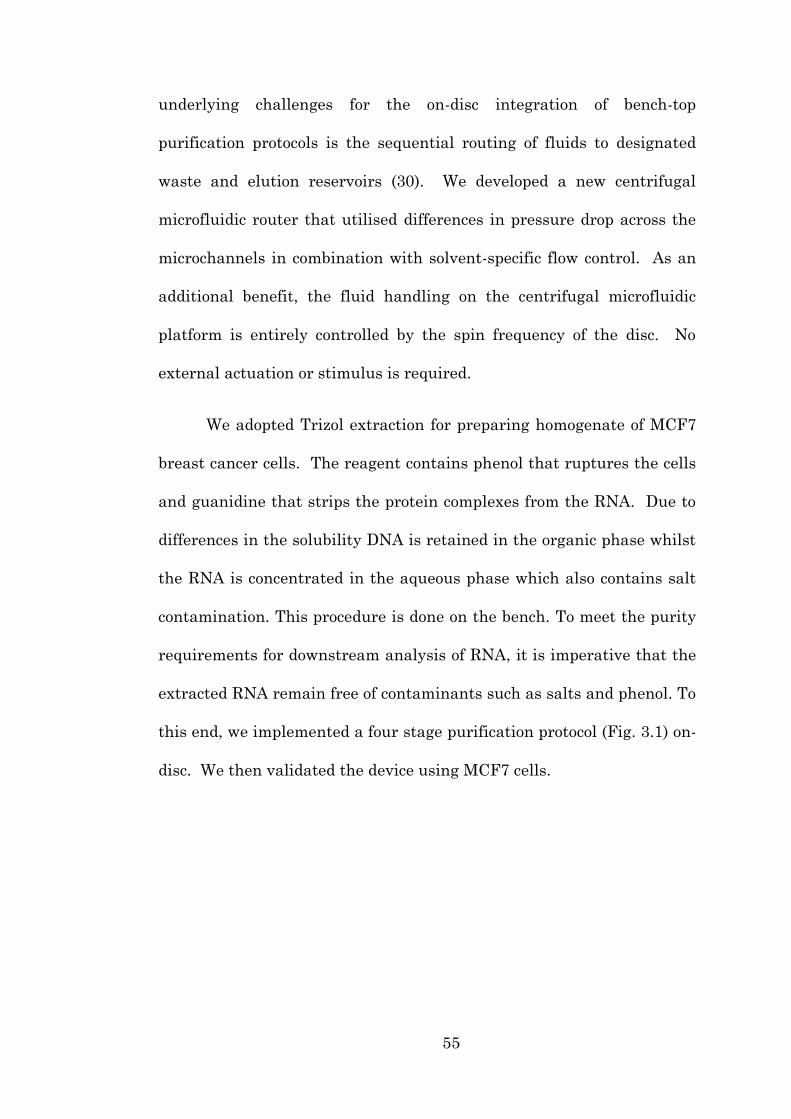
55
underlying challenges for the on-disc integration of bench-top
purification protocols is the sequential routing of fluids to designated
waste and elution reservoirs (30). We developed a new centrifugal
microfluidic router that utilised differences in pressure drop across the
microchannels in combination with solvent-specific flow control. As an
additional benefit, the fluid handling on the centrifugal microfluidic
platform is entirely controlled by the spin frequency of the disc. No
external actuation or stimulus is required.
We adopted Trizol extraction for preparing homogenate of MCF7
breast cancer cells. The reagent contains phenol that ruptures the cells
and guanidine that strips the protein complexes from the RNA. Due to
differences in the solubility DNA is retained in the organic phase whilst
the RNA is concentrated in the aqueous phase which also contains salt
contamination. This procedure is done on the bench. To meet the purity
requirements for downstream analysis of RNA, it is imperative that the
extracted RNA remain free of contaminants such as salts and phenol. To
this end, we implemented a four stage purification protocol (Fig. 3.1) on-
disc. We then validated the device using MCF7 cells.
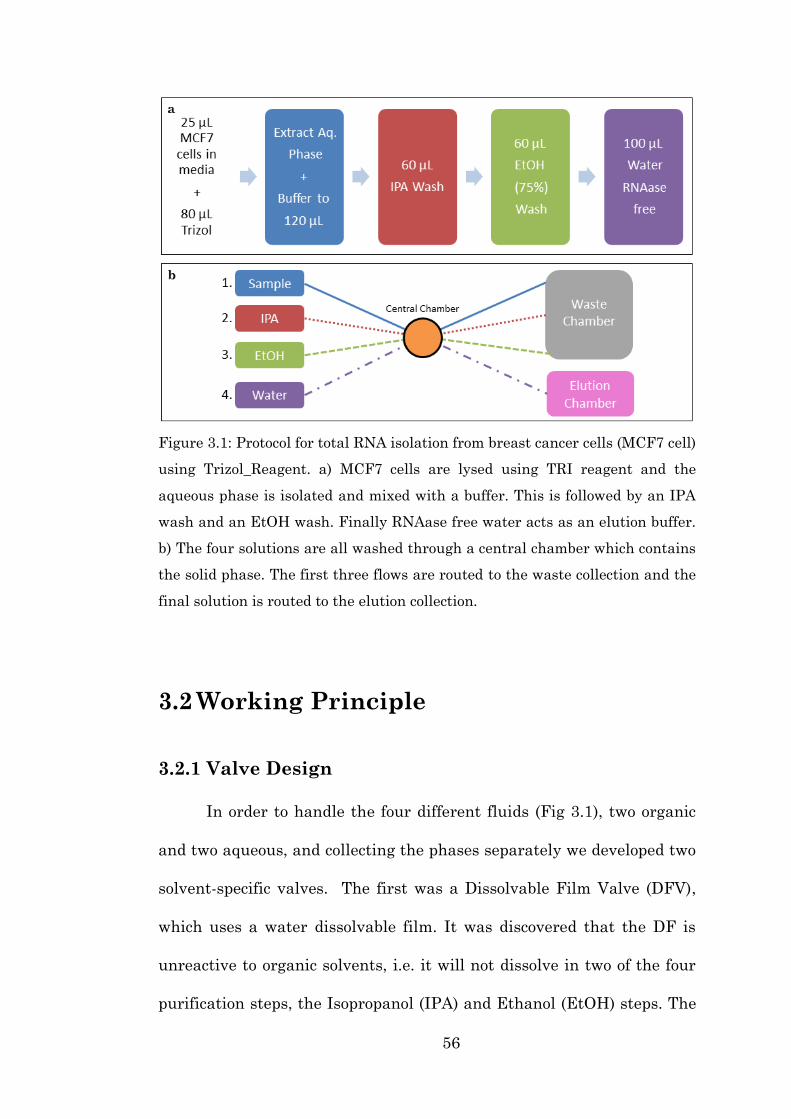
56
Figure 3.1: Protocol for total RNA isolation from breast cancer cells (MCF7 cell)
using Trizol_Reagent. a) MCF7 cells are lysed using TRI reagent and the
aqueous phase is isolated and mixed with a buffer. This is followed by an IPA
wash and an EtOH wash. Finally RNAase free water acts as an elution buffer.
b) The four solutions are all washed through a central chamber which contains
the solid phase. The first three flows are routed to the waste collection and the
final solution is routed to the elution collection.
3.2 Working Principle
3.2.1 Valve Design
In order to handle the four different fluids (Fig 3.1), two organic
and two aqueous, and collecting the phases separately we developed two
solvent-specific valves. The first was a Dissolvable Film Valve (DFV),
which uses a water dissolvable film. It was discovered that the DF is
unreactive to organic solvents, i.e. it will not dissolve in two of the four
purification steps, the Isopropanol (IPA) and Ethanol (EtOH) steps. The

57
ratio of organic to aqueous solution does however effect the dissolution
time of the film.
The second valve was a Hydrophobic Membrane Valve (HMV).
This HMV is made up of a PTFE-supported membrane which permits
the passage of the organic phase but remains impermeable to aqueous
solutions. The DFV is single-use and dissolves once in contact with
water whereas the HMV remains intact preventing water from passing
through. Using a method similar to Gorkin et al. (24) the valves were
assembled into a tab structure using two pieces of Pressure Sensitive
Adhesive (PSA). The precision knife cutter defined through holes in the
PSA. The rounded rectangular holes, cut into the PSA layers, were
identified as the optimum shape for flow through the tab. This was
determined by experimental validation. When a circle was used, (as
done so by Gorkin et al.), in our structure the presence of an air bubble
could sometimes block the passage of fluid through the tab. A smaller
square piece of HM or DF was then placed between the PSA layers
(Fig 3.2a,b). This sandwich structure allowed for better reliability of the
tabs as the HM/DF are completely sealed in between the ‘sticky’ PSA
layers.
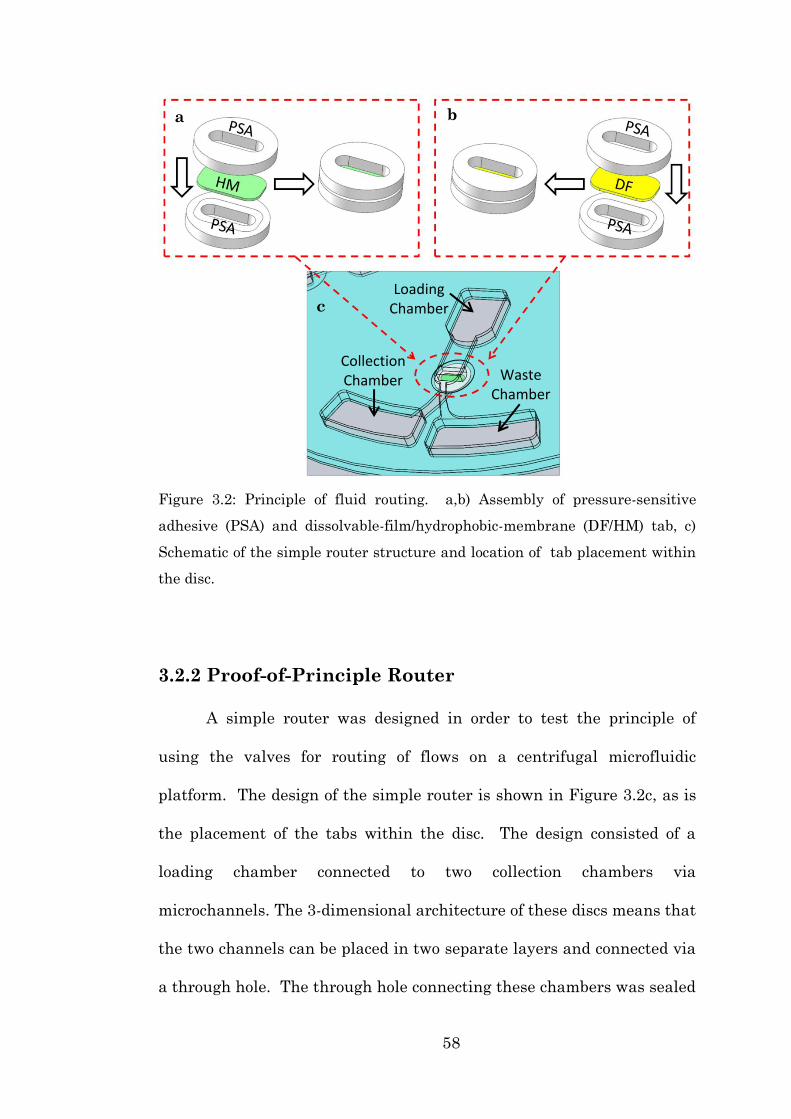
58
Figure 3.2: Principle of fluid routing. a,b) Assembly of pressure-sensitive
adhesive (PSA) and dissolvable-film/hydrophobic-membrane (DF/HM) tab, c)
Schematic of the simple router structure and location of tab placement within
the disc.
3.2.2 Proof-of-Principle Router
A simple router was designed in order to test the principle of
using the valves for routing of flows on a centrifugal microfluidic
platform. The design of the simple router is shown in Figure 3.2c, as is
the placement of the tabs within the disc. The design consisted of a
loading chamber connected to two collection chambers via
microchannels. The 3-dimensional architecture of these discs means that
the two channels can be placed in two separate layers and connected via
a through hole. The through hole connecting these chambers was sealed
Loading Chamber
Collection Chamber Waste
Chamber
a b
c
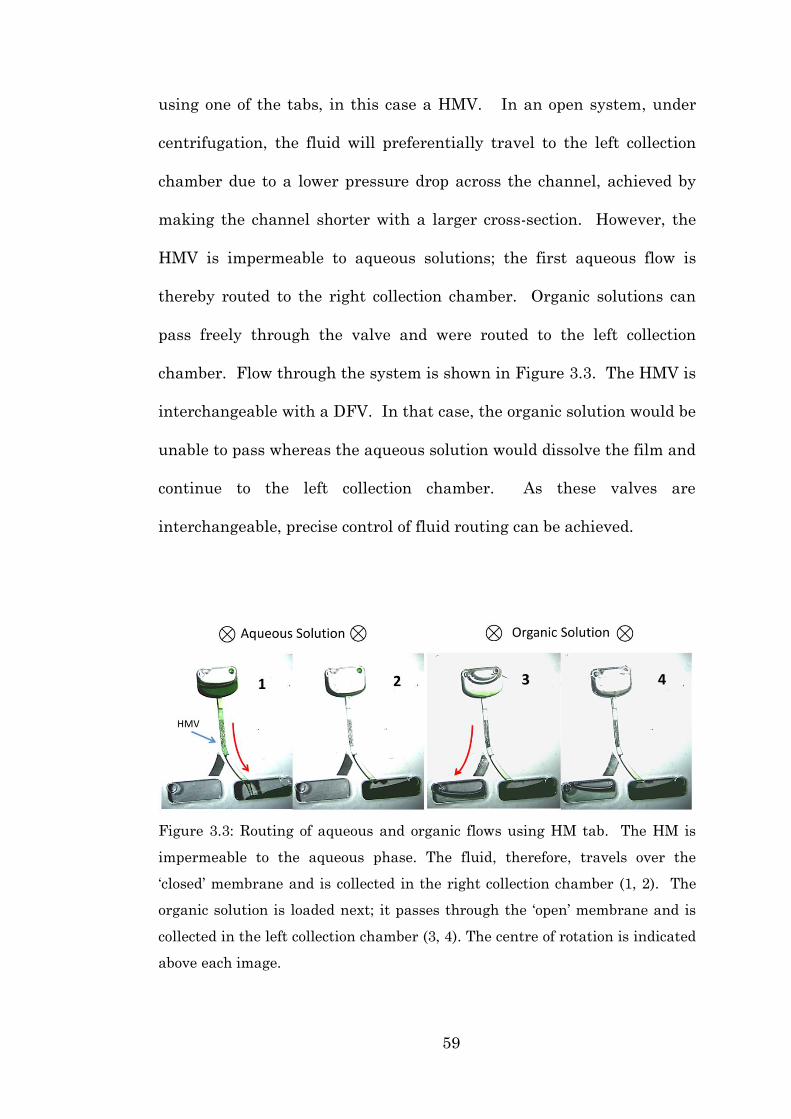
59
using one of the tabs, in this case a HMV. In an open system, under
centrifugation, the fluid will preferentially travel to the left collection
chamber due to a lower pressure drop across the channel, achieved by
making the channel shorter with a larger cross-section. However, the
HMV is impermeable to aqueous solutions; the first aqueous flow is
thereby routed to the right collection chamber. Organic solutions can
pass freely through the valve and were routed to the left collection
chamber. Flow through the system is shown in Figure 3.3. The HMV is
interchangeable with a DFV. In that case, the organic solution would be
unable to pass whereas the aqueous solution would dissolve the film and
continue to the left collection chamber. As these valves are
interchangeable, precise control of fluid routing can be achieved.
Figure 3.3: Routing of aqueous and organic flows using HM tab. The HM is
impermeable to the aqueous phase. The fluid, therefore, travels over the
‘closed’ membrane and is collected in the right collection chamber (1, 2). The
organic solution is loaded next; it passes through the ‘open’ membrane and is
collected in the left collection chamber (3, 4). The centre of rotation is indicated
above each image.

60
3.2.3 Combination Valve
In an attempt to adapt the simple router to handle the four fluids
required for SPP, a combo-valve was developed. The valve consisted of a
stacked structure of DF and HM tabs which would be inserted into the
simple router. The order of the stack would determine which directions
the fluids went and in which order. The design of the stacked combo-
valve is shown in Figure 3.4.
Figure 3.4: Combo valve designs. a) First configuration of the combo valve. A
DF was adhered to thin clear PSA, which was subsequently adhered to a HM
and thicker white PSA. All four layers were cut to the same diameter. b)
Second configuration of the combo valve. In this case the HM is ‘sandwiched’
between two layer of white PSA, with a DF stuck to the other side. The clear
PSA was abandoned due to difficulties with handling.
a b

61
A number of different configurations were attempted. Firstly the
individual layers were simply placed one on top of the other, with the
DF and HM layers being held together by clear PSA with a through hole
cut out (Fig. 3.4a). A white PSA layer was stuck to the underside of the
HM and the backing of this was used to adhere the tab to the disc. The
clear PSA is thinner than its white equivalent (~50 µm thickness versus
~86 µm). The overall thickness of the combo tab was ~250 µm which was
a considerable thickness to insert into the disc, therefore the hope was
that the clear PSA would remove at least some of this. Unfortunately,
the clear PSA proved extremely difficult to handle and the structure
shown in Figure 3.4a was prone to leaking especially in the HM layer,
which seemed not to adhere as well to the PSA as the DF did.
It was therefore, determined that the ‘sandwich’, shown
previously would solve the leaking issue and this was design was
implemented into the disc (Fig. 3.4b). The working principle is shown in
Figure 3.5.
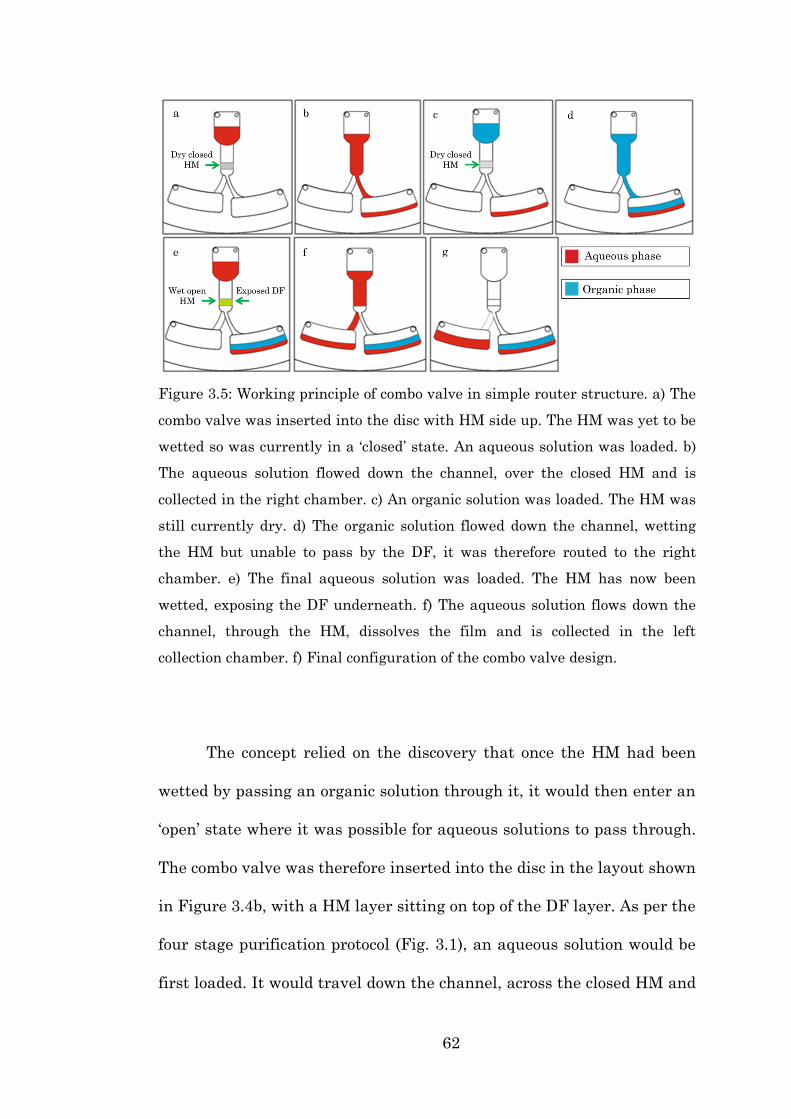
62
Figure 3.5: Working principle of combo valve in simple router structure. a) The
combo valve was inserted into the disc with HM side up. The HM was yet to be
wetted so was currently in a ‘closed’ state. An aqueous solution was loaded. b)
The aqueous solution flowed down the channel, over the closed HM and is
collected in the right chamber. c) An organic solution was loaded. The HM was
still currently dry. d) The organic solution flowed down the channel, wetting
the HM but unable to pass by the DF, it was therefore routed to the right
chamber. e) The final aqueous solution was loaded. The HM has now been
wetted, exposing the DF underneath. f) The aqueous solution flows down the
channel, through the HM, dissolves the film and is collected in the left
collection chamber. f) Final configuration of the combo valve design.
The concept relied on the discovery that once the HM had been
wetted by passing an organic solution through it, it would then enter an
‘open’ state where it was possible for aqueous solutions to pass through.
The combo valve was therefore inserted into the disc in the layout shown
in Figure 3.4b, with a HM layer sitting on top of the DF layer. As per the
four stage purification protocol (Fig. 3.1), an aqueous solution would be
first loaded. It would travel down the channel, across the closed HM and

63
be collected in the right chamber. Next an organic solution would flow
down the channel, through the HM but would not be able to pass the
DF. It would therefore also be routed to the right chamber. A second
organic solution would follow the same pathway. Finally, an aqueous
solution would flow down the channel, through the now open HM,
dissolve the DF and be collected in the left chamber.
Ultimately, this design proved unsuccessful for a number of
reasons. Firstly, though it was shown that passing organic solutions
through the HM turned it from a ‘closed’ to ‘open’ state, in the current
configuration the organic solution did not seem to pass through the
HMV at all. This was postulated to be because the DF was creating an
airtight seal on the underside of the HM. This meant that the final
aqueous solution was in fact interacting with a ‘closed’ HM. Secondly,
the DF requires time to dissolve and in this time the flow was still
occurring, therefore much of the sample would be lost to the right waste
chamber.
It was therefore decided that though the inclusion of the two
different membrane types within the one structure could handle all the
necessary fluidic steps for SPP, a more complex structure was needed to
accomplish this goal.

64
3.3 Router for RNA Extraction
This simple router was expanded upon for total RNA solid-phase
extraction as it only allowed for the routing of two fluids. The full router
was engineered to enable sequential handling of four separate fluids.
3.3.1 System Design
The final design (Fig. 3.6a) comprises of four chambers: the
loading chamber (L), the organic waste chamber (Worg), the aqueous
waste chamber (Waq) and the eluate collection chamber (Eaq). The
loading chamber is used for the loading of the sample and reagents. It
also contains the solid-phase, for which we used glass beads. Within the
chamber, we placed a baffle with laser ablated, 100-µm grooves, to
retain the glass beads (diameter ≤106-µm) under centrifugal flow (Fig.
3.6a inset left). Without this baffle some beads could travel down the
channel blocking the passage of fluid. The eluate collection chamber was
used to collect the purified RNA in the final step of the solid-phase
purification.
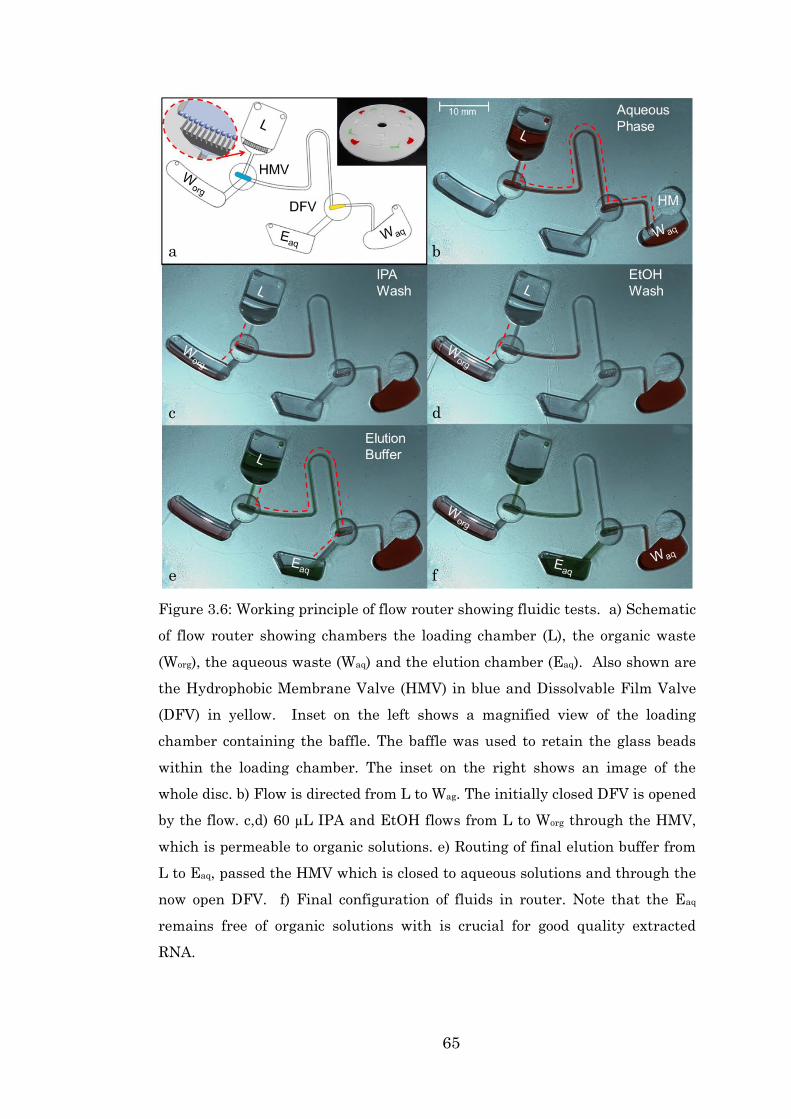
65
Figure 3.6: Working principle of flow router showing fluidic tests. a) Schematic
of flow router showing chambers the loading chamber (L), the organic waste
(Worg), the aqueous waste (Waq) and the elution chamber (Eaq). Also shown are
the Hydrophobic Membrane Valve (HMV) in blue and Dissolvable Film Valve
(DFV) in yellow. Inset on the left shows a magnified view of the loading
chamber containing the baffle. The baffle was used to retain the glass beads
within the loading chamber. The inset on the right shows an image of the
whole disc. b) Flow is directed from L to Wag. The initially closed DFV is opened
by the flow. c,d) 60 µL IPA and EtOH flows from L to Worg through the HMV,
which is permeable to organic solutions. e) Routing of final elution buffer from
L to Eaq, passed the HMV which is closed to aqueous solutions and through the
now open DFV. f) Final configuration of fluids in router. Note that the Eaq
remains free of organic solutions with is crucial for good quality extracted
RNA.
a b
c d
e f
66
Three different valves were implemented on the router: a HMV, a
siphon valve and a DFV. These valves are controlled by the fluid levels
and the spin frequency of the disc. Two of the composite “tabs” (HM and
DF) were placed in the multi-layer architecture of the router. The HMV
blocks access to the organic waste chamber (Worg) and the DFV seals the
elution buffer collection chamber (Eaq). A single channel with a siphon
valve leads the fluid over the HMV to the DFV. One microfluidic disc
can contain up to four identical structures (Fig. 3.6a, inset right)
permitting the extraction and enrichment of multiple samples
simultaneously.
3.3.2 Fluidic Operation
First the system was tested fluidically using sequential loading of
reagents along a series of intervals at specific spin frequencies (Fig. 3.6).
To test the principle, we used a scaled-down version of the extraction
protocol developed by Linares et al. (53) for total RNA. This extraction
process (Fig. 3.1) requires sequential treatment of the aqueous RNA
phase with 2-propanol (IPA), 75% ethanol (EtOH) and water. The
loading chamber was packed with 25-mg of acid-washed glass beads
(diameter < 106 µm). These beads represent the solid phase for the
purification of total RNA based on charge-charge interaction in a
solution that contains chaotropic salts.
67
The operating principle of the router was based on the following
protocol: first 120-µL of the crude aqueous phase extracted from a lysed
sample is added to the beads in the loading chamber (Fig. 3.6b). The
RNA in the sample binds to the acid-washed glass beads due to charge-
charge interactions, under chaotropic conditions. The acid-washed glass
beads are positively charged due to the sodium on their surfaces; they
interact with the phosphoric acid backbone of the RNA, which is
negatively charged (48). Under centrifugation the RNA-depleted
aqueous phase, travels down the channel and passed the HMV (which is
impermeable to aqueous solution), up over the siphon in Waq. As the flow
passes over the DFV it dissolves the film. There is a time delay on the
dissolution of the film and during this time all the fluid is collected in
Waq (Fig. 3.6b). Next the disc is stopped and IPA is pipetted into the
loading chamber (L). The IPA precipitates any remaining unbound RNA.
The disc is spun again, this time at a higher spin rate, in order to stop
the fluid from passing over the siphon. The IPA contacts the HMV and
passes through the PTFE-supported membrane, routing the fluid into
Worg (Fig. 3.6c). Any fluid remaining in the channel from the first step
passes through the now wetted PTFE-supported membrane. According
to the supplier, organic solvents change the permeability of the
membrane, thus making it possible for the remaining RNA-depleted
aqueous phase to pass into Worg. The EtOH is loaded and follows the
same path as the IPA. The EtOH rinses away any salts from the beads,
it also removes any residue left in the pre-crest siphon channel (Fig.
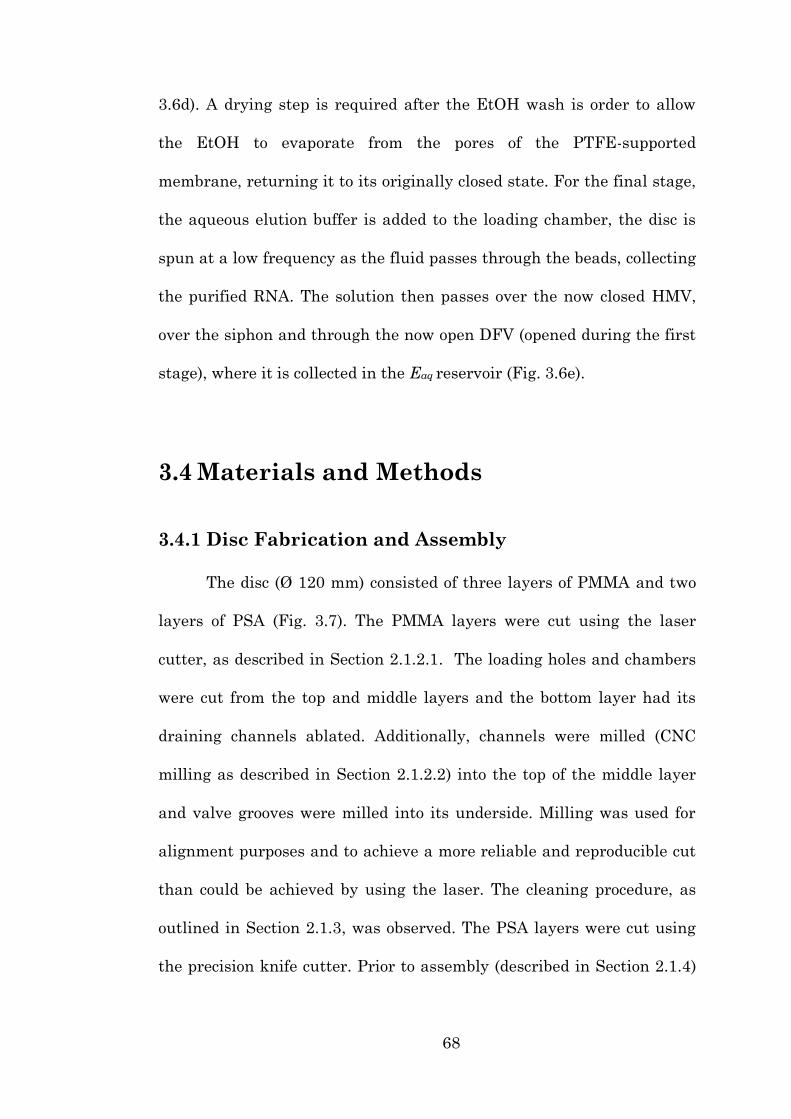
68
3.6d). A drying step is required after the EtOH wash is order to allow
the EtOH to evaporate from the pores of the PTFE-supported
membrane, returning it to its originally closed state. For the final stage,
the aqueous elution buffer is added to the loading chamber, the disc is
spun at a low frequency as the fluid passes through the beads, collecting
the purified RNA. The solution then passes over the now closed HMV,
over the siphon and through the now open DFV (opened during the first
stage), where it is collected in the Eaq reservoir (Fig. 3.6e).
3.4 Materials and Methods
3.4.1 Disc Fabrication and Assembly
The disc (Ø 120 mm) consisted of three layers of PMMA and two
layers of PSA (Fig. 3.7). The PMMA layers were cut using the laser
cutter, as described in Section 2.1.2.1. The loading holes and chambers
were cut from the top and middle layers and the bottom layer had its
draining channels ablated. Additionally, channels were milled (CNC
milling as described in Section 2.1.2.2) into the top of the middle layer
and valve grooves were milled into its underside. Milling was used for
alignment purposes and to achieve a more reliable and reproducible cut
than could be achieved by using the laser. The cleaning procedure, as
outlined in Section 2.1.3, was observed. The PSA layers were cut using
the precision knife cutter. Prior to assembly (described in Section 2.1.4)
69
the tabs were stuck into the valve grooves on the underside of the
middle PMMA layer.
Figure 3.7: Exploded view of disc assembly. The (Ø 120 mm) disc consists of
five layers: three PMMA layer and two PSA layers.
3.4.2 MCF7 Cell Culture
MCF7 cells (DSMZ, Braunschweig, Germany) were cultured in 75
cm flasks in Dulbecco's Modified Eagle's Medium (DMEM),
supplemented with 10 % foetal bovine serum (FBS), 100 UmL−1
penicillin and 100 µgmL−1 streptomycin. The cultures were maintained
at 37 °C with 5 % CO2. Cells were harvested by incubation in 5 mL 0.25
% trypsin/0.1 % EDTA at 37 °C for 5 min followed by neutralization with
70
5 mL culture medium. Cells were centrifuged at 300×g for 4 min and
resuspended in culture medium. The cells used in this study were
collected between their 17 and 25 passages. Passaging, also known as
subculturing, is the processes were by cultured cells are transferred to
fresh growth media, thereby sustaining the cell line (80). This procedure
was performed by Dr. Macdara Glynn.
3.4.3 Benchtop Lysis and RNA Extraction
Cells were lysed by mixing a 25 µL aliquot in growth media with
80 µL of TRI Reagent. The aliquots contained 2.96×10⁵ – 7.4×10⁴ MCF7
cells. This mixture was vortexed for 1 minute and left to incubate at
room temperature for 9 minutes. To each of the samples 5 µL of 4-
bromoanysole was added enhancing the phase separation and the
extraction. All samples were centrifuged at 13000 RPM (14000 g) for 10
minutes at room temperature. During this process complete phase
separation occurs with the aqueous, RNA containing phase, above the
organic phase, containing DNA. The aqueous phase (60 µL) was
removed for on-disc purification. The interphase between the aqueous
and organic phases was not disturbed during the extraction as it could
influence the quality of the purified RNA at the end. In parallel a
negative control experiment was set up with an ‘empty’ sample
containing only the growth media without cells.

71
3.5 Results and Discussion
3.5.1 Fluidic Analysis
Experimental validation was performed to determine the
optimum fluid volumes and spin frequencies for each stage of the four
step process. The final spin frequency protocol is shown in Figure 3.8. A
five minute incubation period, while the disc was at rest was necessary
to allow the RNA time to bind to the beads. Another five minute elution
period was observed during the final stage, to allow the RNA time to
detach from the beads and re-suspend in the elution buffer. It was
determined that these two waiting periods enhanced the purification
efficiency. During the course of testing it was also determined that a five
minute drying step should follow the EtOH wash. This allows for the
siphon to dry before the final elution step, thus improving the reliability
of the system. When this drying step was omitted, the elution buffer
would sometimes seep over the siphon and mix with the aqueous waste
fraction.
After the initial waiting period, the disc was spun up to 12.5 Hz to
allow the first aqueous sample to travel over the siphon. The IPA and
EtOH washes were spun at a considerably higher frequency of 75 Hz, to
stop these fluids from traveling over the siphon, which is a low-
frequency pass valve, and contaminating the final sample. It takes
approximately 3.5 minutes at this spin frequency for the PTFE-
supported membrane (HM) to open, as the RNA depleted aqueous phase
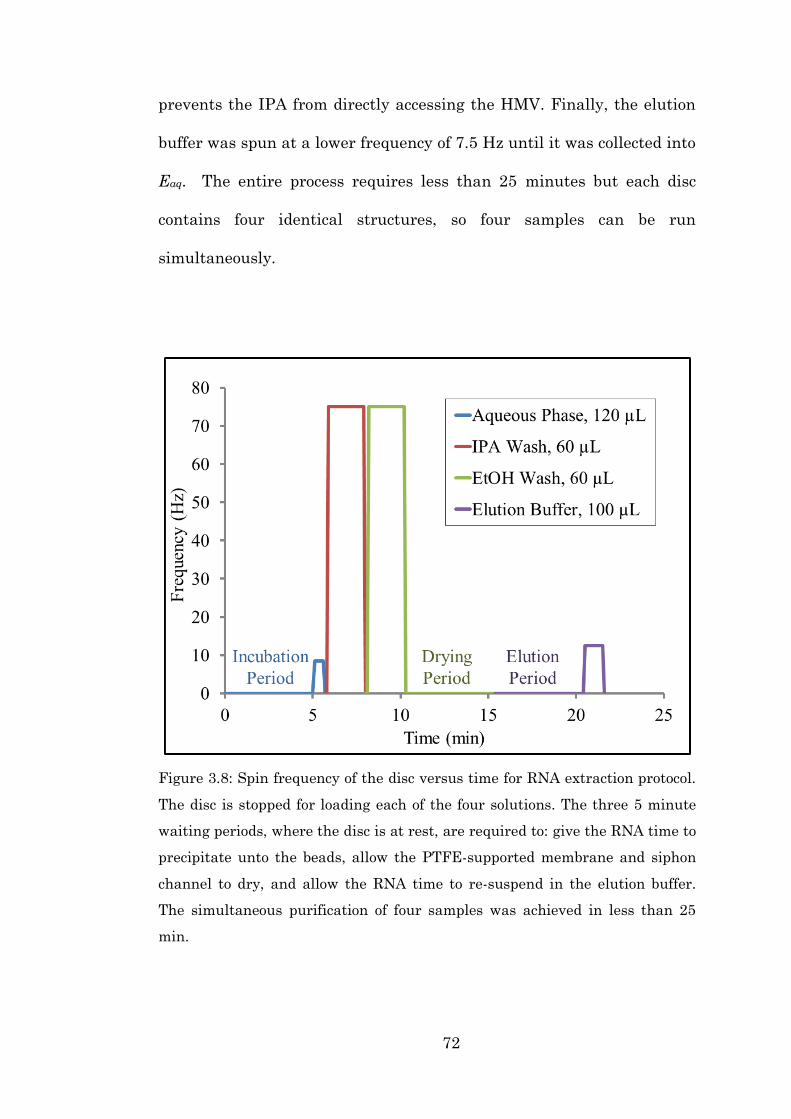
72
prevents the IPA from directly accessing the HMV. Finally, the elution
buffer was spun at a lower frequency of 7.5 Hz until it was collected into
Eaq. The entire process requires less than 25 minutes but each disc
contains four identical structures, so four samples can be run
simultaneously.
Figure 3.8: Spin frequency of the disc versus time for RNA extraction protocol.
The disc is stopped for loading each of the four solutions. The three 5 minute
waiting periods, where the disc is at rest, are required to: give the RNA time to
precipitate unto the beads, allow the PTFE-supported membrane and siphon
channel to dry, and allow the RNA time to re-suspend in the elution buffer.
The simultaneous purification of four samples was achieved in less than 25
min.
73
An addition to the control given by the valving technologies and
variation in spin rates, was the deliberate design of the interconnect
between the elution collection chamber (Eaq) and the aqueous waste
chamber (Waq) (Fig.3.9). During the final elution stage, the centrifugally
stabilized fluid volume already resident in the right chamber (Waq) from
the first flow through, blocks all vents, thus acting akin to a solid plug to
practically create a dead-end channel. The system can be simplified
because both fluids are aqueous solutions and have identical contact
angles with the channel walls and the channel has uniform cross section
on both sides of the air pocket. For the sake of clarity, we neglect
capillary and inertial effects, so the flow into the right outlet will hence
stop once the pressure in the interspersed air pocket balances the
centrifugal pressure exerted by the incoming fluid. The air pocket thus
acts as a fluidic capacitance (81) where the final pressure of the air
𝑃 = 𝑃𝑖𝑛𝑖 ∙ (𝑉𝑖𝑛𝑖
𝑉) (𝑒𝑞𝑛. 3.1)
depends on the initial (typically atmospheric) pressure Pini and the ratio
of the initial and final volumes Vini and V, respectively (Fig. 3.9). The
flow in the lateral channel stops once the pressure in the air pocket
equilibrates the centrifugally induced pressure
𝑃𝜔 = 𝜌𝜔2�̅�∆𝑟 (𝑒𝑞𝑛. 3.2)

74
with the fluid density ρ, the angular frequency ω, the radial length �̅�
and the mean position ∆𝑟 of the incoming fluid plug. So essentially, the
here considered routing function is tightly linked to the sequence of
fluids and sealing the air pocket formed between the advancing and the
stationary fluids. To help with sealing the air pocket, we placed a PTFT-
supported membrane (HM) over the air vent in Waq (Fig. 3.6). The
membrane allows air to be vented but is impermeable to aqueous
solutions. In this way, it stops the fluid in Waq from being centrifugally
pumped out by the incoming air pocket.
Figure 3.9: Schematic of the fluidic capacitance, dissolution of the DF (yellow)
and routing of the aqueous flows, where Pini is the atmospheric pressure, Vini is
the volume of the lateral channel and P with V is their centrifugally
compressed counterparts under centrifugal force (fc), directed from the centre
to the periphery of the disc (black arrows). The axis of rotation is denoted by ⊗
above each panel.
3.5.2 On-disc RNA Purification
To validate the functionality of on-disc SPP with our router, we
performed cell lysis and RNA extraction on the bench, of MCF7 cells
75
with TRI Reagent. The extracted volumes were diluted with water to
120 µL with RNAase free water and the complete volume was loaded on-
disc. The protocol described in Figure 3.6 was performed and the
purified samples were extracted.
Samples were collected from both Eaq (the purified sample) and
Waq (unbound sample). These were also compared with the control
sample where no RNA was detected. The results of this are shown in
Figure 3.10. The electropherogram shows that the recovered RNA
originated from the cells and not from the growth media. The quantity
of total RNA extracted from Waq is significantly less than the one
recovered from the yield of Eaq. A concentration of 180 pg µL−1 was
measured in the purified fraction (100 µL), against 37 pg µL−1 (120 µL)
in the waste fraction. This is a solid proof for the successful retention of
the RNA on the glass beads.
Furthermore the electropherogram for the rRNA peaks (18S and
28S) of the sample from Waq is shifted left in relation to the typical
migration times. We relate this behaviour to the residual salts in the
Waq (82). Extending on the purity of the sample, from the RNA integrity
numbers (RIN) in Table 3.1 one can deduce that the sample from Eaq is
less degraded than the one eluted in Waq.

76
Figure 3.10: Electropherograms showing solid-phase purification efficiency on-
disc. Total RNA content was measured from the purified sample Eaq (green),
the waste sample Waq (red) and a control blank (black). The dashed line
indicates the shift in waste sample which is attributed to residual salts in the
Waq. The inset displays the bench-top extracted sample using 2-propanol
precipitation and the position of the peaks of pure total RNA (blue).
Table 3.1: Summary of electropherogram for the above samples. An Integrity
Number (RIN) of 10 corresponds to intact RNA, while 1 indicates completely
disintegrated RNA.
Total
RNA
RIN 28S/18S pg/uL
Eaq 7.7 2.6 180
Waq 6.4 1.8 37
Control 1 NA 10
As part of our investigation, bench-top extraction was performed
lysing 9.5×10⁴ MCF7 cells. IPA precipitation was used, followed by two

77
consecutive washes with EtOH. We measured total RNA of 32.3 ng from
this bench-top sample. The RNA recovered from an identical sample
after on-disc extraction resulted in 3.9 ng of total RNA. By normalising
the results and assuming that the bench-top extraction was 100%
efficient, our purification efficiency was 12.1 % (by weight) of extracted
total RNA from an identical sample using a purification protocol on
bench without beads. The percentage of purified RNA on-disc varied
between samples with different cell counts. For the 1.48×10⁵ cells, 43 %
of the total RNA was retained on the beads, from which 7.2 % was
recovered from the elution fraction. Variations in the packaging of the
solid phase would inevitably lead to fluctuations of the amount of
recovered total RNA. Further investigation and optimization of the
solid-phase extraction protocol should follow in order to further raise
both the capture and elution efficiency of total RNA.
The electropherograms obtained for the varying number of MCF7
cells are show in Figure 3.11. These show that high-quality RNA was
recovered from the eluted fraction. For the MCF7 RNA studied (n = 8),
RIN values were in the range of 7.2–9.2. An average of 16.8 ng was
recovered from the 2.96×10⁵ cells, which was less than the 23.1 ng from
1.48×10⁵ MCF7 cells. Evidently, the cell number and the amount of
ribosomal RNA (18S and 28S) are not correlated as indicated by the
peak height variations in Figure 3.11. According to previous studies,
random fluctuations of ribosomal RNA are not uncommon (83).
However, the RIN is the criterion used here to evaluate solid-phase
78
extraction and RNA quality on our disc. Based on qualitative analysis of
the rRNA, we conclude that the purified RNA has preserved high
integrity after on-disc purification with the solvent-specific router.
Further analysis indicates that the quantity of recovered small
RNAs is proportional to the number of cells in a starting sample. From
the integrated area of the peaks with migration time between 24 and 28
s, the small RNA fraction was quantified for four different cell
concentrations. We focused on this region as many potential biomarkers
have been identified as small RNAs. Figure 3.11b compares the purified
small RNA concentrations to cell content.

79
Figure 3.11: Electropherogram of the total RNA purified on-disc from four
different aliquots of MCF7 cells. a) Vertical lines between 24 and 28 s
designate the region of small RNA (size range 30–200 nt). B) Mean values and
standard deviations from triplicate samples containing (red) 2.96×10⁵, (yellow)
1.48×10⁵, (light blue) 7.4×10⁴, (blue) 3.7×10⁴ of MCF7 cells.
In spite of the significant loss of RNA, the results suggest that our
platform is applicable for small RNA purification.

80
3.6 Automated Solvent-Selective Routing
Building on the full router system, an advanced design was
developed that allowed for the fully automated RNA purification. The
system built on the work of Kinahan et al. who established an event-
triggered valving scheme which utilized the dissolvable films. This led to
a system whereby the release of reagents from a chamber is triggered by
the dissolution of a film in a previous chamber (27). This system is run
at a constant angular velocity. We extended the functionality of the
even-triggered release by adding a secondary control mechanism,
variation of angular velocity (Fig. 3.12).
This work was preformed predominantly by Dr. Nikolay Dimov
with assistance from the author and was published as a conference
manuscript (84).

81
Figure 3.12: Fluidic operation of automated solvent selective router. All
samples were initially loaded. The dashed lines show the path of the fluid flow.
a, b) The aqueous phase (red) is directed to the aqueous waste chamber while
the RNA remains on the glass beads in the loading chamber. c) An EtOH wash
is released over the beads and directed to the organic waste chamber through
the HMV. d) The spin frequency of the disc is increased actuating a primer
solution (white) which is routed to the elution chamber through the DFV. e)
This solution dissolves the valve within the chamber and triggers the release of
the elution buffer. f) Aqueous elution phase (blue) re-suspends the RNA and
mixes with the primer solution in the elution chamber. This sample can then
be removed from the disc for analysis and detection. (84)
82
3.7 Conclusions
In summary, a novel centrifugal flow control method was
developed which integrated two solvent specific membranes: the HM
and DF. A simple router system was expanded upon to develop a full
router which was capable of handling the four stage SPP protocol for
RNA. We then purified total RNA with significant integrity and
concentration. Finally an automated event-triggered system was
developed.
83
Chapter 4
Characterisation of
Graphene Oxide Membrane
Properties for Advanced
Microfluidic Flow Control
4.1 General Introduction
Since its discovery in 2004 (85), a wide spectrum of fascinating
characteristics of graphene and its compounds, such as the here
considered graphene oxide (GO), have been extensively investigated by
the scientific community. In recent years, microfluidic systems have
been used to characterise the distinctive properties of graphene, such as
its electrochemical responses (86). Ang et al. used a graphene transistor
array in a microfluidic chip for the detection of malaria-infected red
84
blood cells (87). Lo et al. included glycidyl methacrylate functionalized
graphene oxide within a hydrogel which showed a significant increase in
size change when exposed to infrared radiation (88).
However, while being explored by a broad scientific community,
the wide spectrum of the often unique properties of graphene has so far
not been implemented for microfluidic flow control; this is presumably
due to the fact that it does not bind well to polymer surfaces. To leverage
our experiments, we first developed a scheme for the integration of GO
membranes in common, polymeric microfluidic devices.
A multitude of methods for graphene membrane fabrication have
been developed with varying time scales and levels of repeatability. The
first method used by Novoselov et al. was the scotch tape method,
whereby layer upon layer of graphite was mechanically exfoliated away
until a single layer (one atom thick) of graphene was achieved (85).
Other methods include Chemical Vapour Deposition (CVD). This method
allows for very pure graphene substrates to be made but it is a costly
and lengthy process.
The properties of such integrated GO membranes are anticipated
to enable a multitude of applications and advanced flow control. We
demonstrate two such properties of the GO membranes: their solvent
selectivity and air impermeability (Fig. 4.1). Beyond a specific burst
pressure, GO membranes allow water to pass through at very low flow
resistance; however, it completely blocks the organic solutions IPA and
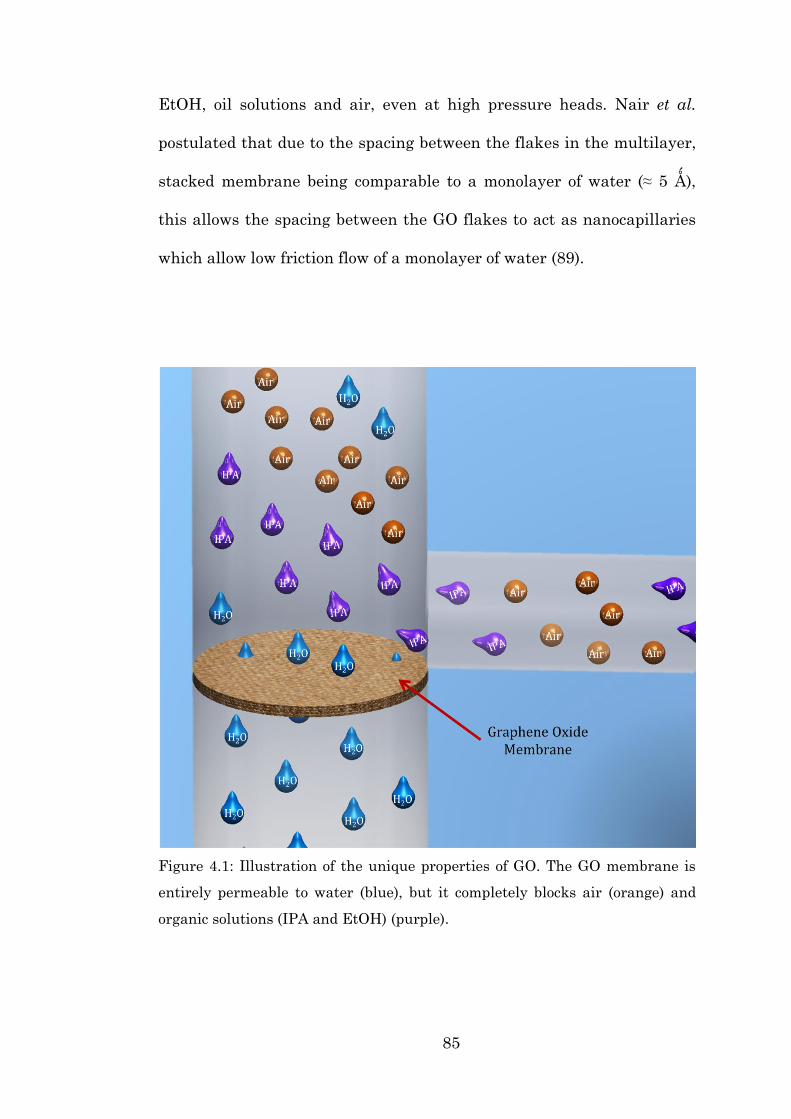
85
EtOH, oil solutions and air, even at high pressure heads. Nair et al.
postulated that due to the spacing between the flakes in the multilayer,
stacked membrane being comparable to a monolayer of water (≈ 5 Ǻ),
this allows the spacing between the GO flakes to act as nanocapillaries
which allow low friction flow of a monolayer of water (89).
Figure 4.1: Illustration of the unique properties of GO. The GO membrane is
entirely permeable to water (blue), but it completely blocks air (orange) and
organic solutions (IPA and EtOH) (purple).
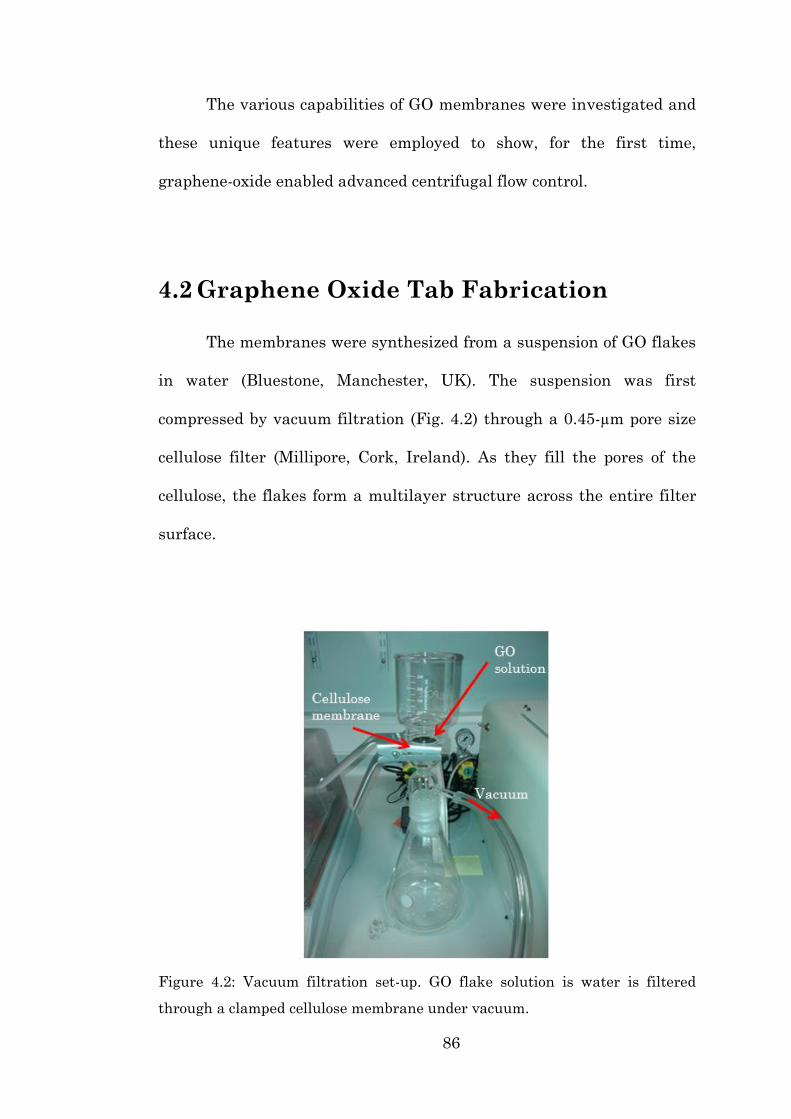
86
The various capabilities of GO membranes were investigated and
these unique features were employed to show, for the first time,
graphene-oxide enabled advanced centrifugal flow control.
4.2 Graphene Oxide Tab Fabrication
The membranes were synthesized from a suspension of GO flakes
in water (Bluestone, Manchester, UK). The suspension was first
compressed by vacuum filtration (Fig. 4.2) through a 0.45-µm pore size
cellulose filter (Millipore, Cork, Ireland). As they fill the pores of the
cellulose, the flakes form a multilayer structure across the entire filter
surface.
Figure 4.2: Vacuum filtration set-up. GO flake solution is water is filtered
through a clamped cellulose membrane under vacuum.
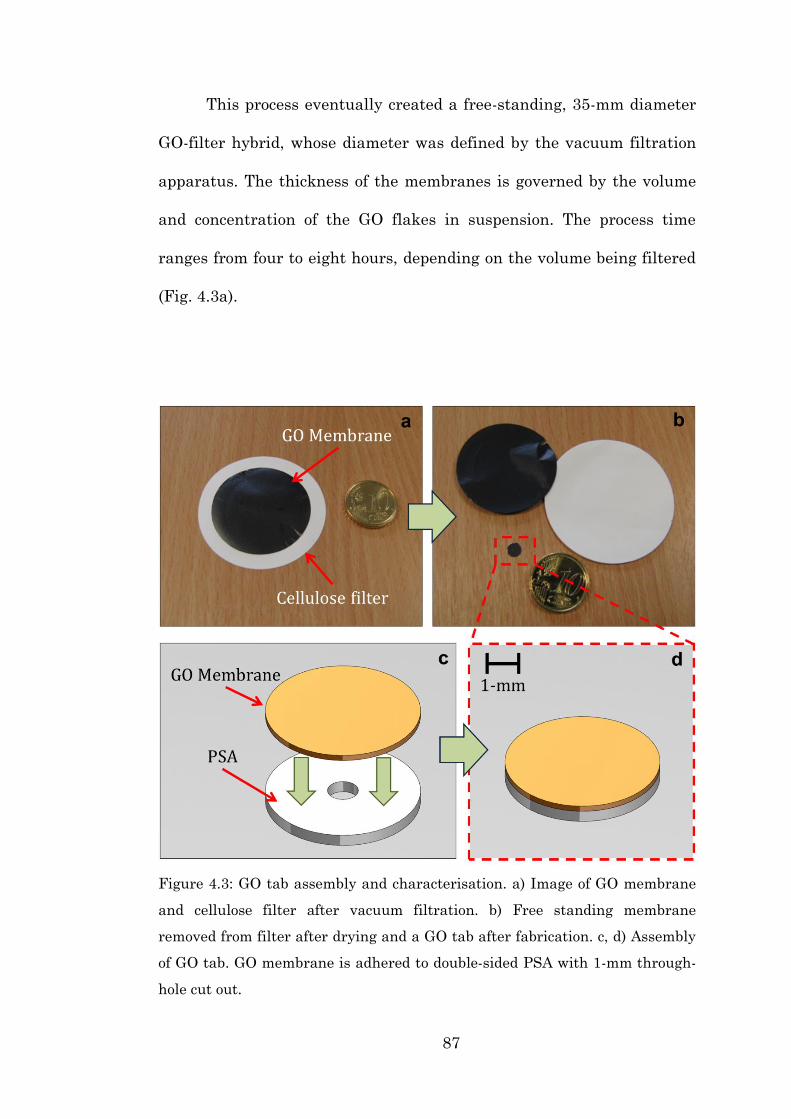
87
This process eventually created a free-standing, 35-mm diameter
GO-filter hybrid, whose diameter was defined by the vacuum filtration
apparatus. The thickness of the membranes is governed by the volume
and concentration of the GO flakes in suspension. The process time
ranges from four to eight hours, depending on the volume being filtered
(Fig. 4.3a).
Figure 4.3: GO tab assembly and characterisation. a) Image of GO membrane
and cellulose filter after vacuum filtration. b) Free standing membrane
removed from filter after drying and a GO tab after fabrication. c, d) Assembly
of GO tab. GO membrane is adhered to double-sided PSA with 1-mm through-
hole cut out.

88
Once filtration was completed, the membranes were removed
from the vacuum filtration set-up and left to dry for approximately four
hours. During this time the membranes remained in contact with the
cellulose filters. The completion of this drying step was crucial as prior
handling of the membranes could lead to tearing. The membrane could
then be peeled from the cellulose filters and be handled with ease (Fig.
4.3b).
In order to incorporate the GO into a microfluidic device a method
for attaching the membrane to the polymer surface had to be devised.
Once again, using a method first shown by Gorkin et al., the membrane
was adhered to double-sided Pressure Sensitive Adhesive (PSA), which
featured a small, 1-mm diameter through hole. The contours and size of
the GO and PSA tab was then flexibly defined using a precision knife
cutter (Section 2.1.2.3). Next, the GO tab was integrated in a
microfluidic system using the ‘sticky’ PSA backing (Fig. 4.3c, d).
4.2.1 Measuring the Thickness of a GO Tab
In order to evaluate the variation in thickness of the GO
membranes a method for measuring that thickness had to be devised.
Qualitatively, it could be determined that filtering a more concentrated
volume of GO in water would result in a thicker tab, by the colour shift
from a bronze to dark brown colour, but it was unclear how much

89
variation in thickness would be achieved. A number of methods for
measuring the thickness were attempted, with varying levels of success.
Figure 4.4: Various methods for determining membrane thickness and
variation across the surface. a) Optical microscope image showing tab edge. b)
AFM of small area of tab surface showing localised variation. c) SEM image of
cross-section of GO tab showing a membrane thickness of ~ 10 µm. d) SEM
image of ‘curling’ effect of slicing the membrane. e) 3D microscope image of
entire tab. f) 3D microscope image of ridge encountered at edge of membrane.
90
First an optical microscope was used to view the GO after being
cut by the precision knife cutter (Fig. 4.4a). From this the relative clean
cut of the tab edge could be observed, as could the full coverage of the
GO flakes across the tab surface. This did not however give any useful
information about the thickness of the tab or the variations with the
membrane surface.
Atomic Force Microscopy (AFM) (Dimension 3100, Bruker), which
could give topographical information about the surface, was investigated
next (Fig. 4.4b). This gave very accurate information of the thickness
variance in a very small area (5.0 x 10.0 µm = 50 µm2) but the through-
hole of the GO tab has a 1-mm diameter giving a surface area of ~7.85 x
105 µm2. This was far too large a surface area to image with AFM in any
reasonable time frame.
Scanning Electron Microscopy (SEM) was used next. A section of
GO tab was sliced using a blade in order to get a cross-sectional image.
The membrane was then clamped between two pieces of copper to give it
rigidity. This entire structure was then coated in a few layers of gold
using a sputter coater. Figure 4.3c shows an SEM image of a cross
section of a GO membrane clearly displaying the multilayer stacked
structure. This membrane possesses a thickness of approximately 10-
µm. From this, the even distribution of the flakes can be observed. This
method for measuring the thickness worked well enough, however an
issue often occurred during the processes. The slicing of the GO tab, in
91
order to get a cross-section, would often cause the flakes at the edge to
curl in on themselves (Fig. 4.4d). This made it difficult to determine the
thickness of that tab.
Finally, a 3D-Microscope (Section 2.4.1.1) was used. This set-up
proved to be the most useful, as it was capable of taking a 3-dimensional
image of the tab surface and, depending on the magnification,
measuring the variation in depth across the surface. The tab was struck
to a solid surface and a depth up image was taken. Figure 4.4e shows a
3D image of the entire tab structure. Using the in-built measurement
capabilities of the Keyence software it was determined that the tab
could have a variation of approximately ± 10 µm across the surface. If a
tab was cut from the edge of a filtered membrane (Fig. 4.3a) there would
be a ridge of approximately 100 µm high (Fig. 4.4f). This showed that
only tabs cut from the centre of the filtered membrane should be used in
order to avoid huge variations in thickness. The 3D microscope proved to
be the most useful of the measurement techniques as it gave the most
information about the entire surface of the tab.
4.3 Investigation of GO Properties
Three distinct properties of the GO were investigated: its air
impermeability, solvent selectivity and wetting capabilities. These
properties were tested over a given pressure range on three centrifugal
microfluidic discs.
92
4.3.1 Air Impermeability
Figure 4.5 shows the design for testing the impermeability of the
GO tabs to air. This disc consisted of three layers of PMMA and two
layers of PSA. The discs contained four identical structures; each of
them featured a loading chamber and two symmetric side arms which
were connected via a common inlet channel. Both side arms exhibited a
hole at the top which had been sealed by either a PSA or GO tab. For the
sake of clarity in these tests, coloured food-dye in water was used,
though the fluid would not make direct contact with the tabs.
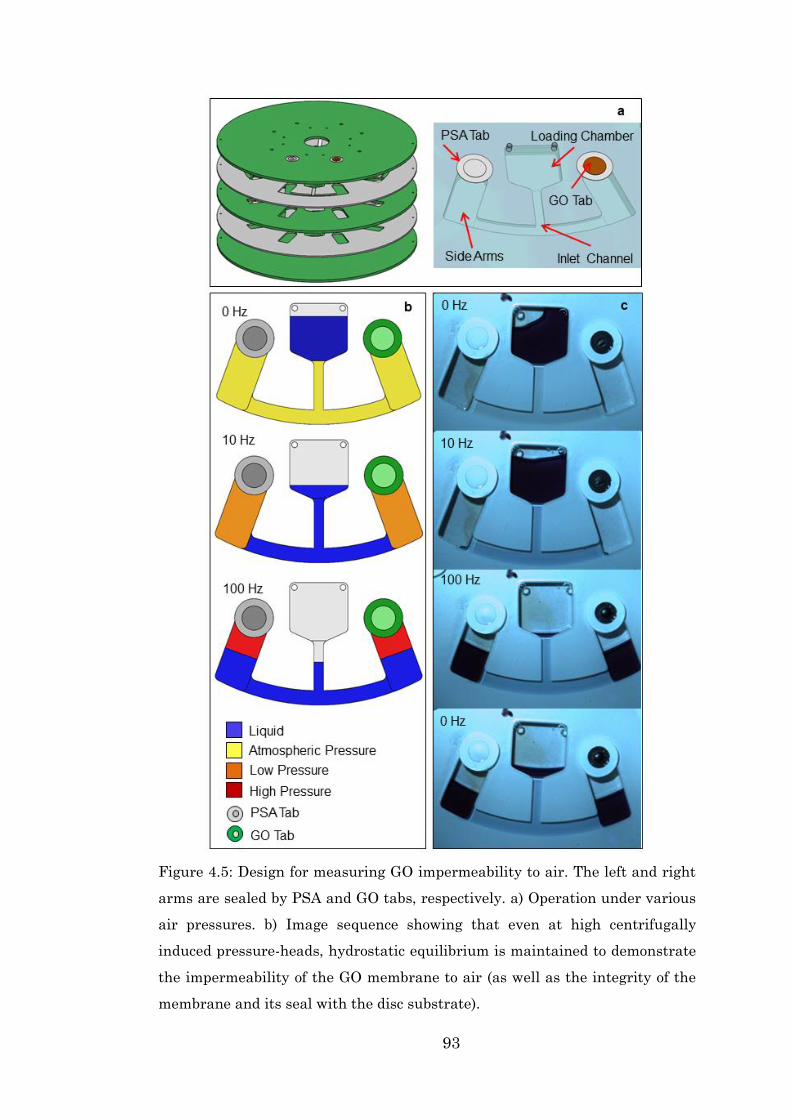
93
Figure 4.5: Design for measuring GO impermeability to air. The left and right
arms are sealed by PSA and GO tabs, respectively. a) Operation under various
air pressures. b) Image sequence showing that even at high centrifugally
induced pressure-heads, hydrostatic equilibrium is maintained to demonstrate
the impermeability of the GO membrane to air (as well as the integrity of the
membrane and its seal with the disc substrate).
94
A 180-µL volume was added to the loading chamber. This fluid
trapped and hence enclosed the air inside the inlet channel and side
arms. With the increase of the rotationally induced centrifugal field,
fluid extends down the inlet channel to compress the air in the side
arms. The fluid reached the interface between the channel and side arm
at a rotational frequency of 10 Hz. As the disc was spun faster up to a
rotational frequency of 100 Hz, the fluid reached the side arms and
continued to rise (Fig. 4.5a). Figure 4.5b shows that there was no
discernible difference of the fluid levels in both side arms at the upper
spin frequency, thereby proving the air-impermeability and pressure-
tightness of GO tab.
Another interesting feature is the rather high, rotationally
induced pressures,
∆𝑝𝜔 = 𝜌∆𝑟𝑟𝜔2 (eqn. 4.1)
where ∆𝑝𝜔is the burst pressure in Pascals, 𝜌 is the density of the fluid,
∆𝑟 is the length of the fluid plug, 𝑟 is the distance of the tab from the
centre of rotation and 𝜔 is the angular frequency, that the tabs can
withstand.
Upon loading, the fluid seals the air inside the channel and arms
essentially under atmospheric pressure. As the spin frequency was
increased to 10 Hz, the air pocket sealed by the GO tab was compressed
to approximately 25 mbar (obtained using Boyle’s Law). Finally, at 100
Hz, there was a significant increase in pressure of approximately
95
750 mbar. This verifies the sufficient mechanical strength of the
integrated GO membranes. This can be observed in Figure 4.5b where
the GO tab bends without disruption.
4.3.2 Solvent Selectivity
Figure 4.6 describes the disc used to test the solvent selectivity of
the GO. The disc was made up of four layers of PMMA (green) and four
layers of PSA (grey). It contained ten identical structures. Each
structure consisted of a 3D architecture containing a Loading Chamber
with a 1-mm hole at the base of the chamber. This vertical via is
connected to a channel on the bottom layer of the disc. The hole was
sealed by one of the GO tabs. The channel then connected to a Collection
Chamber (Fig. 4.6b).

96
Figure 4.6: Design for testing the solvent selectivity of the GO. a) Multi-layer
disc structure, with PMMA (green) and PSA (grey) layers. b) 3-dimensional
architecture connecting loading chamber to collection chamber via a through-
hole, sealed by a GO tab. c) Solvent selectivity of GO. DI water passes through
at 50 Hz while the membrane is impermeable for the organic solvents IPA and
EtOH, even at the much higher spin frequency of 125 Hz.

97
In order to test the solvent selective properties of the GO, three
fluids were added to the chambers: deionized (DI) water, 2-propanol
(IPA) and ethanol (EtOH). A 50-µL volume was added to the Loading
Chamber. Under centrifugation the fluid generated a hydrostatic
pressure head acting on the GO tab. The rotational frequency was
increased at regular intervals until the membrane yielded. In the case of
DI water the plug passed through the GO at approximately 50 Hz, or 8
mbar (Fig. 4.6c). Notably, once the ‘burst’ pressure was exceeded, the
water penetrated with very low flow resistance. In contrast, the organic
solutions IPA and EtOH were fully retained in the Loading Chamber,
even at the highest spin frequency of 125 Hz, or 49 mbar, that we could
implement on our test stand.
This simple test demonstrates the complete impermeability of the
GO membrane to these organic solutions while offering very little flow
resistance to water above a certain pressure threshold. Further
experiments, using the structure shown in Fig. 4.6, gave evidence that
the GO is also impermeable to oil solutions; both Fluorinert FC40 and
mineral oil where incapable of passing through the GO tab even at the
highest spin frequency of 125 Hz.
It should be noted that the tabs are single use. If a solution is
flowed through the membrane it becomes mechanically weak and is no
longer resistant to air or organic solutions.
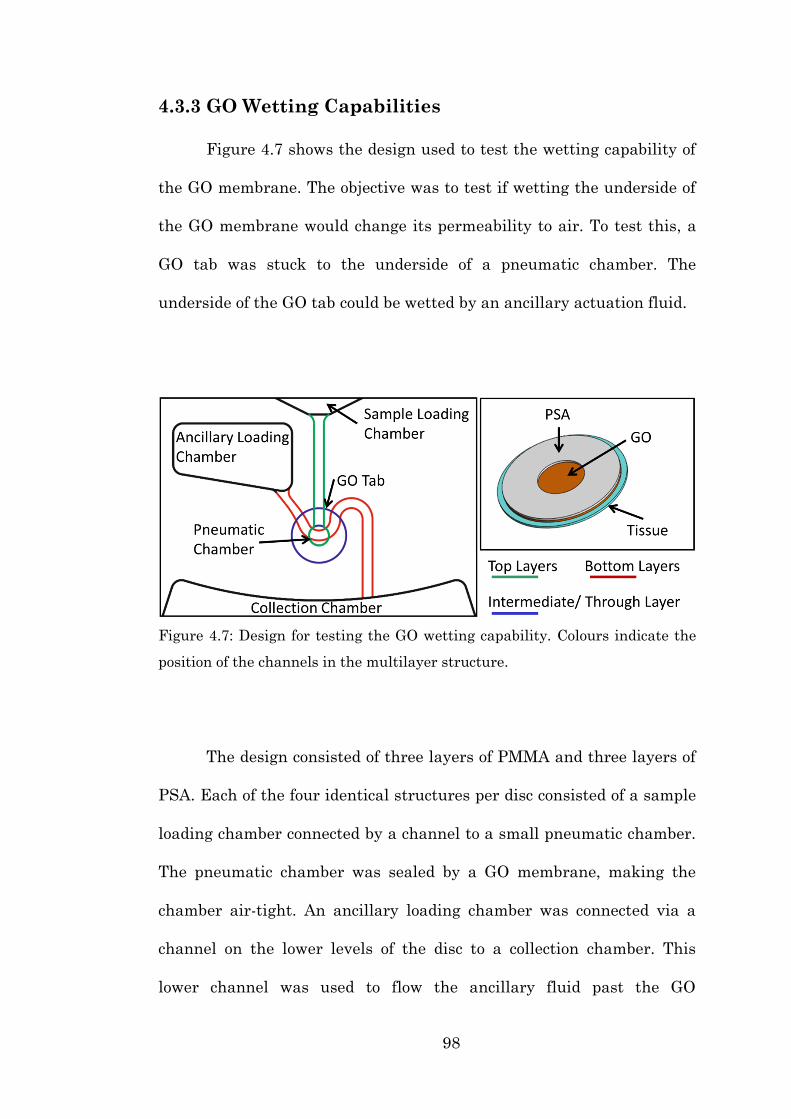
98
4.3.3 GO Wetting Capabilities
Figure 4.7 shows the design used to test the wetting capability of
the GO membrane. The objective was to test if wetting the underside of
the GO membrane would change its permeability to air. To test this, a
GO tab was stuck to the underside of a pneumatic chamber. The
underside of the GO tab could be wetted by an ancillary actuation fluid.
Figure 4.7: Design for testing the GO wetting capability. Colours indicate the
position of the channels in the multilayer structure.
The design consisted of three layers of PMMA and three layers of
PSA. Each of the four identical structures per disc consisted of a sample
loading chamber connected by a channel to a small pneumatic chamber.
The pneumatic chamber was sealed by a GO membrane, making the
chamber air-tight. An ancillary loading chamber was connected via a
channel on the lower levels of the disc to a collection chamber. This
lower channel was used to flow the ancillary fluid past the GO
99
membrane. A thin cellulose ‘tissue’ was placed as a backing material to
the GO membrane (Fig. 4.7b). The tissue acts as a sponge, keeping the
ancillary fluid in contact with the GO and ensuring good wetting. To
further enhance the wetting a small crest was placed in the channel
after the tab position to increase the contact time of the GO tab with the
fluid.
To determine if wetting one side of the tab would affect the air
impermeability of GO membrane a coloured water sample was loaded
into the sample loading chamber and water was loaded into the
ancillary loading chamber. The disc was spun at a low frequency (10
Hz). Due to the radially increased position of the ancillary loading
chamber the fluid in that chamber flowed first. The frequency was
maintained at this level until the ancillary fluid had completely emptied
to the collection chamber. The frequency was then increased at regular
intervals until the coloured sample moved down the loading channel,
where it compresses the air in the pneumatic chamber. As the disc was
spun faster the pressure on the pneumatic chamber increased until a
burst frequency, where the fluid begins to enter the pneumatic chamber,
was reached. The frequency, at which the first drops of fluid enter the
chamber, was recorded. The spin frequency was then increased at
regular intervals again until complete inversion of the air and fluid
occurred and the fluid flowed through the membrane to the collection
chamber. The frequency that this occurs at was also recorded. The

100
results of the first drops and GO burst, for wetting and no wetting of the
tab, were compared. The results are shown in Figure 4.8.
Figure 4.8: Effect of wetting GO tab on its air impermeability and mechanical
strength. The data shows that the wetting the tab does not make it more
permeable to air but does appear to decrease the strength of the membrane
making it burst at a lower frequency.
The results show that wetting the GO membrane has little to no
effect on the air impermeability of the membrane. The first drops
entered the pneumatic chamber at the same frequency regardless of
whether the tab had been wetted or not. This shows that there was no
reduction in air pressure within the chamber; if the membrane had
become permeable to air then the first drops would have occurred at a
lower frequency. An interesting point though is that wetting the GO tab
101
appears to have weakened it somewhat mechanically so that the fluid
would flow through the membrane at a lower frequency (and therefore
pressure) than its un-wetted counterpart.
This experiment showed us that the GO tab could be placed
within a structure where it is wetted and will maintain its air
impermeability but will reduce its burst frequency.
4.3.4 Characterisation of GO Tabs
Using the structure shown in Figure 4.6, the capabilities of the
solvent selective nature of the GO tabs were investigated. First, as the
membranes had been shown to be permeable to water but completely
impermeable to IPA, water and IPA mixtures were also tested. Solutions
with varying water concentration in IPA were flowed through the GO
tabs, up until the water concentration at which a burst could no longer
be achieved. The tab used in these experiments was approximately 10-
µm thick. The spin frequency was recorded and, using the geometry of
the disc, the burst pressures were calculated using Equation 4.1. Each
test was repeated five times per water concentration.

102
Figure 4.9: Change in burst pressure required for the passage of fluid with
varying water concentrations in IPA. The data shows an inverse relationship
between the water concentration in the solution and burst pressure require for
flow. Data points are mean ± 1 standard deviation, n=5.
The burst pressure required for flow increases with reduction of
the water content (Fig. 4.9). It was also determined that any solution
with a concentration below 40% water was incapable of passing through
the GO tab, even at the highest spin frequency we could realise for
safety reasons.
The second experiment revealed the correlation between the
thickness of the GO membrane and the burst pressure for water. The
variation in the tab thickness was achieved by filtering different
concentrations of GO flakes (Fig. 4.3). In this case four different
membrane thicknesses were used with approximate thicknesses of
27 µm, 35 µm, 38 µm and 44 µm. The thickness of the GO membrane
0
5
10
15
20
25
30
35
40
100% 90% 80% 70% 60% 50% 40%
Bu
rst
Pre
ssu
re (
mb
ar)
Water Concentration in IPA
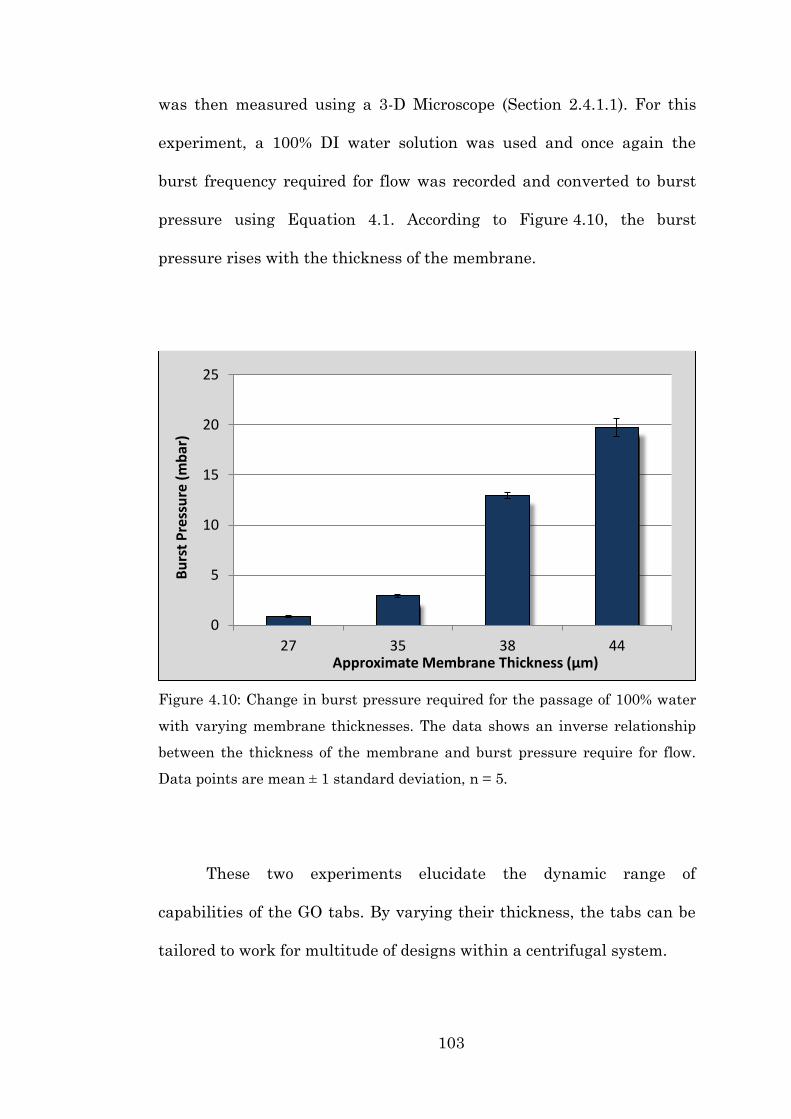
103
was then measured using a 3-D Microscope (Section 2.4.1.1). For this
experiment, a 100% DI water solution was used and once again the
burst frequency required for flow was recorded and converted to burst
pressure using Equation 4.1. According to Figure 4.10, the burst
pressure rises with the thickness of the membrane.
Figure 4.10: Change in burst pressure required for the passage of 100% water
with varying membrane thicknesses. The data shows an inverse relationship
between the thickness of the membrane and burst pressure require for flow.
Data points are mean ± 1 standard deviation, n = 5.
These two experiments elucidate the dynamic range of
capabilities of the GO tabs. By varying their thickness, the tabs can be
tailored to work for multitude of designs within a centrifugal system.
0
5
10
15
20
25
27 35 38 44
Bu
rst
Pre
ssu
re (
mb
ar)
Approximate Membrane Thickness (µm)

104
4.4 Conclusions
A new method for the integration of a GO tab within a polymeric
microfluidic structure was shown. Using centrifugal flow control, various
unique features of GO, notably its solvent selectivity and air
impermeability were investigated. This membrane is completely
impenetrable to the organic solutions IPA and EtOH, as well as mineral
oil and FC40, but yields at moderate spin rates to an aqueous phase.
The solvent selectiveness of the membrane makes it an ideal material
for robust automation of nucleic acid purification protocols on
centrifugal LoaD platforms.

105
Chapter 5
Graphene Oxide Enabled
Centrifugo-Pneumatic
Routing of Flows for
Nucleic Acid Purification
5.1 General Introduction
As previously discussed centrifugal microfluidic platforms can
offer significant benefits for nucleic acid testing. In particular the
highly-labour intensive process of nucleic acid purification could be
incorporated and integrated into these systems. The solvent-selective
router described in Chapter Three took significant strides towards this
goal. The integration of the DF and HM valves opened up new avenues
for fluidic flow control methods.
106
In order to allow for more condensed handling of fluids, new and
more dynamic materials can offer diverse benefits for flow control. The
work described in Chapter Four showed that Graphene Oxide (GO)
displays unique properties, notably its solvent selectivity and air
impermeability. Beyond a certain threshold burst pressure, GO
membranes allow aqueous solutions to pass with very little flow
resistance but are completely resistant to organic solutions and air. This
holds true even at significantly high pressure heads.
The unique properties of the GO made it an excellent material to
harness for performing on-disc nucleic acid solid phase purification
(SPP) (48). As shown in Section 3.1, in this a sequence of different fluids
some aqueous and some organic are passed through a single chamber
which contains some solid phase, e.g. glass beads. Yet, each of these
fluids must be routed away from the final collection chamber so as not to
contaminate the sample for detection.
This chapter describes the design and testing of a centrifugal
microfluidic disc which uses a centrifugo-pneumatic router and
harnesses the unique properties of GO membranes for advanced flow
control and uses it to perform on-board DNA purification.
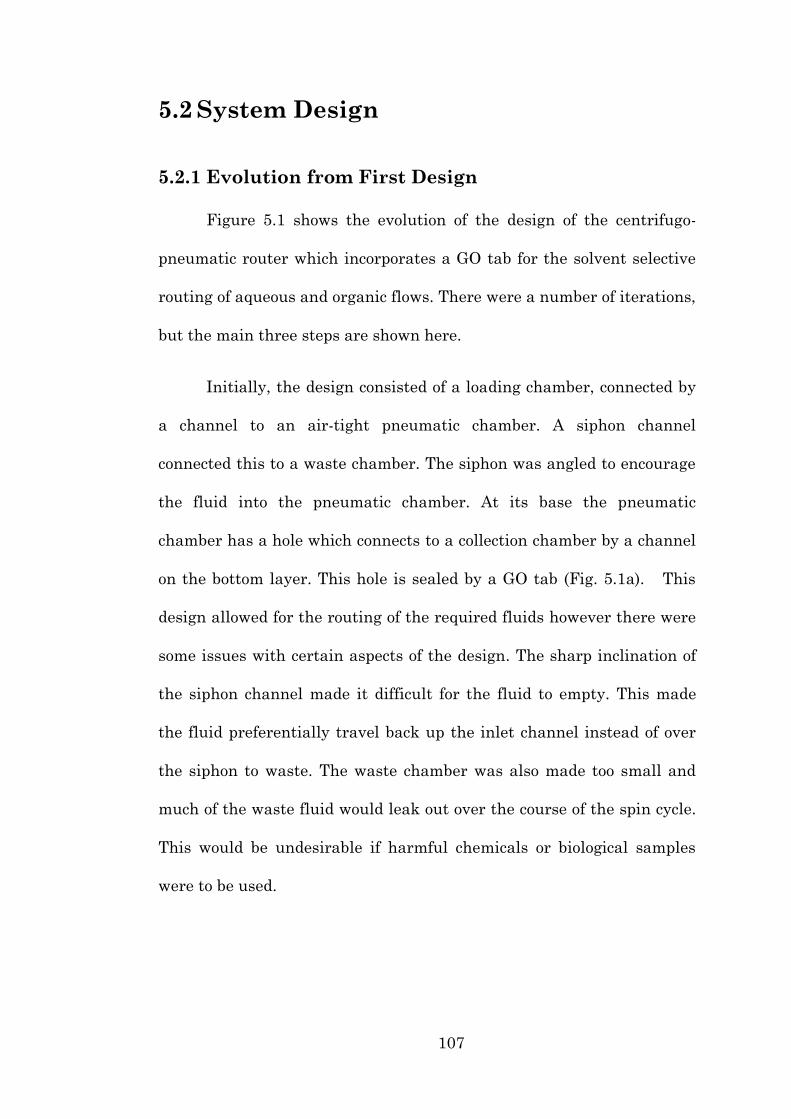
107
5.2 System Design
5.2.1 Evolution from First Design
Figure 5.1 shows the evolution of the design of the centrifugo-
pneumatic router which incorporates a GO tab for the solvent selective
routing of aqueous and organic flows. There were a number of iterations,
but the main three steps are shown here.
Initially, the design consisted of a loading chamber, connected by
a channel to an air-tight pneumatic chamber. A siphon channel
connected this to a waste chamber. The siphon was angled to encourage
the fluid into the pneumatic chamber. At its base the pneumatic
chamber has a hole which connects to a collection chamber by a channel
on the bottom layer. This hole is sealed by a GO tab (Fig. 5.1a). This
design allowed for the routing of the required fluids however there were
some issues with certain aspects of the design. The sharp inclination of
the siphon channel made it difficult for the fluid to empty. This made
the fluid preferentially travel back up the inlet channel instead of over
the siphon to waste. The waste chamber was also made too small and
much of the waste fluid would leak out over the course of the spin cycle.
This would be undesirable if harmful chemicals or biological samples
were to be used.
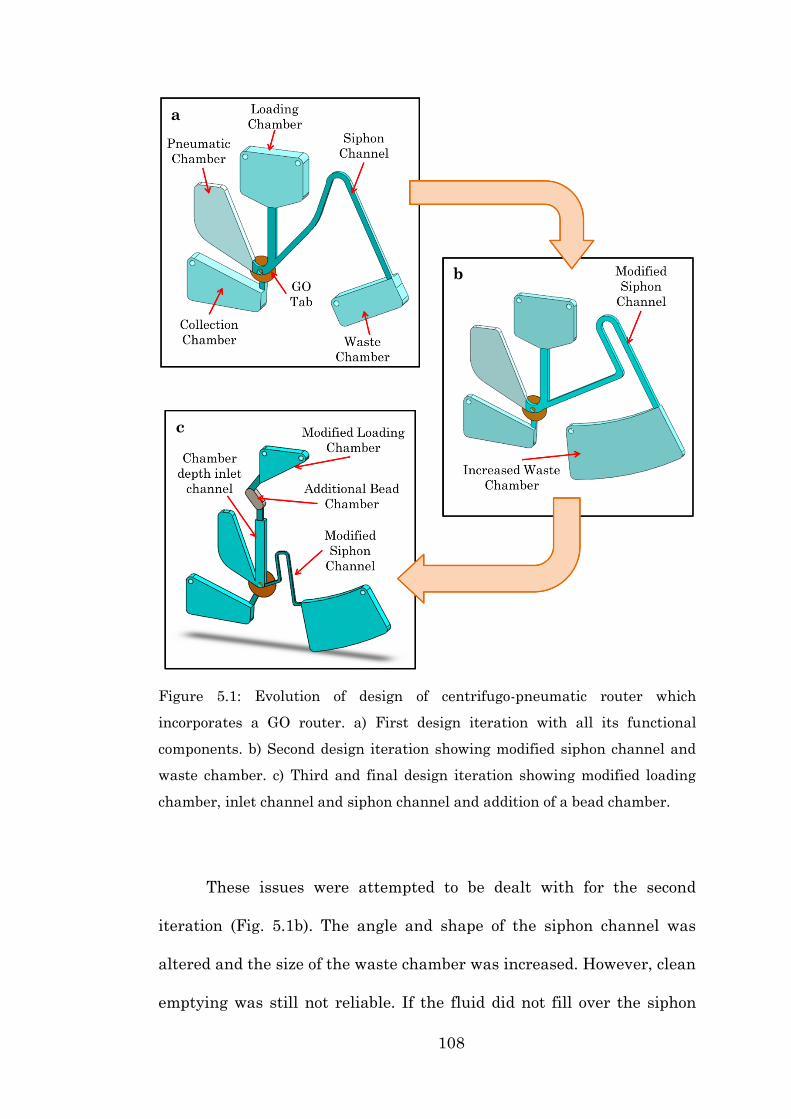
108
Figure 5.1: Evolution of design of centrifugo-pneumatic router which
incorporates a GO router. a) First design iteration with all its functional
components. b) Second design iteration showing modified siphon channel and
waste chamber. c) Third and final design iteration showing modified loading
chamber, inlet channel and siphon channel and addition of a bead chamber.
These issues were attempted to be dealt with for the second
iteration (Fig. 5.1b). The angle and shape of the siphon channel was
altered and the size of the waste chamber was increased. However, clean
emptying was still not reliable. If the fluid did not fill over the siphon
a
b
c
109
uniformly, a large air bubble would form between the siphon crest and
the entrance to the waste chamber. This occurred because of a filling
problem when working under a centrifugal field. As the fluid travelled
up the channel towards the crest of the siphon the bottom of the
meniscus is experiencing a greater centrifugal force than the top. It
therefore ‘drips’ over the edge first, making a pathway for the rest of the
fluid to follow (Fig. 5.2a). The fluid then collects at the base of the
channel as it encounters a capillary valve in the expansion of the
channel into the waste chamber. This meant that there could be some
residual fluid left at the base of the pneumatic chamber. This could lead
to contamination of the final sample (Fig. 5.2b).
Figure 5.2: Illustration and image of siphon issues. a) The channel (blue) is
connected to a chamber (green) which is significantly deeper. The fluid (red)
moves over the crest where the bottom of the meniscus travels first and makes
a pathway for the fluid to follow and a large air pocket is formed. b) Image of
fluid remaining at base of pneumatic chamber due to poor emptying of siphon.
a
b
110
The final working design is shown in Figure 5.1c. Here the most
drastic changes were introduced. Firstly, the inlet channel which leads
to the pneumatic chamber was made chamber deep, i.e. it was cut to the
same depth as the pneumatic chamber. This meant that once the fluid
flowed down into this channel there was sufficient space for it not to re-
enter the loading chamber. The through hole at the base of the
pneumatic chamber was also shifted to be in line with the inlet channel.
This meant that the maximum amount of fluid could be collect through
the GO membrane during the final step. Next, a bead chamber was
added. This was used to house the glass beads for the SPP. The beads
had previously been housed in the loading chamber, but this seemed to
restrict the flow. The loading chamber shape was modified to encourage
all the fluid out of the chamber and through the beads. Finally the
siphon was modified to correct the emptying problem. The inlet channel
into the siphon was shortened and its height was reduced. Also an ‘L’-
shaped bend was placed at the end of the channel at the entrance to the
waste chamber to stop the fluid from collecting at the end of the channel.
All of these changes lead to our final working design.
5.2.2 Working Principle
Figure 5.3 shows the flow schemes for sequential routing of
aqueous and organic solutions. Initially, an aqueous solution is loaded
(A). Under rotation, the fluid flows down the channel into the bead
111
chamber (B). The fluid then flows through the beads and down the inlet
channel. The angle and position of the siphon valve directs the fluid into
the pneumatic chamber where it traps and compresses the enclosed air
pocket (C). The disc is spun below the threshold burst frequency (75 Hz)
of the GO tab to maintain the seal of the tab. Upon reduction of the spin
rate, the air expands to centripetally pump the aqueous solution back up
into the inlet channel. The fluid is now at a level higher than the siphon
crest and it flows over the crest point into the waste chamber (D). In a
similar way, the organic solution is routed past the unaffected GO
membrane through the siphon to the waste (E – H). For the final step,
another aqueous solution is loaded. In this case the spin rate is elevated
to a spin frequency beyond the threshold burst frequency (75 Hz) of the
GO tab (I – K). Therefore, the solution penetrates through the solvent-
selective GO membrane into the collection chamber (L).

112
Figure 5.3: Working principle of the GO router. The individual components are
labelled in Figure 5.1. (a) At moderate spin rates, water (red) compresses the
air in the pneumatic side chamber (yellow). Upon deceleration, the entrapped
air expands to pump the fluid over the siphon. (b) The organic solutions IPA /
EtOH (blue) follow the same itinerary. (c) In the final step, a second volume of
DI water is loaded. Compared to the first fluid, the spin rate is elevated to
surpass the burst pressure of the GO tab for water. The fluid is directed into
the left collection chamber. Letters (A – L) refer to spin rates shown in Figure
5.5.
a b c
113
5.3 Materials and Methods
5.3.1 Disc Fabrication and Assembly
The disc (Ø 120 mm) consisted of three layers of PMMA and four
layers of PSA (Fig. 5.4). The PMMA layers were cut entirely with the
laser cutter as described in Section 2.1.2.1 and the PSA layers were cut
using the precision knife cutter. The cleaning procedure, as outlined in
Section 2.1.3, was observed. The GO tab was fabricated as described in
Section 4.2 and was fabricated to a thickness of approximately 45-µm for
the fluidic tests (Section 5.4.1) and 35-µm for the biological tests (Section
5.4.2). Prior to assembly (described in Section 2.1.4) the tab was adhered
to the underside of the ‘Tab Cover PSA’ layer, with the ‘Tab Supported
PSA’ layer, giving adequate space to house the tab.
Once assembly of the disc was complete glass beads (diameter ≤
106-µm) were packed into the ‘Bead Chamber’ (Fig. 5.1c), to its capacity,
through a hole in the top layer of the PMMA. The hole was then sealed.

114
Figure 5.4: Exploded view of disc assembly. The (Ø 120 mm) disc consisted of
three layers of PMMA (green) and four layers of PSA (grey). The GO tab was
adhered to the underside of the Tab Cover PSA layer.
5.3.2 DNA Preparation
The QiaQuick PCR purification kit (Section 2.2.2) and PicoGreen
DNA fluorescence kit (Section 2.4.2.3) were used for the course of these
experiments. The lambda DNA standard was taken from the
concentrated solution of 100 µg/ml and diluted in 1x TE Buffer to the
desired concentration. To test the DNA’s interaction with the GO
membrane the concentrated solution was diluted to a concentration of 2,
1.5, 1 and 0.5 µg/ml. For validation of the GO router the concentrated

115
solution was diluted to a concentration of 24 µg/ml. This solution was
then split. To measure the pure DNA concentration the 24 µg/ml
solution was mixed in a ratio of 1:5 1x TE buffer to bring it to a
concentration of 4 µg/ml. For use on the GO router the 24 µg/ml solution
was mixed in a ratio of 1:5 Buffer PB. The Qiagen buffers were used on
the GO router in order to ensure the correct pH and salt concentrations
needed for the DNA to bind to the beads.
For the benchtop spin column test, the standard Qiagen kit
protocol was used (Section 2.4.2.3). For the detection 30 µL of dye and
sample were used.
5.4 Results and Discussion
5.4.1 Fluidic Operation
Experimental validation was performed in order to determine the
optimum spin frequencies required for the operation of the GO router.
The final spin frequency profile is shown in Figure 5.5.

116
Figure 5.5: Spin frequency profile of GO router versus time for DNA
purification protocol. The labels (A – L) refer to the image sequence shown in
Figure 5.3. The disc is stopped for each of the solutions to be loaded. The
simultaneous purification of five samples can be achieved in less than 11 min.
After loading the 60 µL sample, the disc was initially spun up to
70 Hz to allow the fluid to be pumped into the pneumatic chamber.
Upon reduction of the spin frequency to 10 Hz, the expanding gas pocket
pushed the fluid to a level higher than the crest of the siphon. The fluid
therefore travelled over the siphon to waste. A final burst of speed (up to
15 Hz) was used to ensure the fluid had been fully removed from the
siphon channel. The organic washes (60 µL each) followed the same
path and spin frequency profile. It should be noted that the both of the
first two flows are performed at a frequency below the threshold burst
frequency of the GO tab. This is used as a secondary safety feature, as
the true barrier is the solvent selectivity of the GO tab. The first sample
117
is only 1/6th aqueous, mixed with an organic buffer, used to enhance
binding to the beads (Section 2.2.2). The second is an EtOH based buffer
solution. After the desired number of washing solutions were flowed
through the system, the final Elution Buffer (60 µL) was loaded. The
disc was spun to 75 Hz, which is above the burst frequency of the GO
tab. After approximately 3.5 min the fluid flowed through the GO tab
into the collection chamber. The entire process takes approximately 11
min but each disc contains five identical structures, so five samples can
be run simultaneously. A stroboscopic frame sequence of this routing is
shown in Figure 5.6. Colour dyes were used in this case for clarity.
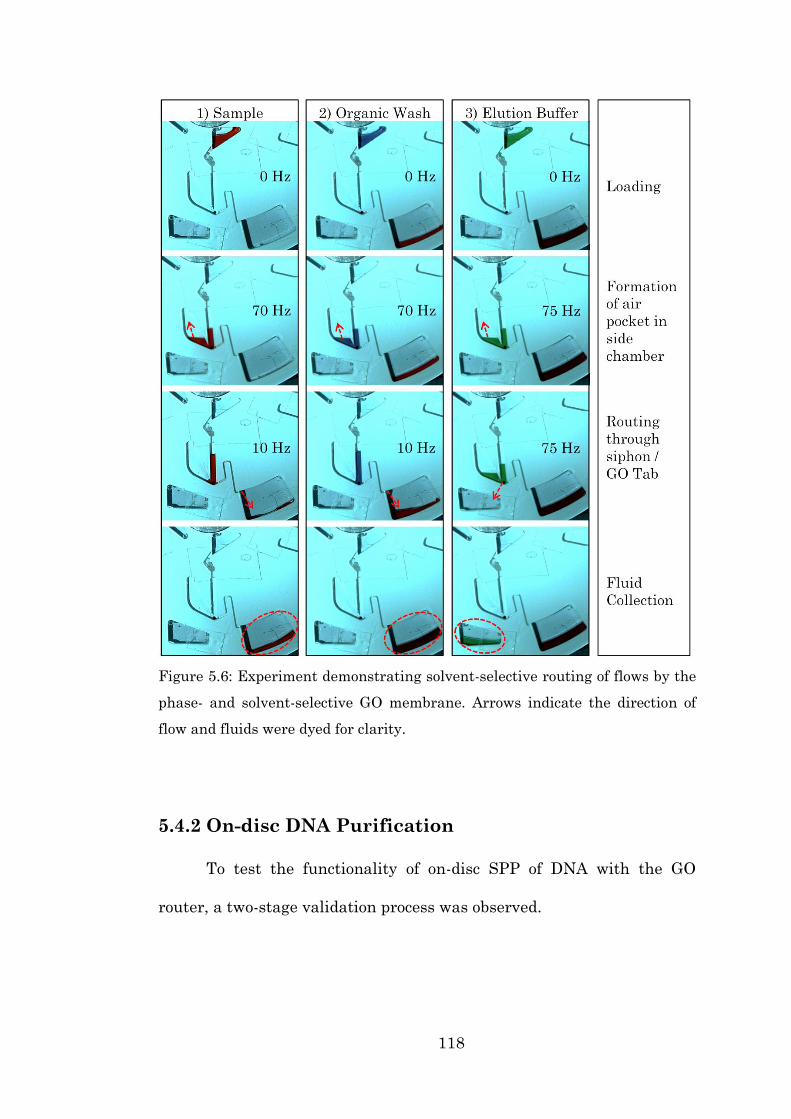
118
Figure 5.6: Experiment demonstrating solvent-selective routing of flows by the
phase- and solvent-selective GO membrane. Arrows indicate the direction of
flow and fluids were dyed for clarity.
5.4.2 On-disc DNA Purification
To test the functionality of on-disc SPP of DNA with the GO
router, a two-stage validation process was observed.

119
5.4.2.1 DNA Interaction with GO Membrane
The first step was to ensure that the GO membrane would not
interfere with the DNA. There was some concern that the DNA might
bind to the GO membrane or that the membrane may somehow damage
the DNA. To test if this was the case the flow through structure
described in Section 4.3.2 was used. A 10-µm thick tab was used and 60-
µL of various dilutions of the DNA concentrations were flowed through
the GO membrane. The quantity of DNA present before and after was
measured using the PicoGreen fluorescence kit on the TECAN plate
reader (Section 2.4.2.3). The results are shown in Figure 5.7.
As can be seen from the graph, there is no discernible negative
impact of the GO on the DNA sample at any of the four concentrations.
In fact at the highest concentration (1 µg/ml) the DNA signal after flow
through the GO membrane is stronger. The author acknowledges that
this may be an anomaly which may be due to loss during the dilution
process. For all other data points there is no discernible loss of DNA due
to the GO. Also tested was the impact of the PMMA disc on the signal
strength. This too proved to be negligible. It should also be noted that
the error at each point is very small and there is good linearity.
It was thereby concluded that the DNA would not bind to the GO
membrane and that the membrane would not damage the DNA in any
way that would impede detection using the PicoGreen kit.

120
Figure 5.7: Comparison of DNA interaction with GO membrane for a range of
DNA concentrations. The quantity of DNA present was measured using the
PicoGreen fluorescence assay. The fluorescence intensity readings are
arbitrary units assigned by the machine. The blue diamonds represent the
DNA sample before flow through the GO membrane, the red squares represent
the DNA sample after flow though the GO membrane and the green triangles
represent the DNA samples that were flowed through the disc with an open
hole (i.e. no GO). Data points are mean ± 1 standard deviation, n=4. The error
bars are present on the data points however the error on the lower values is too
small to be seen on the figure.
5.4.2.2 DNA Solid Phase Purification using GO Router
To test the viability of the GO Router design shown in Figure
5.1c, Qiagen spin column protocol was also implemented (Section 2.2.2)
both on the disc and on the bench. The DNA sample was mixed with five
parts Buffer PB solution, which had a pH of less than 7, in order to
ensure that the like-charge interactions of the silica beads could be
overcome. This gave a DNA concentration of 4-µg/ml in each 60-µL
121
sample. The samples and corresponding wash and elution procedures
(Section 5.4.1) were then implemented on the GO router disc. The first
flow through the beads was collected from the waste chamber to
determine how much of the DNA sample was not binding to the beads.
The final purified sample was also collected from the disc. The benchtop
Qiagen spin column procedure was also performed for comparison. The
PicoGreen fluorescence kit was used to determine the quantity of DNA
present after purification and the results were normalised as a
percentage of the total DNA inputted into the system. An aliquot of the
original DNA sample used was quantified using the PicoGreen kit and
the fluorescence signal generated was taken as 100% of the sample. All
other samples were matched against this and their output percentage
was calculated. The results are shown in Figure 5.8.
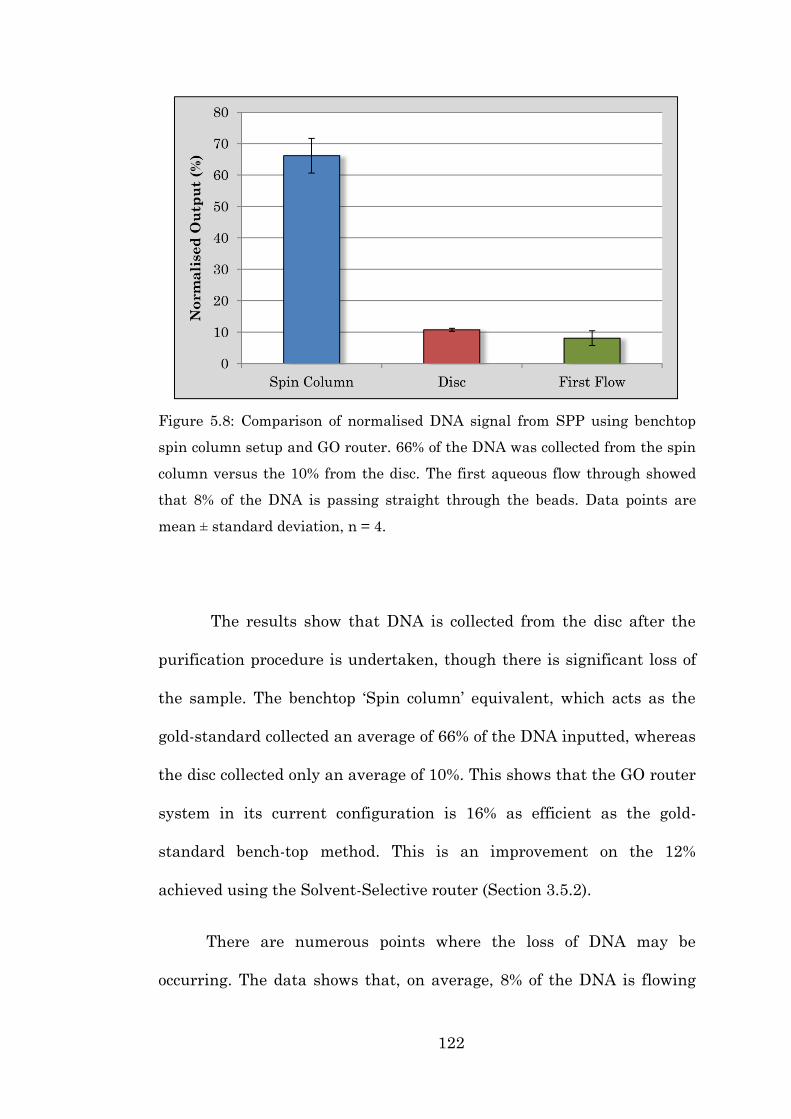
122
Figure 5.8: Comparison of normalised DNA signal from SPP using benchtop
spin column setup and GO router. 66% of the DNA was collected from the spin
column versus the 10% from the disc. The first aqueous flow through showed
that 8% of the DNA is passing straight through the beads. Data points are
mean ± standard deviation, n = 4.
The results show that DNA is collected from the disc after the
purification procedure is undertaken, though there is significant loss of
the sample. The benchtop ‘Spin column’ equivalent, which acts as the
gold-standard collected an average of 66% of the DNA inputted, whereas
the disc collected only an average of 10%. This shows that the GO router
system in its current configuration is 16% as efficient as the gold-
standard bench-top method. This is an improvement on the 12%
achieved using the Solvent-Selective router (Section 3.5.2).
There are numerous points where the loss of DNA may be
occurring. The data shows that, on average, 8% of the DNA is flowing
123
directly to the waste, i.e. not binding to the beads. This number may in-
fact be higher as the sample that is extracted from the waste chamber
after the first flow through must then be passed through the spin
column and eluted in the elution buffer. This is a necessary step as the
Buffer PB, which is initially mixed with the sample, inhibits the
fluorescence assay. Therefore, knowing that the efficiency of the spin
column is 66%, it can be assumed that approximately 12% of the DNA is
being lost during the first flow through the beads.
The author notes that further investigation and optimisation of
the solid-phase purification protocol should enhance the capture and
elution efficiency of the system. Adjustments to the pH and salt
concentrations may have an effect. A pH ≤ 7.5 is considered optimum for
DNA binding to silica beads, whereas a pH of 7.0 - 8.5 is required for
elution. Also increasing the time which the sample is in contact with the
beads may be useful. The large discrepancy with the gold-standard
benchtop method may be related to the difference in using a tightly
packed monolith (spin column) and the bead chamber (disc). There may
also be some loss due to binding of the DNA to the walls of the plastic
disc. Locally washing with a blocking solution, such as Bovine Serum
Albumin (BSA), may help reduce the loss (90).
The benefit of the GO router though is not in its capture efficiency
but in the movement towards an automated system. The router is a
significant improvement on the highly labour-intensive benchtop
124
equivalent and uses significantly reduced sample volumes. Its ease of
manufacturing and simple to use system offers significant benefits for
point-of-care uses.
5.5 Conclusions
I have demonstrated for the first time a centrifugo-pneumatic
routing of flows based on a centrifugal microfluidic platform which
integrated a GO membrane. This membrane is impenetrable to organic
solution, but yields at moderate spin rates to an aqueous fluid. This
unique solvent-selectiveness of the GO membrane opens new avenues
for robust automation of common nucleic acid purification protocols (e.g.
“spin columns”) on centrifugal LoaD platforms. The purification of DNA
versus the gold-standard benchtop method was demonstrated. Future
work should include the optimisation of the router for use with the silica
beads in-order to enhance the capture and collection of all nucleic acids.

125
Chapter 6
Event-triggered Graphene
Oxide Router for
Automated Nucleic Acid
Purification
6.1 General Introduction
The previous chapter described the design and testing of a
centrifugo-pneumatic router which used the unique properties of GO for
advanced flow control and to perform on-board DNA purification. In this
chapter, I show the next stage of this work which is the development of a
fully automated system incorporating the GO router which utilises an
event-triggered flow control element and incorporates multiple

126
functional materials to enhance the flow control capabilities of this
system.
6.1.1 Event-triggered Valving Mechanisms
Event-triggered valving systems were first developed by Kinahan
et al. in 2014 as a means by which to overcome the limitations within
other valving mechanisms for serialised large-scale integration of
microfluidic flow control (27).
The system was developed to allow the release of reagents from a
chamber to be triggered by the dissolution of a film in a previous
chamber. Figure 6.1 shows the working principle. The main liquid is
held in place by an air-locked pressurised channel, sealed by the control
film in the bottom chamber. When the ancillary fluid enters the bottom
chamber, it dissolves the control film inside. This opens the air-locked
pressurised channel to atmosphere. The now vented channel allows the
flow of the main fluid onto the load film. The load film is dissolved and
the fluid can continue on to trigger the flow of the next solution. Unlike
other rotationally actuated valves this event-triggered system is largely
independent of the spin rate of the disc and is reliant only on the
passage of fluid and the dissolution of the films.
The work described in this chapter integrates this elegant system
with the previously described router to develop an automated Event-
trigger Graphene Oxide Router (EGOR) and uses it to purify DNA.

127
Figure 6.1: Working principle of event-triggered logical flow control system.
Ancillary fluid dissolves the control film and vents the pressurised air channel.
The main fluid can then travel down the channel to the load film, where it
dissolves the film and continues on. Adapted from Kinahan et al. 2014 (27).
6.2 System Design
6.2.1 Evolution from first design
Figure 6.2 shows the evolution of the design of the Event-
triggered GO Router (EGOR) which incorporates three different
membrane tab types for the automated solvent selective routing of flows.
The design builds on the work described in Chapter 5. Once again there
were a number of iterations but the two main stages are shown here.

128
Figure 6.2: Evolution and component parts of design of event-triggered GO
router. a) First design iteration with all its functional components. b)
Enhanced illustration of the three different loading chambers: the Sample
Loading Chamber (LS), the Organic Loading Chamber (LO) and the Elution
Loading Chamber (LE). Also shown is the placement of the two dissolvable film
tabs: the Organic Dissolvable Film (ODF) and the Aqueous Dissolvable Film
(ADF). c) Enhanced illustration of the waste chamber, showing the position of
another ADF and ODF tab, also the airtight channels connecting to the loading
chambers. d) Second design iteration showing modified parts. e) Enhanced
illustration of modified bead’s and GO tab’s positions.
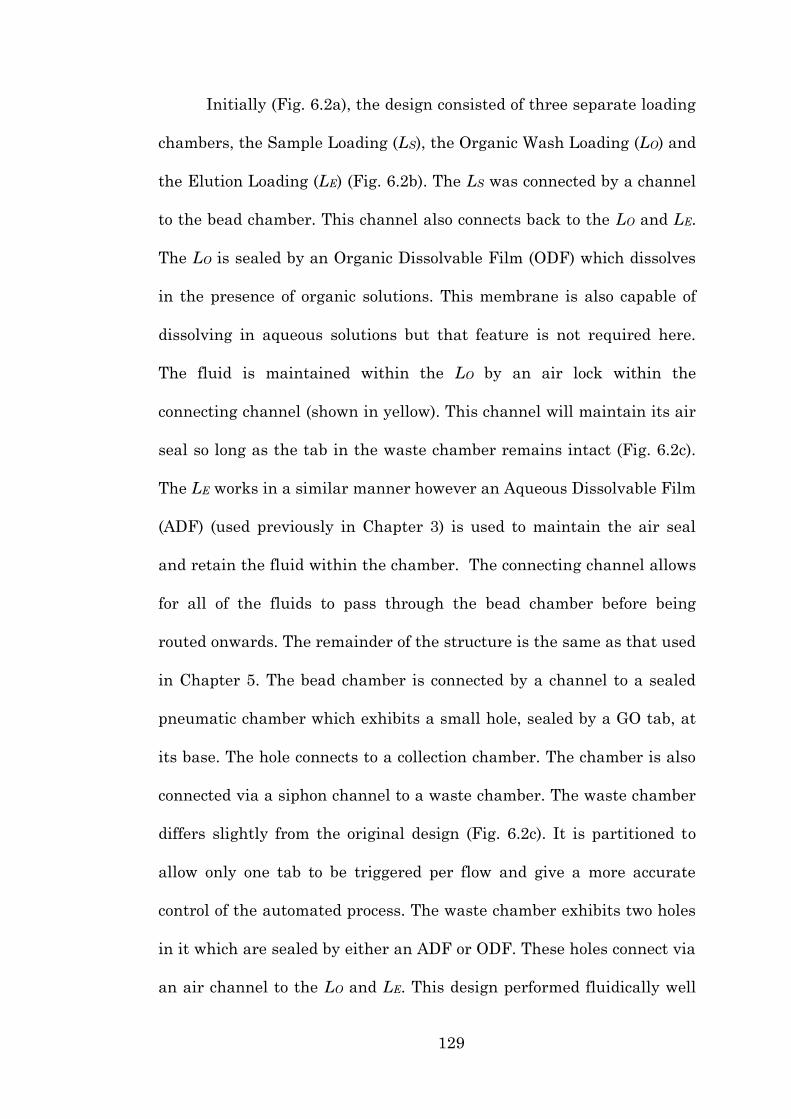
129
Initially (Fig. 6.2a), the design consisted of three separate loading
chambers, the Sample Loading (LS), the Organic Wash Loading (LO) and
the Elution Loading (LE) (Fig. 6.2b). The LS was connected by a channel
to the bead chamber. This channel also connects back to the LO and LE.
The LO is sealed by an Organic Dissolvable Film (ODF) which dissolves
in the presence of organic solutions. This membrane is also capable of
dissolving in aqueous solutions but that feature is not required here.
The fluid is maintained within the LO by an air lock within the
connecting channel (shown in yellow). This channel will maintain its air
seal so long as the tab in the waste chamber remains intact (Fig. 6.2c).
The LE works in a similar manner however an Aqueous Dissolvable Film
(ADF) (used previously in Chapter 3) is used to maintain the air seal
and retain the fluid within the chamber. The connecting channel allows
for all of the fluids to pass through the bead chamber before being
routed onwards. The remainder of the structure is the same as that used
in Chapter 5. The bead chamber is connected by a channel to a sealed
pneumatic chamber which exhibits a small hole, sealed by a GO tab, at
its base. The hole connects to a collection chamber. The chamber is also
connected via a siphon channel to a waste chamber. The waste chamber
differs slightly from the original design (Fig. 6.2c). It is partitioned to
allow only one tab to be triggered per flow and give a more accurate
control of the automated process. The waste chamber exhibits two holes
in it which are sealed by either an ADF or ODF. These holes connect via
an air channel to the LO and LE. This design performed fluidically well
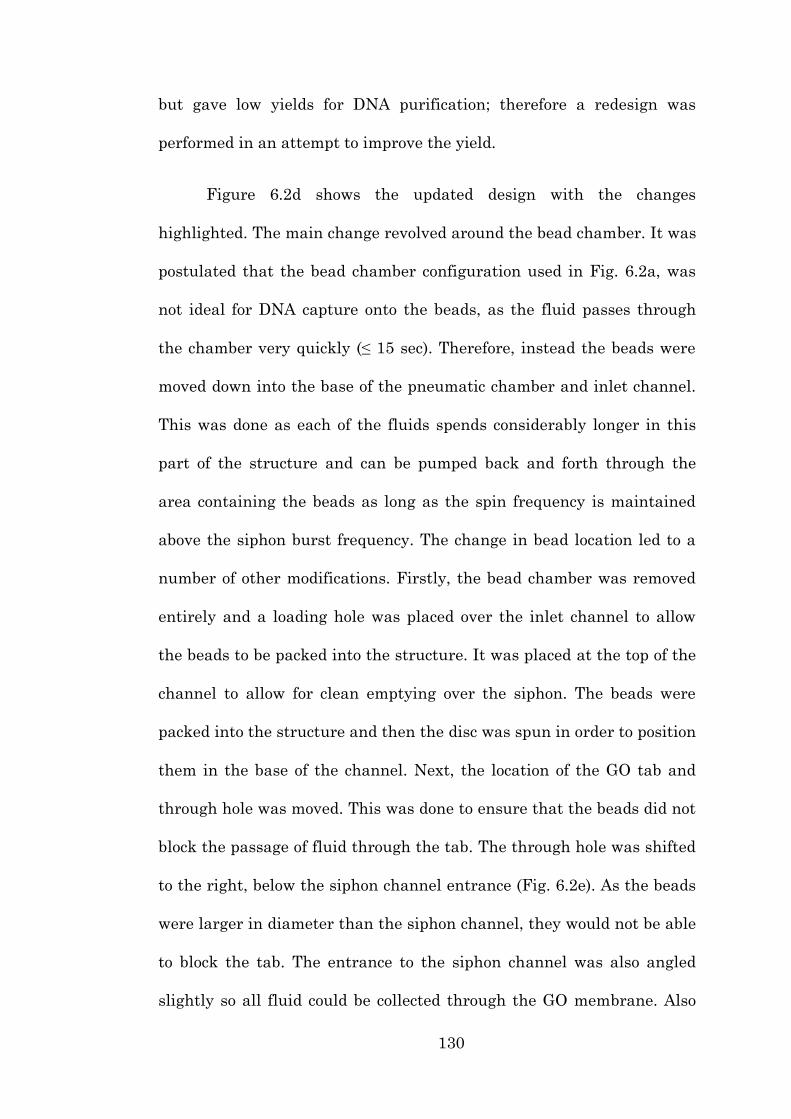
130
but gave low yields for DNA purification; therefore a redesign was
performed in an attempt to improve the yield.
Figure 6.2d shows the updated design with the changes
highlighted. The main change revolved around the bead chamber. It was
postulated that the bead chamber configuration used in Fig. 6.2a, was
not ideal for DNA capture onto the beads, as the fluid passes through
the chamber very quickly (≤ 15 sec). Therefore, instead the beads were
moved down into the base of the pneumatic chamber and inlet channel.
This was done as each of the fluids spends considerably longer in this
part of the structure and can be pumped back and forth through the
area containing the beads as long as the spin frequency is maintained
above the siphon burst frequency. The change in bead location led to a
number of other modifications. Firstly, the bead chamber was removed
entirely and a loading hole was placed over the inlet channel to allow
the beads to be packed into the structure. It was placed at the top of the
channel to allow for clean emptying over the siphon. The beads were
packed into the structure and then the disc was spun in order to position
them in the base of the channel. Next, the location of the GO tab and
through hole was moved. This was done to ensure that the beads did not
block the passage of fluid through the tab. The through hole was shifted
to the right, below the siphon channel entrance (Fig. 6.2e). As the beads
were larger in diameter than the siphon channel, they would not be able
to block the tab. The entrance to the siphon channel was also angled
slightly so all fluid could be collected through the GO membrane. Also
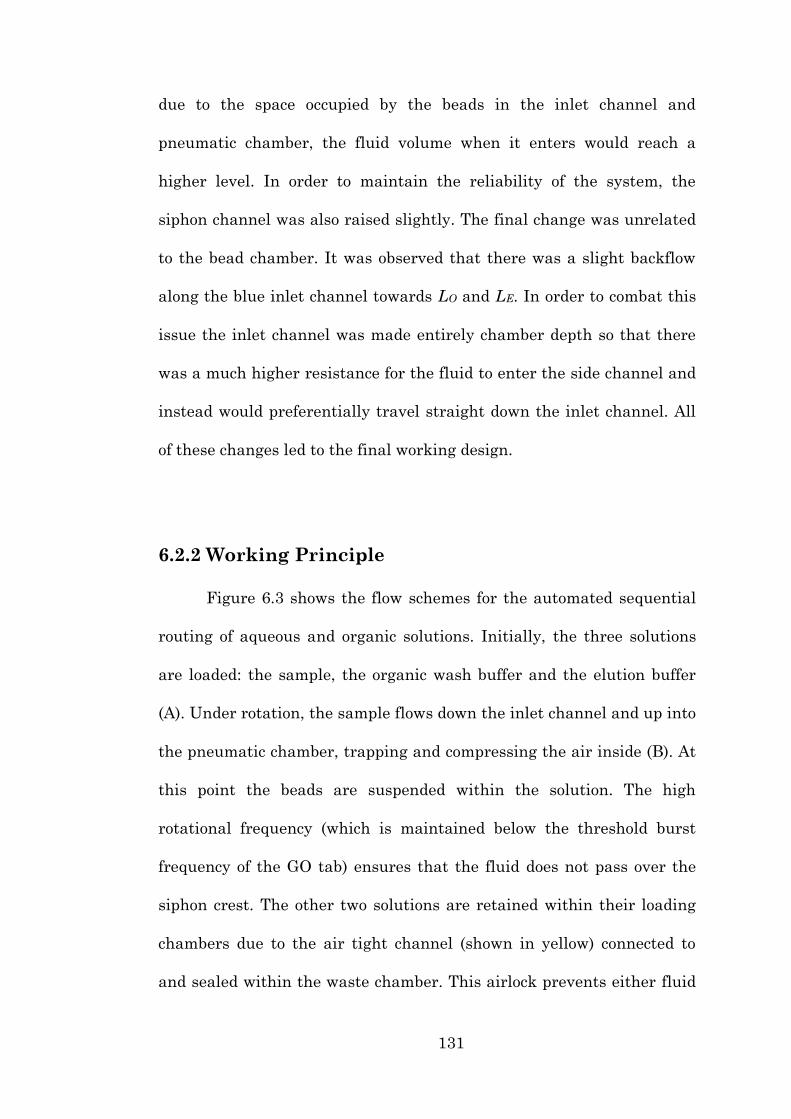
131
due to the space occupied by the beads in the inlet channel and
pneumatic chamber, the fluid volume when it enters would reach a
higher level. In order to maintain the reliability of the system, the
siphon channel was also raised slightly. The final change was unrelated
to the bead chamber. It was observed that there was a slight backflow
along the blue inlet channel towards LO and LE. In order to combat this
issue the inlet channel was made entirely chamber depth so that there
was a much higher resistance for the fluid to enter the side channel and
instead would preferentially travel straight down the inlet channel. All
of these changes led to the final working design.
6.2.2 Working Principle
Figure 6.3 shows the flow schemes for the automated sequential
routing of aqueous and organic solutions. Initially, the three solutions
are loaded: the sample, the organic wash buffer and the elution buffer
(A). Under rotation, the sample flows down the inlet channel and up into
the pneumatic chamber, trapping and compressing the air inside (B). At
this point the beads are suspended within the solution. The high
rotational frequency (which is maintained below the threshold burst
frequency of the GO tab) ensures that the fluid does not pass over the
siphon crest. The other two solutions are retained within their loading
chambers due to the air tight channel (shown in yellow) connected to
and sealed within the waste chamber. This airlock prevents either fluid

132
from coming in connect with the DF tabs at their base (Fig. 6.2b, c).
Upon reduction of the spin rate, the air within the pneumatic chamber
expands, pushing the fluid back up to a level higher than the siphon
crest. The fluid therefore travels over the siphon to the waste, where it
is collected within the first section of the waste chamber (C).

133
Figure 6.3: Working principle of the EGOR. a) At a high frequency the sample
(red) compresses the air within the pneumatic chamber (yellow). Upon
deceleration the entrapped air expands to pump the fluid over the siphon to
waste. The other two solutions are retained within their loading chambers. b)
The dissolution of the first film in the waste chamber triggers the flow of the
organic wash buffer. It follows the same pathway as the sample and is routed
to the waste chamber. c) In the final stage, the dissolution of the second film in
the waste chamber triggers the flow of the elution buffer. The disc is spun at a
higher frequency to overcome the threshold burst frequency of the GO tab. The
elution buffer is directed to the left collection chamber. The labels (A – I) refer
to the spin rates indicated in Figure 6.5.
a b c

134
Once the fluid has been collected within the waste chamber, it is
now at a level where it is in contact with the ADF tab. It dissolves the
tab, thereby opening the air tight channel to atmosphere and reducing
the airlock imposed upon the organic wash buffer. The buffer is
therefore free to push into the overflow chamber, down along the
channel, where it comes in contact with the ODF at its base (D). Once
again the third solution, the elution buffer, is unaffected as its
connecting channel is still air-locked. Once the organic wash buffer
dissolves the ODF at its base, it travels down the channel, into the inlet
channel, and once again under high rotational frequency, is pumped up
into the pneumatic chamber, compressing the air inside (E). Upon
reduction of the spin rate, the fluid is routed to the waste chamber,
where is mixes with the already present solution and flows over into the
second section of the waste chamber (F).
Once the entire organic wash buffer has been collected with the
waste chamber, it brings the fluid to a level where it is in contact with
the ODF. It dissolves the film, thereby releasing the air trap on the
elution buffer. The buffer flows from the chamber and encounters the
ADF at its base (G). The spin rate is now increased, beyond the
threshold burst frequency of the GO tab. The elution buffer travels down
the inlet channel and after a short time passes through the GO tab and
is collected into the collection chamber (H, I).

135
6.3 Materials and Methods
6.3.1 Disc Fabrication and Assembly
The disc (Ø 120 mm) consisted of four layers of PMMA and four
layers of PSA (Fig. 6.4). The PMMA layers were cut entirely with the
laser cutter as described in Section 2.1.2.1 and the PSA layers were cut
using the precision knife cutter. The cleaning procedure, as outlined in
Section 2.1.3, was observed. The GO tab was fabricated as described in
Section 4.2 and was fabricated to a thickness of approximately 45-µm for
the fluidic tests and 35-µm for the biological tests. The ADF and ODF
tabs (both long tabs placed into the waste chamber and circular tabs
placed below the loading chambers) were adhered to PSA with through
holes cut out. Prior to assembly (described in Section 2.1.4) all the tabs
were adhered to the top side of the ‘Tab Cover PMMA’ layer, with the
‘Tab Support PSA’ layer, giving adequate space to house the tabs.
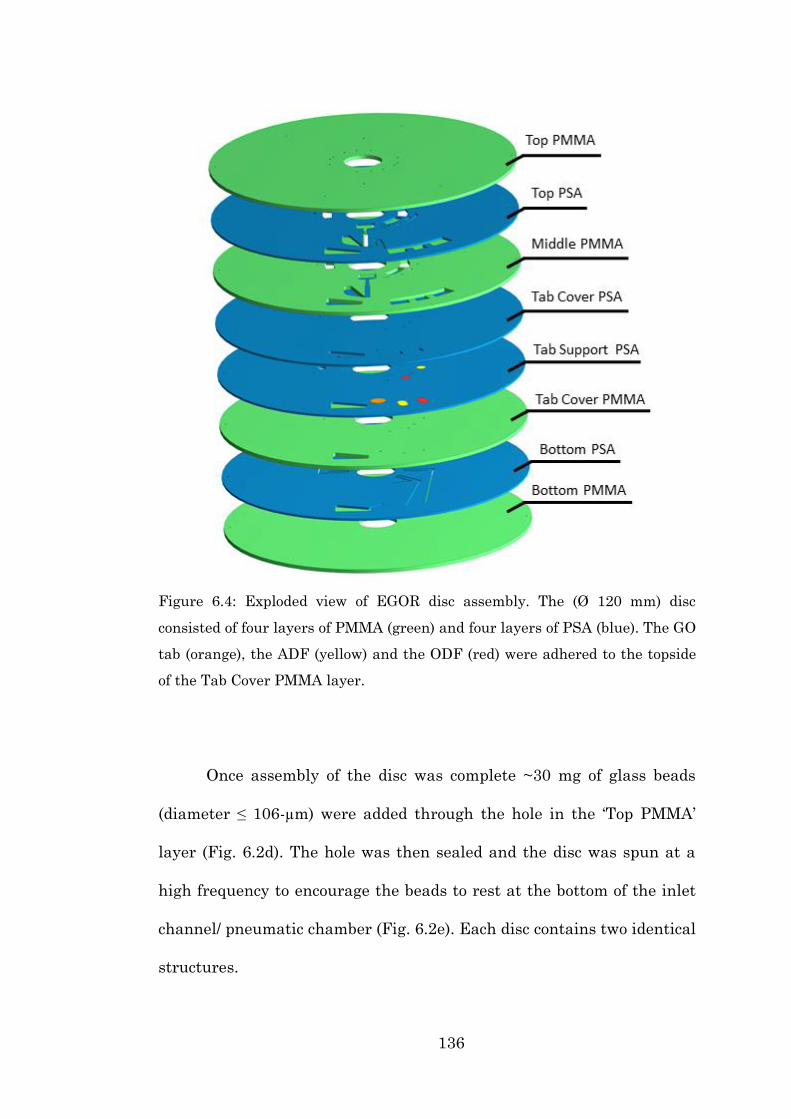
136
Figure 6.4: Exploded view of EGOR disc assembly. The (Ø 120 mm) disc
consisted of four layers of PMMA (green) and four layers of PSA (blue). The GO
tab (orange), the ADF (yellow) and the ODF (red) were adhered to the topside
of the Tab Cover PMMA layer.
Once assembly of the disc was complete ~30 mg of glass beads
(diameter ≤ 106-µm) were added through the hole in the ‘Top PMMA’
layer (Fig. 6.2d). The hole was then sealed and the disc was spun at a
high frequency to encourage the beads to rest at the bottom of the inlet
channel/ pneumatic chamber (Fig. 6.2e). Each disc contains two identical
structures.
137
6.3.2 DNA Preparation
The QiaQuick PCR purification kit (Section 2.2.2) and PicoGreen
DNA fluorescence kit (Section 2.4.2.3) were used for the course of these
experiments. The lambda DNA standard was taken from the
concentrated solution of 100 µg/ml and diluted in 1x TE Buffer to a
concentration of 12 µg/ml. This solution was then split in three. To
measure the pure DNA concentration the 12 µg/ml solution was mixed
in a ratio of 1:5 with 1x TE buffer to bring it to a concentration of 2
µg/ml. For use on-disc the 12 µg/ml solution was mixed in a ratio of 1:5
with the PB Buffer. The Qiagen buffers were used on the EGOR in order
to ensure the correct pH and salt concentrations needed for the DNA to
bind to the beads. For the benchtop spin column test, the standard
Qiagen kit protocol was used (Section 2.2.2). For the detection 20 µL of
dye and sample was used.
6.4 Experimental Results
6.4.1 Fluidic Operation
Experimental validation was performed in order to determine the
optimum spin frequencies and solution volumes required for the
operation of the EGOR. The final spin frequency profile is shown in
Figure 6.5.
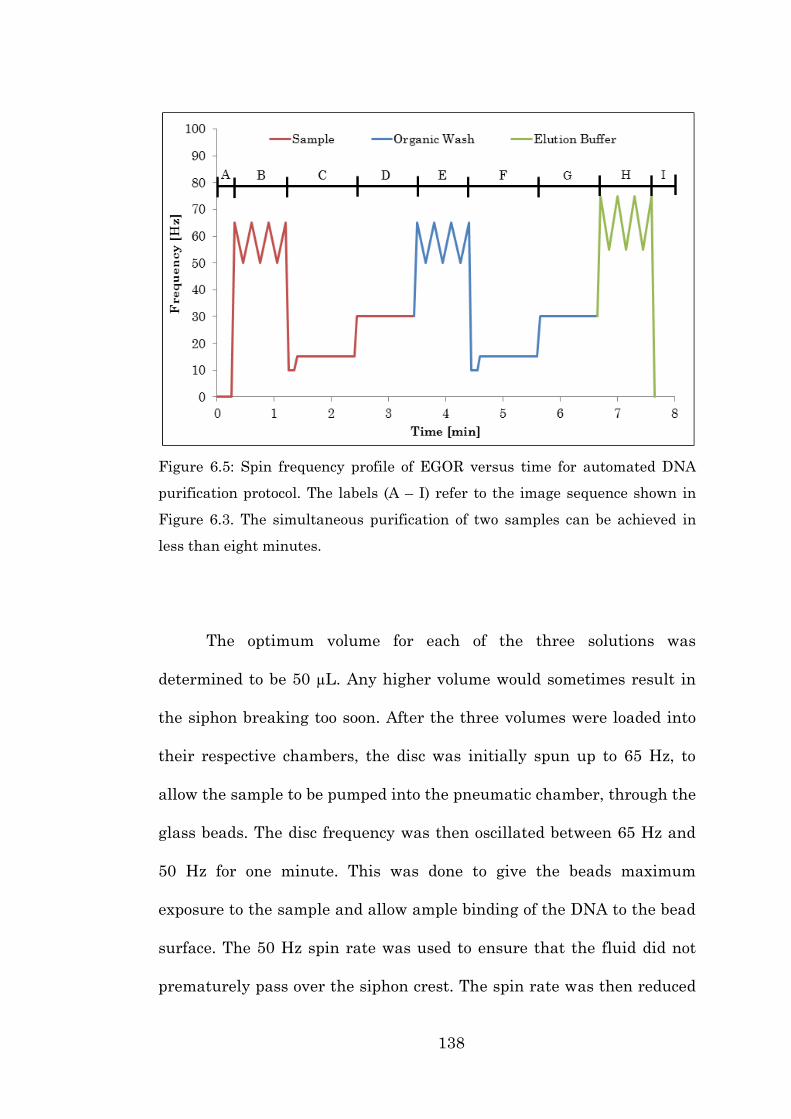
138
Figure 6.5: Spin frequency profile of EGOR versus time for automated DNA
purification protocol. The labels (A – I) refer to the image sequence shown in
Figure 6.3. The simultaneous purification of two samples can be achieved in
less than eight minutes.
The optimum volume for each of the three solutions was
determined to be 50 µL. Any higher volume would sometimes result in
the siphon breaking too soon. After the three volumes were loaded into
their respective chambers, the disc was initially spun up to 65 Hz, to
allow the sample to be pumped into the pneumatic chamber, through the
glass beads. The disc frequency was then oscillated between 65 Hz and
50 Hz for one minute. This was done to give the beads maximum
exposure to the sample and allow ample binding of the DNA to the bead
surface. The 50 Hz spin rate was used to ensure that the fluid did not
prematurely pass over the siphon crest. The spin rate was then reduced
139
to 10 Hz, this caused the gas pocket in the pneumatic chamber to
expand and push the fluid to a level higher than the siphon crest. The
sample therefore travelled over the siphon to the waste chamber. The
speed was then increased to 15 Hz to ensure all the fluid had been
removed from the siphon channel. Once the fluid was fully retained in
the waste chamber, it came in contact with the ADF tab. At this point
the disc was given a small burst in speed, up to 30 Hz to encourage
dissolution of the film and open the air-locked back channel. This
allowed the second fluid, the organic wash buffer, to leave its loading
chamber and come in contact with ODF tab at its base. It took
approximately one minute at this frequency for the tab to burst. At any
point during this time, the disc was spun back up to 65 Hz and the
organic wash followed the same path and spin frequency as the sample.
It should be noted that both of the first two flows are performed at a
spin frequency below the threshold burst frequency (75 Hz) of the GO
tab. Once the second tab in the waste chamber, the ODF tab, was
dissolved, and the final elution buffer had come in contacted with and
dissolved the ADF tab at its base, the spin frequency was increased to
75 Hz. This is above the threshold burst frequency of the GO tab. It took
approximately one minute at this frequency for the fluid to flow through
the tab. During this time the frequency was oscillated back and forth
between 75 Hz and 55 Hz, to give the beads as much exposure to the
elution buffer as possible. The 55 Hz minimum was used as an extra
safety measure to ensure that the fluid would not pass over the pre-

140
wetted siphon. The final eluted solution was then retained within the
collection chamber. The entire process takes approximately 8 minutes,
which is an improvement on the non-automated version of the structure.
This is due to the fact that the disc does not need to be stopped to load
the subsequent solutions. A stroboscopic frame sequence of this routing
process is shown in Figure 6.6. Coloured dyes were used for the sake of
clarity.
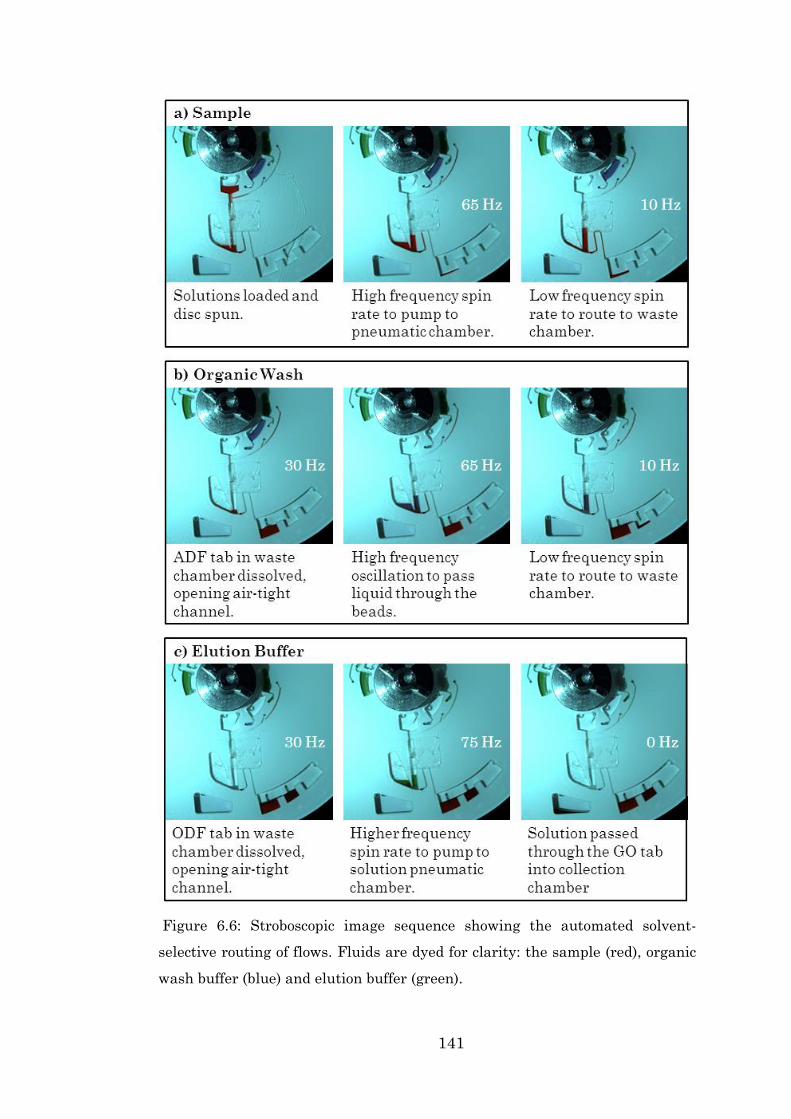
141
Figure 6.6: Stroboscopic image sequence showing the automated solvent-
selective routing of flows. Fluids are dyed for clarity: the sample (red), organic
wash buffer (blue) and elution buffer (green).
142
6.4.2 On-disc Automated DNA Purification
To test the viability of the EGOR system, shown in Figure 6.2d,
for automated SPP, the Qiagen spin column protocol (Section 2.2.2) was
implemented on-disc and on the bench. The DNA/PB Buffer solution was
prepared on bench and the 50 µL solution was loaded unto the disc,
along with 50 µL PE Buffer and 50 µL EB Buffer. The automated
routing process was observed and a final purified sample was collected
from the disc. The benchtop Qiagen spin column procedure was also
performed for comparison. The PicoGreen fluorescence kit was used to
determine the quantity of DNA present after purification and the results
were normalised as a percentage of the total DNA inputted into the
system. The results are shown in Figure 6.7.
The results show that there is DNA recovered from the disc after
the purification process has taken place though there is still significant
loss of sample. The benchtop ‘Spin column’ equivalent, which acts as the
gold-standard collected an average of 33% of the DNA inputted, whereas
the disc collected only an average of 3%. The lower yield from the spin
column in this experiment may have been due to a loss during the
dilution phase of the experiment (Section 6.3.2). This shows that the
EGOR system in its current configuration is 10% as efficient as the gold-
standard bench-top method.

143
Figure 6.7: Comparison of normalised DNA signal from SPP using benchtop
spin column setup and EGOR. 33% of the DNA was collected from the spin
column versus the 3% from the disc. Data points are mean ± 1 standard
deviation, n=4 for the spin column and n=3 for the disc.
6.5 Discussion
The 10% efficiency of the EGOR systems is less than the 16%
shown in Chapter 5. There are a number of possible reasons for this low
yield. The biggest variation from the former non-automated design is the
position of the beads within the disc. The earlier version had a bead
chamber, which was packed to capacity. In the current EGOR version
the beads are placed at the base of the pneumatic chamber/inlet channel
(Fig. 6.2e). The process of loading the beads within the disc involves
placing a pipette tip into the loading hole to act as a funnel. The beads
are then poured into the tip. The beads however are highly static and
can stick to the tip surface; therefore one tip was only ever used once.
144
With the earlier design, due to the dimensions of bead chamber, the
beads had no option but to remain within the bead chamber. However,
with the EGOR design the beads are placed into a much more open
space and, due to their static nature, some would be prone to moving to
other parts of the disc that all the fluid would not be exposed to, such as
the sample loading chamber or the top of the pneumatic chamber. If this
happens then some of the DNA may bind to beads that do not encounter
the elution buffer and so cannot be re-suspended.
Another issue may be with the Pressure Sensitive Adhesive
(PSA). The base of the loading chambers, inlet channel and pneumatic
chamber (Fig. 6.2d) are all comprised of the exposed sticky PSA. This
may be part of the reason the beads are not packing to the base of the
chamber but the DNA may also be adhering to the sticky surface.
Finally, the last change in protocol from the earlier to non-
automated version to the EGOR system was that only one organic wash
was performed in the latter, versus two in the former. If some of the
salts are not being removed from the beads, this may be interfering with
the fluorescence assay and reducing the signal strength.
However, there are some positive points to note. Firstly, the error
bars indicated in Figure 6.6 are very small, showing that though the
system is outputting a small yield, it is doing so consistently, in fact
more consistently than the benchtop method. This could therefore be
considered a systematic error and it may be possible to use this to
145
correlate how much DNA was in fact added to the system. If the output
fluorescence signal is known to be approximately 3% of the actual DNA
present then the true DNA quantity could be calculated.
Next, with the DNA concentration chosen (2 µg/ml) and the 50 µL
volume inputted for each iteration, this gives an inputted quantity of
100 ng of DNA per sample. If during the detection process, each well of
the 96-well plate receives 30 µL of solution, this equates to 60 ng per
well. If the disc gives a signal that is 3% that of the pure DNA sample
then this would equate to 2.05 ng on average per well. However, an
average of 35 µL is extracted from the collection chamber so if 100 ng of
DNA is inputted into the disc, 2.39 ng of DNA is extracted. This
quantity is more than sufficient for such detection techniques as PCR.
The New England BioLabs recommends 1 pg – 1ng of DNA for plasmid
or viral DNA, which the lambda DNA standard used in this experiment
is, when performing Taq DNA Polymerase (91).
Furthermore, this process is entirely automated. All of the
solutions are pre-loaded at the beginning of testing. In fact, due to the
air-tight under-channel sealed by the ADF and ODF tabs in the waste
chamber (Fig. 6.2c), the organic wash buffer and elution buffer could be
pre-loaded at a much early time and sealed within the chamber. This
pre-storage of reagents is extremely useful for use in Point-of-Care
systems. Also, as the disc works reliably within the spin frequency
profile outlined, an automated spin profile could be implemented which
146
would minimise the user input required and therefore the training
needed for its operation. The EGOR is therefore a significant
improvement over the highly labour-intensive benchtop equivalent.
6.6 Conclusion
In this chapter I have demonstrated an event-triggered
centrifugo-pneumatic routing system which utilises three different
functional materials: graphene oxide, an organic dissolvable film and an
aqueous dissolvable film. The functionality of this system was
demonstrated as was its ability to purify DNA with low yield but highly
repeatable output.

147
Chapter 7
Nucleic Acid Extraction
Systems
7.1 General Introduction
In the previous results chapters 3, 4, 5 and 6 the work focused on
the development of sample preparation systems for the downstream
purification of nucleic acids. The work in this chapter looks at upstream
concepts of the nucleic acid testing process, NA extraction. Two distinct
extraction methods will be discussed: chemical extraction of RNA and
mechanical extraction of NAs.
7.2 Fluid-fluid Extraction of Total RNA
As discussed in Section 1.5.2.1, chemical cell lysis is a highly
useful method of NA extraction, and has been a method of choice for

148
some time. This section details the development and optimisation of a
centrifugo-pneumatic microhomogenizer, which is based on the work of
Linares et al. (53). They overcame the limitation of microRNA
extraction, by using the µHomogenizer, which used a pneumatically
assisted pumping design to create turbulent conditions for the efficient
lysis and chemical extraction of RNA from whole blood.
The idea is simple; by mixing blood with TRI Reagent an aqueous
phase containing the RNA can be extracted from whole blood (Fig. 7.1).
TRI Reagent is a patented solution used for the extraction and isolation
of total RNA (92). It can also be used to isolate DNA and proteins. The
solution contains phenol and guanidine thiocyanate which allows for the
separation of the aqueous phase and the denaturing of proteins (93).
The aqueous phase can then be removed for further downstream
processing using the devices shown in the previous chapters.
Figure 7.1: Separation of RNA from whole blood procedure.
149
7.2.1 Evolution of System Design
Figure 7.2 shows the evolution of the design of the µHomogenizer
to its currently working model. There were multiple iterations, but the
three main steps are shown here.
Initially, the design by Linares et al. consisted of a central mixing
chamber connected to two air-tight pneumatic side arms. There is a
loading hole at the top of the mixing chamber and a small turbulence
area at the base of the chamber. This nozzle-like area is smaller than
the rest of the design and was optimised to enhance mixing through the
introduction of turbulence (Fig.7.2a). This design worked well but
retrieval of the sample after use was difficult. It was therefore necessary
to design a method of extracting the aqueous phase but leaving the
remainder of the fluid within the side arms.

150
Figure 7.2: Evolution of design of µHomogenizer from original design. a) First
iteration designed by Linares et al. with all its functional components. b)
Second design iteration showing the introduction of a loading chamber, siphon
channel and collection chamber. c) Third and final design iteration showing the
introduction of a second loading chamber and waste chamber.
These issues were attempted to be addressed in the second
iteration (Fig. 7.1b). Some significant changes were introduced. Firstly,
a designated loading chamber was added, along with an inlet channel
linking it to the mixing chamber. The central structure remained the
same, apart from the removal of the inlet hole. Secondly, a siphon
channel was added which connected with the base of the turbulence
area. Finally, a collection chamber was added, connecting to the siphon

151
channel. Once again this system had a number of issues. The loading
chamber was only large enough to load one solution at a time (TRI-
Reagent or sample) and so the disc had to be stopped to load the second
solution. The low pass siphon valve allowed the mixing to occur at high
speeds but premature priming of the siphon was a problem. This seemed
to occur when the disc was stopped for the second loading. This meant
that some of the solution would break the crest and enter the collection
chamber before full mixing could occur. It was also a problem during the
initial loading phase. The fluid would go straight into the siphon
channel and not be correctly mixed. During emptying this would go
straight to the collection chamber and could contaminate the final
extracted sample (Fig. 7.3).
Figure 7.3: Contamination of extracted aqueous phase in collection chamber.
Some TRI-reagent prematurely burst the siphon and entered the chamber
when the disc was stopped. Some blood and reagent sat in the siphon during
mixing and was not correctly separated.
152
The final design change attempted to address these issues (Fig.
7.2c). As the main problem with premature priming seemed to occur
when the disc was stopped to load the second solution, two separate
loading chambers were included to overcome this issue. To address the
problem of the solutions sitting in the siphon channel, a waste chamber
was added. The volume of this waste chamber was calculated to hold the
fluid from the siphon channel, before the crest back to the turbulence
area. This equated to approximately 10 µL. For the two channels leading
onto the waste: one acted as inlet, while the other as the air vent. The
size of the collection chamber was altered also and a collection vent was
added to the base of the chamber to allow easier removal of the aqueous
phase, for further processing. All of these changes lead to the final
working design.
7.2.2 Working Principle
Figure 5.4 shows the flow schemes for the µHomogenizer.
Initially, 25 µL of blood/sample is loaded into the small loading chamber
and 80 µL of TRI Reagent is added to the large loading chamber, along
with 5 µL of 4-Bromoindole (BAN). The BAN acts as a separating agent
to help enhance the separation of the aqueous phase (A). Next the disc is
spun to a high frequency to push all the fluid from the loading chambers
to the mixing chamber and up into the pneumatic arms, trapping and
compressing the air inside (B). The disc spin frequency is then reduced
153
and the air within the pneumatic chamber pushes back, forcing the fluid
back through the small turbulence area into the mixing chamber (C).
This induces effective mixing of the three solutions and begins the phase
separation. This compression/relaxation cycle can be performed as many
times as is required as along as the disc is maintained above the burst
frequency of the siphon channel. Once phase separation occurs, the
aqueous phase resides on top, in the mixing chamber, leaving the
interphase and organic phase in the pneumatic arms (D). Once the
sample is ready for collection, the disc is spun to a lower frequency; the
air expands even more within the pneumatic arms, pushing the fluid to
a level in the mixing chamber that is higher than the siphon crest (E).
The contents of the siphon that were unmixed are collected in the waste
chamber (F) and the aqueous phase is collected in the collection chamber
and can be extracted from the disc for further downstream processing
and detection (G).

154
Figure 7.4: Working principle of µHomogenizer. Once solutions are loaded, the
disc undergoes multiple cycles or compression and relaxation until phase
separation occurs. The disc is then spun slower and the separated aqueous
phase is transported over the siphon to the collection chamber. The waste
chamber collects the not lysed mixture contained within the siphon.
155
7.2.3 Materials and Methods
7.2.3.1 Disc Fabrication
The disc (Ø 120 mm) consisted of two layers of Zeonor (Section
2.1.1) and two layers of PSA, one white, one clear. Zeonor was chosen as
the polymer of choice as most other plastics offer poor chemical
resistance to the harsh organic solvents (TRI Reagent and BAN) used in
these experiments. The disc features were milled into a 1.5mm thick
Zeonor layer using CNC machining (Section 2.1.2.2). The Zeonor discs
cannot be cut using laser ablation as it absorbs too strongly in the IR
and melts giving a very unclean cut. Also precision milling of various
depths for the individual parts is required. This could not be achieved
with the laser.
The precision knife cutter was used to cut the silhouette of the
structures into the white PSA layer. These two layers were adhered with
a 0.6 mm thick Zeonor layer as a base layer. Finally, a clear PSA layer
was added to the top of the disc as an added protection against the
harsh chemicals and to seal the collection vent (Fig. 7.5).
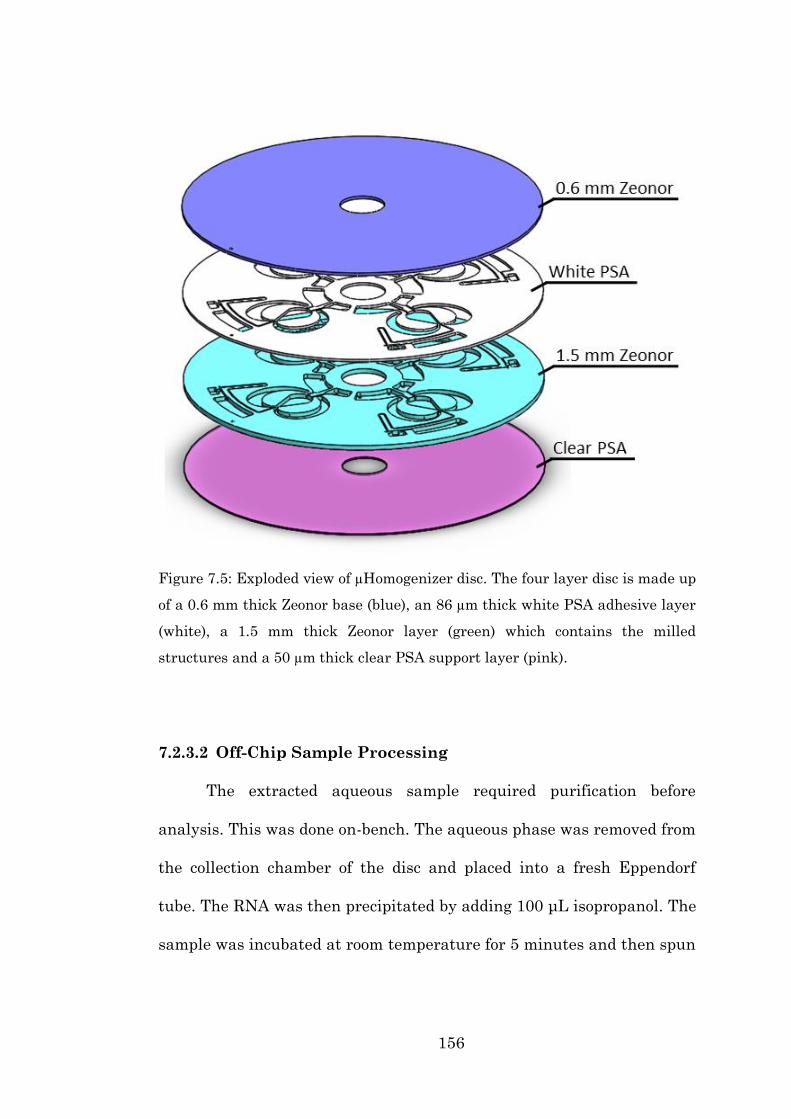
156
Figure 7.5: Exploded view of µHomogenizer disc. The four layer disc is made up
of a 0.6 mm thick Zeonor base (blue), an 86 µm thick white PSA adhesive layer
(white), a 1.5 mm thick Zeonor layer (green) which contains the milled
structures and a 50 µm thick clear PSA support layer (pink).
7.2.3.2 Off-Chip Sample Processing
The extracted aqueous sample required purification before
analysis. This was done on-bench. The aqueous phase was removed from
the collection chamber of the disc and placed into a fresh Eppendorf
tube. The RNA was then precipitated by adding 100 μL isopropanol. The
sample was incubated at room temperature for 5 minutes and then spun
157
at 14,000 rpm for 8 minutes. The RNA precipitated in a gel-like
transparent pellet at the bottom of the tube.
Without disturbing the pellet, the supernatant was exchanged to
100 μL solution of 75% ethanol (EtOH). The tubes were centrifuged for
another 5 minutes. Then the EtOH was exchanged and the step was
repeated.
The ethanol wash was removed and the pellet was briefly air-
dried. A final water solution was added to each sample up to its initial
volume and the RNA was left to dissolve at room temperature for 5
minutes. Before analysis samples were vortexed and spun down for 10
seconds.
To measure the concentration and integrity of the purified total
RNA the spectrophotometer was used (Section 2.4.2.2).
7.2.4 Results and Discussion
7.2.4.1 Fluidic Validation
Experimental validation was performed to determine the
optimum spin frequencies for the operation of the µHomogenizer. The
final spin frequency is shown in Figure 7.6.

158
Figure 7.6: Spin frequency profile of µHomogenizer versus time. The blue line
indicates the initial loading phase, the red line represents the cycling back and
forth between high and low frequencies for 30 cycles and the green line show
the shows the emptying and collection of the aqueous phase.
After loading the 80 µL of TRI-reagent, the 5 µL BAN and the 25
µL of sample, the disc was spun up to 100 Hz at an acceleration of 10
Hz/s, to allow the fluids to enter the mixing chamber and pneumatic
arms. The compression/relaxation cycles were then performed to mix the
solutions and separate the phases. The spin frequency was alternated
between 100 Hz and 45 Hz, in ten second intervals for 30 cycles (for a
total of 10 minutes), to allow adequate separation of the aqueous phase.
The frequency was then reduced from 100 Hz to 20 Hz, the air in the
pneumatic chambers pushed back even more, forcing the fluid to a level
159
higher than the siphon crest. The fluid therefore travelled over the
siphon to the waste and collection chamber. Once the aqueous phase was
fully retained with the collection chamber the spin frequency was then
slowly reduced to zero to ensure no undesired mixing of the waste and
collection chamber. The entire process takes ~11 minutes but each disc
contains four identical structures so up to four samples can be extracted
simultaneously.
7.2.4.2 Mixing Test
In order to validate the functionality of the mixing process of the
µHomogenizer, a fluidic test was performed using two chemicals,
potassium thiocyanate and iron nitrate, which change colour when
mixed. The second iteration of the design (Fig. 7.2b) was used for the
experiments. A stroboscopic fame sequence of the mixing is shown in
Figure 7.7.
The image sequence shows that the mixing process worked very
well on this disc, the two fluids (originally clear) were successfully
mixed. It took three compression/relaxation cycles for complete mixing
to occur. However, this test clearly shows the issue with having to stop
the disc. The premature breaking of the siphon resulted in some of the
unmixed fluid entering the collection chamber (Fig. 7.7B).
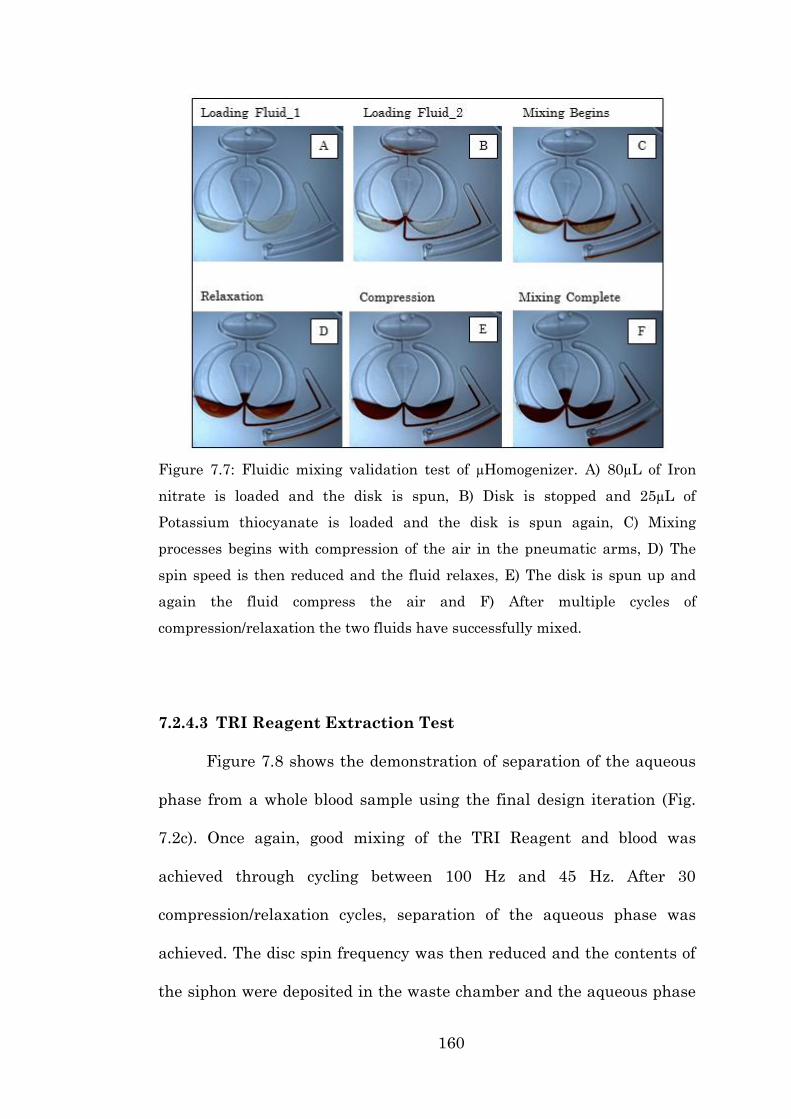
160
Figure 7.7: Fluidic mixing validation test of µHomogenizer. A) 80µL of Iron
nitrate is loaded and the disk is spun, B) Disk is stopped and 25µL of
Potassium thiocyanate is loaded and the disk is spun again, C) Mixing
processes begins with compression of the air in the pneumatic arms, D) The
spin speed is then reduced and the fluid relaxes, E) The disk is spun up and
again the fluid compress the air and F) After multiple cycles of
compression/relaxation the two fluids have successfully mixed.
7.2.4.3 TRI Reagent Extraction Test
Figure 7.8 shows the demonstration of separation of the aqueous
phase from a whole blood sample using the final design iteration (Fig.
7.2c). Once again, good mixing of the TRI Reagent and blood was
achieved through cycling between 100 Hz and 45 Hz. After 30
compression/relaxation cycles, separation of the aqueous phase was
achieved. The disc spin frequency was then reduced and the contents of
the siphon were deposited in the waste chamber and the aqueous phase
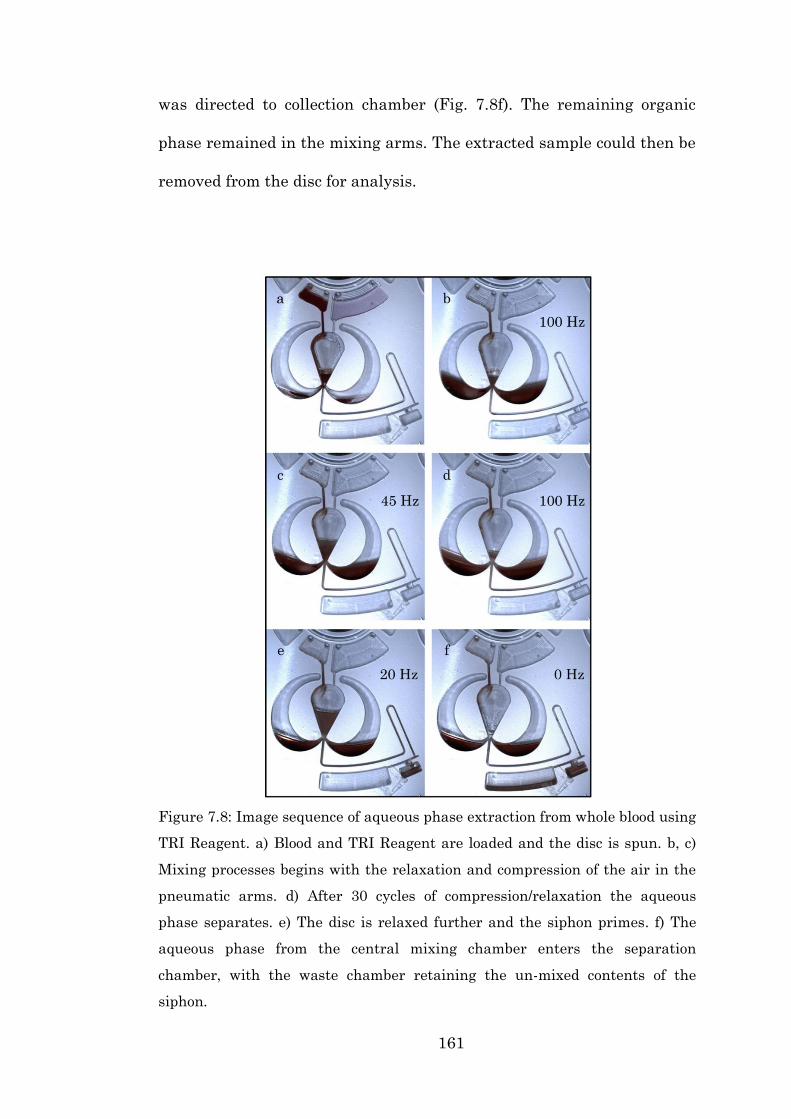
161
was directed to collection chamber (Fig. 7.8f). The remaining organic
phase remained in the mixing arms. The extracted sample could then be
removed from the disc for analysis.
Figure 7.8: Image sequence of aqueous phase extraction from whole blood using
TRI Reagent. a) Blood and TRI Reagent are loaded and the disc is spun. b, c)
Mixing processes begins with the relaxation and compression of the air in the
pneumatic arms. d) After 30 cycles of compression/relaxation the aqueous
phase separates. e) The disc is relaxed further and the siphon primes. f) The
aqueous phase from the central mixing chamber enters the separation
chamber, with the waste chamber retaining the un-mixed contents of the
siphon.

162
7.2.4.4 Biological Analysis
To determine the functionality of the system for biological testing,
various quantities of E. coli were spiked into whole blood and total RNA
was extracted into the aqueous phase using the µHomogenizer. The
samples were acquired by the author and run through the Nanodrop
(Section 2.4.2.2) by Dr. Nikolay Dimov (94).
Table 7.1: Average amount of total RNA extracted from whole blood spike with
E. coli, using µHomogenizer and conventional benchtop methods. Samples
were measured using the Nanodrop and each value was normalised to the
initially extracted volume of the aqueous phase (n = 8) (94).
Table 7.1 shows the outcome comparison of the µHomogenizer
versus benchtop methods for the extraction of total RNA from blood
samples spiked with E. coli. The whole blood was spiked off-chip with 10
µL, 5 µL, 2.5 µL or 0 µL of E. coli to reach a total sample volume of 25
µL. The results show that the µHomogenizer consistently recovered
higher amounts of total RNA when directly compared to the benchtop
equivalent. It should be noted that the Nanodrop is incapable of
differentiating between nucleic acids from the blood or the bacteria
which is the reason a signal even at 0 µL of E. coli.
10 µL 5 µL 2.5 µL 0 µL
µHomogenizer 5.3 ng µL-1
3.9 ng µL-1
3.5 ng µL-1
3.4 ng µL-1
On bench 3.4 ng µL-1
1.2 ng µL-1
0.9 ng µL-1
1.2 ng µL-1
Method of sample
preparation
Volume of E.coli spiked into whole blood

163
Figure 7.9: Spectra obtained from analysis of E. coli spiked blood using
Nanodrop.
Table 7.2: Spectrophotometer ratios based on absorbance values from analysis
of E. coli spiked blood. 260/280 & 260/230 ratios are given respectively.
The spectra shown in Figure 7.9 and the associated
spectrophotometer ratios (Table 7.2) give information about the purity of
the extracted samples and the efficiency of the system. Pure RNA has a
260/280 ratio of 2. The sample extracted from the µHomogenizer has a
260/280 ratio of 1.85. This indicates that there is some small
contamination, possibly a result of some small amount of phenol still
present in the aqueous phase. A 260/230 ratio value less than 1
indicates residual guanidine (which is part of the TRI_Reagent)
230 nm 260 nm 280 nm 260/280 260/280
µHomogenizer 4.23 3.13 1.69 1.85 0.74
bench-top 6.80 2.79 1.54 1.81 0.41
Method of sample
preparation
Absorbance values

164
contamination. The 0.74 value obtained from the µHomogenizer sample
indicates that further downstream purification is required. It should be
noted though that the samples obtained from the µHomogenizer show a
higher purity than the standard benchtop equivalent (94).
7.2.4.5 Inconsistency in Milling Technology
As mentioned previously, the premature priming of the siphon
was an issue with this design structure. The inclusion of dual loading
chambers somewhat addressed this issue, by allowing the disc to never
go below the 45 Hz during the cycling phases. However, this sometimes
was not fully effective, the siphon would still prime at the 45 Hz
frequency. It was determined that the reason for this was inconsistency
in the milling of the disc using the CNC milling machine. This
inconsistency was due to mounting issues of the disc within the machine
(Section 2.1.2.2). Coolant would spread in between the substrate and the
machine base. This could create a compressible area whereby the tool-
part would not mill away the structure but instead just push it away. If
the disc was milled correctly, to the correct depths then the siphon acted
as desired and the aqueous phase could be ‘cleanly’, extracted.
In order to determine the extent of the inconsistency of the
milling procedure, the milled depths of the siphon channels on three
discs were measured and compared. The siphons were labelled 1 – 4 and
165
a direct comparison of each siphons position within the milling device
was observed. The results are shown in Figure 7.10.
Figure 7.10 shows that large variation in milled depths of the
siphons even within one disc. The siphon channel was programmed to be
milled to a depth of 500 µm but only one of the twelve siphons measured
reached this and in-fact exceeded it. It seems that unless a disc was
milled to within some small tolerance of this value the siphon could
prematurely prime. The large and unpredictable variation within the
siphon depths is indicative of the variation within other structures
within the design. If the mixing chamber, for example, was milled too
shallow then, during the relaxation phase, the fluid level would be
higher than the siphon and it would prime.
This data shows an inherent limitation within the in-house
milling capabilities of our lab and therefore a means by which to
overcome this problem was devised.

166
Figure 7.10: Variation in milled siphon depth for three different discs using
CNC milling machine. The siphons cut in the same position on each disc were
compared. The dotted red line indicates depth programmed into the CNC (500
µm). Error bars show variation with n = 3 measurements taken on the one
siphon.
7.2.4.6 Event-triggered µHomogenizer System
The largest issue with the current design of the µHomogenizer is:
if the discs are not milled to the correct depths then premature priming
of the siphon can sometimes occur. To overcome this problem the air
vent in the collection chamber was sealed at the beginning of the
experiment, which created an air-trap within the siphon channel,
preventing the fluid from travelling over the siphon even at low spin
frequencies. This fix was not ideal, however, for two reasons. Firstly, the

167
disc must be stopped, and the air vent manually opened and then the
disc is recommenced spinning. This is not ideal when considering the
desired ‘user-free’ automated system. Secondly, as the disc must be
stopped, the fluid level reaches a point within the mixing chamber
where the organic solution is reintroduced to the aqueous phase and is
ultimately collected.
In order to overcome the manufacturing limitations and the
negative side-effects of the ‘quick-fix’, the µHomogenizer design was
integrated with a variation of the previously described event-triggered
valves. An image of the system is shown in Figure 7.11.
Figure 7.11: Design of event-trigger µHomogenizer. The dotted orange lines
indicate channel cut into the lower layer of the discs and connecting to the
holes shown.
168
The disc was made up of eight layers: three 0.6 mm Zeonor layers,
one 1.2 mm Zeonor layer and four white PSA layers. The design was
based on the µHomogenizer with some additions. An aqueous
dissolvable film (ADF) tab, ADF1, was placed within the mixing
chamber. This tab sealed an air channel connected to the siphon. At the
base of the siphon is a second, ADF2, tab which blocks the entrance to
the waste and collection chambers. As long as both tabs remain closed
the siphon channel is air-locked and fluid will not be able to pass the
crest of the siphon channel, even at low frequencies. However, once
ADF1 is dissolved, the siphon channel is open to atmosphere and the
fluid can travel over the siphon and come in contact with ADF2. The
operating principle is shown in Figure 7.12 using a stroboscopic frame
sequence. Note that the colour change solutions, potassium thiocyanate
and iron nitrate were used.
Initially, the two solutions were loaded and the disc was spun to
100 Hz. The combined fluid entered the mixing chamber and was forced
up into the side arms. Some fluid travelled down the channel at the base
of mixing chamber but does not approach the siphon crest (Fig. 7.12a).
This is due to the air-lock achieved by ADF1 located in the mixing
chamber. The compression/relaxation cycling was then performed,
cycling back and forth between 100 Hz and 50 Hz (Fig. 7.12b, c). During
this time the fluid remained far from the siphon crest. Once mixing was
achieved, the frequency was reduced to 10 Hz to push the fluid to a level
within the mixing chamber where it came in contact with ADF1. The
169
frequency was maintained at 10 Hz for approximately 1.5 minutes to
allow the film time to dissolve (Fig. 7.12d). The frequency was then
increased to 20 Hz to pump the fluid up over the siphon crest and down
onto ADF2 (Fig. 7.12e). After approximately one minute the tab
dissolved and the fluid travelled through the channel in the bottom layer
to the waste and collection chamber. An increase in spin frequency to 50
Hz was used to enhance emptying (Fig. 7.12f).

170
Figure 7.12: Image sequence of operating principle of event-triggered
µHomogenizer. a) At high spin frequency air is compressed within pneumatic
arms by the fluid. b) Upon reduction of spin rate, air pushes back and fluid is
pushed back into central mixing chamber. c) Compression/relaxation cycle
continues with fluid still air-locked away from siphon crest. d) Spin rate
further reduced and fluid contacts with ADF1. e) Slight increase in spin rate to
encourage fluid over the now open siphon. f) Fluid dissolves ADF2. g) Fluid is
directed into waste and collection chambers.
171
This novel modification of the event-triggered system allows the
dissolution of the valve to be achieved not by an ancillary fluid but by
the aqueous phase of the extracted sample and it eliminates errors
associated with limitations of milling technologies.
7.3 Mechanical Cell Lysis of Nucleic Acids
An alternative method of nucleic acid extraction to the chemical
cell lysis is mechanical cell lysis. Mechanical lysis involves the rupturing
of the cell wall through piercing, breaking or tearing to allow the access
the inner contents of the cell.
Mechanical lysis is of particular importance when dealing with
cell-types that have rigid cell walls. Mammalian cells tend to be more
shear-sensitive and require far less energy to disrupt the cell wall. Yeast
and similar fungi, as well as gram positive bacteria, in contrast, have a
much stronger cell membrane and are far more resistant to disruption.
Some methods of mechanical cell lysis were discussed in Section
1.5.2.1. A recent advancement of particular interest to the author was
described by Millis et al. (95). The work presented a new method of
mechanical cell lysis of algae cells, based on the ancient ‘Norse Mill’
design. The Norse Mill is a horizontal mill used to grind flour using a
water driven stone millstone. Millis designed a microscale lab-on-a-chip
technology based on this concept (Fig. 7.13).

172
Figure 7.13: Schematic of cross-section of flow driven mill. Algae sample enters
at the base of the millstone and exits through the adjacent channel. The
millstone’s rotation is driven by a flow on the top. Adapted from Millis et al.
2015 (95).
A rotating microfabricated millstone is embedded within the chip.
Two microchannels connect to the top and bottom of the mill: one to
provide the fluid flow to rotate the mill (using a set of vanes on the mill’s
upper side) and one channel that supplies the algae sample to the
grinding surface. The system was determined to have a 70% lysing
efficiency, even with a smooth mill stone surface.
The main disadvantage of this system is its time consuming and
high cost manufacturing requirements. The millstone, including the
vanes and grinding surface, with any texturing required, must be
fabricated out of a single silicon wafer using photolithography and Deep
Reactive Ion Etching, both of which are time consuming processes (95).
Also the use of an ancillary fluid, used to rotate the millstone, adds a
secondary source of complexity and possible source of contamination.
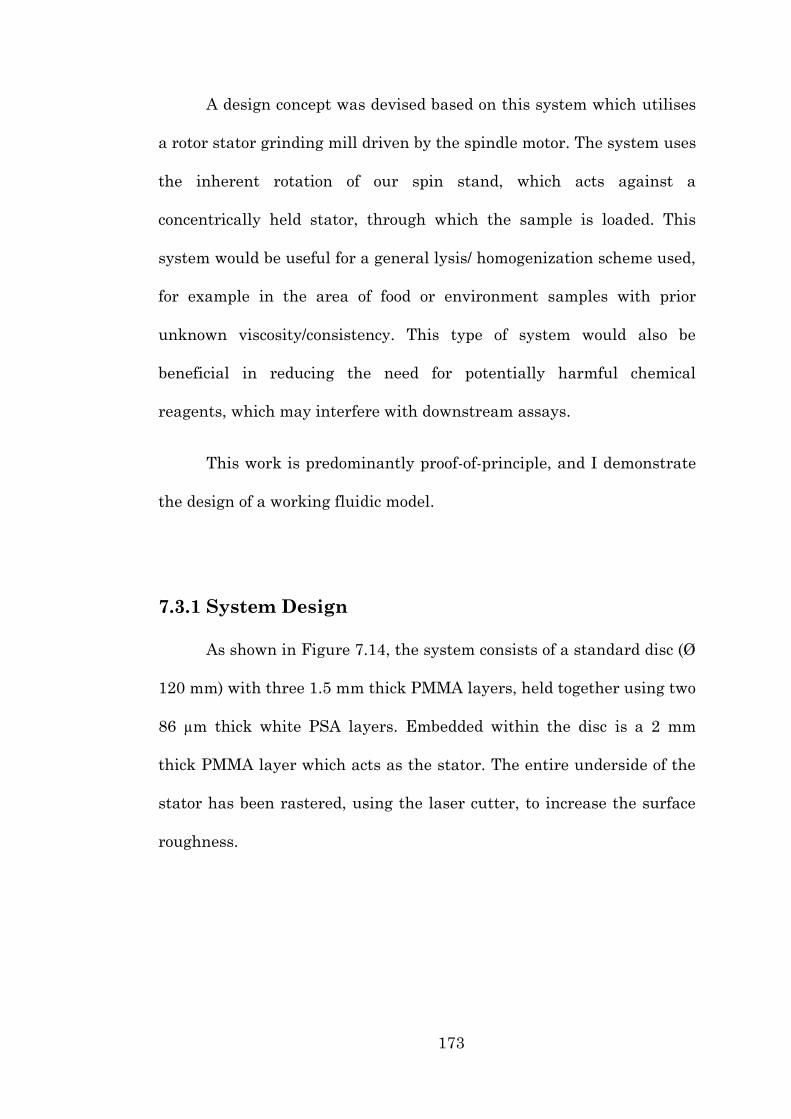
173
A design concept was devised based on this system which utilises
a rotor stator grinding mill driven by the spindle motor. The system uses
the inherent rotation of our spin stand, which acts against a
concentrically held stator, through which the sample is loaded. This
system would be useful for a general lysis/ homogenization scheme used,
for example in the area of food or environment samples with prior
unknown viscosity/consistency. This type of system would also be
beneficial in reducing the need for potentially harmful chemical
reagents, which may interfere with downstream assays.
This work is predominantly proof-of-principle, and I demonstrate
the design of a working fluidic model.
7.3.1 System Design
As shown in Figure 7.14, the system consists of a standard disc (Ø
120 mm) with three 1.5 mm thick PMMA layers, held together using two
86 µm thick white PSA layers. Embedded within the disc is a 2 mm
thick PMMA layer which acts as the stator. The entire underside of the
stator has been rastered, using the laser cutter, to increase the surface
roughness.
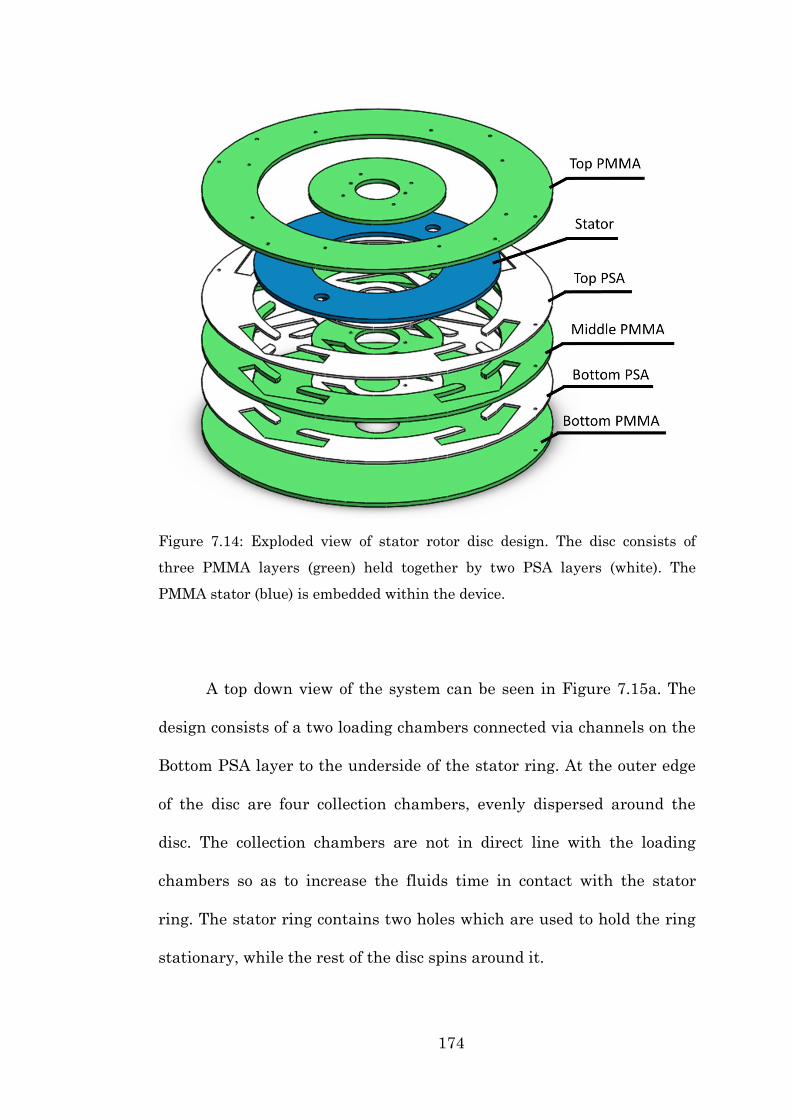
174
Figure 7.14: Exploded view of stator rotor disc design. The disc consists of
three PMMA layers (green) held together by two PSA layers (white). The
PMMA stator (blue) is embedded within the device.
A top down view of the system can be seen in Figure 7.15a. The
design consists of a two loading chambers connected via channels on the
Bottom PSA layer to the underside of the stator ring. At the outer edge
of the disc are four collection chambers, evenly dispersed around the
disc. The collection chambers are not in direct line with the loading
chambers so as to increase the fluids time in contact with the stator
ring. The stator ring contains two holes which are used to hold the ring
stationary, while the rest of the disc spins around it.
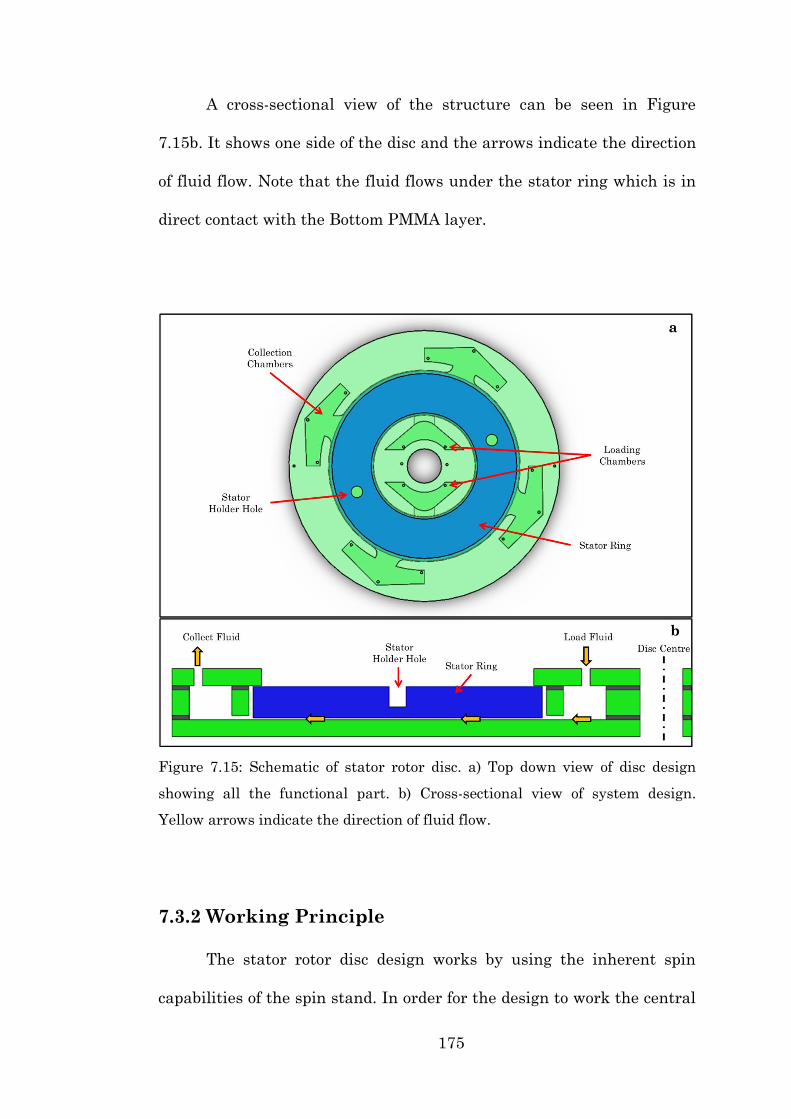
175
A cross-sectional view of the structure can be seen in Figure
7.15b. It shows one side of the disc and the arrows indicate the direction
of fluid flow. Note that the fluid flows under the stator ring which is in
direct contact with the Bottom PMMA layer.
Figure 7.15: Schematic of stator rotor disc. a) Top down view of disc design
showing all the functional part. b) Cross-sectional view of system design.
Yellow arrows indicate the direction of fluid flow.
7.3.2 Working Principle
The stator rotor disc design works by using the inherent spin
capabilities of the spin stand. In order for the design to work the central
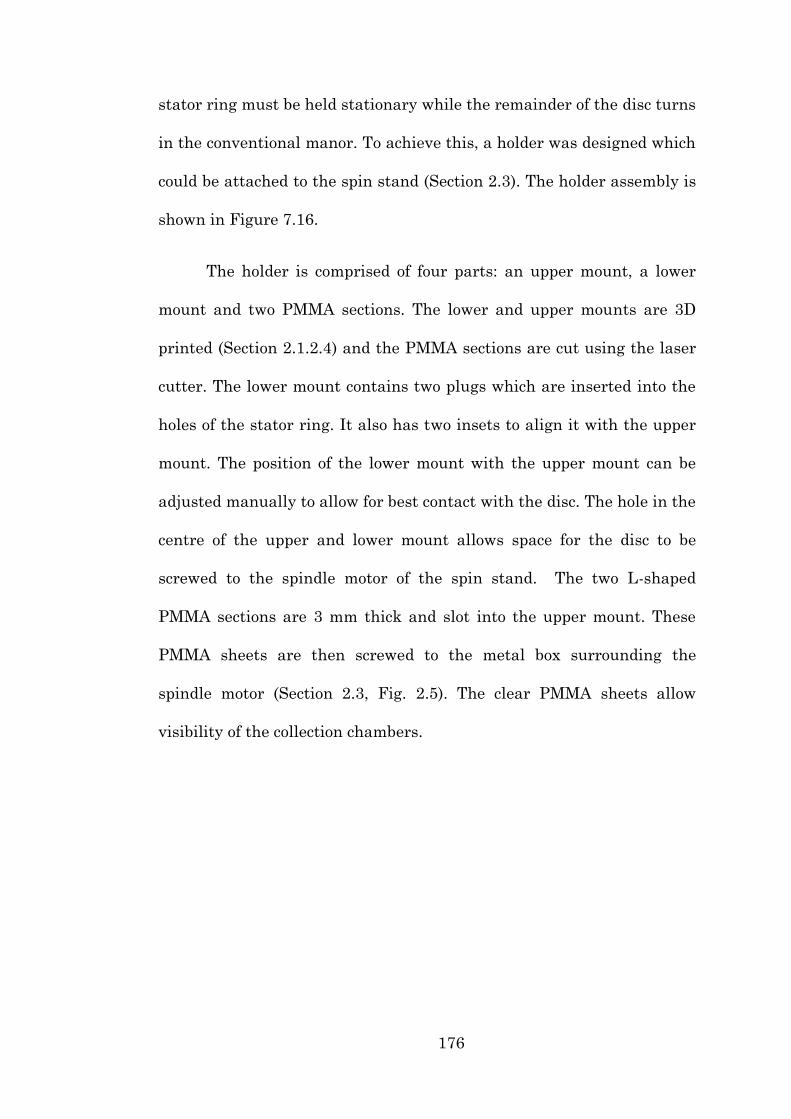
176
stator ring must be held stationary while the remainder of the disc turns
in the conventional manor. To achieve this, a holder was designed which
could be attached to the spin stand (Section 2.3). The holder assembly is
shown in Figure 7.16.
The holder is comprised of four parts: an upper mount, a lower
mount and two PMMA sections. The lower and upper mounts are 3D
printed (Section 2.1.2.4) and the PMMA sections are cut using the laser
cutter. The lower mount contains two plugs which are inserted into the
holes of the stator ring. It also has two insets to align it with the upper
mount. The position of the lower mount with the upper mount can be
adjusted manually to allow for best contact with the disc. The hole in the
centre of the upper and lower mount allows space for the disc to be
screwed to the spindle motor of the spin stand. The two L-shaped
PMMA sections are 3 mm thick and slot into the upper mount. These
PMMA sheets are then screwed to the metal box surrounding the
spindle motor (Section 2.3, Fig. 2.5). The clear PMMA sheets allow
visibility of the collection chambers.
177
Figure 7.16: Schematic of stator rotor holder which attached to the spin stand.
a) Exploded view of the functional components of the holder. b) Assembled view
of the holder.
A 400 µL volume, containing cells to be lysed, can be loaded into
each of the loading chambers. Under centrifugation the stator ring
remains stationary while the rest of the disc rotates. As the disc spins,
the fluid leaves the loading chamber and travels below the stator ring.
The ring offers some resistance to the fluids passage outwards and it
travels around the surface somewhat before entering the collect
chambers. This was tested by adding one of the two colour change
178
chemicals, potassium thiocyanate and iron nitrate, to each loading
chamber. The fluids collected from the collection chamber had
completely mixed, showing that the fluids do not travel directly
outwards.
7.3.3 Bio-Analysis Possibilities
In order to test the viability of the system for cell lysis, E. coli
cells in LB broth media were passed through the system. The efficacy of
cell lysing was accessed using a traditional microscope and a 3D
microscope (Section 2.4.1.1) and a hemocytometer (Section 2.4.2.4). The
quantities of cells in a 7 µL volume (assuming good homogeneity of the
sample) were counted before and after passing through the stator rotor
disc.
Unfortunately, this test was unsuccessful as the number of cells
counted before and after was almost identical. It was determined that E.
coli cells are too small to be lysed using this system. An average E. coli
cell has a size of ~ 1 x 3 µm (96) versus the size of Alexandrium
tamarense (the algae used by Millis et al.) of 22 – 51 µm in length and
17 – 44 µm in width (97). It was therefore determined that a larger cell
type would be needed to demonstrated the viability of this system.

179
7.4 Conclusion
This chapter described the development of two separate nucleic
acid extraction platforms. The first is a novel centrifugo-pneumatic
‘µHomogenizer’, which implements a 3-phase fluid extraction protocol of
RNA. This system builds on the work of Linares et al. (53) to integrate
chemical lysis and separation of the RNA containing aqueous phase and
show significant improvement over its time-consuming and labour
intensive benchtop alternate. The second is the development of a
mechanical lysis method that utilises a rotor stator grinding mill driven
by the spindle motor. This system could be used for general lysis of a
wide range of cell types but would be of significant benefit for armoured
cells. It would also be beneficial in reducing the need for potentially
harmful chemical reagents, which might interfere with downstream
assays.
180
Chapter 8
Conclusion and Future
Work
8.1 Conclusions
In this work the development of novel flow control methods on
centrifugal microfluidic platforms for nucleic acid testing was shown.
Flow control is of the utmost importance in centrifugal microfluidics,
where the centrifugal field acts concurrently on all parts of the disc.
The inclusion of functional materials within these Lab-on-a-Disc
structures opens up new avenues for sample-to-answer devices. This is
especially important in biological diagnostics, such as nucleic acid
testing, where the main bottleneck in performing these processes on
microfluidic devices is in sample preparation.
Nucleic acid testing can be broken into three stages: extraction
purification and detection. The solid-phase purification process requires
181
the sequential handling of multiple aqueous and organic solutions. The
difficulty lies in being able to sequentially handle all these different
fluids, but to ultimately collect a sample which is uncontaminated by
them.
To that end, the work demonstrated in this report focused on two
separate methods of nucleic acid purification. The first was the
development of a solvent-selective router which integrated two solvent
specific valves into a multilayer microfluidic disc: a dissolvable film
membrane, which dissolves when it comes in contact with an aqueous
solution but is completely resistance to organic solutions and a PTFE-
supported hydrophobic membrane, which is impermeable to aqueous
solutions but allows water to pass through. The development of the
system from a simple router to the more complex design, capable of
handling the four fluids, was demonstrated. The performance of the
system was evaluated for the purification of total RNA from MCF7 cell
homogenate. The capability of the system to purify total RNA with
significant integrity and concentration through an automated,
rotationally controlled process was shown.
The second method of solid-phase purification arose from the
integration of multilayer Graphene Oxide (GO) membranes into our
microfluidic structures. GO offers unique properties as a flow control
element in microfluidics. Notably, I demonstrated two such properties of
the GO membranes: their solvent selectivity and air impermeability.

182
Beyond a specific burst pressure, GO membranes allow water to pass
through with very low flow resistance; however, it completely blocks
organic solutions or air, even at high pressure heads. I first developed a
method for inclusion of the GO into polymeric microfluidic systems. I
then used those devices to investigate and characterise the capabilities
of the GO.
A novel, centrifugo-pneumatic scheme for solvent-selective
routing of organic and aqueous flows based on an integrated GO
membrane was demonstrated. I then implemented a sequential, multi-
reagent protocol geared towards automated solid-phase purification of
nucleic acids with a sequence of washing and elution steps with aqueous
and organic fluids. This second routing system improved on the first in
that the integration of a single membrane is capable of handling all the
various fluids needed for this complex process, as well as significantly
reducing manufacturing and fabrication processes. The GO router was
further developed by combining it with an event-triggered valving
scheme first developed by Kinahan et al. (27). The router system was
used to purify DNA and it was shown that, despite the low yield of DNA,
the router is a significant improvement on the highly labour-intensive
benchtop equivalent and uses significantly reduced sample volumes. Its
ease of manufacturing and simple to use system offers significant
benefits for point-of-care uses.

183
The final chapter focused on the upstream part of the nucleic acid
testing protocol, extraction. To this end, two separate extraction
platforms were developed. The first was a novel centrifugo-pneumatic
‘µHomogenizer’, which implements a 3-phase fluid extraction protocol of
RNA. This system built on the work of Linares et al. (53) to integrate
chemical lysis and separation of the RNA containing aqueous phase and
showed significant improvement of its time-consuming and labour
intensive benchtop alternate. The system was further advanced by
combining it with a modified event-triggered system. This novel
modification of the event-triggered system allows the dissolution of the
valve to be achieved not by an ancillary fluid but by the aqueous phase
of the extracted sample and it eliminates errors associated with
limitations of milling technologies.
The second extraction system showed the design of a mechanical
lysis method that utilises a rotor stator grinding mill driven by the
spindle motor. This system could be used for general lysis of a wide
range of bacteria but would be of significant benefit for armoured cells.
It would also be beneficial in reducing the need for potentially harmful
chemical reagents, which might interfere with downstream assays.
8.2 Future Work
Building on this work, there are several strands which could be
explored.
184
8.2.1 Further Investigation of GO Capabilities
Though a significant number of capabilities of the GO membranes
were investigated during the course of this thesis, there are still a range
of areas which could be explored. The possibly of using the membranes
for filtration purposes may be useful in environmental analysis where it
is important to remove larger particulates before testing. The capability
of using the membranes for desalination could also be investigated.
Desalination is currently a very slow process in microfluidics (98);
Cohen-Tanugi et al. theorised the use of graphene membranes for this
purpose (99). Also, though it was shown that DNA passed freely
through the GO membranes, it was not clear whether all sizes of DNA
would do so. The GO could possibly be used for size separation of DNA.
Finally, the interaction of RNA with the GO membrane should be
investigated. RNA is far more susceptible to degradation and so may be
affected by the membrane.
8.2.2 Increase of NA Purification Yield
The results given in Chapters 3, 5 and 6 shows that relatively
small quantities of DNA and RNA are being recovered from the discs
after purification. The possible reasons for this are discussed in the
relevant chapters but there are some broad solutions which may help to
enhance the yield:
185
1. An investigation of the possible points of loss of the DNA should
be undertaken. By fluorescently tagging the DNA and performing
the experiments, the discs could then be viewed under a
fluorescent microscope to show the positions on the disc where
DNA is being trapped.
2. In the case of the GO Router system, the first flowed through
solution was analysed but the organic washes were not collected
and tested (Section 5.4.2.2). By passing this solution through a
spin column the loss due to the organic washes could be
determined.
3. The solid phase could be changed. The use of silica beads may not
be the most efficient capture media. The integration of a silica
membrane, such as those used in the spin columns, may help
improve the capture efficiency.
4. There is a possibly that the DNA is binding to the polymer
surfaces. The use of a blocking agent such as BSA may help
prevent this.
5. In the case of the EGOR (Chapter 6), the DNA may be sticking to
the PSA base. Removing that PSA layer may stop this from
happening.
6. In order to try and enhance the binding and release efficiency, the
contact time of the fluids with the beads could be increased and
drying steps could be implemented. Adjustments to the pH or salt
concentrations may also have an effect.
186
8.2.3 NA Extraction Advancement
The NA extraction systems shown in Chapter 7 could be further
advanced. With the µHomogenizer, the functionality of the system for
RNA extraction was shown, however there is further optimisation and
characterisation that can be undertaken. The optimum number of
compression relaxation cycles needs to be biologically validated. The 30
cycle number was determined through visual inspection of the
separating solutions but the point at which optimum extraction
efficiency occurs should be determined.
The mechanical rotor system, shown here, was a proof of principle
concept that has only been shown to work fluidically, and its inability to
lyse E.coli cells was discussed. The next stage in the process should be to
characterise the system fully to determine the effect of varying raster
depths, to show cell lysis with larger and/or armoured cells and to
determine if the mechanical grinding will damage the DNA/RNA.
8.2.4 Design of Full Sample-to-Answer System
The systems described in this thesis are all individual parts
capable of performing the sample preparation aspects of NA testing The
ultimate goal is to combine these aspects together into a singular device.
The device should be capable of taking in a sample, running all the
necessary extraction (using the µHomogenizer or Stator rotor) and
purification (using the EGOR system) steps and performing on-board

187
detection. In order to allow for POC capabilities, instrumentation needs
to be developed that would allow the operation of this integrated system,
in a simple and straight-forward manner.
188
References
1. Clerc O, Greub G. Routine use of point-of-care tests: usefulness
and application in clinical microbiology. Clin Microbiol Infect. 2010
Aug;16(8):1054–61.
2. Chen WY. Measuring the Effectiveness of Mammography. JAMA
Oncol. American Medical Association; 2015 Oct 20;1(8):1.
3. Saravolatz LD, Manzor O, VanderVelde N, Pawlak J, Belian B.
Broad-range bacterial polymerase chain reaction for early
detection of bacterial meningitis. Clin Infect Dis. 2003 Jan
1;36(1):40–5.
4. Yager P, Domingo GJ, Gerdes J. Point-of-care diagnostics for
global health. Annu Rev Biomed Eng. 2008 Jan;10:107–44.
5. Diabetes.co.uk. Blood Glucose Testing [Internet]. 2015 [cited 2015
Dec 26]. Available from: http://www.diabetes.co.uk/blood-
glucose/blood-glucose-testing.html
6. Siemens. Point of Care Testing.
7. Radisen Diagnostics. Radisens Diagnostics – Integrated Multi-
mode Point-of-Care Diagnostics » Radisens Technology [Internet].
[cited 2015 Dec 26]. Available from:
http://www.radisens.com/technology/
8. Abraxis. Piccolo Xpress [Internet]. [cited 2015 Dec 26]. Available
from: http://www.piccoloxpress.com/products/piccolo/overview/
9. Lee BS, Lee J-N, Park J-M, Lee J-G, Kim S, Cho Y-K, et al. A fully
automated immunoassay from whole blood on a disc. Lab Chip.
The Royal Society of Chemistry; 2009 Jun 7;9(11):1548–55.
10. Lee BS, Lee YU, Kim H-S, Kim T-H, Park J, Lee J-G, et al. Fully
189
integrated lab-on-a-disc for simultaneous analysis of biochemistry
and immunoassay from whole blood. Lab Chip. The Royal Society
of Chemistry; 2011 Jan 7;11(1):70–8.
11. Dineva MA, MahiLum-Tapay L, Lee H. Sample preparation: a
challenge in the development of point-of-care nucleic acid-based
assays for resource-limited settings. Analyst. 2007
Dec;132(12):1193–9.
12. Lee HH, Dineva MA, Chua YL, Ritchie A V, Ushiro-Lumb I,
Wisniewski CA. Simple amplification-based assay: a nucleic acid-
based point-of-care platform for HIV-1 testing. J Infect Dis. 2010
Apr 15;201 Suppl(Supplement_1):S65–72.
13. Park BH, Jung JH, Zhang H, Lee NY, Seo TS. A rotary
microsystem for simple, rapid and automatic RNA purification.
Lab Chip. The Royal Society of Chemistry; 2012 Oct
21;12(20):3875–81.
14. Sun Y, Høgberg J, Christine T, Florian L, Monsalve LG, Rodriguez
S, et al. Pre-storage of gelified reagents in a lab-on-a-foil system
for rapid nucleic acid analysis. Lab Chip. The Royal Society of
Chemistry; 2013 Apr 21;13(8):1509–14.
15. Cordray MS, Richards-Kortum RR. Emerging nucleic acid-based
tests for point-of-care detection of malaria. Am J Trop Med Hyg.
2012 Aug;87(2):223–30.
16. Chin CD, Linder V, Sia SK. Commercialization of microfluidic
point-of-care diagnostic devices. Lab Chip. 2012 Jun
21;12(12):2118–34.
17. Chakraborty S. Microfluidics and Microfabrication. 1st ed. New
York Springer; 2010.
18. Ducrée J, Haeberle S, Lutz S, Pausch S, Stetten F Von, Zengerle
190
R. The centrifugal microfluidic Bio-Disk platform. J
Micromechanics Microengineering. 2007 Jul 1;17(7):S103–15.
19. Gorkin R, Park J, Siegrist J, Amasia M, Lee BS, Park J-M, et al.
Centrifugal microfluidics for biomedical applications. Lab Chip.
2010 Jul 21;10(14):1758–73.
20. Oh KW, Ahn CH. A review of microvalves. J Micromechanics
Microengineering. 2006;16(5):R13–39.
21. Siegrist J, Gorkin R, Clime L, Roy E, Peytavi R, Kido H, et al.
Serial siphon valving for centrifugal microfluidic platforms.
Microfluid Nanofluidics. 2009 Nov;9(1):55–63.
22. Chen JM, Huang P-C, Lin M-G. Analysis and experiment of
capillary valves for microfluidics on a rotating disk. Microfluid
Nanofluidics. 2007 Jul 27;4(5):427–37.
23. Siegrist J, Gorkin R, Clime L, Roy E, Peytavi R, Kido H, et al.
Serial siphon valving for centrifugal microfluidic platforms.
Microfluid Nanofluidics. 2009 Nov 4;9(1):55–63.
24. Gorkin R, Nwankire CE, Gaughran J, Zhang X, Donohoe GG, Rook
M, et al. Centrifugo-pneumatic valving utilizing dissolvable films.
Lab Chip. 2012 Aug 21;12(16):2894–902.
25. Park J, Cho Y, Lee B, Lee J, Ko C. Multifunctional microvalves
control by optical illumination on nanoheaters and its application
in centrifugal microfluidic devices. Lab Chip. 2007;7:557–64.
26. van der Linden HJ, Herber S, Olthuis W, Bergveld P. Stimulus-
sensitive hydrogels and their applications in chemical
(micro)analysis. Analyst. The Royal Society of Chemistry; 2003
Apr 7;128(4):325–31.
27. Kinahan DJ, Kearney SM, Dimov N, Glynn MT, Ducrée J. Event-
triggered logical flow control for comprehensive process integration
191
of multi-step assays on centrifugal microfluidic platforms. Lab
Chip. 2014 Jul 7;14(13):2249–58.
28. Mishra R, Alam R, Kinahan DJ, Anderson K, Ducree J. Lipophilic-
membrane based routing for centrifugal automation of
heterogeneous immunoassays. 2015 28th IEEE International
Conference on Micro Electro Mechanical Systems (MEMS). IEEE;
2015. p. 523–6.
29. Kim J, Hee Jang S, Jia G, Zoval J V, Da Silva NA, Madou MJ. Cell
lysis on a microfluidic CD (compact disc). Lab Chip. The Royal
Society of Chemistry; 2004 Oct 7;4(5):516–22.
30. Brenner T, Glatzel T, Zengerle R, Ducrée J. Frequency-dependent
transversal flow control in centrifugal microfluidics. Lab Chip. The
Royal Society of Chemistry; 2005 Jan 24;5(2):146–50.
31. Haeberle S, Pausch S, Burger R, Lutz S, Stetten F von, Zengerle
R, et al. Automation of nucleic acid extraction by a Coriolis-force
actuated droplet router. Proceedings of the 11th International
Conference on Miniaturized Systems for Chemistry and Life
Sciences (μTAS 2007). Paris; 2007. p. 1231–3.
32. Kloke A, Fiebach AR, Zhang S, Drechsel L, Niekrawietz S, Hoehl
MM, et al. The LabTube - a novel microfluidic platform for assay
automation in laboratory centrifuges. Lab Chip. 2014 May
7;14(9):1527–37.
33. Haeberle S, Zengerle R. Microfluidic platforms for lab-on-a-chip
applications. Lab Chip. 2007 Sep;7(9):1094–110.
34. Madou M, Zoval J, Jia G, Kido H, Kim J, Kim N. Lab on a CD.
Annu Rev Biomed Eng. Annual Reviews; 2006 Jan 11;8:601–28.
35. Gorkin R, Clime L, Madou M, Kido H. Pneumatic pumping in
centrifugal microfluidic platforms. Microfluid Nanofluidics. 2010

192
Feb 17;9(2-3):541–9.
36. Noroozi Z, Kido H, Micic M, Pan H, Bartolome C, Princevac M, et
al. Reciprocating flow-based centrifugal microfluidics mixer. Rev
Sci Instrum. 2009 Jul;80(7):075102.
37. Grumann M, Geipel A, Riegger L, Zengerle R, Ducrée J. Batch-
mode mixing on centrifugal microfluidic platforms. Lab Chip. 2005
May;5(5):560–5.
38. Ng AHC, Uddayasankar U, Wheeler AR. Immunoassays in
microfluidic systems. Anal Bioanal Chem. 2010;397(3):991–1007.
39. Pratt ED, Huang C, Hawkins BG, Gleghorn JP, Kirby BJ. Rare
Cell Capture in Microfluidic Devices. Chem Eng Sci. 2011 Apr
1;66(7):1508–22.
40. Zare RN, Kim S. Microfluidic Platforms for Single-Cell Analysis.
Annual Reviews; 2010 Jul 9;
41. Dineva MA, Mahilum-Tapay L, Lee H. Sample preparation: a
challenge in the development of point-of-care nucleic acid-based
assays for resource-limited settings. Analyst. The Royal Society of
Chemistry; 2007 Nov 19;132(12):1193.
42. Sidransky D. Nucleic Acid-Based Methods for the Detection of
Cancer. Science (80- ). 1997 Nov 7;278(5340):1054–8.
43. McCalla SE, Tripathi A. Microfluidic reactors for diagnostics
applications. Annu Rev Biomed Eng. Annual Reviews; 2011 Aug
15;13:321–43.
44. Heneghan HM, Miller N, Kelly R, Newell J, Kerin MJ. Systemic
miRNA-195 differentiates breast cancer from other malignancies
and is a potential biomarker for detecting noninvasive and early
stage disease. Oncologist. 2010 Jan;15(7):673–82.
193
45. Wheelwright SM. Protein Purification: Design and Scale Up of
Downstream Processing. Hanser-Gardner Publications; 1991. 228
p.
46. Dahm R. Discovering DNA: Friedrich Miescher and the early years
of nucleic acid research. Hum Genet. 2007 Sep 28;122(6):565–81.
47. TRI Reagent® Protocol | Sigma-Aldrich [Internet]. [cited 2015 Dec
28]. Available from: http://www.sigmaaldrich.com/technical-
documents/protocols/biology/tri-reagent.html
48. Boom R, Sol CJ, Salimans MM, Jansen CL, Wertheim-van Dillen
PM, van der Noordaa J. Rapid and simple method for purification
of nucleic acids. J Clin Microbiol. 1990 Mar;28(3):495–503.
49. O’Connor L, Glynn B. Recent advances in the development of
nucleic acid diagnostics. Expert Rev Med Devices. Taylor &
Francis; 2014 Jan 9;
50. Cho Y-K, Lee J-G, Park J-M, Lee B-S, Lee Y, Ko C. One-step
pathogen specific DNA extraction from whole blood on a
centrifugal microfluidic device. Lab Chip. The Royal Society of
Chemistry; 2007 May 2;7(5):565–73.
51. Than Linh Quyen, Sun Yi, Wei Hoe Chin, Tran Quang Hung,
Sannah Jardenbæk AW and DDB. Eight-chamber microfluidic
device with integrated loop mediated isothernmal amplification
(LAMP) for multiple detection of Campylobacter spp from pig at
slaughter. Proceedings of The18th International Conference on
Miniaturized Systems for Chemistry and Life Sciences. 2014. p.
1930–2.
52. Sun Y, Quyen TL, Hung TQ, Chin WH, Wolff A, Bang DD. A lab-
on-a-chip system with integrated sample preparation and loop-
mediated isothermal amplification for rapid and quantitative
detection of Salmonella spp. in food samples. Lab Chip. The Royal
194
Society of Chemistry; 2015 Apr 21;15(8):1898–904.
53. Linares A V, Iii RG, Glynn B, Godino N, Miller N, Kerin M, et al.
Purification of miRNA from whole blood by chemical lysis and
phase separation in a centrifugo-pnuematic micro-homogenizer.
Proceedings of the 15th International Conference on Miniaturized
Systems for Chemistry and Life Sciences (μTAS). Seattle; 2011. p.
1460–2.
54. SOLIDWORKS. 3D CAD Design Software SOLIDWORKS
[Internet]. [cited 2016 May 2]. Available from:
http://www.solidworks.com/
55. Herold KE, Rasooly A. Lab on a Chip Technology: Fabrication and
microfluidics, Volume 1. 1st Ed. Horizon Scientific Press; 2009.
409 p.
56. Zhang W, Lin S, Wang C, Hu J, Li C, Zhuang Z, et al.
PMMA/PDMS valves and pumps for disposable microfluidics. Lab
Chip. 2009 Nov 7;9(21):3088–94.
57. Chen Y, Zhang L, Chen G. Fabrication, modification, and
application of poly(methyl methacrylate) microfluidic chips.
Electrophoresis. 2008 May;29(9):1801–14.
58. Becker H, Gärtner C. Polymer microfabrication technologies for
microfluidic systems. Anal Bioanal Chem. 2008 Jan;390(1):89–111.
59. Cheng J-Y, Wei C-W, Hsu K-H, Young T-H. Direct-write laser
micromachining and universal surface modification of PMMA for
device development. Sensors Actuators B Chem. 2004
Apr;99(1):186–96.
60. Lee S-JJ, Sundararajan N. Microfabrication for Microfluidics.
Artech House; 2010. 276 p.
61. Nunes PS, Ohlsson PD, Ordeig O, Kutter JP. Cyclic olefin
195
polymers: emerging materials for lab-on-a-chip applications.
Microfluid Nanofluidics. 2010 Apr 7;9(2-3):145–61.
62. Yi L, Xiaodong W, Fan Y. Microfluidic chip made of COP (cyclo-
olefin polymer) and comparion to PMMA
(polymethylmethacrylate) microfluidic chip. J Mater Process
Technol. 2008 Nov;208(1-3):63–9.
63. Jagota A, Bennison SJ. Mechanics of adhesion through a fibrillar
microstructure. Integr Comp Biol. 2002 Dec 1;42(6):1140–5.
64. Klank H, Kutter JP, Geschke O. CO(2)-laser micromachining and
back-end processing for rapid production of PMMA-based
microfluidic systems. Lab Chip. The Royal Society of Chemistry;
2002 Nov 22;2(4):242–6.
65. Nayak NC, Lam YC, Yue CY, Sinha AT. CO 2 -laser
micromachining of PMMA: the effect of polymer molecular weight.
J Micromechanics Microengineering. 2008 Sep 1;18(9):095020.
66. Jensen MF, Noerholm M, Christensen LH, Geschke O.
Microstructure fabrication with a CO2 laser system:
characterization and fabrication of cavities produced by raster
scanning of the laser beam. Lab Chip. 2003 Nov;3(4):302–7.
67. Chung CK, Lin YC, Huang GR. Bulge formation and improvement
of the polymer in CO 2 laser micromachining. J Micromechanics
Microengineering. 2005 Oct 1;15(10):1878–84.
68. Gibbs D, Crandell TM. An Introduction to CNC Machining and
Programming. Industrial Press; 1991. 537 p.
69. Leatham-Jones B. Introduction to computer numerical control.
Pitman; 1986. 245 p.
70. Milling Machines MODELA MDX-40A >> Specifications | Roland
DG [Internet]. [cited 2015 Dec 21]. Available from:
196
http://www.rolanddg.com/product/3d/3d/mdx-
40a/specifications.html
71. Mecomber JS, Stalcup AM, Hurd D, Halsall HB, Heineman WR,
Seliskar CJ, et al. Analytical performance of polymer-based
microfluidic devices fabricated by computer numerical controlled
machining. Anal Chem. American Chemical Society; 2006 Feb
1;78(3):936–41.
72. Rengier F, Mehndiratta A, von Tengg-Kobligk H, Zechmann CM,
Unterhinninghofen R, Kauczor H-U, et al. 3D printing based on
imaging data: review of medical applications. Int J Comput Assist
Radiol Surg. 2010 Jul;5(4):335–41.
73. He Y, Qiu J, Fu J, Zhang J, Ren Y, Liu A. Printing 3D microfluidic
chips with a 3D sugar printer. Microfluid Nanofluidics. 2015 Apr
2;19(2):447–56.
74. VHX-5000 Digital Microscope | KEYENCE CORPORATION
[Internet]. [cited 2015 Dec 22]. Available from:
http://www.keyence.com/ss/products/microscope/vhx5000/
75. Bhushan B, editor. Encyclopedia of Nanotechnology. Dordrecht:
Springer Netherlands; 2012. 2273-2280 p.
76. Schroeder A, Mueller O, Stocker S, Salowsky R, Leiber M,
Gassmann M, et al. The RIN: an RNA integrity number for
assigning integrity values to RNA measurements. BMC Mol Biol.
2006 Jan;7:3.
77. Thermo Scientific NanoDrop Products – Nucleic Acids [Internet].
[cited 2015 Dec 22]. Available from:
http://www.nanodrop.com/ND1/NucleicAcid-Booklet.html
78. Wilfinger WW, Mackey K, Chomczynski P. Effect of pH and ionic
strength on the spectrophotometric assessment of nucleic acid
197
purity. Biotechniques. 1997 Mar;22(3):474–6, 478–81.
79. Adams RL. Cell Culture for Biochemists. 2nd Editio. Amsterdam;
Oxford: Elsevier Science; 1990. 122-123 p.
80. ThermoFisher. Guidelines for Maintaining Cultured Cells
[Internet]. [cited 2016 May 5]. Available from:
https://www.thermofisher.com/im/en/home/references/gibco-cell-
culture-basics/cell-culture-protocols/maintaining-cultured-
cells.html
81. Kim J, Kido H, Rangel RH, Madou MJ. Passive flow switching
valves on a centrifugal microfluidic platform. Sensors Actuators B
Chem. 2008 Jan;128(2):613–21.
82. Copois V, Bibeau F, Bascoul-Mollevi C, Salvetat N, Chalbos P,
Bareil C, et al. Impact of RNA degradation on gene expression
profiles: assessment of different methods to reliably determine
RNA quality. J Biotechnol. 2007 Jan 20;127(4):549–59.
83. Hiorns LR, Bradshaw TD, Skelton LA, Yu Q, Kelland LR,
Leyland-Jones B. Variation in RNA expression and genomic DNA
content acquired during cell culture. Br J Cancer. Cancer Research
UK; 2004 Jan 26;90(2):476–82.
84. Dimov N, Gaughran J, Auley DM, Boyle D, Kinahan DJ, Ducree J.
Centrifugally automated solid-phase purification of RNA. 2014
IEEE 27th International Conference on Micro Electro Mechanical
Systems (MEMS). IEEE; 2014. p. 260–3.
85. Novoselov KS, Geim a K, Morozov S V, Jiang D, Zhang Y,
Dubonos S V, et al. Electric field effect in atomically thin carbon
films. Science. 2004 Oct 22;306(5696):666–9.
86. Pumera M, Ambrosi A, Bonanni A, Chng ELK, Poh HL. Graphene
for electrochemical sensing and biosensing. TrAC Trends Anal

198
Chem. Elsevier Ltd; 2010 Oct;29(9):954–65.
87. Ang PK, Li A, Jaiswal M, Wang Y, Hou HW, Thong JTL, et al.
Flow sensing of single cell by graphene transistor in a microfluidic
channel. Nano Lett. 2011 Dec 14;11(12):5240–6.
88. Lo C-W, Zhu D, Jiang H. An infrared-light responsive graphene-
oxide incorporated poly(N-isopropylacrylamide) hydrogel
nanocomposite. Soft Matter. 2011;7(12):5604.
89. Nair RR, Wu H a, Jayaram PN, Grigorieva I V, Geim a K.
Unimpeded permeation of water through helium-leak-tight
graphene-based membranes. Science. 2012 Jan 27;335(6067):442–
4.
90. Taylor S. Impact of surface chemistry and blocking strategies on
DNA microarrays. Nucleic Acids Res. 2003 Aug 15;31(16):87e – 87.
91. PCR Protocol for Taq DNA Polymerase with Standard Taq Buffer
(M0273) | NEB [Internet]. [cited 2015 Dec 14]. Available from:
https://www.neb.com/protocols/1/01/01/taq-dna-polymerase-with-
standard-taq-buffer-m0273
92. Molecular Research Centre I. TRI Reagent® / TRI Reagent® BD /
TRI Reagent® LS [Internet]. [cited 2016 May 22]. Available from:
http://mrcgene.com/rna-isolation/tri-reagent
93. Chomczynski P, Sacchi N. Single-step method of RNA isolation by
acid guanidinium thiocyanate-phenol-chloroform extraction. Anal
Biochem. 1987 Apr;162(1):156–9.
94. Dimov N, Gaughran J, Clancy E, Barry T, Smith TJ, Ducree J.
Automated on-disc total RNA extraction from whole blood towards
point-of-care for early stage diagnostics. 2013 Transducers &
Eurosensors XXVII: The 17th International Conference on Solid-
State Sensors, Actuators and Microsystems (TRANSDUCERS &

199
EUROSENSORS XXVII). IEEE; 2013. p. 2548–51.
95. Millis J, Connell L, Collins SD, Smith RL. A microfabricated, flow
driven mill for the mechanical lysis of algae. 2015 28th IEEE
International Conference on Micro Electro Mechanical Systems
(MEMS). IEEE; 2015. p. 188–91.
96. Reshes G, Vanounou S, Fishov I, Feingold M. Cell shape dynamics
in Escherichia coli. Biophys J. 2008 Jan 1;94(1):251–64.
97. EOS - Phytoplankton Encyclopedia Project [Internet]. [cited 2015
Dec 21]. Available from:
http://www.eos.ubc.ca/research/phytoplankton/dinoflagellates/alex
andrium/a_tamarense.html
98. Roelofs SH, van den Berg A, Odijk M. Microfluidic desalination
techniques and their potential applications. Lab Chip. The Royal
Society of Chemistry; 2015 Aug 11;15(17):3428–38.
99. Cohen-Tanugi D, Grossman JC. Water desalination across
nanoporous graphene. Nano Lett. 2012 Jul 11;12(7):3602–8.
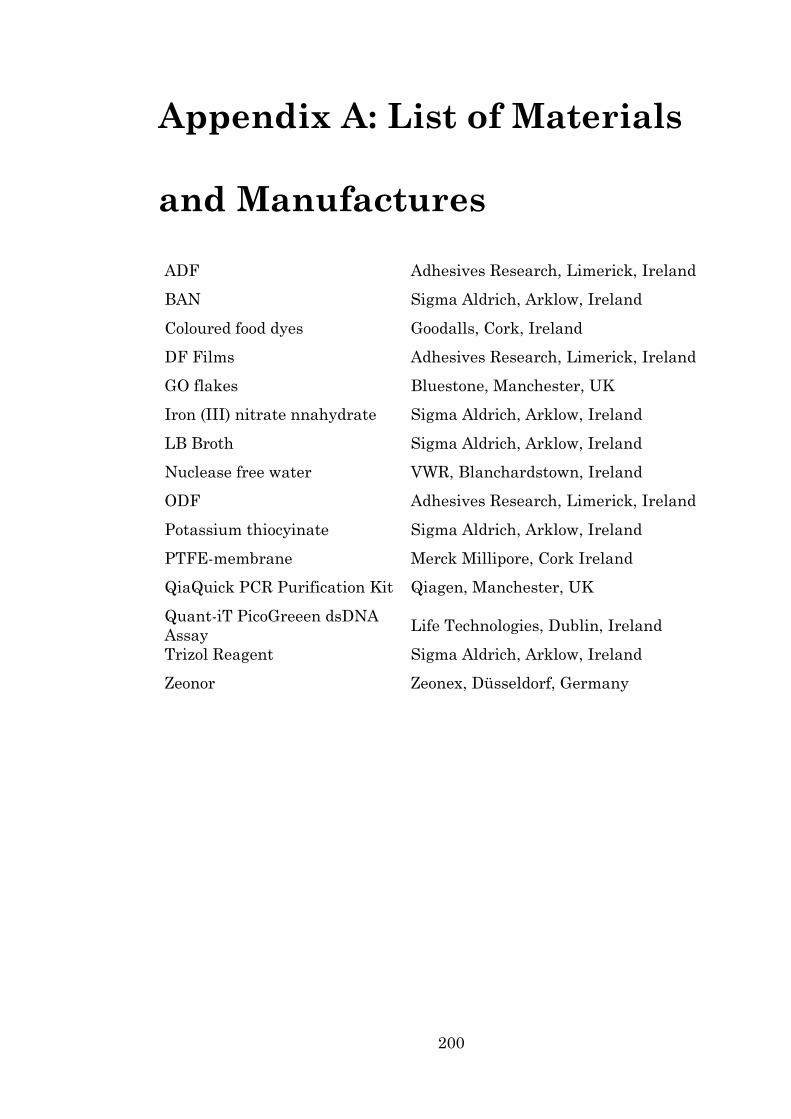
200
Appendix A: List of Materials
and Manufactures
ADF Adhesives Research, Limerick, Ireland
BAN Sigma Aldrich, Arklow, Ireland
Coloured food dyes Goodalls, Cork, Ireland
DF Films Adhesives Research, Limerick, Ireland
GO flakes Bluestone, Manchester, UK
Iron (III) nitrate nnahydrate Sigma Aldrich, Arklow, Ireland
LB Broth Sigma Aldrich, Arklow, Ireland
Nuclease free water VWR, Blanchardstown, Ireland
ODF Adhesives Research, Limerick, Ireland
Potassium thiocyinate Sigma Aldrich, Arklow, Ireland
PTFE-membrane Merck Millipore, Cork Ireland
QiaQuick PCR Purification Kit Qiagen, Manchester, UK
Quant-iT PicoGreeen dsDNA
Assay Life Technologies, Dublin, Ireland
Trizol Reagent Sigma Aldrich, Arklow, Ireland
Zeonor Zeonex, Düsseldorf, Germany