development of operation and performance...
TRANSCRIPT

Twelfth International Water Technology Conference, IWTC12 2008 Alexandria, Egypt
1
DEVELOPMENT OF OPERATION AND PERFORMANCE
MONITORING GUIDELINES FOR ANAEROBIC INDUSTRIAL
WASTEWATER TREATMENT PLANTS
Case Studies for Agro-based Industries in Germany and Egypt
Walid Abdel-Halim3, D. Weichgrebe
1, Hisham S. A. Halim
2
and K.-H. Rosenwinkel1
1 Institute of Water Quality and Waste Management (ISAH),
Hannover University, Germany 2 Sanitary and Environmental Dept., Faculty of Engineering, Cairo University, Egypt 3 Environmental Dept., Housing and Building National Research Center (HBNRC),
Egypt, E-mail: [email protected]
ABSTRACT
From past experiences of operation problems of anaerobic treatment plants, it is found
that most of these problems may be due to insufficient design quality, resulted from
using of incorrect or roughly assumed parameter values in the initial design. Then it
was very obvious that the decision of design parameters must be considered as a part
of the operation and monitoring of the process. The main subject of this paper is
development and description of operation and plant’s performance monitoring
guidelines for the anaerobic treatment plants as a pre-treatment for industrial
wastewater. The methodology of this paper comprised three phases of design,
operation and performance monitoring guidelines: First, Pre-design phase, which in
turns consisted of two types of experiments; a.) Triphenyltetrazoliumchloride TTC-
tests were used for determination of biochemical activity of sludge as anaerobic
inoculum and characterization of the effect of wastewater compounds on the
dehydrogenase activity of sludge; b.) Anaerobic batch tests (ABT) were used for
determination of anaerobic bio-degradability of wastewater. Second, start-up phase, in
which the start-up procedure was discussed and defined; Third, operation/ Process
performance monitoring phase, in which development and description of operation and
plant’s performance monitoring guidelines for the anaerobic treatment plants were
illustrated. The paper also includes two case studies one from Germany and the other
from Egypt for agro-based wastewater treatment by anaerobic process.
Keywords: industrial wastewater; food industries; anaerobic treatment; operation
and monitoring; performance guidelines
Twelfth International Water Technology Conference, IWTC12 2008 Alexandria, Egypt
2
INTRODUCTION
Anaerobic digestion has become the most frequently used method for the treatment of
medium and high concentration wastewaters, due to the economy of the process, the
low generation of surplus sludge, and winning of bio-energy by the biogas production
(Van Haandel and Lettinga, 1994). Nowadays, the anaerobic technology has a very
wide application in the field of anaerobic digestion whether for liquid or biosolid
waste. High rate anaerobic treatment for industrial wastewater was first applied on
commercial scale in the sugar industry in the mid 70’s. Since that time the technology
has developed into a standard method of wastewater treatment for a wide variety of
industries. High rate anaerobic treatment for industrial wastewater was first applied on
commercial scale in the sugar industry in the mid 70’s. Since that time the technology
has developed into a standard method of wastewater treatment for a wide variety of
industries.
The technology is functional in over 65 countries and a total of approx. 1400 plants
were built by the 16 leading vendors of such systems, 65% of the total number of these
plants for industrial application. There are (in 1999) approx. 125 full scale anaerobic
treatment plants in Germany for industrial wastewaters, 49 plants are working with a
contact process, 38 with sludge blanket reactors UASB, 33 with fixed-film methane
reactors, and the other 11 plants have completely stirred tank reactor, self-made
construction, hybrid reactors, or the reactor type is not named (Haun, Meyer, Seyfried,
and Rosenwinkel, 1999). ISAH institute has been involved in the research, design, or
operation of 26 of these plants. The experiences were made with all types of reactor
systems treating different types of industrial wastewaters. ISAH also is participating
on several specialist groups of VDI (VDI-4630, 2003) and ATV (ATV-DVWK-IG 5.1,
2004) as well as publishing a lot of papers in that field last years. The main subject of
this paper will be the development and description of operation and plant’s
performance monitoring guidelines for the anaerobic treatment plants as a pre-
treatment for industrial wastewater. Also it includes the results of a case study of
compliance and application of these guidelines in the food industry sector.
STATEMENT OF THE PROBLEM
Through the evaluation of operation and monitoring problems of anaerobic industrial
wastewater plants in the past experience of ISAH and Cairo University whether in
germany or in Egypt, it is found that most of these problems may be due to insufficient
design quality, resulted from using of incorrect or roughly assumed parameter values
in the initial design. Then, it was very obvious that the decision of design papmeters
must be considered as a part of the operation and monitoring of the process. Therefore,
a complete step by step operation and monitoring manuals including all of basic
measurements and their frequencies must be implemented to gurantee the achievment
of the plant peformance. ISAH, HBRC, and Cairo University have a lot of experiences
in the agro-based industry by participating in solving of operation and monitoring
problems in different factories in Germany as well as in Egypt, where the most popular

Twelfth International Water Technology Conference, IWTC12 2008 Alexandria, Egypt
3
problem was insufficent pollutants removal effeciencies by the anaerobic reactors, also
in sometimes a complete failure in the process and non-compliance to the designed
effeciencies and allowed regulations.
MATERIALS AND METHODS
The applied methodology was depending on discussing and defining the main phases
controlling the anaerobic process, starting from design phase to the operation phase
passes during start-up phase. Therefore the methodology could be summarized in the
following main phases:
Pre-design Phase
This phase helped to give an expectation of the design parameters of the anaerobic
UASB plants, two types of experiments were done: a) Triphenyltetrazoliumchloride
TTC-test was used for determination of biochemical activity of sludge as anaerobic
inoculum and characterization of the effect of wastewater compounds on the
dehydrogenase activity of sludge; b) Anaerobic Batch Test (ABT) was used for
determination of anaerobic bio-degradability of wastewater as well as determination of
design parameters of sludge loading rate, hydraulic retention time, organic loading
rate, temperature effect, as well as an expectation of treatment efficiency and biogas
quantity and quality. The pre-design phase can be divided into:
TTC-Test:
The sludge is considered one of the most important issues governing the performance
and efficiency of the anaerobic process in the reactor, therefore, the bio-activity of the
sludge is very important to be measured as well as the inhibition effect of the
wastewater on the sludge activity must be evaluated. Determination of the biochemical
activity of sludge (granular and digested) by means of the dehydrogenase activity
using 2, 3, 5-Triphenytetrazoliumchloride (TTC) had performed as a rapid pre-step test
enables:
1) The determination of the biochemical activity (AS) of the sludge in terms of the µg
triphenylformazane (TPF) per mg of the dry sludge mass.
2) The characterization of the effect of wastewater and wastewater compounds on
sludge (stimulation or inhibition of the dehydrogenase activity DHA in
percentage).
Anaerobic Batch Test (ABT):
In this study, the anaerobic batch tests are performed according to the guidelines of
(VDI-4630, 2004), (DWA-IG 5.1, 2004) and (EN ISO 11734, 1998) and were used as
a lab scale simple, low cost method to determine the biodegradation of industrial
wastewater produced from agro-based food industry inoculated with granular sludge at
different hydraulic retention times and different organic/volumetric and sludge loading
rates, incubated at temperature 37°C as a potential to predict and decide: the applicable
sludge loading rate; the best hydraulic retention time; sludge methanogenic activity;
and the specific biogas production during the operation of the UASB reactor under the

Twelfth International Water Technology Conference, IWTC12 2008 Alexandria, Egypt
4
mesophilic temperature conditions. ABT was performed in 500 ml glass bottles sealed
by silicon stoppers. Samples of raw and pre-settled wastewaters were inoculated with
anaerobic granular sludge with different initial Sludge Loading Rates (SLR) of 0.2,
0.3, and 0.5 g COD substrate/g VS sludge.
Reference substrate: Sodium-acetate (CH3COONa) as a reference substrate (with
good anaerobic biodegradation) was prepared in the laboratory with a COD-value near
to those of the wastewaters to be used for the results’ comparison.
Incubation: All samples were incubated at 37°C in shaking water bath provided with
thermostat to control the temperature or in water bath provided with a magnetic stick
connected to control device and stirrer had put inside the bottles for mixing between
substrate and sludge to guarantee a good contact between them during the test time,
Figure 1.
Figure 1: Incubation method used in the ABTs
Analyses and measurements:
Pressure inside bottles was measured during incubation according to the planed time
intervals using digital pressure gauge provided by needle to penetrate through the
silicon stopper of the bottles.
The analyses and measurements for the anaerobic batch tests can be classified as
shown in Table 1.

Twelfth International Water Technology Conference, IWTC12 2008 Alexandria, Egypt
5
Table 1: Analyses and measurements for the anaerobic batch test
Wastewater Acetate SludgeSubstrate/sludge
mixtureBiogas
Analysis Unit
CODtotal mg/l x x x x / xxx
CODfiltered mg/l x x x / xxx
CODss* mg/l x x / xxx
VFA mg/l x x x x / xxx
pH ─ x x x x / xxx
TSS mg/l x
VSS mg/l x
TS g/l x x / xxx
VS g/l x x / xxx
Pressure Bar xx
GC-test (CH4,
CO2, H2S) % xxx
* Calculated value = CODtotal - CODfiltered
Bef
ore
the
test
(x)
Dur
ing
the
test
(xx)
At e
nd o
f the
test
(xxx
)
Start-up Phase
- Preparation before start-up
Before start-up phase of the anaerobic plant, the entire plant must be checked and
inspected and all mechanical equipment should be tested and proven to be operational
(dry run), also all instruments must be checked and calibrated.
- Initial start-up
The start-up procedure of the anaerobic plant “UASB reactor” is done using gradually
increasing sludge loading rate by controlling the discharge of the inflow wastewater.
At the beginning before the wastewater introduced to the bottom of the reactor, the
required seed sludge volume is seeded to the reactor and whole reactor volume is filled
with clean water and the temperature is adjusted to the norm temperature. The clean
water was circulated for two days without any addition of wastewater to re-activate the
seeding sludge as well as remove any residual COD in the sludge. Starting from the
third day, 10% of design wastewater discharge is introduced daily to the bottom of
reactor and all of the measurements for influent and effluent wastewaters and gas
quantity and quality were done. The up-flow velocity during start-up is adjusted to 0.5-
0.6 m/hr. Monitoring sheets were designed for recording the measurements as well as
for the necessary calculation. Based on results stability of COD removal efficiencies
and controlling the values of volatile fatty acids and pH in the reactor as an indication
for good microbiological performance of the process, the start of steady state period is
decided. Table 2 shows the recommended measured and calculated parameters during
start-up phase.

Twelfth International Water Technology Conference, IWTC12 2008 Alexandria, Egypt
6
Table 2: Recommended measured and calculated parameters during start-up phase
2-a) Measured parameters
pH COD TSS VSS VFA TN TP T
Unit ─ mg/L mg/L mg/L mg/L mg/L mg/L °C
Fequency daily daily daily daily daily 3/week 3/week daily
pH COD TSS VSS VFA TN TP T
Unit ─ mg/L mg/L mg/L mg/L mg/L mg/L °C
Fequency daily daily daily daily daily 3/week 3/week daily
Volume Volume TS VS
Unit L L g/L g/L
Fequency daily 2/week 2/week 2/week
SludgeBiogas
Effluent wastewater parameters
Parameter
Influent wastewater parameters
Parameter
GC
% CH4/ CO2
3/week
Parameter
2-b) Calculated parameters
Removal
COD
(CODrem)
Removal
VFA
Removal
TSS
Removal
VSS
Removal
N
Removal
PCH4
Specific CH4
production
Sludge
Loading Rate
(SLR)
Specific
methanogenic
activity (SMA)
Unit % % % % % % L/d L CH4/g CODrem g COD/g VS.d g CH4-COD/g VS.d
Fequency daily daily daily daily daily 3/week daily daily 2/week 2/week
Parameter
For wastewater For Biogas For Sludge
Operation/ Process performance monitoring phase
After the start-up period, when the reactor had a stable COD effluent characteristics
and steady COD removal efficiencies within fixed range, it was considered as the
“steady state” operation. The UASB reactor is run at steady state operation; the
process performance parameters were measured, monitored and evaluated.
Sampling:
Wastewater sampling of the influent and effluent of the wastewater is made and
collected the daily effluent from the reactor. Composite samples for 24 of the influent
and effluent of the reactor are collected for analysis.
Sludge Composite samples of sludge in the reactor as well as samples along the reactor
height are collected for analysis of volatile suspended solids as an indication of sludge
bio-activity.
Analyses and measurements:
The analyses and measurements during the steady state operation of UASB plant can
be classified as shown in Table 3, where Excel spreadsheets are prepared to record the
measurements as well as automatic calculations of the process parameters such as
COD, TSS, BOD, TP, TN removal efficiencies as well as gas quantity and quality
inclusive the specific gas production, excess sludge volume and characteristics and
specific methanogenic activity.

Twelfth International Water Technology Conference, IWTC12 2008 Alexandria, Egypt
7
Table 3: Recommended measurements during operation phase of UASB plant
and their frequency
Influent Effluent Initial seed Excess
Temperature T °C direct x x x x ─ daily
pH ─ ─ direct x x x x ─ daily
Total COD CODt mg/L direct x x ─ x ─ daily
Paper-Filtered(1)
COD CODpf mg/L direct x x ─ x ─ daily
Membrane-Filtered(2)
COD CODmf (CODsol) mg/L direct x x ─ ─ ─ 3/week
Suspended COD CODss mg/L CODt-CODpf x x ─ ─ ─ daily
Colloidal COD CODcol mg/L CODpf-CODmf x x ─ ─ ─ 3/week
Volatile Fatty Acids VFA mg/L direct x x ─ ─ ─ daily
Volume of biogas Vbiogas L direct ─ ─ ─ ─ x daily
Total suspended Solids TSS mg/L direct x x ─ ─ ─ 3/week
Volatile Suspended Solids VSS mg/L direct x x ─ ─ ─ 3/week
BOD5 BOD mg/L direct x x ─ ─ ─ 2/week
Total Nitrogen TN mg/L direct x x ─ ─ ─ 3/week
Nitrogen- NO3 NO3-N mg/L direct x x ─ ─ ─ 3/week
Nitrogen-NH4 NH4-N mg/L direct x x ─ ─ ─ 3/week
Total Phosphor TP mg/L direct x x ─ ─ ─ 3/week
Sludge Volume Vslg L direct ─ ─ x x ─ 3/week
Sludge composition VS, TS g/L direct ─ ─ x x ─ 1/week
Gas Composition (CH4, CO2, H2S) GC % direct ─ ─ ─ ─ x 1/week
(1) Folded paper filter 4.4 µm
(2) Membrane filter 0.45 µm
AbbreviationMeasured parameterMeasurement
Frequency
Wastewater SludgeCalculationunit Biogas
For this study, two production facilities represent the agro-industry were selected one
from Egypt and the other from Germany (Table 4). Composite samples from the
different departments and the final effluents were collected. Physicochemical analyses
were carried out according to the APHA (1998). Laboratory experiments have been
carried out to assess wastewater characteristics in both.
Table 4: Basic Information about the Selected Factories
Item Case Study 1 from Egypt Case Study 2 from Germany
Main Products Fructose 55% 75,000 t/y,
Fructose 42% 25,000 t/y
Glucose 30,000 t/y.
Milk-Snacks (Corn-flakes, Pop
Corn,………etc)
Main Raw Materials Maize 130,000 t/y, Acid,
NaOH, Activated Carbon,
Enzymes, Ion Exchange
Resins, Ammonia, Sulfur.
Corn, Milk, fats, Chocolates,
Ion Exchange resins, Acids,
Enzymes.
No. of Employee 400 300
Working shifts 3 3
Wastewater discharge m3/d 2400 -3000 240 - 400

Twelfth International Water Technology Conference, IWTC12 2008 Alexandria, Egypt
8
Each facility has a wastewater treatment facility to comply with the environmental
regulations. It is worth to mention that the main objective is to apply the proposed
methodology for a successful start up for the anaerobic reactor aiming at standardization
of the proposed procedure as a universal approach applicable in both developed and
developing countries. The following paragraphs illustrate the wastewater characteristics
and the main components of the existing wastewater treatment plant WWTP.
CASE 1: AGRO-INDUSTRY FROM EGYPT Wastewater Characteristics
COD: 8000 g/m3 BOD: 4800 g/m
3
TSS: 600 g/m3 TDS: 7000 g/m
3
Organic DS: 4400 g/m3 TKN: 120 g/m
3
NH3: 75 g/m3 TP: 10 g/m
3
WWTP Description
The influent wastewater is directed to the equalization basins. The execution and
operation of the equalization basin allows a very efficient pH buffering, pH-control and
pre-acidification. Nutrients (N & P) are added in this equalization basin. In this basin a
partly acidification of the carbohydrates takes place. At the same time the pH is
controlled by a combined action of the effluent recycle flow, which recycles
(bicarbonate)-buffering capacity on one hand. On the other hand, a further pH
correction is possible with the addition of the NaOH or HCl if the pH value deviates too
much from its set point. The conditioned and mixed flow is pumped to the anaerobic
reactor.
The anaerobic reactor is an Up-flow Anaerobic Sludge Blanket reactor (UASB). In this
UASB reactor, the influent is first distributed equally all over the bottom of the reactor,
and then the wastewater rises through an expanded bed of anaerobic active sludge and a
gas collection device at the top which results initially in a separation of the mixed liquor
into biogas on one hand and a mixture of wastewater and sludge. On the other hand, the
biogas is deflected and captured into the concrete gas domes. The effluent of the
anaerobic reactor is partially recycled to the equalization basin. This is made to assure a
minimum level in the equalization basin, to feed the UASB reactor at a constant flow
rate, and to minimize consumption of chemicals. The effluent of the anaerobic treatment
is then directed to the aerobic post treatment.
The aerobic post-treatment is provided with a selector. In the selector, the effluent from
the anaerobic treatment is mixed with the recycled sludge from the clarifier. The aim of
the selector is to generate a good quality of sludge. A high substrate concentration
combined with a high substrate bio-sorption to the sludge improves the formation of
heavy flocs and reduces the growth of filamentous organisms. The selector is highly
aerated with a submerged aeration system to prevent that the redox potential wastewater

Twelfth International Water Technology Conference, IWTC12 2008 Alexandria, Egypt
9
would be too low before entering the aerobic post-treatment. The aeration basin is
aerated with a surface aerator.
The effluent of the aeration basin flows by gravity to a clarifier, where the wastewater is
separated in final effluent and a settling mixture of treated wastewater and sludge. The
sludge is largely recirculated to the selector. The excess sludge is dewatered with a
centrifuge. The dewatered sludge is then transported by trucks to the existing city dump-
site; Figure 2 illustrates the process flow diagram.
Figure 2: Process flow diagram (Egyptian case study).
CASE 2: AGRO-INDUSTRY FROM GERMANY
Wastewater Characteristics COD (hom): 9200 NO3-N: 6.5 g/m
3
COD (filt): 7843 g/m3 TN: 22.5 g/m
3
BOD: 6305 g/m3 SO4-S: 223 g/m
3
NH4-N: 17.9 g/m3 TP: 10.7 g/m
3
Temp.: 25.3 °C TP: 10.7 g/m3

Twelfth International Water Technology Conference, IWTC12 2008 Alexandria, Egypt
10
WWTP Description
The influent wastewater is directed to the hydrolysis tank (522 m3) has retention time
of 2 days the hydrolysis tank also plays as an equalizing tank. The execution and
operation of the hydrolysis allows a very efficient pH buffering, pH-control and pre-
acidification. In this tank a partly acidification of the carbohydrates takes place. pH
correction is possible with the addition of the NaOH or HCl if the pH value deviates
too much from its set point. The conditioned and mixed flow is pumped to the
anaerobic reactor. Figure 3 illustrates the process flow diagram.
Hydrolysis V = 522 m³ HRT = 2 d
UASB1 V = 196 m³
UASB2 V = 196 m³
½ Q
½ Q
Post aerobic treatment (SBR)
V = 158 m³
Recirculation
Recirculation
Influent (Q)
Gas Storage V = 951 m³
Q = 750 m³/d Dosing station
Figure 3: Process flow diagram (German case study)
The plant consists of two anaerobic reactors of UASB. In these UASB reactors, the
influent is first distributed equally all over the bottom of the reactor, and then the
wastewater rises through an expanded bed of anaerobic active pellets sludge initially
collected from similar working reactor for seeding the plant; this sludge has a SMA of
0.8-1.3 g CH4-COD/g VSS.d. Three phase separator is used to separate the biogas
from treated wastewater and solids. The biogas is deflected and captured into the gas
storage tank (950 m3) as a potential to be used in energy generation. The effluent of
the anaerobic UASB reactors is partially recycled again to the influent of the reactor to
make a dilution for the incoming wastewater as well as to keep constant suitable up-
flow velocity around 1 m/h for a good mixing between wastewater and the sludge
blanket. Also this is made to assure to minimize consumption of chemicals. The
effluent of the anaerobic treatment is then directed to the aerobic post treatment by
means of SBR (158 m3).
Twelfth International Water Technology Conference, IWTC12 2008 Alexandria, Egypt
11
RESULTS AND DISCUSSION
Case Study 1: Agro-Industry from Egypt
During the study the quality and quantity of the sludge added to the UASB reactor as
well as anaerobic biodegradability of wastewater was investigated. Several samples
from wastewater and sludge were taken and sampled. The following paragraphs will
explain the results obtained following the proposed methodology mentioned above.
Biodegradability of Influent Wastewater
The assessment of level of influent wastewater biodegradability based on the COD, a
composite sample was taken and fed to anaerobic sludge having a Specific
Methanogenic Activity SMA of 1 gm CH4-COD/gm VSS.d The anaerobic sludge was
obtained from a running full scale UASB reactor at a sugar factory. The mixture was
incubated at 35C and the produced biogas was collected measured. The composite
wastewater sample has the following characteristics: COD total, 9400 mg/l; COD
soluble, 9330 mg/l; and TKN, 144 mg/l. The measured accumulated biogas was
2400 ml with a CH4 concentration of 63%. The batch test proved the anaerobic
biodegradability of the influent wastewater. About 65% of the influent COD was
transformed into biogas without acclimatized anaerobic sludge. No inhibitors were
observed during the test.
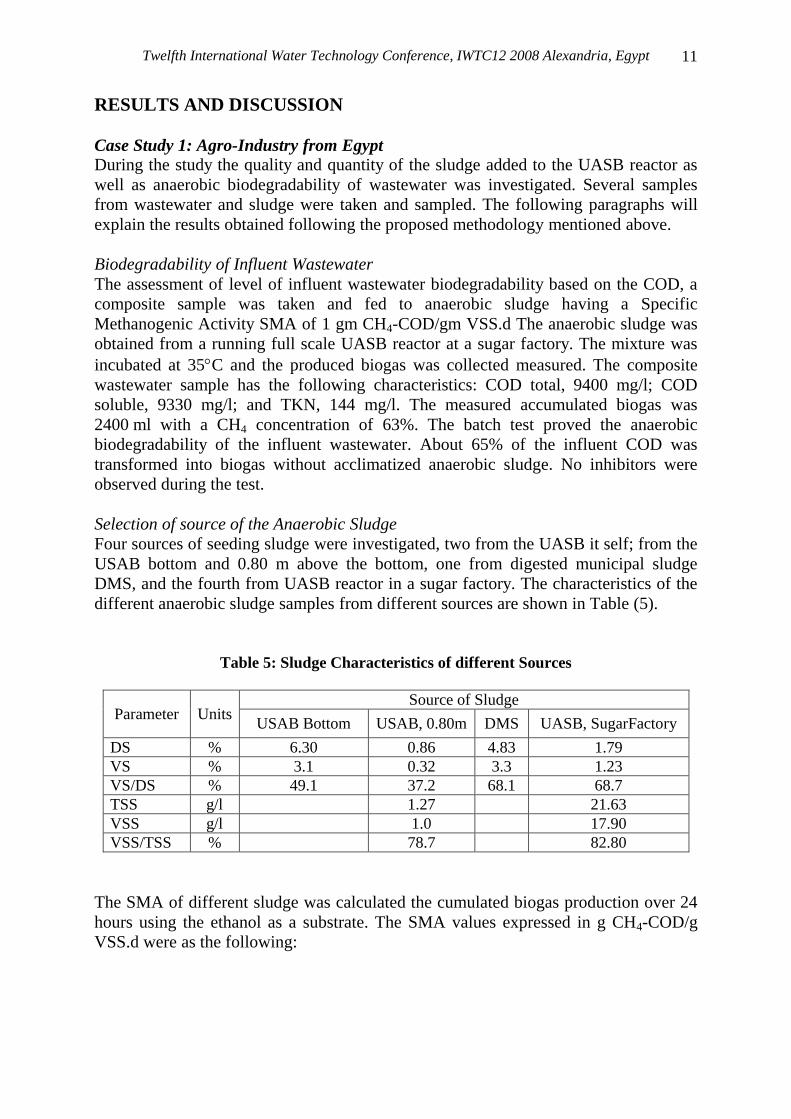
Selection of source of the Anaerobic Sludge
Four sources of seeding sludge were investigated, two from the UASB it self; from the
USAB bottom and 0.80 m above the bottom, one from digested municipal sludge
DMS, and the fourth from UASB reactor in a sugar factory. The characteristics of the
different anaerobic sludge samples from different sources are shown in Table (5).
Table 5: Sludge Characteristics of different Sources
Parameter Units Source of Sludge
USAB Bottom USAB, 0.80m DMS UASB, SugarFactory
DS % 6.30 0.86 4.83 1.79
VS % 3.1 0.32 3.3 1.23
VS/DS % 49.1 37.2 68.1 68.7
TSS g/l 1.27 21.63
VSS g/l 1.0 17.90
VSS/TSS % 78.7 82.80
The SMA of different sludge was calculated the cumulated biogas production over 24
hours using the ethanol as a substrate. The SMA values expressed in g CH4-COD/g
VSS.d were as the following:

Twelfth International Water Technology Conference, IWTC12 2008 Alexandria, Egypt
12
USAB Bottom USAB, 0.80m DMS UASB, Sugar
Factory
0.02 0.1 0.1 0.015
It is clear that all investigated sources of sludge have a poor SMA. However, the SVI
of sludge from sugar factory will be checked to ensure the settlability of such sludge.
Sludge Volume Index SVI
The pattern of SVI and SVI30 of the anaerobic sludge against time as well as the total
anaerobic sludge in the reactor at 0.80 sampling point was investigated. It was
observed that SVI is ranged from 57 to 150 ml/gm, while the amount of anaerobic
sludge for the USAB was ranged between 2000 to 4000 kg VSS.
Case Study 2: Agro-Industry from Germany
During the study the characteristics of influent and effluent wastewater from of
hydrolysis tank as well as of UASB reactors were observed. Also anaerobic
biodegradability of wastewater was investigated as a pre-step to decide the most
applicable sludge loading rate leads to best biodegradability. Several samples from
sludge were taken for evaluation of sludge methanogenic activity. The following
paragraphs will explain the results obtained following the proposed methodology
mentioned above.
Biodegradability of Influent Wastewater (ABTs)
A composite sample was taken and fed to two different anaerobic sludges having a TS
of 138 and VS of 113.2 (Pellets sludge S1) and TS 78 and VS of 57 g/L (Granulated
sludge S2) with different sludge loading rates of 0.15 – 0.30 kg COD/kg VS.d The
anaerobic sludge was obtained from a running full scale UASB reactor at Alcohol
company. The mixture was incubated at 35C± °C and the produced biogas volume
was calculated by measuring the pressure. The composite wastewater sample has the
following characteristics: COD filt, 7400 mg/l; pH 7.30. The ABTs proved the
anaerobic biodegradability of the influent wastewater with 1.128 kg COD/kg VS.d
during incubation duration of 3 hrs. Figure 4 shows the biodegradability results along
incubation duration for different sludge loading rates (SLRs). No inhibitors were
observed during the test.

Twelfth International Water Technology Conference, IWTC12 2008 Alexandria, Egypt
13
0.000
0.200
0.400
0.600
0.800
1.000
1.200
0.0 0.5 1.0 1.5 2.0 2.5 3.0 3.5
Incubation time [h]
Bio
de
gra
da
tio
n [
kg
CO
D/(
kg
VS
*d)]
MA1 MA2 MM1 MM2 KA
KM1 KM2
KA: Acetate + S1 (SLR 0.299)
KM1: WW + S1 (SLR 0.299) KM2: WW + S1 (SLR 0.0.31)
MA1: Acetate + S2 (SLR 0.297) MA1: Acetate + S2 (SLR 0.15)
MM1: WW + S2 (SLR 0.295) MM2: WW + S2 (SLR 0.148)
Figure 4: Wastewater biodegradability along incubation time at different SLRs
Observed wastewater characteristics and treatment efficiencies among different
stages:
Hydrolysis:
Figure 5 shows the influent flow rate and influent CODhom, the hydrolysis and
acidification rate was 40-60 % in the hydrolysis stage.
UASB reactors:
Also, Figure 6 shows the elimination and biodegradation COD in the UASB reactor
where the elimination (degradation) rate was ranged between 85.4- 86.4 % of the total
COD. The volumatric loading rate was with average value of 7.5 kg COD/m3.d. the
temperature inside UASB was kept at average of ca. 34°C and pH value was 7.2 in
average. During the operation, the average hydraulic retention time was 40 h. the up-
flow velocity was obseved as 0.8-1.0 m/h along operation period. The biomass bio-
activity was average at 0.50 kg COD/ kg VS.d. The Methan content was 79 % of the
total biogas concentration and specific gas production of 315 L/kg CODrem.

Twelfth International Water Technology Conference, IWTC12 2008 Alexandria, Egypt
14
Figure 5: Influent flow rate and influent CODhom
Figure 6: COD degradation in UASB reactor (Kg/d)
CONCLUSION AND RECOMMENDATIONS
For Case Study 1
Based on the implemented batch tests and the monitored performance of the UASB
reactor it is recommended to follow the following actions to achieve successful start
up:
Twelfth International Water Technology Conference, IWTC12 2008 Alexandria, Egypt
15
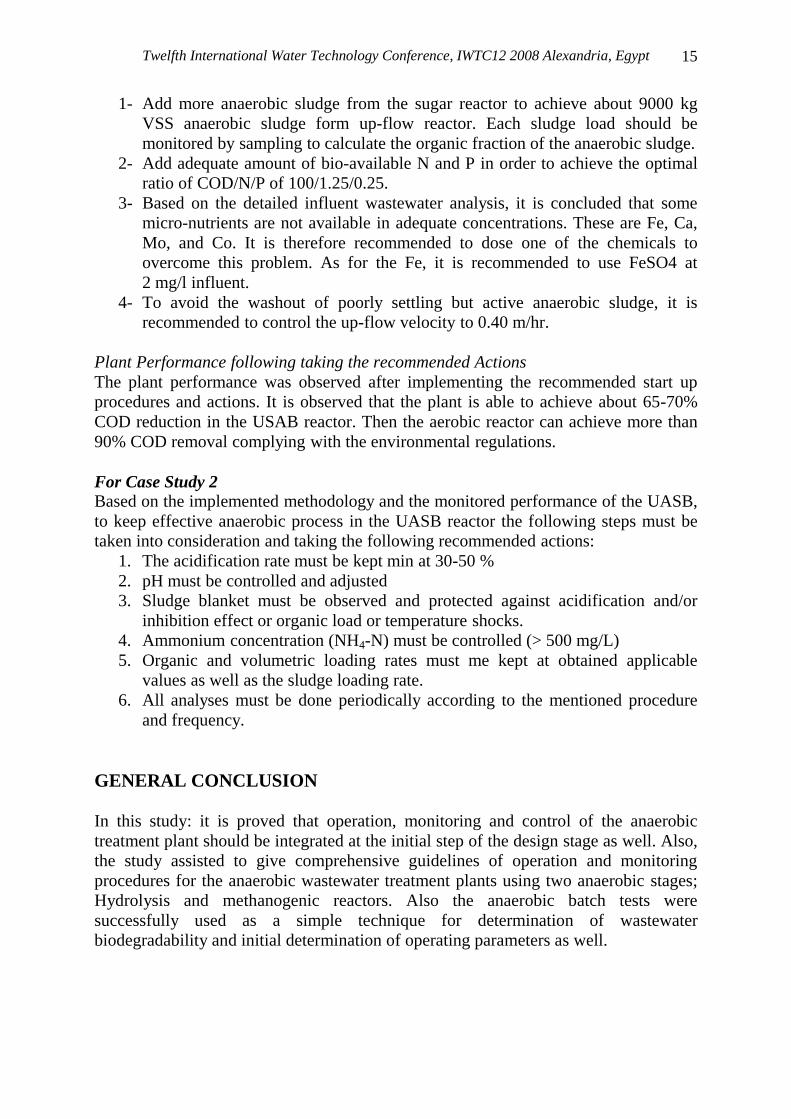
1- Add more anaerobic sludge from the sugar reactor to achieve about 9000 kg
VSS anaerobic sludge form up-flow reactor. Each sludge load should be
monitored by sampling to calculate the organic fraction of the anaerobic sludge.
2- Add adequate amount of bio-available N and P in order to achieve the optimal
ratio of COD/N/P of 100/1.25/0.25.
3- Based on the detailed influent wastewater analysis, it is concluded that some
micro-nutrients are not available in adequate concentrations. These are Fe, Ca,
Mo, and Co. It is therefore recommended to dose one of the chemicals to
overcome this problem. As for the Fe, it is recommended to use FeSO4 at
2 mg/l influent.
4- To avoid the washout of poorly settling but active anaerobic sludge, it is
recommended to control the up-flow velocity to 0.40 m/hr.
Plant Performance following taking the recommended Actions
The plant performance was observed after implementing the recommended start up
procedures and actions. It is observed that the plant is able to achieve about 65-70%
COD reduction in the USAB reactor. Then the aerobic reactor can achieve more than
90% COD removal complying with the environmental regulations.
For Case Study 2
Based on the implemented methodology and the monitored performance of the UASB,
to keep effective anaerobic process in the UASB reactor the following steps must be
taken into consideration and taking the following recommended actions:
1. The acidification rate must be kept min at 30-50 %
2. pH must be controlled and adjusted
3. Sludge blanket must be observed and protected against acidification and/or
inhibition effect or organic load or temperature shocks.
4. Ammonium concentration (NH4-N) must be controlled (> 500 mg/L)
5. Organic and volumetric loading rates must me kept at obtained applicable
values as well as the sludge loading rate.
6. All analyses must be done periodically according to the mentioned procedure
and frequency.
GENERAL CONCLUSION
In this study: it is proved that operation, monitoring and control of the anaerobic
treatment plant should be integrated at the initial step of the design stage as well. Also,
the study assisted to give comprehensive guidelines of operation and monitoring
procedures for the anaerobic wastewater treatment plants using two anaerobic stages;
Hydrolysis and methanogenic reactors. Also the anaerobic batch tests were
successfully used as a simple technique for determination of wastewater
biodegradability and initial determination of operating parameters as well.

Twelfth International Water Technology Conference, IWTC12 2008 Alexandria, Egypt
16
REFERENCES
APHA, A., AWWA, and WEF (1981). “Glossary: Water and Wastewater Control
Engineering.”
ATV, D. D. I. (2004). "Anaerobe Testverfahren zu Abbaubarkeit, Hemmung und
Aktivität" 5. Arbeitbericht der Arbeitsgruppe. (Anaerobe Verfahren zur
Behandlung von Industriewässern), German Association for water, wastewater and
waste, Germany.
ATV-DWVK, M. (2002). Aufbereitung und Verwendung von Biogasen.
Bischofsberger, W., Dichtl, N., Rosenwinkel, K.H., Seyfried, C.F., Boehnke, B.
(2004). Anaerobtechnik, Springer Verlag.
Hobson, P. N. et al. (1981). Methane production from Agricultural and domestic
wastes, Applied Science publishers Ltd, London, UK.
Haun, et al. (1999). “Full scale experience with anaerobic aerobic treatment plants
in the food and beverage industry.” Wat. Sci. Technol. 40(1): 305-312.
ISO 11734, I. S. (1995; 1998). Water quality-evaluation of the ultimate anaerobic
biodegradability of organic compounds in digested sludge-method by
measurement of the biogas production.
IWA, A. a. J.-E. (2002). Some factors that influence the biodegradability test
results. Workshop on Harmionisation of anaerobic biodegradation, activity and
inhibition assays., European Commission, Joit Research Center, Institute for
environment and sustainability, Italy.
IWA-ADM1 (2002). Anaerobic Digestion Model No. 1, IWA Task Group for
mathematical modelling of anaerobic digestion processes, IWA Scientific and
Technical report series, report no. 13.
Jim Field (2002). http://www.uasb.org./ internet website for upflow anaerobic
sludge blanket reactor. Visited April 2004.
Speece, R. E. (1983). “Anaerobic biotechnology for industrial waste treatment.”
Environ. Sci. Tech. 17: 416A-427A.
Speece, R. E. (1996). Anaerobic biotechnology for industrial wastewaters, 2nd
ed.
Archae Press. Nashville, USA.
Monroy, O. (1995). “Anaerobic aerobic treatment of cheese wastewater with
national technology in Mexico, the Case of El Sauz.” Wat. Sci Tech. 32(12): 149-
156.