development of web-based gis applications for decision support and situational awareness
TRANSCRIPT

6A.1 DEVELOPMENT OF WEB-BASED GIS APPLICATIONS FOR DECISION SUPPORT AND SITUATIONAL AWARENESS
Brian P. Walawender * **
National Weather Service Central Region HQ, Kansas City, MO
Matt W. Davis National Weather Service, La Crosse, WI
1. INTRODUCTION* ** The advent of client-side web mapping technologies (e.g., OpenLayers, Google MapsTM, Bing Maps™) has provided platforms for creating easy-to-use GIS “mashup” displays. GIS mashups are web pages or applications that combine data or functionality from two or more external sources to create a new service. In August 2008, the National Weather Service Central Region Headquarters (CRH) created a test bed for developing web-based GIS applications, using the OpenGeo® Stack (http://opengeo.org/publications/opengeo-architecture/). These applications primarily focused on visualizing meteorological and hydrological data for decision support and situational awareness. Some of applications developed and the lessons learned from this test bed will be highlighted in this presentation. 2. CRH TEST BED 2.1 System Configuration The CRH test bed is composed of three components: a database server, a backend server and a web server, all Linux-based systems. The database server runs PostgresSQL and PostGIS (http://postgis.refractions.net). The backend server handles data ingest and runs Unidata Local Data Manager, several Java decoders and Geospatial Data Abstraction Library (GDAL)
* Corresponding author address: Brian P. Walawender, National Weather Service Central Region Headquarters, 7220 NW 101st Terrace, Kansas City, MO 64153; email:[email protected].
** "The views expressed are those of the authors and do not necessarily represent those of the National Weather Service."
(http://www.gdal.org/) for raster creation and manipulation. The web server runs Apache for web services and Geoserver (http://geoserver.org/) for web map service (WMS) image generation. The database uses the Iris Framework for its data storage model. The Iris Framework is a relational geodatabase, which stores data in its most atomic parts. Data stored in the database include both point and polygon data. Examples of the point data sources include storm reports and precipitation observations. Polygon data sources include warning polygons and county boundaries. The web mashup applications were developed using PHP and Javascript, along with OpenLayers (http://openlayers.org/) web mapping application programming interface (API). The applications communicate with the database using asynchronous JavaScript and XML (AJAX) to produce an interactive user experience. 2.2 Lessons Learned A web browser approach for content delivery was selected over a desktop client because of the ease of deploying and maintaining applications. Previous situational awareness displays used file-based Keyhole Markup Language (KML) services in Google Earth™, but these displays quickly become sluggish when displaying a large number of features. In addition, the file-based raster graphics that were used did not resample when zoomed, causing a loss in image quality. To eliminate these short comings, WMS was utilized. A WMS server (Geoserver) was used to display both raster (radar and precipitation images) and vector data. The raster data were served from files on disk and vector data were served directly from the PostGIS database. The WMS server only returns the data which are in the view box of the client application instead of the entire dataset. Data are also returned as a transparent image,

which easily be layered. These advantages made WMS the content delivery method of choice. OpenLayers was selected as the web mapping API the because of its flexibility. OpenLayers separates the API from the underlying base layer data. This allows the programmer to select base layer data from a number of sources (Google™, Bing™, or OpenStreetMap) without having to convert the application another mapping API. OpenLayers also supports a wide arrangement of Open Geospatial Consortium (OGC) formats. 3. WEB APPLICATIONS Some of the web applications that were developed are presented in this section. Several of these applications are currently being used internally by both the Central Region Headquarters Regional Operations Center (CRHROC) and by Central Region Weather Forecast Offices. All of these applications use
an interactive mapping interface where the user can zoom, switch base layers, toggle layers off and on, and add political boundary maps to create a custom display. 3.1 Verification Assistance The Verification Assistance application was created to automate a technique developed by Keith Stellman, a warning coordination meteorologist at the National Weather Service office in Shreveport, Louisiana. His technique used Google Earth™ to find additional public places to contact for storm reports and was shown to improve verification scores. The Verification Assistance application takes a user-selected polygon and then searches for user-defined public places within the warning polygon using the Google Local Search™ API. The application filters the results to locations within the warning polygon. The user can then click on the displayed public places to display contact information. A screenshot of the application can be seen in Figure 1.
Figure 1 – A screenshot of the Verification Assistance application showing gas stations in the path of a severe thunderstorm. 3.3 Active Flooding The Active Flooding application displays the threat level for Advanced Hydrologic Prediction Service (AHPS) basins on an interactive map. The application is designed to give a rough
approximation of the areal coverage of flooding. The user can view both the current observed and the forecasted river stages along with the hydrograph for any of the basins displayed. This application has been used for standup briefings

during major flood events. A screenshot of the application can be seen in Figure 2.
Figure 2 – A screenshot of the Active Flooding application showing a flooding event in the Lower Mississippi Valley. 3.4 Convective Situational Awareness The Convective Situational Awareness application displays active convective based watches and warnings, radar data and recent storm reports. The user can query any of the displayed hazards and storm reports to get more detailed information by clicking on them. This application was designed to provide increased
situational awareness during convective events by allowing the user to quickly ascertain what watches and warning are currently in effect across the area. Storm reports from the last three hours are also displayed, which helps show strength trends when combined with the radar layer. A screenshot of the application can be found in Figure 3.
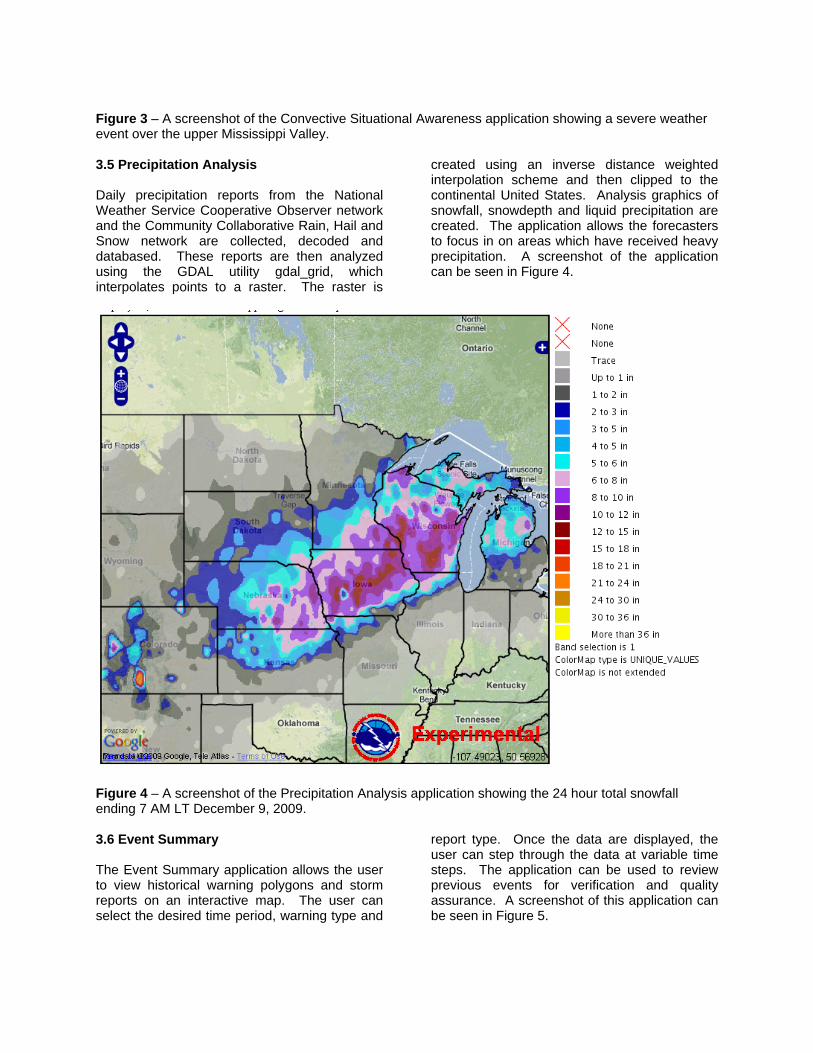
Figure 3 – A screenshot of the Convective Situational Awareness application showing a severe weather event over the upper Mississippi Valley. 3.5 Precipitation Analysis Daily precipitation reports from the National Weather Service Cooperative Observer network and the Community Collaborative Rain, Hail and Snow network are collected, decoded and databased. These reports are then analyzed using the GDAL utility gdal_grid, which interpolates points to a raster. The raster is
created using an inverse distance weighted interpolation scheme and then clipped to the continental United States. Analysis graphics of snowfall, snowdepth and liquid precipitation are created. The application allows the forecasters to focus in on areas which have received heavy precipitation. A screenshot of the application can be seen in Figure 4.
Figure 4 – A screenshot of the Precipitation Analysis application showing the 24 hour total snowfall ending 7 AM LT December 9, 2009. 3.6 Event Summary The Event Summary application allows the user to view historical warning polygons and storm reports on an interactive map. The user can select the desired time period, warning type and
report type. Once the data are displayed, the user can step through the data at variable time steps. The application can be used to review previous events for verification and quality assurance. A screenshot of this application can be seen in Figure 5.

Figure 5 – A screenshot of the Event Summary web application showing a tornadic event. 4. CONCLUSIONS Web mashup GIS applications have proven to be very useful in the supporting situational awareness and decision support activities in the CRHROC. These applications allow the user to zoom in on the area of interest and the filter the datasets to create custom displays. No special client software other than a web browser is required to display the mashups. The WMS protocol provided a more flexible solution for displaying raster and vector data than client-based KML services. 5. ACKNOWLEDGEMENTS The authors would like to thank Randy Breeser and Michael Urban of the CRH Web Mapping
team for their development efforts in the OpenGeo Test Bed. We would also like to thank Aaron Sutula, Jason Burks and Darone Jones of the Iris Framework Team for supplying the database schema and product decoders. 6. REFERENCES Stellman, K, 2009: How Geographic Information System Software is Improving the Effectiveness of the National Weather Service. 25th Conf on IIPS, Phoenix, Amer. Meteor. Soc.