dicin paper serie - iza institute of labor economicsftp.iza.org/dp10443.pdf · and how it varied...
TRANSCRIPT

Discussion PaPer series
IZA DP No. 10443
Martin KahanecMartin Guzi
How Immigrants Helped EU Labor Markets to Adjust during the Great Recession
December 2016

Any opinions expressed in this paper are those of the author(s) and not those of IZA. Research published in this series may include views on policy, but IZA takes no institutional policy positions. The IZA research network is committed to the IZA Guiding Principles of Research Integrity.The IZA Institute of Labor Economics is an independent economic research institute that conducts research in labor economics and offers evidence-based policy advice on labor market issues. Supported by the Deutsche Post Foundation, IZA runs the world’s largest network of economists, whose research aims to provide answers to the global labor market challenges of our time. Our key objective is to build bridges between academic research, policymakers and society.IZA Discussion Papers often represent preliminary work and are circulated to encourage discussion. Citation of such a paper should account for its provisional character. A revised version may be available directly from the author.
Schaumburg-Lippe-Straße 5–953113 Bonn, Germany
Phone: +49-228-3894-0Email: [email protected] www.iza.org
IZA – Institute of Labor Economics
Discussion PaPer series
IZA DP No. 10443
How Immigrants Helped EU Labor Markets to Adjust during the Great Recession
December 2016
Martin KahanecCentral European University, University of Economics in Bratislava, CELSI, POP MERIT ‐ UNU and IZA
Martin GuziMasaryk University, IZA and CELSI

AbstrAct
IZA DP No. 10443 December 2016
How Immigrants Helped EU Labor Markets to Adjust during the Great Recession*
The economic literature starting with Borjas (2001) suggests that immigrants are more
flexible than natives in responding to changing sectoral, occupational, and spatial shortages
in the labor market. In this paper, we study the relative responsiveness to labor shortages
by immigrants from various origins, skills and tenure in the country vis-à-vis the natives,
and how it varied over the business cycle during the Great Recession. We show that
immigrants in general have responded to changing labor shortages across EU member
states, occupations and sectors more fluidly than natives. This effect is especially significant
for low-skilled immigrants from the new member states or with the medium number of
years since immigration, as well as with high-skilled immigrants with relatively few (1-5) or
many (11+) years since migration. The relative responsiveness of some immigrant groups
declined during the crisis years (those from Europe outside the EU or with eleven or more
years since migration), whereas other groups of immigrants became particularly fluid
during the Great Recession, such as those from new member states. Our results suggest
immigrants may play an important role in labor adjustment during times of asymmetric
economic shocks, and support the case for well-designed immigration policy and free
movement of workers within the EU. Paper provides new insights into the functioning of
the European Single Market and the roles various immigrant groups play for its stabilization
through labor adjustment during times of uneven economic development across sectors,
occupations, and countries.
JEL Classification: J24, J61, J68
Keywords: immigrant worker, labor supply, skilled migration, labor shortage, wage regression, Great Recession
Corresponding author:Martin KahanecSchool of Public PolicyCentral European UniversityNádor u. 11H-1051 BudapestHungary
E-mail: [email protected]
* Martin Guzi is grateful for the support from the Czech Science Foundation grant no. 15-17810S. Martin
Kahanec acknowledges the financial support of the Eduworks Marie Curie Initial Training Network Project (PITN-
GA-2013-608311) of the European Commission’s 7th Framework Program. This paper reflects the views of the
authors only; the European Commission or any other funding agency or consortium partner cannot be held
responsible for any use that may be made of the information contained therein.

3
1 Introduction
The Great Recession that started in 2008 profoundly affected European economies and labor
markets. Whereas some of them, mainly in the southern peripheries of the EU, suffered from
protracted recessions, others, such as Germany and Slovakia, recovered from a moderate
recession swiftly. The Baltic states on the eastern flanks of the EU dipped into rather severe
recessions in the early stages of the Great Recession, but managed to revitalize their
economies and regain top positions among EU’s fastest growing economies relatively
quickly. Poland, on the other hand, did not record a recession during this time (see Figure A1
in Appendix).
Whereas fluctuations in economic growth impact the situation in the labor market, labor
adjustment affects aggregate GDP dynamics as well. With limited fiscal capacity and no room
for monetary adjustment between the member states of the Euro Area, the role of labor
mobility as a possible vehicle of adjustment to such asymmetric economic shocks became
ever more important (Arpaia et al. 2016). However, the debates surrounding the UK leaving
the EU (Brexit) or the Hungarian anti-refugee referendum of October 2nd, 2016, document,
that many EU citizens perceive labor mobility unfavorably. On that background, it is
important to inform the mobility debate in Europe with hard analysis and data about
immigration’s effects on EU member states’ labor markets.
Some immigrant groups, such as those originating from the member states that joined the EU
in 2004 and 2007 (EU-12) tend to be relatively young and well educated (Kahanec, 2013). As
such, they can be expected to adjust to changing economic conditions more flexibly. On the
other hand, groups of immigrants from outside the EU may face institutional, regulatory, or
socio-economic constraints limiting their adjustment potential. According to Dustmann, Glitz
and Vogel (2010), the net of the role of differences in individual characteristics and region of
residence in Germany and the UK immigrants’ risk of unemployment is more sensitive to the
economic cycle than that of the natives. De la Rica and Polonyankina (2013) document
increased competition for jobs among immigrants during the Great Recession in Spain.
Relative to the natives, immigrants moved into jobs more intensive in manual skills during the
recession years. Kahanec and Zimmermann (2016) provide an account of the effects of post-
enlargement labor mobility on receiving and sending EU member states. They document
various adjustment channels at the EU-wide and national levels, through which post-
enlargement mobility helped to cushion some of the economic shocks during the Great
Recession.

4
In a theoretical model, Borjas (2001) argues that such relative responsiveness of immigrants
to wage differentials can be explained by the fact that for immigrants, the costs of parting with
their homes and jobs are sunk upon arrival to the destination country. For the natives,
however, such costs still affect their migration decision. Lower costs of immigrants' mobility
should then result in a higher responsiveness of immigrants to economic opportunities vis-à-
vis the natives. Several authors confirm this result empirically. Røed and Schøne (2012) show
that the mobility of immigrants between regions in Norway is more responsive to the
differences in average wage levels and unemployment rates. Amuedo-Dorantes and De la
Rica (2010) find that the mobility of immigrants in Spain is more responsive to regional
employment opportunities than the mobility of similarly skilled natives. Borjas (2001) and
Dustmann, Frattini and Preston (2012) empirically confirm that in the US and UK,
respectively, immigrants respond to wage differentials across sectors, and occupations more
fluidly than the natives. Guzi, Kahanec and Kurekova (2015) document this result for the
EU-15.1
In this paper we contribute to this literature by studying whether and how various immigrant
groups in the EU-15 responded to asymmetric economic shocks across sectors, occupations
and states before and during the Great Recession. Specifically, we measure the responsiveness
to labor shortages of immigrants relative to natives building on the approach of Borjas (2001),
Dustmann et al. (2012) and Guzi et al. (2014, 2015); and extend this framework to gauge the
evolution of immigrants’ relative responsiveness over the business cycle. We primarily use
data from the EU Labor Force Survey (EU-LFS) and the EU Statistics on Income and Living
Conditions (EU-SILC). The Member States that joined the EU in 2004, 2007 and 2013 are not
included among the receiving countries in the analysis due to the relatively limited inflow of
immigrants into these countries and the resulting small sample sizes (Kahanec and Zaiceva,
2009).
The study is structured as follows. First, we introduce a theoretical framework to formalize
the location decisions by natives and immigrants. Second, we provide a measure of labor
shortages, and describe the estimation strategy to identify the aggregate responsiveness of
immigrants from different origins in labor shortages, as compared to natives over the business
cycle during the Great Recession. Finally, we discuss and interpret the results and the ensuing
policy implications.
1 EU-15 includes Austria, Belgium, Denmark, Finland, France, Germany, Greece, Ireland, Italy, Luxembourg,
the Netherlands, Portugal, Spain, Sweden and the United Kingdom.

5
2 Theoretical framework
The theoretical framework of this paper is based on the model first presented by Borjas
(2001). The basic intuition underlying the model is that native workers face high costs of
parting with their initial location, networks, and economic and social relationships. The
existing wage differentials between countries are not sufficient to motivate large numbers of
workers to move. In contrast, immigrants, having arrived at their destination only relatively
recently, do not face such costs. For them, these costs of migration are sunk and do not fetter
their migration decision. As a result, the location decisions of immigrant workers should be
more responsive to wage differentials than those of natives.
The model assumes that natives and immigrants are allocated across states (𝐶) and
occupation-industry groups (𝐾). Let 𝑊𝑘𝑐 denote the wage of worker 𝑘 ∈ 𝐾 in country 𝑐 ∈ 𝐶.
We assume that 𝑊𝑘𝑐 is net of any adjustment costs, such as re-qualification costs, which are
fixed and equal for all workers in a given country and occupation-industry group. A worker
moves to a new country or to a new occupation-industry group from their original country
(𝑐0) and occupation-industry group (𝑘0) if
𝑚𝑎𝑥𝑐∈𝐶,𝑘∈𝐾(𝑊𝑘𝑐) − 𝑊𝑘0𝑐0 − 𝐷 > 0 (1)
where 𝐷 stands for the costs of moving between countries, occupations and industries, and,
more specifically, it is assumed to include all pecuniary and non-pecuniary (psychological)
costs of leaving behind the country, occupation, and industry of origin. It is reasonable to
think that for natives, moving costs can be substantial, and so moves occur only when the
incentives (e.g. wage differential) are large. In contrast, for immigrants these costs are sunk
upon arrival and thus assumed to be zero.2 Following this argument, new immigrants can be
expected to be the most responsive to wage differentials among all other immigrant groups,
who are in turn likely to be less fettered by D than the natives. The more time passes from
initial immigration, the more similar the migration decisions of immigrants become compared
2 Immigrants may come to the EU not only for economic reasons, but also as refugees or as relatives or
dependent minors of economic immigrants. The model assumes that immigrants make decision under perfect
information. The costs of migration may be assumed to differ by the country of origin and destination, by
individual skills or other circumstances. Such cost differences could be, for example, due to the distance between
the home and the new language. Still, for the purposes of this paper it suffices to assume this simplified cost
structure. The model could be extended to a more complex cost structure in a straightforward way. Also, the
model could be presented in a dynamic version, with wages and costs as stochastic variables. In this case, the
key relationships would hold in terms of expected present values.

6
to those of natives, due to the gradually increasing attachment to the location and
employment.3
It is clear that as long as 𝐷 > 0, the cost induces friction into labor market adjustment, as
there can be situations where wage differentials persist across countries and occupation-
industry groups without inducing relocation. This can lead to inefficiencies in the allocation
of workers across industries and occupations groups. In principle, capital flows could lead to
the equalization of wage differentials, but with substantial lags and adjustment costs.
2.1 Measuring labor shortages and immigrant-native relative supply
The empirical strategy is adapted from Borjas (2001), Dustmann et al. (2012), and Guzi et al.
(2014, 2015). The two key variables in the model are labor shortage and relative labor supply
of immigrants and natives across countries and occupation-industry groups. Similarly to
Borjas (2001), we estimate labor shortages at the level of occupation-industry-country cells as
the part of wages that remains unexplained after differences in the composition of workers
across cells are netted out. Specifically, for each year t we run a log-wage regression of this
form
𝑊𝑖𝑘𝑐 = 𝑋𝑖𝑘𝑐𝛽 + 𝛾𝑘𝑐 + 휀𝑖𝑘𝑐, (2)
where 𝑊𝑖𝑘𝑐 is the log wage of worker i who belongs to occupation-industry group k in
country c, 𝑋𝑖𝑘𝑐 is a vector of individual characteristics including gender, education, work
experience and work experience squared, and 휀𝑖𝑘𝑐 is the error term.4 We normalize wage and
all variables in vector 𝑋𝑖𝑘𝑐 to have zero means. The vector 𝛾𝑘𝑐 can be then interpreted as the
(adjusted) percent wage differential between the average wage of individuals in the particular
occupation-industry-country cell and the mean wage for a given year in the EU-15. We use
𝛾𝑘𝑐 as an indicator of labor shortage to measure immigrants' responses to changes in residual
wage premia, vis-à-vis the natives' response.
The second key variable in the analysis is the measure of relative supply of immigrants and
natives in each occupation-industry-country cell. The index is expressed by the ratio of
immigrants belonging to a given occupation-industry group in a given country and year, and
the total number of immigrants in the EU-15, relative to a similarly defined relative supply of
natives in the cell and year. Formally
3 On the process of integration of immigrants into the destination economies, see Constant, Gataullina and
Zimmermann (2009). 4 By including education as an independent variable, we eliminate any wage differentials arising due to
educational attainment of workers, but we assume that the residual wage premia are invariant across skill groups.

7
𝑍𝑘𝑐𝑡 =𝑀𝑘𝑐𝑡 𝑀𝑡⁄
𝑁𝑘𝑐𝑡 𝑁𝑡⁄, (3)
where 𝑀𝑘𝑐𝑡 is the number of immigrants belonging to occupation-industry group k, and
country c in year t. The total number of immigrants in the EU-15 in year t is denoted as 𝑀𝑡.
The denominator similarly indicates the relative supply of natives 𝑁𝑘𝑐𝑡 𝑁𝑡⁄ in the particular
cell and year. The index equals 1 when immigrants and native have the same distribution
across occupation-industry groups and countries. The index is greater than 1 if immigrants in
a given occupation-industry-country cell were overrepresented relative to the natives, and it
equals 0 if no immigrants are present in a particular occupation-industry-country cell. In the
empirical analysis, we use an index calculated for workers with and without tertiary
education, and for different immigrant groups distinguished by their origin or time since
immigration.
2.2 The baseline specification
To measure the relative responsiveness of immigrants to changing shortages in the labor
market, we adopt a first-difference regression model as follows:
∆𝑍𝑘𝑐𝑡 = 𝛼 + 𝛽∆𝛾𝑘𝑐𝑡−1 + 𝛿1𝐺𝐷𝑃𝑐𝑡−1 + 𝛿2𝑈𝑅𝑐𝑡−1 + 𝛿𝑘 + 𝛿𝑐 + 𝛿𝑡 + 𝜇𝑘𝑐𝑡, (4)
where ∆𝛾𝑘𝑐𝑡, our measure of labor shortage, is lagged by one year. This is because the
reaction of workers to changes in the labor market is likely to be delayed. The dependent
variable is the relative supply of immigrants 𝑍𝑘𝑐𝑡. The model also includes occupation-
industry cell, country and year fixed effects (𝛿𝑘, 𝛿𝑐 and 𝛿𝑡), which act as controls for any
specific factors that might affect the relative supply of immigrants. Additionally, the model
includes lagged values of country-level unemployment rate and GDP growth to account for
variation in economic conditions between countries and over time. We estimate this model
using the Ordinary Least Squares method with robust (Eicker-Huber-White) heteroskedastic-
consistent standard errors and every observation is weighted by the total number of
individuals in the cell.5 It is worth noting that we do not adjust for differences in living costs
in the construction of 𝛾𝑘𝑐𝑡 in Equation 2; that is done in the regression model of Equation 4
through the inclusion of country-year fixed effects.
A word of caution is due here: our measure of labor shortage captures any increase in the
price of labor that cannot be explained by the changing composition of workers in terms of
5 Analytic weights (aweights in Stata) are typically appropriate when analysis is based on data containing
averages.

8
gender, education, and work experience in the given occupation-industry-country cell.
Whereas first differences, country and year fixed effects control for a range of additional
factors specific to these categories, there may still be changes in residual wages that need not
reflect increased shortage of labor in the given group or country, but are rather due to
changing wage bargaining, regulation, or other factors that change the price of labor beyond
the variation captured by the compositional and fixed effects. Whereas this potentially
introduces measurement error in the link between measured and actual labor shortages, it does
not affect our key argument, measuring immigrants' and natives' relative responsiveness to
changing residual wages (whether due to shortages or other factors).
Another obvious issue in this type of models is that any measure of wages, such as 𝛾𝑘𝑐𝑡, may
be endogenous with respect to any measure of the labor force in the given labor market, such
as 𝑍𝑘𝑐𝑡. We acknowledge this issue, and note that as immigrants constitute a relatively small
share in most labor markets and 𝑍𝑘𝑐𝑡 is a measure of composition and not size of labor supply
in the given labor market (industry-occupation-country cell), the possible endogeneity of 𝛾𝑘𝑐𝑡
may be less problematic than in other models linking wages and labor supply. Moreover, we
lag 𝛾𝑘𝑐𝑡 by one year, as is common in the literature (e.g. Borjas, 2001; Dustmann, et al. 2012;
and Guzi et al., 2015). Finally it is possible that immigrants increase the relative supply of
labor in a given skill group, which should cause wages to decrease for that group and
therefore the estimated coefficients can be interpreted as a lower bound.
4 Data and sample characteristics
The empirical part of this study draws from representative samples of households in fifteen
EU member states6 obtained from the EU-LFS and EU-SILC. The national statistical offices
of each member country organize these surveys in harmonized methodology. The main
advantage of EU-LFS is its large sample size, but the downside is the missing information on
the income status of households. The information on income is complemented from the EU-
SILC database (particularly the estimation of labor shortage indicator in Equation 2). Both
datasets include information on respondents' personal circumstances (including nationality
and country of birth), their labor market status and job characteristics during a reference
period. The sampling structure of the surveys focuses primarily on permanent residents and
6 The sample includes Austria, Belgium, Denmark, Finland, France, Germany, Greece, Ireland, Italy,
Luxembourg, the Netherlands, Portugal, Spain, Sweden and the United Kingdom. Unfortunately the regional
classification is not consistently included in the data so the analysis at the regional level is not possible.
9
therefore does not capture short-term and seasonal migration. The empirical analysis exploits
samples from 2004-2014 of individuals aged 15 to 64.
The terms 'immigrant population' or 'immigrant individuals' are used in the broad context of
immigration, and the origin of immigrants is based on the country of birth. One exception is
Germany, for which immigrant origin can be determined only by nationality. The native
population refers to people residing in the country of birth. The EU-LFS allows us to
distinguish immigrants by the year of immigration and their origin (the choice of broader
regions of origin is determined by the respective variable in the dataset). In the paper we
distinguish six groups of immigrants which aggregate several geographic regions: EU-15
(includes EU-15 and EFTA), EU-12 (includes countries which joined EU in 2004 and 2007),
Europe (includes European countries outside the EU-15 and EU-12), Africa (Africa and
Middle East), Asia, America (includes both Americas, Australia and Oceania).
The immigrant population in the EU-15 is dynamically developing. According to the EU-LFS
the share of immigrants in the working age population in EU-15 countries increased from 8%
in 2004 to 12.5% in 2014. Foreign-born population is dominated by individuals from EU-15
and Africa (each group makes a fifth of immigrant stock, see Figure 1). Immigrants from Asia
and new member states (EU-12) increased their relative share during the studied period. The
EU-12 group is particularly dynamic and more than doubled its share from 8 to 18 %. The
relative number of immigrants from Europe, and the Americas changes very little and each
group comprises less than a sixth of immigrant stock.
The composition of immigrant population in the EU-15 varies also by the time since arrival.
The period followed by the European enlargement in 2004 was characterized by the rising
inflows of fresh immigrants that weakened with the outbreak of the Great Recession (see
Figure 1). In 2014 almost two thirds of immigrant stock comprises established immigrants,
who reside in a host country for more than ten years. Fresh immigrants with less than six
years since arrival and immigrants with six to ten years since immigration have an equal
share.

10
Figure 1 The composition of immigrant population by origin and years since arrival in EU-15
By origin
By years since immigration
Source: Own rendering based on EU-LFS 2004-2014 data
Note: Shares add up to unity. Immigrants are recognized by the country of birth or nationality
(Germany). YSM indicates the group of immigrants by years since immigration. Population
weights are applied.
0,05
0,10
0,15
0,20
0,25
0,30
2004 2006 2008 2010 2012 2014
EU15 EU12 Europe
Africa Asia America
0,10
0,20
0,30
0,40
0,50
0,60
2004 2006 2008 2010 2012 2014
YSM 1-5 YSM 6-10 YSM 11+

11
Figure 2 Immigrant to native ratio of employment and unemployment rates in the EU-15
for various immigrant groups
Employment rate
Unemployment rate
Source: Own rendering based on EU-LFS 2004-2014 data
Note: Ratio. Population weights are applied.
0,70
0,75
0,80
0,85
0,90
0,95
1,00
1,05
2004 2006 2008 2010 2012 2014
EU15
EU12
Europe
Africa
Asia
America
0,80
1,00
1,20
1,40
1,60
1,80
2,00
2,20
2,40
2,60
2004 2006 2008 2010 2012 2014
EU15
EU12
Europe
Africa
Asia
America

12
In the following figures we contrast the labor market status of immigrant vis-à-vis natives and
then compare their job search behavior and mobility across economic sectors. Figure 2 depicts
the ratio of employment and unemployment rates respectively of immigrants of different
origins relative to native workers. Ratios closer to one indicate that immigrants’ position in
the labor market is similar to that of the natives. Immigrants from the EU-15 and EU-12 show
labor market participation on par with the natives and EU-15 immigrants even outperform the
natives in the recent years. The EU-12 immigrants are more unemployed relative to natives
and their incidence of unemployed increased around the inception of the Great Recession.
Immigrants from Asia and Europe show rapid improvement in their labor attachment with
increasing participation and falling unemployment over the studied years, although the Great
Recession slowed down the adjustment process. The opposite trend is visible for immigrants
born in Africa and America, as their employment and unemployment rates deteriorated since
2008 relative to natives.
In a similar fashion, we demonstrate the differences in job search behavior, unemployment
duration and mobility across economic sectors. Figure 3 compares the share of workers in the
immigrant and native workforce who seek other employment when they already have a job.
The relatively high rates of on-the-job searches among immigrants vis-à-vis the natives may
point at lower attachment to their current job but also to an increased risk of involuntary job-
to-job transitions or unemployment. In particular, immigrants from Africa and America
significantly increased their search intensity during 2006-7, while in parallel they exhibited
higher incidence of unemployment in the following years (see Figure 2). We generally
observe increasing differences across various immigrant groups and the natives in their search
behavior over the studied period.
Figure 4 contrasts the proportion of labor force without a job for more than eleven months for
immigrants and natives. Apparently the inception of the Great Recession hit immigrants from
Africa, America and to lesser degree from EU-12, who prolonged their unemployment spells
relative to the natives. Interestingly, Asian immigrants managed to avoid long unemployment
spells throughout the period and particularly during the years of Great Recession. The ratio
for immigrants from Europe outside the EU was one of the highest throughout; converging to
unity before 2009, but further increasing afterwards. The incidence of long-term
unemployment for EU-15 immigrants was similar to natives and even improved in the most
recent years.

13
Figure 3 Immigrant to native ratio of the proportion of workers who look for another job
Source: Own rendering based on EU-LFS 2004-2014 data
Note: Sample includes employed workers. Population weights are applied.
Figure 4 Immigrant to native ratio of workforce without a job for more than 11 months
Source: Own rendering based on EU-LFS 2004-2014 data
Note: Sample includes employed and unemployed people. Population weights are applied.
0,8
1
1,2
1,4
1,6
1,8
2
2,2
2,4
2,6
2,8
2004 2006 2008 2010 2012 2014
EU15
EU12
Europe
Africa
Asia
America
0,6
0,8
1
1,2
1,4
1,6
2004 2006 2008 2010 2012 2014
EU15
EU12
Europe
Africa
Asia
America
14
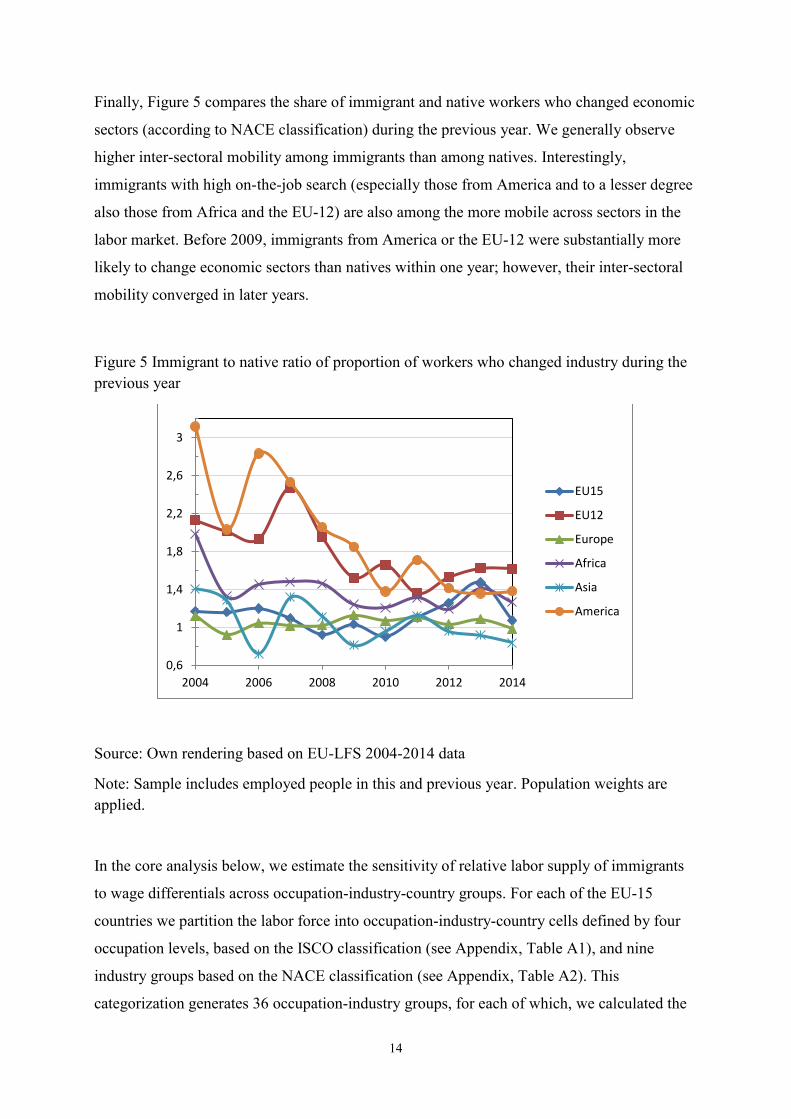
Finally, Figure 5 compares the share of immigrant and native workers who changed economic
sectors (according to NACE classification) during the previous year. We generally observe
higher inter-sectoral mobility among immigrants than among natives. Interestingly,
immigrants with high on-the-job search (especially those from America and to a lesser degree
also those from Africa and the EU-12) are also among the more mobile across sectors in the
labor market. Before 2009, immigrants from America or the EU-12 were substantially more
likely to change economic sectors than natives within one year; however, their inter-sectoral
mobility converged in later years.
Figure 5 Immigrant to native ratio of proportion of workers who changed industry during the
previous year
Source: Own rendering based on EU-LFS 2004-2014 data
Note: Sample includes employed people in this and previous year. Population weights are
applied.
In the core analysis below, we estimate the sensitivity of relative labor supply of immigrants
to wage differentials across occupation-industry-country groups. For each of the EU-15
countries we partition the labor force into occupation-industry-country cells defined by four
occupation levels, based on the ISCO classification (see Appendix, Table A1), and nine
industry groups based on the NACE classification (see Appendix, Table A2). This
categorization generates 36 occupation-industry groups, for each of which, we calculated the
0,6
1
1,4
1,8
2,2
2,6
3
2004 2006 2008 2010 2012 2014
EU15
EU12
Europe
Africa
Asia
America

15
labor shortage and the index of relative supply of immigrants in each country and year. In the
analysis we allowed only occupation-industry-country cells of sufficient size in all years.7
Tables 1 and 2 illustrate the distribution of immigrants across occupation and industry groups.
Interestingly, the occupational structure of EU-15 immigrants is almost identical to that of the
native workers, while the other immigrant groups are over-represented in occupations
requiring lower qualification. One striking observation is that immigrant workers with tertiary
education from the EU-12 and Europe (outside the EU) are substantially more frequently
employed in lower ranked occupations (intermediate specific or low group) relative to not
only the natives but also to all the other immigrant groups. This points to a high degree of
over-qualification. This may be due to their relatively recent arrival in the receiving countries,
but may also signify patterns of temporary migration whereby down-skilling (and saving on
the costs of acquiring country-specific human capital) may be an optimal strategy for a
temporary immigrants (Kahanec and Shields, 2013). The distributional patterns observed for
immigrants from Africa and America are very similar, especially for workers with tertiary
education. In contrast, Asian immigrants are more successful and especially Asian workers
without tertiary education are more often taking employment in occupations requiring higher
qualifications than all the other immigrant groups except the EU-15.
Table 1 Distribution of native and immigrant workers across occupation groups
Occupation group Native EU-15 EU-12 Europe Africa Asia America
All workers
High 0.43 0.45 0.18 0.16 0.32 0.35 0.30
Intermediate general 0.27 0.24 0.23 0.22 0.25 0.31 0.28
Intermediate specific 0.22 0.20 0.31 0.36 0.22 0.15 0.17
Low 0.08 0.11 0.27 0.25 0.21 0.19 0.24
Workers with less than tertiary education
High 0.27 0.26 0.10 0.10 0.17 0.20 0.14
Intermediate general 0.32 0.29 0.23 0.22 0.28 0.35 0.32
Intermediate specific 0.29 0.29 0.36 0.40 0.28 0.20 0.22
Low 0.11 0.16 0.31 0.27 0.27 0.25 0.32
Workers with tertiary education
High 0.79 0.81 0.46 0.48 0.67 0.65 0.65
Intermediate general 0.14 0.14 0.23 0.22 0.19 0.23 0.20
Intermediate specific 0.05 0.04 0.17 0.15 0.07 0.05 0.07
Low 0.01 0.01 0.14 0.15 0.07 0.07 0.09
Source: Own rendering based on EU-LFS 2004-2014 data
7 In each country, cells are selected if they include at least 20 observations in the EU-SILC database and the
weighted size of cells in the EU-LFS database is 50,000. Unfortunately, in the first year, data for several
countries are not available. In the 2004 EU-SILC dataset Germany, the Netherlands, and the United Kingdom are
missing. In the EU-LFS data we cannot identify the origin of respondents in Italy in 2004.

16
Note: Occupation groups are described in Table A1 in the Appendix. Sample includes
individuals aged 15 to 64 in EU-15 countries. Immigrants are recognized by the country of
birth or nationality (Germany). Population weights are applied.
With respect to distribution across sectors, immigrant workers are primarily concentrated in
construction (except for Asian group); transportation, accommodation and food; and they are
least concentrated in the education sector. Some immigrant groups are concentrated in other
industries e.g. EU15 group in finance, EU12 in agriculture, European in manufacturing,
African in health, Asian in wholesale, and American in public administration and social work.
Table 2 Distribution of native and immigrant workers across industry groups
Industry group Native EU-15 EU-12 Europe Africa Asia America
Manufacturing 0.18 0.17 0.17 0.22 0.13 0.13 0.10
Construction 0.07 0.08 0.15 0.14 0.08 0.03 0.09
Wholesale and trade 0.14 0.12 0.11 0.13 0.13 0.16 0.11
Transportation and food 0.11 0.15 0.18 0.16 0.16 0.25 0.17
Communication and financial 0.14 0.16 0.11 0.12 0.15 0.13 0.15
Education 0.08 0.08 0.03 0.03 0.06 0.05 0.06
Human health 0.11 0.10 0.08 0.07 0.13 0.12 0.09
Public administration 0.13 0.12 0.14 0.11 0.12 0.12 0.21
Agriculture and fishing 0.03 0.01 0.04 0.02 0.02 0.01 0.02
Source: Own rendering based on EU-LFS 2004-2014 data
Note: Industry groups are described in Table A2 in Appendix. Sample includes individuals
aged 15 to 64 in EU-15 countries. Immigrants are recognized by the country of birth or
nationality (Germany). Population weights are applied.
Overall, the descriptive evidence points to a favorable position of EU-15 immigrants in the
European labor market. The working conditions of this group are highly comparable to the
native-born workforce. In the core analysis below, the group of natives and EU-15 immigrants
represent a comparison group to which the performance of immigrant groups is compared.8
The evidence presented above documents that immigrants from the EU-12 are different from
the other immigrant groups in several directions. They exhibit high attachment to the labor
market but also high risk of unemployment. Unemployment spells for EU-12 immigrants are
short, their job search intensity is high, and they are able to change employment across
economic sectors in the economy. Together with immigrants from Europe, EU-12 immigrants
8 When the responsiveness of EU-15 immigrants vis-à-vis natives is compared, the estimate on labor shortage is
not significant. Analysis replicated by education attainment reveals that the high-educated group of EU-15 is
more responsive relative to high-educated natives.

17
are most concentrated in elementary occupations and exhibit the highest degree of down-
skilling. This would be consistent with the hypothesis that being fresh in the receiving
countries enables them to be a more fluid type of workers, seeking and responding to
changing economic opportunities vigorously. The responsiveness of the other immigrant
groups is likely to be restrained by institutional barriers, as many of such immigrants do not
enjoy all the provisions of free intra-EU mobility of workers.
5 Results
5.1 The baseline model
Using the data and methodology outlined above, we test the responsiveness of immigrants
from various origins, skills, and length of stay to labor shortages across sectors, occupations
and states in the EU-15 host labor markets over the business cycle during the Great
Recession. In all models, we treat EU-15 countries as one entity, and study the relative
responsiveness of immigrants to labor shortages vis-à-vis the EU native group (i.e. EU15
natives, including those living in their EU-15 member state of origin, as well as those living in
another EU-15 member state).9
The results obtained on the pooled sample are presented in Table 3. The positive estimates
obtained for labor shortage in the baseline model indicate that the relative supply of
immigrants in a particular occupation-industry-country group rose in those cells where the
wage premium (indicating a labor shortage) also rose. Significant estimates are obtained for
EU-12 and European immigrants who respond to shortages more fluidly than the EU native
group, whereas immigrants of other origins, in the statistical sense, behave similarly to the EU
native. The estimated coefficient can be interpreted in terms of the relative elasticity of supply
of immigrants and natives: ε=(dln(Z))/(dln(W)). The wage index measures the average log-
wages in each occupation-industry-country cell, so that ε=β/Z. As the mean value of Z is 1.70
and 1.77 for EU-12 and Europe immigrants respectively, the estimates in Table 3 implies an
elasticity of supply of 0.24 and 0.21 relative to EU native.10 This elasticity gives the
9 This scenario is compatible with Borjas (2001) who uses the group of US-born as a reference. 10 Borjas (2001) estimates an elasticity of 1.3 for new immigrants in the US. The estimated elasticity for all
immigrants cannot be calculated based on information in the paper but it is likely below one. In the UK,
Dustmann et al 2012 estimates the elasticity of 2.0 for immigrants with less than 10 years in the UK. Based on
the information in the paper the calculated elasticity for all immigrants is 0.88. Given barriers to mobility across
(and within) EU member states, we do not find it surprising that our estimate of elasticity is somewhat lower
than those estimated for the US and UK.

18
percentage change in the relative number of immigrants who choose to reside in a particular
occupation-industry-country cell for a given percentage change in the wage.
Our findings also corroborate the notion developed in the theoretical section of this paper, that
fresh immigrants are expected to be more responsive to the changing economic environment
than those who moved longer ago. The higher responsiveness to labor shortage is identified
for immigrants who reside six to ten years, and the effect is not significant for immigrants
who arrived longer ago, or the fresh immigrants with up to five years since immigration.
In the next step, models are run with the relative supply of immigrants calculated for workers
with and without tertiary education, and results are reported in the bottom panels of Table 3.
Our estimates confirm that the higher responsiveness of immigrants from EU-12 countries to
labor shortages, relative to the EU natives, is driven by low-educated workers (the same
conclusion holds also for immigrants from outside EU, the estimate is marginally significant
(p-value =0.107)). An interesting pattern emerges in the results by time since immigration.
Among low-educated workers, the effect is significant for a group of immigrants with some,
but not too long, experience in the host country (6-10 years). On the other hand, in the group
of high-educated workers, it is fresh (1-5 years) and established immigrants (10+ years), who
are more responsive to labor market opportunities than EU natives. This could mean that
recent high-educated immigrants are very responsive to labor shortages due to their costs of
migration D being sunk, but also they may be better equipped to overcome any institutional
barriers to their mobility than their low-educated counterparts. The estimated effects of labor
shortage for other immigrants are statistically not different from zero, meaning that those
groups respond to labor shortages similarly to the corresponding EU natives. Particularly the
mobility of recent low-educated immigrants may be constrained by institutional barriers
linked to their inexperience and short history in the country.

19
Table 3 The relative responsiveness of immigrants to labor shortage (sample 2004-2014)
EU-12 Europe Africa Asia America
YSM
1-5
YSM
6-10
YSM
11+
All workers
Labour shortage 0.408 ** 0.375 * 0.127 0.019 0.055 0.124 0.369 ** 0.142
(0.206) (0.205) (0.090) (0.152) (0.118) (0.148) (0.157) (0.089)
r2 0.036 0.047 0.028 0.05 0.033 0.059 0.053 0.089
N 2193 2143 2485 1793 2246 2550 2721 2970
Workers with less than tertiary education
Labour shortage 0.525 ** 0.329 0.092 -0.028 -0.037 0.073 0.43 ** 0.093
(0.227) (0.204) (0.120) (0.176) (0.152) (0.185) (0.191) (0.102)
r2 0.039 0.046 0.02 0.068 0.03 0.059 0.062 0.073
N 1809 1782 2164 1501 1777 2105 2339 2890
Workers with tertiary education
Labour shortage -0.424 0.389 0.322 ** -0.046 0.162 0.556 ** 0.149 0.337 ***
(0.558) (0.474) (0.144) (0.249) (0.182) (0.277) (0.208) (0.123)
r2 0.058 0.056 0.019 0.034 0.026 0.054 0.028 0.027
N 979 889 1246 841 1173 1193 1369 1685
Source: Own calculations based on EU-SILC, EU-LFS, and WDI data.
Notes: The dependent variable is the supply of immigrants relative to EU native in the
particular occupation-industry-country cell expressed in first difference. The labor shortage
for the same cell is also expressed in first difference and lagged. All models include lagged
GDP per capita and unemployment rate (not reported in table) and cell, year and country fixed
effects. YSM indicates the group of immigrants by years since immigration. The number of
observations in the model varies because we allow only occupation-industry-country cells of
sufficient size in all years. Regressions are weighted by the number of observations for the
industry-country cell. Heteroskedastic-consistent standard errors are in parentheses, *,**,***
identifying significance at 10, 5, 1 per cent levels, respectively.
5.2 The changes in the relative responsiveness of immigrants over time
In the previous, we show that EU-12 and Europe immigrants are more responsive than EU
natives to labor imbalances while the responsiveness of other immigrants is not different from
EU natives. In this section we study whether immigrants’ responsiveness was changing over
the business cycle during the Great Recession with the following empirical strategy: we
estimate Equation 4 on six consecutive subsamples, each for a six year interval.11 Our results
presented in Table 4 imply that EU-12 immigrants responded to labor shortages more fluidly
in samples containing more recession years. The opposite pattern emerges for the European
immigrant group, where our estimates suggest higher responsiveness vis-à-vis the EU natives
in the years before the Great Recession. The responsiveness of other immigrant groups to
11 The results obtained from subsamples of shorter or longer length lead to same conclusions. The results for
alternative subsamples are available from the authors upon request. Splitting the sample into six-year intervals is
preferred to provide for sufficient sample size.

20
labor shortage shows less definite patterns: the responsiveness to labor shortages vis-à-vis the
EU natives for the African group is significant in the sample, only consisting of recession
years, Asians’ responsiveness peaks around the inception of the Great Recession, and
Americans’ responsiveness is statistically indistinguishable from that of the EU-natives
throughout the studied periods.
With respect to time since immigration, the estimates for fresh immigrants (1-5 years) are
higher in the later periods but the effect does not become statistically significant. The estimate
of the coefficients on labor shortage for the immigrant group with the arrival of 6-10 years
ago follows a hump shape with the peak around the inception of the Great Recession. The
estimate for established immigrants (longer than 10 years) is strongest before the Great
Recession and decreases to near-zero in later periods.
Finally, to understand how the responsiveness to labor shortages varies according to the
qualification of a worker, we replicated the estimation in Table 4 for workers with and
without tertiary education and presented estimates in Table A3 in Appendix. The positive
estimates for EU-12 immigrants during the Great Recession and immigrants from Europe
outside the EU before and at the onset of the Great Recession are confirmed, arising primarily
in the low-educated segment of the labor market. High-skilled EU-12 immigrants were
particularly responsive around the inception of the Great Recession (2006-2011). High-
educated immigrants from Africa and America exhibit higher responsiveness relative to
comparable EU natives during the recession years. The effect for the group of low-educated
Americans is peculiar, as it changes from positive and statistically significant before Great
Recession to negative and nearly significant in later periods. No significant difference vis-à-
vis the natives is found for Asian immigrants.
The observed patterns for immigrants by the years since immigration indicate that the effect
for high-educated recent immigrants (1-5 years) peaks around the onset of the Great
Recession and continues through it. For low-educated immigrants with six to ten years since
immigration, we find significant positive effects around the onset but also before the Great
Recession. The results obtained for established immigrants (11+ years) are confirmed for both
low- and high-educated workers – the effect is present only in the years before the Great
Recession for the low-skilled, and peaks around the onset of the Great Recession for the high-
skilled ones.

21
Table 4 The relative responsiveness of immigrants to labor shortage in different periods
2004-09 2005-10 2006-11 2007-12 2008-13 2009-14
EU12 0.421
0.420
0.648 * 0.734 ** 0.760 ** 0.708 *
(0.294)
(0.282)
(0.361)
(0.371)
(0.354)
(0.366)
r2 0.123
0.100
0.066
0.048
0.063
0.057
N 943
1000
1000
1000
1000
1000
Europe 0.937 *** 0.801 *** 0.577 * 0.142 -0.025 -0.145
(0.285)
(0.265)
(0.345)
(0.360)
(0.346)
(0.350)
r2 0.105
0.123
0.063
0.052
0.047
0.054
N 923 976 976 976 976 976
Africa 0.033
-0.041
0.193
0.243
0.247
0.366 **
(0.117)
(0.118)
(0.129)
(0.164)
(0.153)
(0.147)
r2 0.092
0.053
0.058
0.039
0.051
0.043
N 1075
1128
1128
1128
1128
1128
Asia 0.135 0.287 0.451 ** 0.188 -0.172 -0.264
(0.208)
(0.190)
(0.224)
(0.235)
(0.256)
(0.248) r2 0.107
0.105
0.064
0.038
0.051
0.083
N 768 820 820 820 820 820
America 0.237 * 0.190
0.058
-0.021
-0.111
-0.180
(0.128)
(0.123)
(0.139)
(0.150)
(0.221)
(0.234)
r2 0.049
0.073
0.047
0.024
0.051
0.047
N 971
1020
1020
1020
1020
1020
YSM 1-5 0.061 0.113 0.295 0.222 0.371 0.376
(0.176)
(0.173)
(0.250)
(0.262)
(0.258)
(0.267)
r2 0.090
0.094
0.098
0.113
0.142
0.142
N 1100 1160 1160 1160 1160 1160
YSM 6-10 0.394 ** 0.395 *** 0.407 * 0.552 ** 0.389
0.332 (0.185)
(0.152)
(0.242)
(0.281)
(0.294)
(0.305)
r2 0.106
0.137
0.055
0.061
0.089
0.077
N 1176
1236
1236
1236
1236
1236
YSM 11+ 0.329 *** 0.266 ** 0.257 ** 0.142 -0.009 0.016
(0.113)
(0.106)
(0.118)
(0.135)
(0.161)
(0.163)
r2 0.128
0.134
0.124
0.081
0.101
0.094
N 1285 1348 1348 1348 1348 1348
Source: Own calculations based on EU-SILC, EU-LFS, and WDI data.
Notes: Each cell includes coefficient on labor shortage estimated from separate model for
different immigrant groups. See notes to Table 3.

22
7. Conclusions
The migration literature documents important contributions of the mobile immigrant
workforce in the labor adjustment process (Borjas, 2001; Dustmann et al. 2012,; and Guzi et
al. 2014; 2015). Our analysis extends this literature to study immigrant groups by origin, time
since immigration, and qualification level over the business cycle during the Great Recession.
Using primarily the EU LFS and EU SILC datasets, we find that immigrants are in general,
not less, and in many cases, are more responsive to labor market shortages than the natives.
For the pooled sample comprising the whole studied period of 2004-2014, we find that low-
skilled immigrants from the EU-12, and high-skilled ones form Africa exhibit higher
responsiveness to labor shortages than the natives.
We also find that low-skilled immigrants responsiveness to labor shortages peaks for those
with 6-10 years since immigration, possibly as a compound effect of their (still) low
attachment to their specific location in the host labor market (and hence relatively low
migration costs D), but an already sufficient adjustment to the conditions, and hence, ability to
overcome barriers to migration in the host labor market. For high-skilled immigrants, the
picture is the opposite, with the most recent immigrants (1-5 years) and the most established
ones (11+ years) being most responsive. It is a topic for further study to evaluate the relative
roles of migration costs (low for recent immigrants) and adjustment and ability to overcome
barriers to migration (higher for more established immigrants).
In the analysis of immigrants’ relative responsiveness to labor shortages over the business
cycle during the Great Recession, where we follow the labor market using moving six-year
windows, we find varying patterns for different immigrant groups. Immigrants from the new
member states (EU-12) exhibited high responsiveness to labor shortages vis-à-vis the EU
natives, which peaked and became significant during the Great Recession. The effect is
however concentrated in the low-skilled segment of labor market. Results for immigrants
from the rest of Europe (outside the EU) imply their relative responsiveness is positive and
statistically significant only in the periods covering mostly pre-crisis years. Again, the effect
is stronger when measured among low-skilled workers. The high-skilled African and
American immigrants are confirmed more mobile, relative to EU natives during the Great
Recession. Low-educated immigrants originating from America exhibit a peculiar pattern,
however. The higher responsiveness in the pre-recession period (2004-2009) gradually
diminishes and these immigrants became less responsive relative to natives during the

23
recession years. Whether this could reflect a tightening of the migration policy with respect to
non-EU groups during the Great Recession is a topic for further investigation. Low skilled
Africans are found to be significantly more responsive than the natives only in the window
fully covering the Great Recession and later years (2009-2014); and Asians are very similar to
the natives, except around the onset of the Great Recession (2006-2011) for the pooled sample
of both the low- and high-skilled ones.
Our findings are consistent with the findings for the pooled high- and low-skilled sample, that
recent immigrants respond to labor shortages more fluidly than the natives (positive effects
for EU-12 and high-educated fresh immigrants), but some groups achieve higher mobility
only after some adjustment period needed to overcome institutional and legal barriers to
occupational, inter-sectoral and spatial mobility (the effect for low-educated immigrant with
six to ten years since immigration). For established immigrants (YSM 11+) responsiveness to
labor shortages is higher in the period before the Great Recession, during which, the effect is
reduced; however, the effect for the high-skilled ones in this category peaks around the onset
of the Great Recession.
To summarize, we show that immigrants in general and specific groups of immigrants in
particular have responded to changing labor shortages across EU member states, occupations
and sectors at least as much and often more fluidly than the natives. This is especially true for
immigrants from the new member states, but also fresh and not yet established immigrants.
The high-educated workers from African and American origins exhibit particularly high
responsiveness to labor shortages during the Great Recession. These results may suggest the
existence of two competing opposite effects on immigrants’ responsiveness to labor
shortages. First, fresh immigrants are more fluid as for them the costs of parting with their
origins are sunk. Second, responsiveness to labor shortages is higher for immigrants who have
accumulated some experience in the host labor markets, and thus, have learned how to
overcome the barriers to labor mobility, or for those whose mobility is not restricted within
the European Single Market. This may be one explanation why the two most mobile groups
responding to labor shortages during the Great Recession are the relatively recent EU-12
immigrants and those not yet established but also with some experience. The role of the
tightening migration policy and growing negative attitudes towards immigrants during the
Great Recession needs to be further studied, to hopefully provide some answers why the
responsiveness of European immigrants from outside the EU and those with eleven or more
years since immigration dropped during the Great Recession.

24
8. References
Amuedo-Dorantes, C., & de la Rica, S. (2010). Immigrants’ responsiveness to labor market
conditions and their impact on regional employment disparities: Evidence from Spain.
SERIEs, 1(4), 387–407. http://doi.org/10.1007/s13209-009-0002-y
Arpaia, A., Kiss, A., Palvolgyi, B., & Turrini, A. (2016). Labour mobility and labour market
adjustment in the EU. IZA Journal of Migration, 5(21), 1–21.
http://doi.org/10.1186/s40176-016-0069-8
Borjas, G. J. (2001). Does Immigration Grease the Wheels of the Labor Market? Brookings
Papers on Economic Activity, 32(1), 69–134.
Constant, A. F., Gataullina, L., & Zimmermann, K. F. (2009). Ethnosizing immigrants.
Journal of Economic Behavior and Organization, 69(3), 274−287.
De la Rica, S., & Polonyankina, T. (2013). The impact of Immigration on Occupational
Specialisation among Natives in Spain: Does the Business Cycle Matter? Revista de
Economía Aplicada, 21(63).
Dustmann, C., Frattini, T., & Preston, I. (2012). Can immigration constitute a sensible
solution to sub-national and regional labour shortages? Report for the Migration
Advisory Committee.
Dustmann, C., Glitz, A., & Vogel, T. (2010). Employment, wages, and the economic cycle:
Differences between immigrants and natives. European Economic Review, 54(1), 1–17.
Guzi, M., Kahanec, M., & Mýtna Kureková, L. (2015). How Immigration Grease Is Affected
by Economic, Institutional and Policy Contexts: Evidence from EU Labor Markets. IZA
Discussion Paper. Bonn: The Institute for the Study of Labor.
Guzi, M., Kahanec, M., & Mýtna Kureková, L. (2014). Does Immigration Grease the Wheels
of European Labour Markets? KING Desk Research & In-Depth Study n.18. Milano:
Fondazione ISMU.
Kahanec, M. (2013). Labor mobility in an enlarged European Union. International Handbook
on the Economics of Migration, 137–152.
Kahanec, M., & Zaiceva, A. (2009). Labor market outcomes of immigrants and non-citizens
in the EU: An East-West comparison. International Journal of Manpower, 30(1/2), 97–
115.
Kahanec, M., & Zimmermann, K. F. (2016). Labor Migration, EU Enlargement, and the
Great Recession. Berlin, Heidelberg: Springer, forthcoming.
Røed, M., & Schøne, P. (2012). Does immigration increase labour market flexibility? Labour
Economics, 19(4), 527–540.

25
Appendix
Table A1 Definition of occupation group
Occupation category ISCO-1 coding Occupation group
Legislators, senior officials and managers 1 high
Professionals 2 high
Technicians and associate professionals 3 high
Clerks 4 intermediate general
Service workers and shop and market sales workers 5 intermediate general
Skilled agricultural and fishery workers 6 intermediate specific
Craft and related workers 7 intermediate specific
Plant and machine operators and assemblers 8 intermediate specific
Elementary occupations 9 low
Table A2 Definition of industry group
Economic activity NACE coding Industry group
Manufacturing, mining and quarrying and other industry C,D, E 1
Construction F 2
Wholesale and retail trade G 3
Transportation and storage, accommodation and food service H,I 4
Information and communication, financial and insurance activities J,K 5
Education M 6
Human health N 7
Public administration, defense, and social work activities O, P, Q 8
Agriculture, forestry and fishing A, B 9

26
Table A3 The relative responsiveness of immigrants to labor shortage
2004-09 2005-10 2006-11 2007-12 2008-13 2009-14
All workers
EU-12 0.421 0.42 0.648 * 0.734 ** 0.76 ** 0.708 *
Europe 0.937 *** 0.801 *** 0.577 * 0.142 -0.025 -0.145
Africa 0.033 -0.041 0.193 0.243 0.247 0.366 **
Asia 0.135 0.287 0.451 ** 0.188 -0.172 -0.264
America 0.237 * 0.19 0.058 -0.021 -0.111 -0.18
YSM 1-5 0.061 0.113 0.295 0.222 0.371 0.376
YSM 6-10 0.394 ** 0.395 *** 0.407 * 0.552 ** 0.389 0.332
YSM 11+ 0.329 *** 0.266 ** 0.257 ** 0.142 -0.009 0.016
Workers with less than tertiary education
EU-12 0.477 0.451 0.691 * 0.768 ** 0.822 ** 0.845 **
Europe 0.981 *** 0.778 *** 0.415 0.045 -0.107 -0.148
Africa -0.039 -0.139 0.079 0.169 0.225 0.370 **
Asia 0.116 0.285 0.359 0.112 -0.172 -0.296
America 0.374 ** 0.271 * -0.027 -0.269 * -0.386 -0.476 *
YSM 1-5 -0.026 0.011 0.045 0.120 0.303 0.368
YSM 6-10 0.519 ** 0.556 *** 0.555 * 0.659 ** 0.481 0.384
YSM 11+ 0.293 ** 0.215 * 0.176 0.053 -0.050 -0.038
Workers with tertiary education
EU-12 -0.059 0.689 1.006 ** 0.587 0.022 -0.535
Europe 1.010 1.062 * 1.192 * 0.700 -0.721 -0.962
Africa 0.130 0.252 0.680 *** 0.709 *** 0.581 ** 0.565 **
Asia 0.005 0.244 0.468 0.007 -0.362 -0.551
America -0.203 -0.038 0.152 0.709 ** 0.695 ** 0.723 **
YSM 1-5 0.443 0.679 ** 1.367 *** 1.099 ** 0.936 ** 0.702
YSM 6-10 -0.168 -0.086 0.106 0.325 0.132 0.082
YSM 11+ 0.360 ** 0.408 ** 0.597 *** 0.490 ** 0.250 0.301
Source: Own calculations based on EU-SILC, EU-LFS, and WDI data.
Notes: Each cell includes coefficient on labor shortage estimated from separate model for
different immigrant groups. Estimates in top panel are presented in Table 4 and here for
comparison. *,**,*** identify significance at 10, 5, 1 per cent levels, respectively.

27
Figure A1 Real GDP growth rate (selected countries)
Source: Eurostat (table tec00115)
-15
-10
-5
0
5
10
2004 2006 2008 2010 2012 2014
Poland Slovakia Germany Spain
Italy Latvia Estonia