dielectric based sensing system for banana ripeness …ijesd.org/papers/493-g0006.pdf · cultivated...
TRANSCRIPT

Abstract—Banana is an extremely perishable fruit thus
post-harvest quality process changes quickly. Conventional
banana ripeness assessment include sorting and grading based
on human visual evaluation, ethylene hormone treatment,
firmness check by penetrometer and soluble solid content
measurement using refractometer are not effective to give
uniform and quick result. Dielectric spectroscopy has been
applied in agricultural materials as it offers relatively
inexpensive assessment, nondestructive, fast and easy to operate
system. In ripeness assessment, the magnitude phase of
impedance value will increase with ripening stages over certain
frequency. This study showed that impedance measurement
was able to differentiate the unripe, ripe and overripe banana
over the frequency of 20.1kHz to 30.1kHz. Soluble solid content
(SSC) of banana was determined by developed model at the
frequency of 21.1kHz.
Index Terms—Banana ripeness, dielectric, impedance,
soluble solid content.
I. INTRODUCTION
Banana (Musa paradisiaca L.) is one of the most widely
cultivated fruit in Malaysia. This crop ranked second in terms
of production area and fourth in export revenue based on the
balance of trade figures. Fifteen percent of the banana
produced is exported valued at more than RM 30 million [1].
Bananas start to ripen seven days after harvest and fully ripe
in two days if they are stored at room temperature [2]. The
sugar content indicates the best time for the fruit to be
marketable. For bananas, the relationship between the sugar
content and the peel color changes is parallel. Currently,
ethylene gas control has been used as ripening treatment for
bananas by the trained laborers [3]. Ethylene is a plant
hormone that plays an important role in decreasing the
storage life of fruits and vegetables [4]. However, this
method is not always successful in bringing the uniformed
ripening of banana fruits because of its lacking monitoring
system. Firmness is a very good indicator in determining the
quality of products, and it has been used to measure maturity
and ripeness of fruit [5]. Usually, a penetrometer is used to
measure firmness of fruits and it is a destructive method. Peel
color is considered as a good indicator of banana ripeness as
the chlorophyll content in the peel reduces with banana
ripening [6]. The first observable sign of ripening is a color
change from green to yellow [7]. There are seven stages of
banana color guide during ripening and retailers usually sell
banana fruits when they are at stage six. Nevertheless, this
method is based on human visual determination that can be
imprecise and insufficient to assess the internal quality
changes. Therefore, it is important to assess banana ripeness
through an inexpensive, fast and non-destructive approach.
Dielectric spectroscopy is relatively a new method applied
to agricultural produce. Dielectric parameters used to
characterize materials are dielectric constant, permittivity,
dielectric loss and impedance. The choice of parameters
depends on the suitability of materials and equipment
available. Dielectric is also used for studying the structures of
organic and inorganic materials with wide and continuous
frequency impedance measurement [8]. Stuart O. Nelson
(2005) had studied the dielectric properties of nine types of
fresh fruits and vegetable over the frequency range from
10MHz to 1.8GHz and over the temperature range from 5 to
65°C [9]. Further research was carried out to find correlation
between soluble solids content, indicative of sweetness, and
the permittivity of honeydew melons for quality sensing [10].
His research provided new information useful in evaluating
dielectric properties of such agricultural products for quality
sensing applications. There are several other studies on
dielectric characterization such as using impedance to study
cold acclimation of scot pine [11] and to predict density of
watermelons [12]. Sirikulrat et al. (2008) demonstrated that
the relative permittivity of fresh soybean decreases as the
bean matures [13]. Since dielectric based sensing showed
potential use in wide agricultural products, this research was
done to study the dielectric characteristic of banana at
different ripeness using impedance measurement. The
impedance value is then was correlate with the soluble solid
content (SSC) to develop model to predict SSC value based
on impedance measurement for ripeness determination.
II. MATERIALS AND METHODS
A. Banana Impedance Measurement
Banana (Musa paradisiaca L.) fruits from Berangan
variety were used in this experiment. Banana fruits were
classified into three groups which were unripe, ripe and
overripe with total of 30 samples in each group. An
impedance analyzer board AD5933 with electrocardiogram
(ECG) probe was used to measure impedance values of
banana at three different groups of ripeness. The ECG probes
detect and amplify the tiny electrical changes as it were
attached on banana (Fig. 1). The impedance analyzer board
was connected to the PC for data extraction and analysis.
Dielectric Based Sensing System for Banana Ripeness
Assessment
D. Jamaludin, S. Abd Aziz, and N. U. A. Ibrahim
International Journal of Environmental Science and Development, Vol. 5, No. 3, June 2014
286
Manuscript received August 9, 2013; revised October 21, 2013. This
work was supported in part by the Ministry of Higher Education and
Universiti Putra Malaysia.
D. Jamaludin is with the Faculty of Engineering Universiti Putra
Malaysia (e-mail: [email protected]).
S. Abd Aziz was with Universiti Putra Malaysia. She is now the head
department of Department of Biological & Agricultural Engineering,
(e-mail: [email protected]).
N. U. A. Ibrahim is with the Department of Biological & Agricultural
Engineering, Universiti Putra Malaysia (e-mail:
DOI: 10.7763/IJESD.2014.V5.493
Magnitude and phase of the impedance were measured
directly at frequency sweep from 100Hz to 100kHz. The
impedance measurement was shown in the software and the
data was downloaded into Microsoft Excel format.
Fig. 1. ECG probes were attached to the banana.
B. Soluble Solid Content (SSC) Measurement
SSC is the quality indicator which currently requires
samples from the internal tissues and is a destructive test.
Sugar content increase steadily as banana ripens. Each
banana was used to extract the fruit juice right after the
electrical impedance measurement. Sugar content was
measured by using a Pocket Refractometer PAL- α (Atago
Co., Ltd). Ten grams of flesh was sampled from a whole
banana (along length of fruit). The sample was macerated and
the tissue was homogenized with 40 ml of distilled water,
using a hand mixer. A drop of the concentration was then
placed on the prism glass of the refractometer to obtain the
Brixpercentage that represents the SSC in the banana (Fig. 2).
SSC were measured with three replications for each sample.
Fig. 2. SSC measurement by pocket refractometer.
III. RESULTS AND DISCUSSION
A. Impedance Measurement of Banana from Berangan
Variety at Different Ripeness
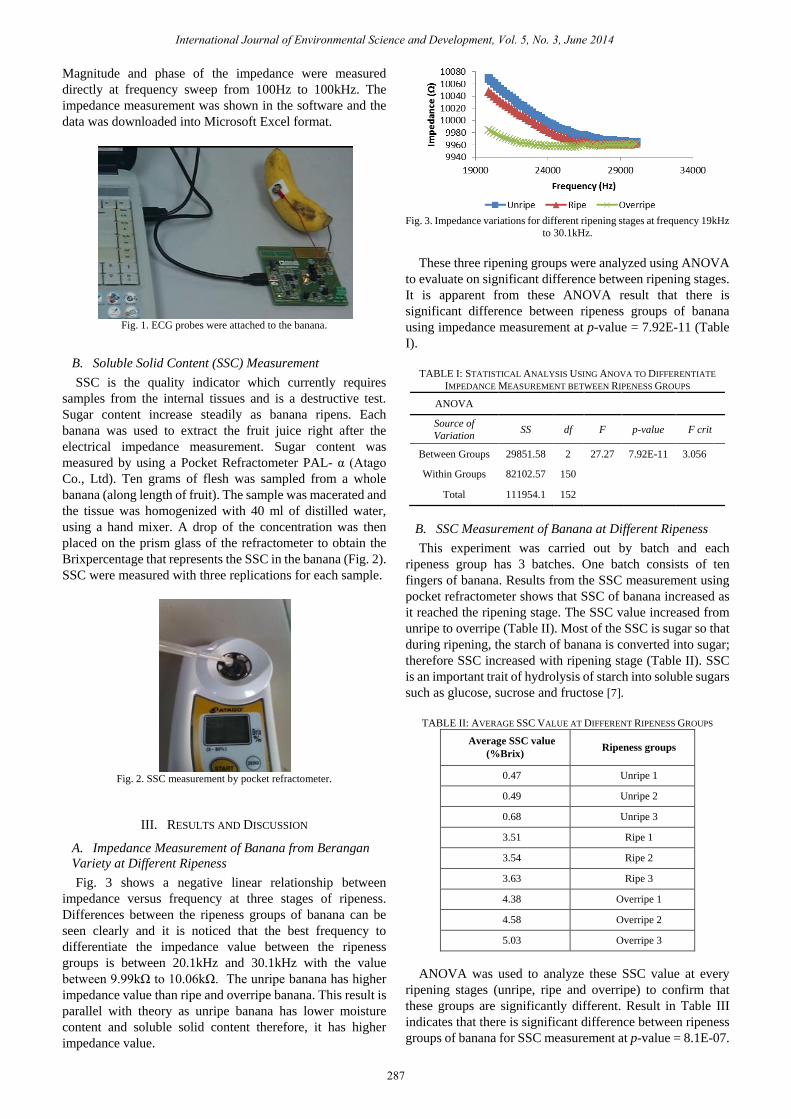
Fig. 3 shows a negative linear relationship between
impedance versus frequency at three stages of ripeness.
Differences between the ripeness groups of banana can be
seen clearly and it is noticed that the best frequency to
differentiate the impedance value between the ripeness
groups is between 20.1kHz and 30.1kHz with the value
between 9.99kΩ to 10.06kΩ. The unripe banana has higher
impedance value than ripe and overripe banana. This result is
parallel with theory as unripe banana has lower moisture
content and soluble solid content therefore, it has higher
impedance value.
Fig. 3. Impedance variations for different ripening stages at frequency 19kHz
to 30.1kHz.
These three ripening groups were analyzed using ANOVA
to evaluate on significant difference between ripening stages.
It is apparent from these ANOVA result that there is
significant difference between ripeness groups of banana
using impedance measurement at p-value = 7.92E-11 (Table
I).
B. SSC Measurement of Banana at Different Ripeness
This experiment was carried out by batch and each
ripeness group has 3 batches. One batch consists of ten
fingers of banana. Results from the SSC measurement using
pocket refractometer shows that SSC of banana increased as
it reached the ripening stage. The SSC value increased from
unripe to overripe (Table II). Most of the SSC is sugar so that
during ripening, the starch of banana is converted into sugar;
therefore SSC increased with ripening stage (Table II). SSC
is an important trait of hydrolysis of starch into soluble sugars
such as glucose, sucrose and fructose [7].
TABLE II: AVERAGE SSC VALUE AT DIFFERENT RIPENESS GROUPS
Average SSC value
(%Brix) Ripeness groups
0.47 Unripe 1
0.49 Unripe 2
0.68 Unripe 3
3.51 Ripe 1
3.54 Ripe 2
3.63 Ripe 3
4.38 Overripe 1
4.58 Overripe 2
5.03 Overripe 3
ANOVA was used to analyze these SSC value at every
ripening stages (unripe, ripe and overripe) to confirm that
these groups are significantly different. Result in Table III
indicates that there is significant difference between ripeness
groups of banana for SSC measurement at p-value = 8.1E-07.
International Journal of Environmental Science and Development, Vol. 5, No. 3, June 2014
287
TABLE I: STATISTICAL ANALYSIS USING ANOVA TO DIFFERENTIATE
IMPEDANCE MEASUREMENT BETWEEN RIPENESS GROUPS
ANOVA
Source of
Variation SS df F p-value F crit
Between Groups 29851.58 2 27.27 7.92E-11 3.056
Within Groups 82102.57 150
Total 111954.1 152

Therefore, SSC value can be used as indicator of banana
ripeness to correlate with impedance measurement.
C. Correlation between Impedance Measurement and SSC
Measurement of Banana
Impedance measurement was found to have differences
between three ripeness groups over the frequency of 20.1kHz
to 30.1kHz with the impedance measurement at the range of
9.99kΩ to 10.06kΩ. From this frequency, impedance
measurement versus SSC measurement was plotted. Graph in
Fig. 3 shows that, when SSC increase impedance decreased.
Fig. 3. Correlation between SSC measurements with impedance
measurements at the frequency over 20.1kHz to 30.1kHz.
D. Prediction of SSC Value Using Linear Regression
Models
A good model should have a low Root Mean Square Error
(RMSE). It is a frequently used measure of the difference
between values predicted by a model and the values actually
observed from real situation.Model that has the lowest RMSE
(0.769 % Brix) was found at 21.1kHz (Table IV).
TABLE IV: RMSE AT THE FREQUENCY OF 20.1KHZ TO 24.1KHZ IN
MODEL DEVELOPMENT
Frequency (kHz) Linear regression model RMSE
(%Brix)
20.1 y =-0.041x + 413.6 1.258
21.1 y =-0.046x + 463.8 0.769
22.1 y =-0.054x+ 546.1 1.973
23.1 y = - 0.069x+694.4 0.895
24.1 y =-0.093x+933.6 1.131
This indicates that banana ripeness can be predicted by
impedance measurement at frequency of 21.1kHz. A better
model can be developed by using other data processing
method such as partial least squares (PLS) and principal
component regression (PCR) to develop models for
predicting the SSC for more accurate rather than simple
linear regression. A good linear correlation was found for
SSC versus impedance at frequency of 22.1kHz with r2
=0.7163 (Fig. 4). This indicates that impedance can be used
as attribute to determine SSC of banana.
Fig. 4. Scatter plot of SSC versus impedance at frequency of 21.1kHz.
IV. CONCLUSION
The result from this study has shown that there is negative
linear relationship between impedance and frequency. It also
shows that unripe banana has higher impedance value than
ripe and overripe banana. This relationship demonstrate that
impedance measurement have potential in assessing banana
fruit quality. It is suggested that future studies involved other
parameter such as firmness, peel color changes and moisture
content. Further data processing and model development
using other data processing method such as PLS and PCR are
suggested in order to get the better model with low RMSE.
ACKNOWLEDGMENT
The author would like to acknowledge Ministry of Higher
Education and University Putra Malaysia for sponsoring her
studies.
REFERENCES
[1] N. M. Hassan, “Enhancing the Malaysian banana industry: R&D
advancing banana and plantain R&D in Asia and the Pacific,” in Proc.
The 3rd BAPNET Steering Committee, November 23-26, 2004, vol. 13,
pp. 89-96.
[2] J. Mortan, “MUSACEAE banana,” Fruits of Warm Climates, Creative
Resource System, Inc., Box 890, Winterville, N. C. 28590, pp. 29–46,
1987.
[3] M. Soltani, R. Alimardani, and M. Omid, “Prediction of banana quality
during ripening stage using capacitance sensing system,” Australian
Journal of Crop Science, vol. 4, no. 6, pp. 443-447, 2013.
[4] J. H. Bower, W. V. Biasi, and E. J. Mitcham, “Effect of ethylene in the
storage environment on quality of „bartlett pears‟,” Postharvest
Biology and Technology, vol. 28, pp. 371-379, 2003.
[5] E. Hoehn, F. Gasser, B. Guggenbuhl, and U. Kunsch, “Efficacy of
instrumental measurements for determination of minimum
requirements of firmness, soluble solids, and acidity of several apple
varieties in comparison to consumer expectations,” Postharvest
Biology and Technology, vol. 27, pp. 27-37, 2003.
[6] M. Li, D. C. Slaughter, and J. F. Thompson, “Optical chlorophyll
sensing system for banana ripening,” Postharvest Biology and
Technology, vol. 12, pp. 273-283, 1997.
[7] J. Marriott, M. Robinson, and S. K. Karikari, “Starch and sugar
transformation during the ripening of plantains and bananas,” Journal
of Science, Food and Agriculture, pp. 1021-1026, 1981.
[8] L. Ragni, P. Gradari, A. Berardinelli, A. Giunchi, and A. Guarnieri,
“Predicting quality parameters of shell eggs using a simple technique
based on the dielectric properties,” Biosystems Engineering, vol. 94, no.
2, pp. 255–262, 2006.
[9] S. O. Nelson, “Dielectric spectroscop of fresh fruits and vegetables,”
U.S. Department of Agriculture, Agricultural Research Service,
Athens, GA, 30604-5677, USA, 2005.
[10] S. O. Nelson, S. Trabelsi, and S. J. Kays, “Dielectric spectroscopy of
honeyder melons for quality sensing,” Sorrento, Italy, pp. 24–27, 2006.
International Journal of Environmental Science and Development, Vol. 5, No. 3, June 2014
288
TABLE III: STATISTICAL ANALYSIS USING ANOVA TO DIFFERENTIATE
SSC VALUES FOR DIFFERENT RIPENESS GROUPS
ANOVA
Source of
Variation SS df F p-value
F
critical
Between
Groups 27.244 2 318.856 8.1E-07 5.143
Within
Groups 0.256 6
Total 27.501 8

[11] T. Repo, G. Zhang, A. Ryyppo, and R. Rikala, “The electrical
impedance spectroscopy of scots pine (Pinus Sylvestris L.) shoots in
relation to cold acclimation,” Journal of Experimental Botany, vol. 51,
pp. 2095-2107, 2000.
[12] K. Kato, “Electrical density sorting and estimation of soluble solids
content of watermelon,” J. Agric. Eng Res. vol.67, pp. 161–170, 1997.
[13] K. Sirikulrat and N. Sirikulat, “Dielectric properties of different
maturity soybean,” KMITL Sci. J., vol. 8, no. 2, 12-18
Diyana Jamaludin is from Malaysia. She received
Bachelor of Engineering in Biological & Agricultural
from Universiti Putra Malaysia in 2005. She then
pursued her Master Degree at the same university and
obtained her Master Degree of Bioenvironmental
Engineering in 2010. Currently, she is a Ph.D. student
in Faculty of Engineering, Universiti Putra Malaysia
and working on research related to dielectric and
impedance spectroscopy in agricultural materials.
She is attached with Department of Biological & Agricultural Engineering
UPM as a tutor and currently she is on her study leaves. Her previous work
and research was also on GIS and controlled environment. Ms. Diyana is a
member of ASABE, MSAE and was a registered member of IEM. Her
current work “Dielectric Based Measurement System for Agricultural
Materials” had received a gold medal award in I-ENVEX, Malaysia.
Samsuzana Abd Aziz is from Malaysia. She received
Bachelor of Engineering in Electrical
Telecommunication from Universiti Teknologi
Malaysia in 2002 and then pursued her master and Ph.D.
in Agricultural Engineering at Iowa State University,
USA.
Currently, she is in the head of Department of
Biological & Agricultural Engineering, Universiti Putra
Malaysia and her research interests are mainly on
Agricultural and Biosystems Instrumentation, and GIS.
Dr. Samsuzana is the vice president of MSAE, treasurer of IEEE GOLD
Affinity Group and member of ASABE, and BEM. She had received many
international and national awards for her respective research work.
Nur Ul Atikah Ibrahim is from Malaysia. She
received Bachelor of Engineering in Agricultural &
Biosystem from Universiti Putra Malaysia in 2013. She
also has a diploma in Mechanical Engineering
(Agriculture) in 2009.
Nur Ul Atikah is an active student at her faculty and
college at UPM. She also received gold medal award in
I-ENVEX Malysia.
International Journal of Environmental Science and Development, Vol. 5, No. 3, June 2014
289