differentiation of the root of cultivated ginseng,...
TRANSCRIPT

Available online at www.sciencedirect.com
www.elsevier.com/locate/molstruc
Journal of Molecular Structure 883–884 (2008) 228–235
Differentiation of the root of Cultivated Ginseng, MountainCultivated Ginseng and Mountain Wild Ginseng using FT-IR
and two-dimensional correlation IR spectroscopy
Dan Liu a,b, Yong-Guo Li a,b, Hong Xu a,b, Su-Qin Sun c,*, Zheng-Tao Wang a,b,*
a Key Laboratory of Standardization of Chinese Medicines of Ministry of Education, Institute of Chinese Materia Medica,
Shanghai University of Traditional Chinese Medicine, 1200 Cailun Road, Zhangjiang Hi-Tech Park, Shanghai 201203, PR Chinab Shanghai R&D Center for Standardization of Traditional Chinese Medicines, Shanghai 201203, PR China
c Key Laboratory of Bioorganic Phosphorus Chemistry & Chemical Biology (Ministry of Education), Department of Chemistry, Analysis Center,
Tsinghua University, Beijing 100084, PR China
Received 20 November 2007; received in revised form 3 February 2008; accepted 6 February 2008Available online 29 February 2008
Abstract
Ginseng is one of the most widely used herbal medicines. Based on the grown environments and the cultivate method, three kinds ofginseng, Cultivated Ginseng (CG), Mountain Cultivated Ginseng (MCG) and Mountain Wild Ginseng (MWG) are classified. A noveland scientific-oriented method was developed and established to discriminate and identify three kinds of ginseng using Fourier transforminfrared spectroscopy (FT-IR), secondary derivative IR spectra and two-dimensional correlation infrared spectroscopy (2D-IR). Thefindings indicated that the relative contents of starch in the CG were more than that in MCG and MWG, while the relative contentsof calcium oxalate and lipids in MWG were more than that in CG and MCG, and the relative contents of fatty acid in MCG were morethan that in CG and MWG. The hierarchical cluster analysis was applied to data analysis of MWG, CG and MWG, which could beclassified successfully. The results demonstrated the macroscopic IR fingerprint method, including FT-IR, secondary derivative IRand 2D-IR, can be applied to discriminate different ginsengs rapidly, effectively and non-destructively.� 2008 Published by Elsevier B.V.
Keywords: Cultivated Ginseng (CG); Mountain Cultivated Ginseng (MCG); Mountain Wild Ginseng (MWG); FT-IR; Discrimination
1. Introduction
Ginseng, the root and rhizome of Panax ginseng C.A.Meyer, is one of the most widely used herbal medicinesin the world, which benefits to general health, includingpositive effects on the endocrine, cardiovascular, immune,and central nervous systems, prevention of fatigue, oxida-tive damage, mutagenicity and cancer prevention [1,2].
0022-2860/$ - see front matter � 2008 Published by Elsevier B.V.
doi:10.1016/j.molstruc.2008.02.025
Abbreviation: CG, Cultivated Ginseng; MCG, Mountain CultivatedGinseng; MWG, Mountain Wild Ginseng.
* Corresponding authors. Tel.: +86 21 51322507; fax: +86 21 51322519(Z.W.); tel.: +86 10 62787661 (S.S.).
E-mail addresses: [email protected] (S.-Q. Sun), [email protected] (Z.-T. Wang).
Based on the grown environment and the cultivate method,the commercial trade ginseng is classified into three gradesof ginseng, Cultivated Ginseng (CG), Mountain CultivatedGinseng (MCG) and Mountain Wild Ginseng (MWG), CGis cultivated artificially in forms and contributes the majorquantity of ginseng in the current market, MWG grows inthe natural environments, vegetating in the deep mountainsand MCG can be considered as mimicry wild ginsengwhich is seeded in plan but transferred to and grown upin the forest and mountain[3]. Normally CG is harvestedafter 5–6 years cultivation, MCG is collected ant the agesof 10–20 years or more, and MWG of exact ages is notclear, but judged by the morphologies. Although the sameLatin name, Radix Ginseng, is given for all the above men-tioned ginseng, their disparity in value on the market is
D. Liu et al. / Journal of Molecular Structure 883–884 (2008) 228–235 229
remarkably great, almost more thousands times among ofthem, as the eastern people believe that consumption ofMWG of more than hundred ages can elongate life ofhuman being. Persistent harvest of long-lived, slow-matur-ing species can have negative impacts on populationgrowth rates [4]. Especially MWG became very rare asthe amounts decreasing significantly during recent dec-ades. For protecting MWG populations in China, the lawshave been promulgated that picking MWG is not permit-ted. Despite of not real wild ginseng, transplanting gin-seng in the mountain and grown in the forest naturalenvironment became the second choice to chase for thebig marketing of wild ginseng. The traditional approachof distinguishing the CG, MCG and MWG was to checktheir morphological difference from each other or counttheir remaining stem scar on the rhizomes, by experiencedginseng farmer or handicraftsman, which was obviouslydepended on the subjective judgment. The modern analyt-ical technologies such as thin-layer chromatography(TLC) [5], high-performance liquid chromatography(HPLC) [6], and tandem instrumentation of liquid chro-matography with mass spectrometry (LC/MS) [7] etc. wereapplied to identify and differentiate the ginseng crude drugand products based on the chemical components such asginsenosides.
But unfortunately, all of these methods have the disad-vantage of a time-consuming sample procedure and thedestruction of the hundred milligram sample, which isextremely expensive, especially for MWG. Even more,CG, MCG and MWG are quite similar in their chemicalingredients of ginsenosides and could not be discriminatedfrom each other by the chromatographic methods. So aquick, applicable and non-destructive analysis method isurged for authentication of CG, MCG and MWG at thismoment.
Fourier transform infrared spectroscopy (FT-IR) hasbeen most widely used and well established tools for struc-ture elucidation and quality control in various industriesapplication. This technique has also gradually entered intothe identification and classification of natural productslike herbal [8], microorganism [9] and food [10] etc. Theobvious advantage of FT-IR application to discriminatedifferent natural products was not only effective and spec-ificity, but rapid and non-separative. Combining the pro-cessing of chemometrics such as derivative IR spectra,the derivative of the spectrum slope which can enhancethe spectral resolution, and two-dimensional correlationinfrared spectroscopy(2D-IR), it consists of multi-stepsinfrared macro-fingerprint analysis to tackle the solutionof herbal production identification. Sun’s group [11–15]had comprehensively researched in this area and provedFT-IR was one of useful and powerful tools to conductout the non-destructive identification of expensive andprecious objects. In this paper, we will discuss the methodestablished by FT-IR, two secondary derivative IR spec-troscopy and 2D-IR, as well as hierarchical cluster analy-sis to discriminate CG, MCG and MWG.
2. Experiment
2.1. Apparatus
Spectrum GX Fourier transform-infrared spectroscopy(FT-IR) spectrometer (Perkin-Elmer), equipped with aDTGS detector. IR spectra were recorded from an accu-mulation of 32 scans in 4000–400 cm�1 range with a reso-lution of 4 cm�1. Programmable temperature controller(Model 50-886, Love Control Corporation).
2.2. Samples
Six CG, nine MCG and eleven MWG were purchasedand obtained from ginseng companies of Xinbin and Huai-ren, Liaoning province, China; and all ginseng sampleswere identified by Dr. Hong Xu, Shanghai University ofTraditional Chinese Medicine, the vouchers are depositedin the herbarium of Shanghai University of TraditionalChinese Medicine.
Starch and Calcium Oxalate were purchased fromNational Institute for the Control of Pharmaceutical andBiological Products.
2.3. Procedure
The dried roots and rhizomes of Panax ginseng C.A.
Meyer were pulverized into fine powder of over 200mesh, and then 2–4 mg of sample blended with KBrpowder, ground again and pressed into a tablet. Afterthat, the IR spectra of all samples were collected, respec-tively. The tablet was put into the sample pool with tem-perature controller and the IR spectra was recorded atroom temperature and the dynamic spectra at differenttemperatures from 50 to 120 �C at interval of 10 �C withthe rate of temperature increasing of 2 �C/min. 2 D-IRcorrelation spectra were obtained by treatment of theseries of temperature-dependent dynamic spectra with a2D-IR correlation analysis software programmed byDepartment of Chemistry of Tsinghua University, Bei-jing, China.
2.4. Data processing and statistical methods
The raw data of FT-IR was processed with on-linePE spectrum software of PerkinElmer FT-IR spectrome-ter. And the second derivative IR spectra were obtainedafter baseline correction, normalization and 13-pointsmoothing of the original IR spectra, and saved asASC format.
SPSS 13.0 software was used to perform the hierarchicalcluster analysis. The regions of 1630–1600, 1400–1300 and1220–900 cm�1 were selected for cluster processing, savedas ASC format. The Between-groups Linkage and SquaredEuclidean Distance are applied to obtain the results of hier-archical cluster analysis.

230 D. Liu et al. / Journal of Molecular Structure 883–884 (2008) 228–235
3. Results and discussion
3.1. IR spectra analysis
The IR spectra of Mountain Wild Ginseng (MWG),Mountain Cultivated Ginseng (MCG) and Cultivated Gin-seng (CG) under a room temperature is shown in Fig. 1. Asa kind of macro-fingerprinting feathers of natural productcomplex, several characters can be extracted, such as, thestrongest peak at 3420 cm�1 belonged to the stretchingvibration of O–H groups, the peak at 2928 cm�1 assignedto the stretching vibration of –CH2– groups, the peak at1740 cm�1 is due to the stretching vibration of C@Ogroups in the volatile oils and other compounds embodyingcarbonyl group[16], and the stronger peaks in the range of1200–1000 cm�1 mainly attributed to the stretching vibra-tion of C–O, which displayed the characteristic absorptionsof polysaccharides and starch.
Although the spectra of CG, PMG and MWG wasrather similar, some differences in the shape or intensitycan be observed. For example, the intensity of peak at1049 cm�1 is the highest in the range of 1200–1000 cm�1
in MWG(Fig. 1a) and MCG(Fig. 1b), comparing to thebiggest peak at 1017 cm�1 of CG (Fig. 1c) in the corre-sponding region. In addition, a very strong peak at1318 cm�1 appeared in MCG and MWG while the relativepeak disappeared in CG. A sharp peak at 1628 cm�1 stoodin MWG and MCG, but an arched peak at 1658 cm�1
existed in CG. Moreover, the obvious difference can beseen the intensity of the carbonyl peak about 1740 cm�1
among three samples, the highest peak appears at1740 cm�1 in MCG and at 1735 cm�1 in MWG, howeververy weak peaks at same position in CG, and the situationwas reversed at 926 cm�1 and 863 cm�1, which belonged tothe vibration of carbohydrate ring [17]. The intensity orderof these peaks was CG > MCG > MWG.
3.2. Secondary derivative IR spectroscopy
Generally, second derivative infrared spectrum canobviously enhance the spectral resolution and amplify tiny
Fig. 1. The FT-IR of the radix of Panax ginseng C
differences in IR spectrum. The secondary derivative spec-tra of MWG, MCG and CG are shown in Fig. 2. Severaloverlaying peaks in FT-IR spectra become clearer fromthe derivative spectrum. Especially, the characteristic peaksof the relative contents of carbohydrate as the peaks nearat 923, 892 and 761 cm�1 are differentiated, which assignedto the absorption band of carbohydrate I, II and III,respectively [17]; the peaks at 1622, 1317, 780 and517 cm�1 belonged to the characteristic peaks of calciumoxalate, in Fig. 4 [18]; meanwhile, the peak at 1749 cm�1
contributed from carbonyl group become legible.In the range from 1160 to 990 cm�1, there are the peak
groups due to all kinds of the stretching vibration of C–O–C. An obvious peak at 1126 cm�1 in CG is shown, which isinvisible at the corresponding position in MCG and MWG.The second derivative infrared spectrum of CG and starchare figured out in Fig. 3a and b. The shapes and positionsof the main peaks of CG are rather similar to starch, espe-cially the peak at 1126 cm�1. According to the reference[18], the results suggested that the relative amount of starchin CG is greater than that in MCG and MWG. In addition,the relative intensity of the peaks at 1160, 1079 and990 cm�1 have much difference among of CG, MCG andMWG, which the peak at 1079 cm�1 in CG was the stron-gest peak in these peaks, but in MCG, the strongest peakwas the one at 990 cm�1, and the intensity of these threepeaks in MWG was resemble.
The other distinctive evidences can be found in the peakgroups of calcium oxalate contents in CG, MCG andMWG. As mentioned above, the characteristic peaks of1622, 1317, 780 and 517 cm�1 revealed the relative contentsof calcium oxalate in ginseng (Fig. 4a and b). The informa-tion from Figs. 2 and 4 explored that much calcium oxalatecrystal contents in MWG, fewer in MCG, and fewest inCG [18]. Furthermore, the same orderliness representativepeaks at 1749, 1678 cm�1 assigned to the carbonyl andthose at 1458, 1370 cm�1 attributed to the bending vibra-tion of methyl and methylene groups. The peak at1749 cm�1 is attributed to the carbonyl group (C@O) ofsaturated fatty acid and ester in ginseng [19]. Hence, therelative contents of fatty acid and ester in three kinds of
.A.Meyer : (a) CG, (b) MCG and (c) MWG.

Fig. 2. Second derivative spectra of the radix of Panax ginseng C.A.Meyer : (a) CG, (b) MCG and (c) MWG.
Fig. 3. Second derivative spectra of CG (a) and starch (b).
Fig. 4. Second derivative spectra of MWG (a) and calcium oxalate (b).
D. Liu et al. / Journal of Molecular Structure 883–884 (2008) 228–235 231
ginseng can deduce most in MWG, least in CG, and med-ium in MCG based on their peak intensities of 1749 cm�1
in Fig. 2. The reason of a strongest peak at 1160 cm�1
shown in MWG can get an explanation as well, which thispeak generated from the C-O vibration of saturated fattyacid and ester [20].
232 D. Liu et al. / Journal of Molecular Structure 883–884 (2008) 228–235
3.3. Two-dimensional correlation infrared spectroscopy
As a rule, two-dimensional IR spectrum remarkablyenhances the resolution of spectrum and provides moreinformation of molecular structure and interactions offunctional groups within and between molecules, includ-ing the spectral response sequences, relative intensitychanges, and so on. The correlation peaks in synchro-nous spectrum represent a consistency or commonalityof normal vibration of the related IR vibrations withsome perturbations such as temperature. In synchronousspectrum, the auto-peaks on the diagonal line show theself-correlativity and susceptibility of some normalvibration of functional group with the increasing tem-perature, and the cross peaks located at the off-diagonalposition reveal the relativity of intensity variations of apair of group vibrations corresponding their frequencies.[21,22].
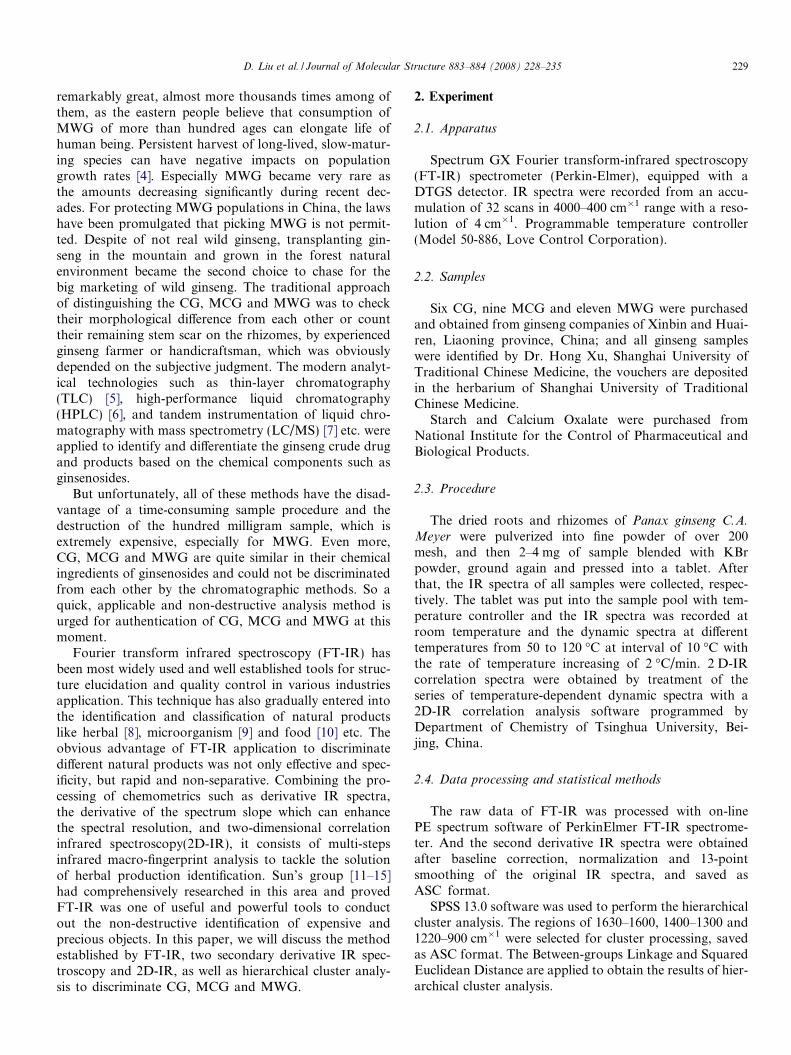
Power spectra of ginseng in the range of 850–1250 cm�1
are shown in Fig. 5, in which nine peaks were named theauto peaks in synchronous spectra and located at the diag-onal position in Fig. 6. The presence of these auto peaksindicated the susceptibility of the IR absorption band toexternal thermal perturbation, which belonged to somefunctional groups embodying C–O or C–H group. Thepeak at 910 cm�1 might correspond to the band vibration
Fig. 5. Power spectra of CG (a), MCG (b) and
of Ar–H, and the peak at 974 cm�1can be assigned as thevibration of C–O–C in cyclane, 1008 cm�1 as the out-of-side bending vibration of C–H in double bonds. The1035, 1098 and 1142 cm�1 might correspond to the C–Ostretching vibrations of cyclane, secondary and tertiary car-bons, respectively [23]. The auto-peaks at 1198 and1224 cm�1 correspond to the C–O stretching vibrationsof lipids and ethers. Furthermore, in Fig. 6, the intensityof auto peaks at 1198 cm�1 in MWG is very strong, thesame as the peak at 1224 cm�1, which can deduced thatthe lipid compositions is sensitive to the temperaturechange in MWG [20].
Synchronous temperature interference 2D correlationIR spectra 1800–1250 cm�1 of three kinds of ginsengs wereconducted out and shown in Fig. 7. The quite differencesexisted legibly from the contour of 2D-IR spectra in theseginsengs. Several variations can be figured out as followingdescription. First, the peak cluster in the spectra of CG wasformed a 6 � 6 with the auto peaks at 1272, 1400, 1467,1510, 1576 and 1654 cm�1, and another 6 � 6 peak clusterin the MCG with the auto peaks at 1295, 1400, 1465, 1561,1647 and 1688 cm�1, but for MWG, a 5 � 5 peak clusterformed with the auto peaks at 1272, 1395, 1455, 1594and 1652 cm�1. Second, the auto peaks in the ranges of1647–1654 cm�1 and 1561–1594 cm�1 were attributed tothe characteristic absorption band I and II of aminophe-
MWG (c) in the region of 850–1250 cm�1.

Fig. 6. Synchronous 2D-IR spectra of ginseng in the range of 850–1250 cm�1: (a) CG, (b) TMG (c) WMG.
D. Liu et al. / Journal of Molecular Structure 883–884 (2008) 228–235 233
nol, respectively [20]. The auto peaks at 1455–1465 cm�1
can be assigned as the bend vibration of methyl groupcapped of amino. Third, the cross peaks analysis demon-strated that three peaks at 1647, 1561 and 1465 cm�1 inMCG (strong),MWG (strong) and CG (weak) existed posi-tive relationship each other, but negative relationship tothe corresponding peaks of the peaks at 1272, 1395 cm�1.Combining to the results of auto peaks and cross peaksof 2D-IR spectra, it was suggested that several kinds ofamino acids might be existence in these ginsengs, even ifno clear corresponding absorption peaks appeared in theraw and secondary derivative IR spectra. Furthermore,
the relative contents of amino acids in three different gin-sengs can conclude most in MWG than in CG andMCG, based on the relative intensities of the characteristicpeaks of amino acids.
3.4. Analysis of the statistical result
The hierarchical cluster analysis is the usual method todiscriminate the different groups within multivariate data[24,25]. A dendrogram is derived from the cluster resultsof the three species of ginseng IR spectra (Fig. 8), whichallowed us to distinguish the three main clusters of CG in

Fig. 7. Synchronous 2D-IR spectra of ginseng in the range of 1250–1800 cm�1: (a) CG, (b) TMG and (c) WMG.
234 D. Liu et al. / Journal of Molecular Structure 883–884 (2008) 228–235
A pane, MCG cluster in B pane and MWG cluster in Cpane. The cluster analysis demonstrated that the threekinds of ginseng can be distinguished clearly from eachother, with an exception of MWG-8, which entered intothe cluster of MCG. It was found that both the raw andsecond derivative IR spectra of MWG-8 were much similarwith the spectra of MCG, especially the strongest peakappearance at 990 cm�1. Summarily, the data processingusing hierarchical cluster analysis can be convenient toclassify and distinguish the ginsengs of CG, MCG andMWG.
4. Conclusion
By using FT-IR, secondary derivative spectra and2D-IR, as well as hierarchical cluster analysis, the dis-crimination of Cultivated Ginseng, Mountain CultivatedGinseng and Mountain Wild Ginseng can be success-fully found. The findings indicated that the relative con-tent of starch in the CG was more than that in MCGand MWG, and the relative content of calcium oxalateand lipids in MWG were greater than that in CG andMCG, and the relative content of fatty acid in MCG

Fig. 8. Hierarchical cluster analysis with FT-IR spectra of MWG, MCGand CG.
D. Liu et al. / Journal of Molecular Structure 883–884 (2008) 228–235 235
was more than that in CG and MWG. As a result, themacroscopic IR finger-print method, including FT-IR,secondary derivative IR and 2D-IR, can differentiatethree kinds of ginsengs rapidly, effectively and non-destructively.
Acknowledgements
This work was financially supported by the Science &Technology Commission of Shanghai Municipality(04DZ19834), China. The authors thank Professor Jia-Xun Tao, Professor Qun Zhou and Dr. Hong-Xia Liufor their kind assistances.
References
[1] A.S. Attele, J.-A. Wu, C.-S. Yuan, Biochem. Pharmacol. 58 (1999)1685–1693.
[2] L.J. Hofseth, M.J. Wargovich, J. Nutr. 137 (2007) 183S–185S.[3] Committee of National Pharmacopoeia, Pharmacopoeia of People’s
Republic of China, Chemical Industry Press, Beijing, 2000, p. 6.[4] M.E. Voorta, J.B. McGrawb, Biol. Conserv. 130 (2006) 505–516.[5] Q. Chi, J. Guo, O. Dang, China J. Chin Mat. Med. 17 (1992) 478–
480, 511.[6] W. Shi, Y.T. Wang, J. Li, H. Zhang, L. Ding, Food Chem. 102 (2007)
664–668.[7] F. Nicola, J. Chromatogr. B 812 (2004) 119–133.[8] H.X. Liu, S.Q. Sun, Modern Instrum. 11 (2005) 6–10.[9] K. Maquelin, C. Kirschner, L.-P. Choo-Smith, J. Microbiol. Methods
51 (2002) 255–271.[10] L.M. Reid, C.P. O’Donnell, G. Downey, Trends Food Sci. Technol.
17 (2006) 344–353.[11] Q. Zhou, S.Q. Sun, L. Zuo, Vib. Spectrosc. 36 (2004) 207–212.[12] Y.M. Li, S.Q. Sun, Q. Zhou, J.X. Tao, I. Noda, Spectrochim. Acta
Part A 63 (2006) 565–573.[13] L. Yu, S.Q. Sun, K.F. Fan, Q. Zhou, I. Noda, Spectrochim. Acta Part
A 62 (2005) 22–29.[14] H.X. Liu, S.Q. Sun, G.H. Lv, K.K.C. Chan, Spectrochim. Acta Part
A 64 (2006) 321–326.[15] S.-Q. Sun, Q. Zhou, Z. Qin, Atlas of Two-dimensional Correlation
Infrared Spectroscopy for Traditional Chinese Medicine Identifica-tion, Chemical Industry Press, Beijing, 2003.
[16] J.C. Yan, H. Zhang, J. Instrum. Anal. 13 (3) (1994) 46–50.[17] K. Nakanishi, P.H. Solomon, Infrared Absorption Spectroscopy,
Holden-Day Inc., 1977.[18] Y.-M. Li, S.-Q. Sun, Q. Zhou, Vib. Spectrosc. 36 (2004) 227–232.[19] X.-Q. Ma, Q. Xu, S.-P. Fu, H.-B. Xiao, X.-M. Liang, Res. Pract.
Chin. Med. 18 (2004) 13–16.[20] J.-X. Xie, Appliance of FT-IR in Organic Chemistry and Medicinal
Chemistry, Science Press, Beijing, 2002.[21] I. Noda, Appl. Spectrosc. 47 (9) (1993) 1329.[22] I. Noda, J. Am. Chem. Soc. 111 (1989) 8116.[23] Q. Zhou, S.-Q. Sun, Y. Lu, C.-H. Xu, I. Noda, J. Mol. Struct. 799
(2006) 77–84.[24] F. Guibet, C. Amiel, P. Cadot, C. Cordevant, M.H. Desmonts, Vib.
Spectrosc. 33 (2003) 133–142.[25] L.X. Yi, R.L. Yu, Handbook of Analytical Chemistry –Chemomet-
rics, Chemical Industry Press, Beijing, 2002.