diffusion of additive manufacturing in gauteng, south africa
TRANSCRIPT

Diffusion of additive manufacturing in Gauteng,
South Africa
Daniel Kunniger
41376033
A research project submitted to the Gordon Institute of Business
Science, University of Pretoria in partial fulfilment of the requirements
for the degree of Master of Business Administration.
9 November 2015
ii | P a g e
Abstract
This study aimed to determine the status of additive manufacturing within the Gauteng
province of South Africa and identify factors that are motivating or prohibiting its uptake.
The existing problem is that the South African manufacturing sector has experienced
poor growth resulting in a contribution of 12 percent of GDP for the year 2014 (down
from 19% in 1993). The comparatively poor performance of the manufacturing sector
indicates its potential fragility and that some sort of intervention may be required. Experts
are anticipating the global impact of additive manufacturing to be $550 billion by 2025
and as such, this could provide a solution. However, there is little information available
about the adoption of additive manufacturing within South Africa.
A concurrent procedure mixed-method design intent on converging cross-sectional data
was applied throughout this research. This enabled a comprehensive analysis of the
possible constructs that affected the diffusion of additive manufacturing. A random-
cluster sampling technique was applied which made use of a survey to sample reality.
The current state was evaluated based current theories of diffusion of innovation. It was
evident that diffusion of additive manufacturing is occurring within the sample cluster
however, a significant shortage of accurate information and knowledge is influencing the
rate of diffusion. The research also found advertising to affect respondent’s view of
machine cost, opinion over machine brand and machine capability however, no dominant
technology was found in the within the cluster. Information obtained from the survey was
compiled with existing data to produce a Bass Model for the adoption of additive
manufacturing machines within South Africa. The model predicts that the market will
reach its full potential by 2040 with a peak in annual grow in 2023. The report concludes
with a model incorporates existing theoretical frameworks and factors that are motivating
or prohibiting the adoption of additive manufacturing.

iii | P a g e
Keywords
Additive manufacturing, Adoption, Diffusion, Innovation.

iv | P a g e
Declaration
I declare that this research project is my own work. It is submitted in partial fulfilment of
the requirements for the degree of Masters of Business Administration at the Gordon
Institute of Business Science, University of Pretoria. It has not been submitted before for
any degree or examination in any other University. I further declare that I have obtained
the necessary authorization and consent to carry out this research.
……………………………………………………………..
(Signature of Candidate)
…9…day of…November...year…2015…

v | P a g e
Acknowledgements
I would like to thank:
Professor David Walwyn for all his assistance, guidance and willingness thought the
research process.
All the staff at the Gordon Institute of Business Science for all their support
throughout my period of study.
Finally, my family and friends without whom none of this would have be possible.

vi | P a g e
Table of Contents
Abstract ...................................................................................................................... ii
Keywords ....................................................................................................................iii
Declaration..................................................................................................................iv
Acknowledgements .................................................................................................... v
List of figures ............................................................................................................. x
List of tables ..............................................................................................................xii
1 Introduction to research problem ...................................................................... 1
Introduction .................................................................................................. 1
Context: Manufacturing in Gauteng ............................................................ 2
Research Problem ........................................................................................ 5
Research Objectives .................................................................................... 5
2 Theory and literature review .............................................................................. 7
Introduction .................................................................................................. 7
Definition of Innovation ............................................................................... 7
Diffusion of Innovation ................................................................................ 7
Technology Acceptance Model ..................................................................11
United Theory of Acceptance and Use of Technology .............................11
Abernathy-Utterback Model ........................................................................11
Technology, Organization and Environment Framework .........................12
Bass Model ..................................................................................................13
The Bass Model principle .........................................................................14
Bass Model parameters ...........................................................................16
Additive Manufacturing ..............................................................................19
Additive manufacturing technology ...........................................................20
International adoption of additive manufacturing ......................................22
Adoption of additive manufacturing within South Africa ............................24

vii | P a g e
3 Research Questions ..........................................................................................27
Introduction .................................................................................................27
Research Questions ...................................................................................27
Question one ............................................................................................27
Question two ............................................................................................27
Question three..........................................................................................28
Question four ...........................................................................................28
4 Research Methodology and Design .................................................................29
Introduction .................................................................................................29
Research Design .........................................................................................29
Population and Unit of Analysis.................................................................32
Sample Method and Size ............................................................................33
Data Collection Instrument .........................................................................34
Research Process .......................................................................................34
Data Analysis ..............................................................................................35
Potential Research Constraints and limitations .......................................36
5 Results ...............................................................................................................37
Introduction .................................................................................................37
Question 1 ...................................................................................................39
How much adoption is occurring?.............................................................39
At what level of penetration is the adoption occurring? .............................40
When are companies adopting additive manufacturing? ..........................40
Which manufacturing sub-sectors are adopting additive manufacturing? .41
How interested are companies in additive manufacturing? .......................42
Are companies aware of different technologies and do they have sufficient
knowledge of them? ............................................................................................42
Question 2 ...................................................................................................43
Is there a perceived dominant technology? ..............................................43
Is there a reason for a technology to be seen as dominant?.....................43
Question 3 ...................................................................................................44
Is there a preferred technology for the respondents operating domain? ...44

viii | P a g e
What are the financial implications of additive manufacturing? .................45
Are companies sufficiently exposed to allow an adoption decision to be
made?............ .....................................................................................................46
Are there sufficient equipment providers in the industry to create confidence
in adopting?....... ..................................................................................................47
Are the required materials available in the additive manufacturing
industry?......... .....................................................................................................47
Is additive manufacturing capable of manufacturing companies existing
products?...... .......................................................................................................48
Do all stakeholders have the same opinion of additive manufacturing? ....49
Question 4 ...................................................................................................50
Does the brand affect the adoption of additive manufacturing? ................50
Does advertising affect the price sensitivity of companies entering the
additive manufacturing industry? .........................................................................51
Are additive manufacturing machines seen as durable purchases? .........52
Do you see the company as an innovator or an imitator? .........................53
6 Discussion of Results .......................................................................................54
Introduction .................................................................................................54
Question 1 ...................................................................................................54
Question 2 ...................................................................................................57
Question 3 ...................................................................................................58
Question 4 ...................................................................................................62
7 Conclusion .........................................................................................................67
Introduction .................................................................................................67
Principle Findings .......................................................................................67
Implications for Management .....................................................................71
Limitations of the Research .......................................................................72
Suggestions for the Future .........................................................................73
References .................................................................................................................74
Appendices ................................................................................................................81
Appendix A: Research questionnaire ..................................................................81

ix | P a g e
Appendix B: Advantages and disadvantages of additive manufacturing .........86
Appendix C: Bass Model Parameters for eleven consumer durable products .87
Appendix D: Bass Model Parameters for various consumer durable products 88
Appendix E: Operationalized question data types ..............................................90
Appendix F: Ethical clearance approval ..............................................................91
x | P a g e
List of figures
Figure 1. 1: Relative provincial contribution to South African Gross Domestic Product,
Statistics South Africa (2014). ...................................................................................... 3
Figure 1. 2: Provincial manufacturing activity at 2010 prices Statistics South Africa
(2014). .......................................................................................................................... 3
Figure 2.1: The diffusion process (Rogers 2003, p.37) ................................................. 9
Figure 2. 2: Diffusion of innovation by Oliveira & Martins (2011, p.111). ......................10
Figure 2.3: Abernathy-Utterback model Abernathy (1978), Reproduced as depicted by
Akiike (2013) as the completed model. ........................................................................12
Figure 2.4: The Technology, Organization and Environment Framework as presented by
Oliveira & Martins (2011, p.112). .................................................................................13
Figure 2. 5: The effect on modelled adopters at time t when considering the Bass model
parameter p relative to q..............................................................................................18
Figure 2. 6: Manufactured component cost comparison between additive and subtractive
manufacturing. Reproduced from Conner, et al (2014). ...............................................21
Figure 2.7: Worldwide growth for 3-D printers under $100 000 (Gartner 2013, Cited in
Brown, 2014) ...............................................................................................................23
Figure 2.8: Number of rapid prototyping machines in South Africa (du Preez et al., 2011).
....................................................................................................................................25
Figure 5. 1: Division of respondents into relevant manufacturing sub-sectors. .............41
Figure 5. 2: Primary material used by manufacturing companies according to their
respective representatives. ..........................................................................................42
Figure 5. 3: Most popular evaluation criterion for additive manufacturing, Single selection
per respondent. ...........................................................................................................44
Figure 6. 1: Number of rapid prototyping machines in South Africa (du Preez et al., 2011).
....................................................................................................................................55
Figure 6. 2: Abernathy-Utterback model Abernathy (1978), including the proposed
current design line for additive manufacturing relative to cluster respondents opinion. 58
Figure 6. 3: Bass model based on parameter estimate by similar product (Stores with
retail scanners). ...........................................................................................................63
Figure 6. 4: Bass model based on parameter estimate from the differential equation. .65
Figure 6. 5: Bass model based on parameter estimate from the differential equation with
smoothed historic data. ...............................................................................................65

xi | P a g e
Figure 7. 1: Integration of innovation and adoption theory with the research findings. .68
Figure B. 1: Additive manufacturing technology's advantages and disadvantages from a
technological perspective (Weller et al., 2015). ...........................................................86
Figure B. 2: Additive manufacturing advantages and disadvantages from an economic
perspective (Weller et al., 2015). .................................................................................86

xii | P a g e
List of tables
Table 1. 1: Total population by province, Census 1996, 2001, 2011, Statistics South
Africa (2012). ................................................................................................................ 2
Table 5. 1: Research question to operationalized question linking. ..............................38
Table 5. 2: Respondents hindering and motivating factors for additive manufacturing as
a value-add. ................................................................................................................40
Table 5. 3: Key words in context with respect to respondent’s motivation for cost
associated with components manufactured using additive manufacturing versus
traditional methods. .....................................................................................................45
Table 5. 4: Respondents estimated additive manufacturing machine cost relative to the
primary raw material used by the company. ................................................................46
Table 5. 5: Number of occurrences of key words in context with respect to respondents
reasoning for their ability to motivate for or against adoption of additive manufacturing.
....................................................................................................................................46
Table 5. 6: Key word in context related to anticipated material supply chain challenges
when shifting to additive manufacturing. ......................................................................47
Table 5. 7: Key concepts derived from respondents believes regarding additive
manufacturing’s capabilities relative to traditional methods. ........................................48
Table 5. 8: Key constructs produced by respondents relative to shared or differing
stakeholder opinions and the respondents expectation of the stakeholder opinion unity
affecting additive manufacturing technology adoption. ................................................49
Table 5. 9: Additive manufacturing advertising relative to involvement with additive
manufacturing. ............................................................................................................50
Table 5. 10: Additive manufacturing advertising relative to belief that additive
manufacturing machine cost is more important than capability. ...................................51
Table 5. 11: Additive manufacturing advertising relative to respondent willingness to pay
more for a brand name machine over a no-name machine. .........................................52
Table 5. 12: Key constructs proposed by respondents with regard to the determination
of when to replace an additive manufacturing machine. ..............................................53
Table C. 1: Bass Model input parameters for eleven consumer durable products (Bass
2004a, p.1828). ...........................................................................................................87
Table D. 1: Parameters of the Bass model in several product categories based on
penetration data and long series data (Lilien et al, 1999).............................................88

xiii | P a g e
Table D. 2: Parameters of the Bass model in several product categories based on
penetration data and short series data (Lilien et al, 1999). ..........................................89
Table E. 1: Data types of operationalized questions. ...................................................90
1 | P a g e
1 Introduction to research problem
Introduction
Additive manufacturing more commonly known as 3-D printing has been publicized as a
potentially disruptive technology that if adopted could see rapid diffusion among
consumers and manufacturers. Besides it ability to produce items previously impossible
to manufacture, it enables on-demand production which has large implications for supply
chains and stock warehousing which are both significant cost drivers of consumables
(Manyika, Chui, Bughin, Dobbs, Bisson and Marrs, 2013).
The additive manufacturing market had an estimated value of $3.07 billion worldwide in
2013, up 34.9 percent from 2012 (Thilmany, 2014). According to Geelhoed (2014), key
patents expired in February of 2014 and further patents on the technology are expiring
in the near future, thus the market is set for potential rapid expansion. So much so, that
Canalys (2014), a market research firm, has predicted the market to grow to a value of
$16.2 billion in 2018. Cohen, Sargeant, & Somers (2014) state that McKinsey Global
Institute research suggested that additive manufacturing could have a global impact of
$550 billion a year by 2025. In 2014, President Obama announced two new
manufacturing innovation institutes supported by a $140 million federal commitment
combined with more that $140 million in non-federal resources. This is just two of the
envisioned 45 manufacturing innovation institutes that will help ensure America’s future
inclusion in the advanced manufacturing sector (The White House, 2014).
While the additive manufacturing market is showing growth, the Small Enterprise
Development Agency (2012) indicated that the South African manufacturing sector has
reduced from 19 percent of Gross Domestic Profit in 1993 to 17 percent in 2010.
Statistics South Africa (2015b); consistent with the figures of the Small Enterprise
Development Agencies historic statistics; indicated that the manufacturing industry has
experienced poor growth resulting in a contribution of 12 percent of Gross Domestic
Profit for the year 2014 (R379 billion at 2010 prices). Thus, the comparatively poor
performance of the manufacturing sector indicated it potential fragility and that some sort
of intervention may be required. However, there is potential scope for improvement.
According to Statistics South Africa (2015a), South Africa has been a net importer since
August 2013 indicating that demand for products has exceeded local supply or that South
Africa’s manufacturing sector has lost its ability to be competitive. One example of this

2 | P a g e
is the motor industry, which imports 70% more than what they do export (Small
Enterprise Development Agency, 2012). Thus, it is critical to ensure South Africa has
both the capability to manufacture demanded products as well as manufacture at
internationally competitive rates if we are to see a revival of the manufacturing sector.
“Technology change is one of the principal drivers of competition. It plays a major role in
industry structural change, as well as in creating new industries. It is also a great
equalizer, eroding the competitive advantage of even well-entrenched firms and
propelling other to the forefront” (Porter, 2007, p.60). With the additive manufacturing
sector set for rapid growth South Africa has the opportunity to reinvent its manufacturing
industry through the adoption of additive manufacturing. Additive manufacturing could
provide South African manufacturers with the ability to become competitive in the global
manufacturing market through new, more advanced manufacturing capability.
Context: Manufacturing in Gauteng
South Africa is divided into nine provinces of which 1.2% by land area makes up the
province of Gauteng. By population, with 12.3 million people, it is the largest, most
densely populated and fastest growing province. Table 1. 1 provides details on provincial
population.
Table 1. 1: Total population by province, Census 1996, 2001, 2011, Statistics South Africa (2012).
Gauteng is South Africa’s biggest contributor to the Gross Domestic Product with a
contribution averaging 33.8 percent between 1998 and 2013 (Statistics South Africa,
2014). Comparative provincial contributions are shown in Figure 1. 1.
Province Census 1996 Census 2001 Census 2011 Percentage growth 1996-2011
Western Cape 3 956 875 4 524 335 5 822 734 47%
Eastern Cape 6 147 244 6 278 651 6 562 053 7%
Northern Cape 1 011 864 991 919 1 145 861 13%
Free State 2 633 504 2 706 775 2 745 590 4%
KwaZulu-Natal 8 572 302 9 584 129 10 267 300 20%
North West 2 727 223 2 984 098 3 509 953 29%
Gauteng 7 834 125 9 388 854 12 272 263 57%
Mpumalanga 3 123 869 3 365 554 4 039 939 29%
Limpopo 4 576 566 4 995 462 5 404 868 18%
South Africa 40 583 572 44 819 777 51 770 561 28%

3 | P a g e
Figure 1. 1: Relative provincial contribution to South African Gross Domestic Product, Statistics
South Africa (2014).
Gauteng is also home to South Africa’s largest manufacturing sector, which contributed
R154 billion in 2013 to the national GDP (Statistics South Africa 2014). The contributions
of other provinces can be seen in Figure 1. 2.
Figure 1. 2: Provincial manufacturing activity at 2010 prices Statistics South Africa (2014).
0.0%
5.0%
10.0%
15.0%
20.0%
25.0%
30.0%
35.0%
40.0%P
erc
en
tage
re
lati
ve c
on
trib
uti
on
Provice
1998
2008
2013
R 0
R 50 000
R 100 000
R 150 000
R 200 000
R 250 000
R 300 000
R 350 000
R 400 000
2004 2005 2006 2007 2008 2009 2010 2011 2012 2013
Ran
ds
in m
illio
ns
Year
Limpopo
Mpumalanga
Gauteng
North West
KwaZulu-Natal
Free State
Northern Cape
Eastern Cape
Western Cape

4 | P a g e
However, the South African manufacturing sector is under threat. Mavuso (2014)
indicated that local manufacturing firms have to deal with substantial cost pressures
because of increased wages, input costs and administrative prices. He continued to
advise that reductions in competitiveness because of electricity shortages, currency
volatility, skills constraints and poor productivity further aggravate the situation.
Statistics South Africa (2015c) estimates that the manufacturing sector employs 1.138
million people with a total working population of 8.942 million when excluding the
agricultural and informal sectors. This number is down from its peak in 2006 when the
industry employed 1.33 million people (Small Enterprise Development Agency, 2012).
The economic, industrial and political landscape has seen employer employee
relationships stretched to breaking point. Linked to this was a five-month platinum mine
strike and a four-week strike at steel and engineering firms in 2014, following a
breakdown in wage negotiations.
South Africa’s industrial work force is heavily unionised however, current stress in the
labour market are not limited to employer employee relations. Mbatha and Cohen (2014)
stated “Divisions in the 2.2 million-member Congress of South African trade Unions came
to a head on November 8 when the federation expelled the 350 000 member National
Union of Metalworkers of South Africa for its decision last year not to back the ANC in
elections.” They further indicated that this would be concerning to South Africa’s ruling
African National Congress as these unions have underpinned its dominance since the
end of apartheid.
The South African government has not been oblivious to the problems in the
manufacturing sector and has intervened. Mavuso (2014) explained that the state
introduced The Preferential Procurement Policy Framework Act in 2011, which
empowered the Department of Trade and Industry to designate products that should be
sourced locally. He further indicated that the Industrial Policy Action Plan was built on
the vision of the National industrial Policy Framework by the Department of Trade and
Industry and it is the overarching plan for dealing with the deindustrialisation threat.

5 | P a g e
Research Problem
The existing problem is that there is little information available about the adoption of
additive manufacturing within South Africa and even less at provincial level. If South
Africa is to benefit from the potential market growth this technology could bring, they
need to understand whether individuals and organisations within South Africa are
adopting additive manufacturing and what are the driving and prohibiting factors.
Struab (2009, p.625) with reference to product adoption indicated that “This decision of
whether an individual will adopt a particular technology and the time frame involved with
that decision has been a long source of research across multiple disciplines, and it
influences business, school and everyday life”. If adoption is occurring, it could
dramatically change the competitive landscape of the South African manufacturing
sector. Individuals with little or no knowledge of traditional manufacturing techniques that
take years to master could manufacture advanced products in a short period. High
barriers to entry in some manufacturing markets could be eroded and logistics of
products from factories to point of sale may no longer be relevant. The effect of this
adoption could stretch far beyond the manufacturing sector.
There are many articles discussing the benefits of adopting additive manufacturing like
that of Cohen, Sargeant, & Somers (2014). There are manufacturing comparisons
between additive and traditional techniques (Gill and Kaplas, 2009) as well as articles on
new developments in the field of additive manufacturing (Savage, 2014). However, this
research will address the issue of whether additive manufacturing is being adopted within
the South African manufacturing sector and what is driving or hindering that adoption.
Research Objectives
The aim of this research is to determine whether additive manufacturing is being adopted
in industry and what factors are motivating or prohibiting this technologies uptake.
The proposed research will provide a cross-sectional view of the state of additive
manufacturing in Gauteng thus providing insight for the business community. It can also
be used as an initiating point for future longitudinal studies into the diffusion of additive
manufacturing. The current state will be evaluated based current theories of diffusion of
innovation. These theories will be used to determine the extent to which adoption is
occurring, preferable technologies being adopted and factors that are driving or
6 | P a g e
prohibiting the adoption of additive manufacturing. In addition, this work will also provide
future insight into additive manufacturing by applying the Bass model of innovation
diffusion using insights gained by the developed knowledge pertaining to the current
state of additive manufacturing in Gauteng.
To follow will be a literature review documenting current theories of diffusion of innovation
followed by a review of additive manufacturing.

7 | P a g e
2 Theory and literature review
Introduction
Straub (2009) in review of various adoption and diffusion theories stated that adoption
theories assess an individual and their decision making to accept or reject a particular
innovation. By contrast, diffusion theory seeks to examine the movement of an innovation
through a social system. He provided the useful analogy of adoption theory being the
micro-perspective focused on change in specific contexts while diffusion is the macro-
perspective of the spread of innovation over time. Straub (2009, p.626) stated, “There is
no one model for understanding the processes in which an individual engages before
adopting a new innovation”. Thus, a range of models that have been applied in industry
will be covered in this literature review. Before reviewing various models of innovation
diffusion, it would be appropriate to define innovation.
Definition of Innovation
Rogers (2003, p.38) defines an innovation as “an idea, practice, or object that is
perceived as new by an individual or other unit of adoption”. In the context of this
research it is important to note that Rogers further stated that whether or not the idea is
objectively new as measured by the amount of time past from the first use or invention,
is irrelevant as far as human behaviour is concerned. However, the perceived newness
of the idea determines the individual reaction to it.
Diffusion of Innovation
Straub (2009) suggested that Everett Rogers (1962 cited in Straub, 2009) and
subsequent works had become the most influential work in the area of understanding
how an innovation infiltrates a population. It provided the foundation for understanding
adoption theory. He stated that Rogers theory had not always been easy to apply
however, it has still been used across many disciplines with the intention of
understanding and predicting. His theory had influenced many subsequent theories of
adoption and diffusion.
Rogers (2003, p.31) defined diffusion of innovation as “the process in which innovation
is communicated through channels over time among members of a social system”.
Straub (2009) added that the adoption process was inseparable from the diffusion
process as diffusion described the adoption process across a social system over a period

8 | P a g e
of time. Rogers (2003) referred to the adoption process as the innovation-decision
process. He explained that the innovation-decision process was a five steps process:
1. Knowledge.
2. Persuasion.
3. Decision.
4. Implementation.
5. Confirmation.
This model described the process of how an individual accepted or rejected an
innovation. Rogers (2003) continued to explain that the fundamental elements of
diffusion of innovation were:
1. An innovation (in the proposed research this would be additive manufacturing).
2. Communication through certain channels.
3. Time.
4. Member of a social system.
Rogers (2003, p.37) “These elements are identifiable in every diffusion research study
and in every diffusion campaign or program”. Straub (2009) explained that these
elements described the interaction and combination of individual adoptions, which result
in diffusion. The innovation-decision process affected the time element of the diffusion
model as the five steps usually occur in a time-ordered sequence. Rogers (2003) noted
an exception to this and provided the example of an authority figure ordering an adoption
in which circumstance the decision and implementation preceded the persuasion.
Rogers (2003) segregated innovation adopters based on the time taken to adopt a
technology. He categorized them as follows:
1. Innovators
2. Early adopters
3. Early majority
4. Late majority
5. Laggards
While discussing the various rates of adoption, Rogers (2003) stated that the number of
individuals adopting a new idea resulted in an S-shaped curve when plotted on a
cumulative frequency basis over time. An example of such curve is presented in Figure
2.1. The general form of the S-shaped curve is referred to as the logistic function, which
is defined by the following mathematical equation:
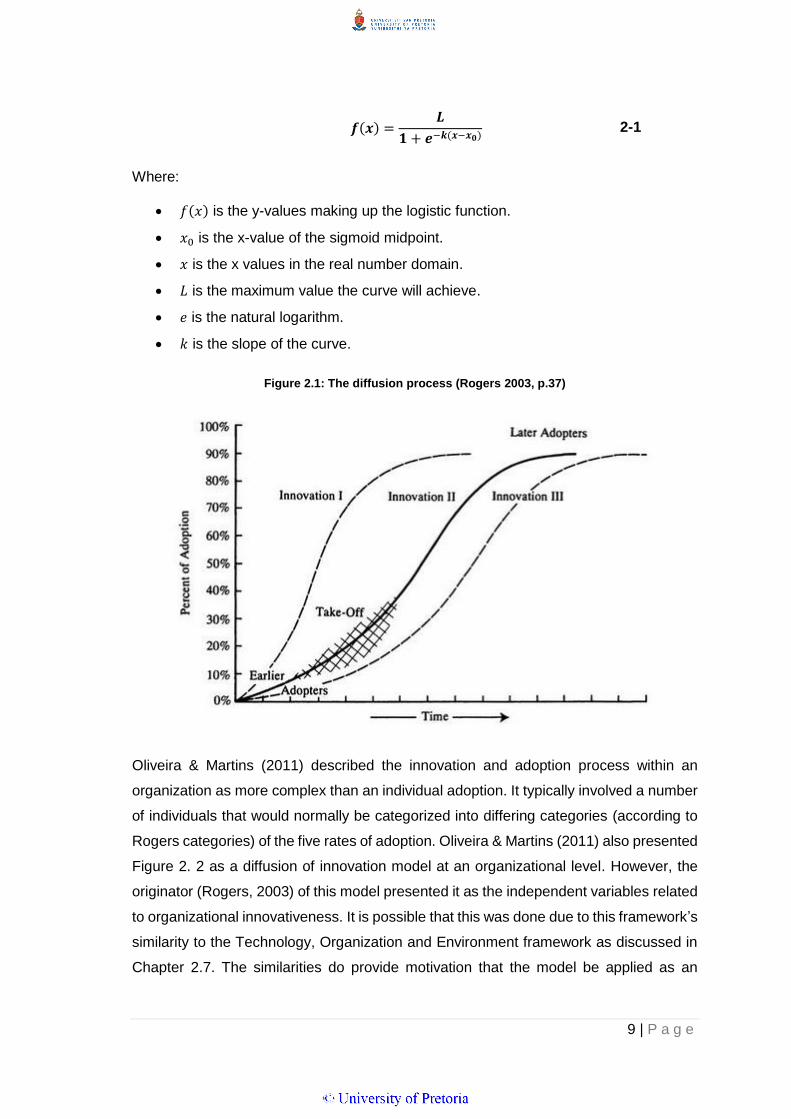
9 | P a g e
𝒇(𝒙) =𝑳
𝟏 + 𝒆−𝒌(𝒙−𝒙𝟎) 2-1
Where:
𝑓(𝑥) is the y-values making up the logistic function.
𝑥0 is the x-value of the sigmoid midpoint.
𝑥 is the x values in the real number domain.
𝐿 is the maximum value the curve will achieve.
𝑒 is the natural logarithm.
𝑘 is the slope of the curve.
Figure 2.1: The diffusion process (Rogers 2003, p.37)
Oliveira & Martins (2011) described the innovation and adoption process within an
organization as more complex than an individual adoption. It typically involved a number
of individuals that would normally be categorized into differing categories (according to
Rogers categories) of the five rates of adoption. Oliveira & Martins (2011) also presented
Figure 2. 2 as a diffusion of innovation model at an organizational level. However, the
originator (Rogers, 2003) of this model presented it as the independent variables related
to organizational innovativeness. It is possible that this was done due to this framework’s
similarity to the Technology, Organization and Environment framework as discussed in
Chapter 2.7. The similarities do provide motivation that the model be applied as an

10 | P a g e
organizational innovation model however; it would require empirical evidence to prove
its accuracy.
Figure 2. 2: Diffusion of innovation by Oliveira & Martins (2011, p.111).
Straub (2009) indicated that the Diffusion of Innovation model was still used in research
either directly or indirectly through its influence. He further indicated that although his
research could not find anything directly contradicting the model, he did have some
concerns. Those concerns were as follows:
1. The depth and breadth of the Innovation of Diffusion theory framework made it
difficult to frame a single case within the structure.
2. The theory was descriptive and not prescriptive thus it did not explain why
adoption occurred but rather how to facilitate it.
3. The Diffusion of Innovation theories applicability to any field may necessitate that
it be customization to suite specific situations.
Individual (Leader) characterisics
Attitude towards change
Internal characterisics of organizational
structure
Centralization
Complexity
Formalization
Interconnectedness
Organizational slack
Size
External characterisics of organizational
structure
System openness
OrganizationInnovativeness

11 | P a g e
Straub (2009) stated that this theories ability to be applied to the formal and informal
adoption environments provided it with distinct advantage.
Technology Acceptance Model
Straub (2009) tells us that Davis’s (1989) research was some of the first research to
study how an individual’s perception of technology innovation affected the eventual use
of that technology. Davis (1989) identified two perceived characteristics that he believed
to be predictors of a technologies adoption. The first was the perceived ease of use of
the technology and the second was the perceived usefulness of the technology. Straub
(2009) believed that Davis’s (1989) work was important as it started the conversation
about the importance of individual perceptions in the adoption of technology.
United Theory of Acceptance and Use of Technology
Venkatesh, Morris, Davis & Davis (2003) conducted a study of the eight most common
theoretical frameworks and models used to understand the adoption of technology. They
then compiled the most noticeable characteristics of all the models to create the United
Theory of Acceptance and Use of Technology. Straub (2009) explained that the
framework consisted of four key determinants of use and four moderators of individual
user behaviour. Key determinants were performance expectancy, effort expectancy,
social influence and facilitating conditions. The individual moderators used were gender,
age, experience and voluntariness.
Straub (2009) questioned the models accuracy, as it was a relatively new model.
Abernathy-Utterback Model
According to Akiike (2013) innovation was seen as an extremely important element in
corporate competition and considerable attention had been paid to it in existing research.
“The Abernathy-Utterback model is a representative model in the field. The Abernathy-
Utterback model shows that many product innovations occur from the initial stage of an
industry to the advent of a dominant design. After the advent of dominant design, a shift
toward process innovations and incremental innovation related to products and
processes takes place” (Akiike, 2013, p.226).
According to Akiike (2013) the Abernathy-Utterback model was formulated through three
separate pieces of work, Utterback and Abernathy (1975), Abernathy and Utterback
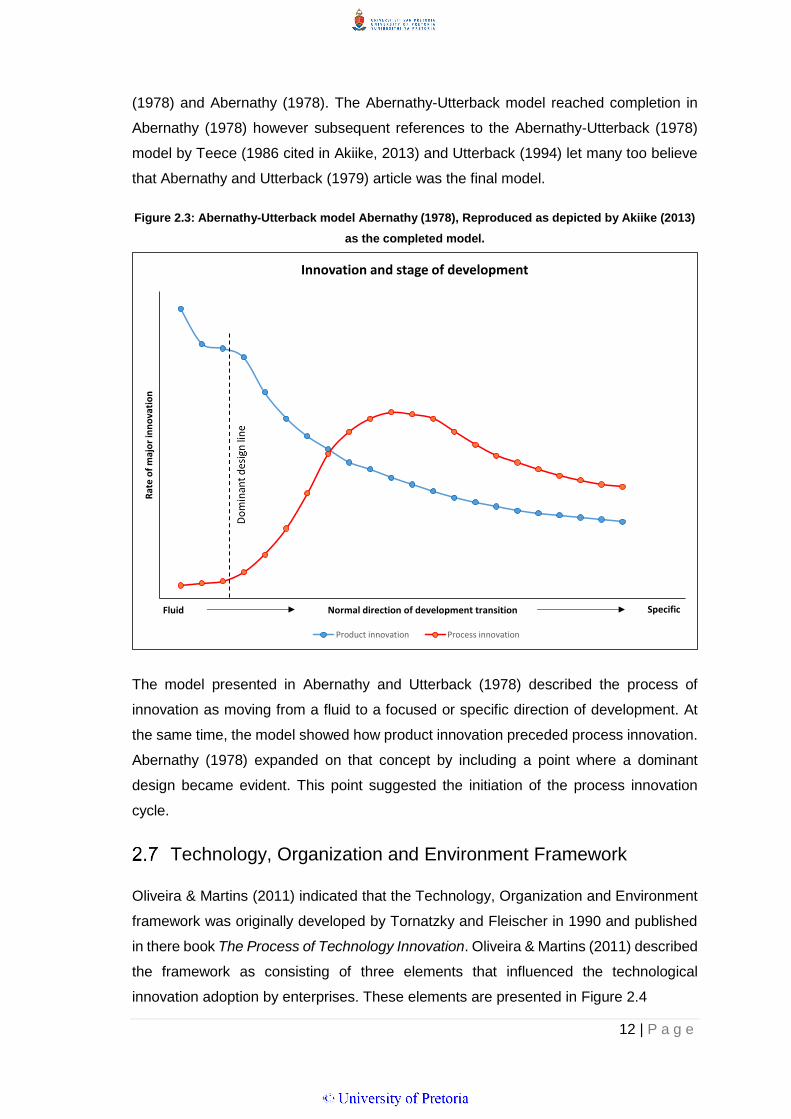
12 | P a g e
(1978) and Abernathy (1978). The Abernathy-Utterback model reached completion in
Abernathy (1978) however subsequent references to the Abernathy-Utterback (1978)
model by Teece (1986 cited in Akiike, 2013) and Utterback (1994) let many too believe
that Abernathy and Utterback (1979) article was the final model.
Figure 2.3: Abernathy-Utterback model Abernathy (1978), Reproduced as depicted by Akiike (2013)
as the completed model.
The model presented in Abernathy and Utterback (1978) described the process of
innovation as moving from a fluid to a focused or specific direction of development. At
the same time, the model showed how product innovation preceded process innovation.
Abernathy (1978) expanded on that concept by including a point where a dominant
design became evident. This point suggested the initiation of the process innovation
cycle.
Technology, Organization and Environment Framework
Oliveira & Martins (2011) indicated that the Technology, Organization and Environment
framework was originally developed by Tornatzky and Fleischer in 1990 and published
in there book The Process of Technology Innovation. Oliveira & Martins (2011) described
the framework as consisting of three elements that influenced the technological
innovation adoption by enterprises. These elements are presented in Figure 2.4
Rat
e o
f m
ajo
r in
no
vati
on
Normal direction of development transition
Innovation and stage of development
Product innovation Process innovation
Fluid Specific

13 | P a g e
Figure 2.4: The Technology, Organization and Environment Framework as presented by Oliveira &
Martins (2011, p.112).
Oliveira & Martins (2011) stated that the Technology, Organization and Environment
framework provided a useful analytical framework that could be used for studying the
adoption of different types of Information technology innovations. They motivated this by
stating that the framework had a solid theoretical base and consistent empirical support.
Oliveira & Martins (2011) provided proof of empirical support of the framework by
providing a list of 16 studies that made use of the Technology, Organization and
Environment framework from 1997 to 2010.
Bass Model
The Bass Model Principle article documented the development of a theory regarding the
timing of an initial purchase for new consumer products (Bass, 2004a). Subsequently it
has become a highly influential paper. So much so, INFORMS members voted it as one
of the top ten most influential papers published in the 50-year history of Management
Science (Bass, 2004b).
After having read Everret Rogers book (1962, cited in Bass, 2004b), Frank Bass decided
to express Rogers ideas using mathematical formula. Bass used Rogers idea of five
categories of adopters (1. Innovators, 2. Early Adopters, 3. Early Majority, 4. Late
Majority and 5. Laggards). He then decided to re-categorize the five classes as

14 | P a g e
innovators (Rogers category 1) and imitators (Rogers category 2 through 5). Bass
(2004a, p.1825) argues: “Apart from innovators, adopters are influenced in timing of
adoption by the pressures of the social system, the pressure increasing for later adopters
with the number of previous adopters”. Beyond the differing categorization, Bass (2004a)
did not contradict Rogers Diffusion of Innovation model.
The growth model developed by Bass founded on the assumption that the probability of
a purchase was linearly proportional to the number of previous buyers (Bass 2004a).
With regard to initial purchases, Bass (2004a, p.1831) stated, “The model implied
exponential growth of initial purchases to a peak and then exponential decay”. Following
the development of the Bass Model, Frank Bass produced growth models for 11
consumer durable products. He validated his results using a Regression test and found
that the data from the durable consumer goods was in good agreement with the
respective models. Bass (2004b) stated that the model was intended for application to
consumer durables. However, application of the model has shown applicability to a much
wider class of products and services and it has become significant in forecasting
Business-to-Business products and services of many categories including telecom
services and equipment, component products such as semiconductor chips, medical
products, and many other technology-based products and services.
Since the original development of the Bass model, subsequent extensions have been
developed (Bass, 2004b). The first extension focused on the diffusion of successive
generations of technology and was developed by Norton and Bass (1987). The second
extension incorporated decision variables into the diffusion model. According to Bass
(2004b), one of the first works to document the extension of a pricing variable was that
of Robinson and Lakhani (1975, Cited in Bass, 2004b). This work was later extended by
Bass & Krishnan (1994) to produce the Generalized Bass Model which incorporated the
shifting of the curve concept. Bass, Gordon, Ferguson & Githens (2001) documented the
planning of DIRECTV, as an example of the Generalised Bass Models application.
The Bass Model principle
Following Bass s’ review of Rogers work, he attempted to develop a mathematical
equation to describe the diffusion of durable products. According to Bass (2004a), this
led to the development of the conditional likelihood of adoption equation (hazard
function). This equation described the likelihood of an adoption at time t as a linear
function of the number of previous adoptions. The conditional likelihood equation as
developed by Bass (2004a, p.1826) is presented as equation 2-2:
15 | P a g e
𝑷(𝒕) = 𝒑 + (𝒒/𝑴)𝑨(𝒕) 2-2
Where:
𝑃(𝑡) is the probability that an initial purchase will be made at T given that no
purchase has yet been made.
𝑝 is the probability of an initial purchase at T=0.
(𝑞/𝑀)𝐴(𝑡) is the pressure operating on imitators as the number of previous
buyer’s increases.
Manipulation of the conditional likelihood function led to the development of the
unconditional likelihood equation as presented in equation 2-3 (Bass 2004a, p.1826).
This equation is in the form of a non-linear differential equation.
𝒇(𝒕)
𝟏 − 𝑭(𝒕)= 𝒑 + 𝒒. 𝑨(𝒕) 2-3
Where:
𝑝 became known as the coefficient of innovation.
𝑞 became known as the coefficient of imitation.
𝑡 represented time from the product launch.
𝑓(𝑡) is the portion of 𝑀 that adopts at time t.
𝑀 is the potential market (the ultimate number of adopters).
𝐹(𝑡) is the portion of 𝑀 that have adopted by time t.
𝐴(𝑡) is the cumulative adopters (or adoptions) at t.
Later Bass manipulated equation 2-3 with the intent of finding a solution to the non-linear
differential equation. The manipulation led to the expression of an equation commonly
referred to as the Bass Model Principle. It is presented in equation 2-4:
𝒇(𝒕)
𝟏 − 𝑭(𝒕)= 𝒑 +
𝒒
𝑴[𝑨(𝒕)] 2-4
Bass (2004b, p.1834) provided the following motivation for his model over existing
models: “As sales of a new product begin to grow exponentially the industry becomes
unrealistically optimistic and extrapolates sales growth into the hereafter, failing to take
into account saturation effects. My point here is that the Bass Model provides a useful
16 | P a g e
framework for viewing the diffusion of new products and technologies so as to permit
realistic guesses about the pattern of sales growth and the timing of the peak in sales”.
It is important to note that the derived equation 2-4 has its limitations. This model does
not include replacement purchases and only focuses on initial purchases.
The Bass Model Principle has the ability to provide valuable insight into the possible
diffusion of products however; it is a function of a set of input parameter. Thus to make
effective use of the model, these parameters need to be clearly understood. The
following section will discuss these input variables and suggested methods for their
selection.
Bass Model parameters
The principle input variables to the Bass Model are:
𝑝 the coefficient of innovation.
𝑞 the coefficient of imitation.
𝑀 the potential market (the ultimate number of adopters).
Lilien & Rangaswamy (2007) stated that there are several methods of determining the
input parameters to the Bass model. These methods could be categorised based on the
reliance of historic data or judgement for calibrating the model. Examples of this would
be the use of linear or non-linear regression if historic sales data is available or analogues
and survey data to determine customer purchase intentions (Judgement method).
Bass presents a method of determining the three input parameters in the original paper
in which he presents his model (Bass 2004a). The method makes use of a discrete
analogue. Bass begins with equation 2-5, which is a manipulated version of the Bass
Model Principle:
𝒂(𝒕) = 𝑴𝒑 + [𝒒 − 𝒑]𝑨(𝒕) −𝒒
𝑴𝑨(𝒕)𝟐 2-5
Where:
𝑎(𝑡) is the adopters at time t.
The analogue is presented as equation 2-6:
17 | P a g e
𝒂𝒕 = 𝒂 + 𝒃𝑨𝒕−𝟏 + 𝒄𝑨𝒕−𝟏𝟐 2-6
Thus, 𝑎 estimates 𝑀𝑝, b estimates 𝑞 − 𝑝 and c estimates −𝑞/𝑚. Therefore:
−𝑴𝒄 = 𝒒,𝒂
𝑴= 𝒑 2-7
Then
𝒒 − 𝒑 = −𝑴𝒄 −𝒂
𝑴= 𝒃, 𝒂𝒏𝒅 𝑴 = (−𝒃 ± √
𝒃𝟐 − 𝟒𝒄𝒂
𝟐𝒄) 2-8
Therefore, parameters p, q and M can be solved. However, this method assumes initial
sales data is available for at least three observations. Bass (2004a, p.1828) provided the
parameters to eleven durable goods he used to evaluate the model. These parameters
are given in Appendix C: Bass Model Parameters for eleven consumer durable products
for comparison purposes.
The Bass Model Principle has been applied substantially since its introduction in1967.
As such, large parameter estimate databases have been created. Bass (2004b, p.1835)
provides an alternative method of parameter estimation in his statement: “the existence
of data of sales histories of previously introduced products and services suggests the
approach of ‘guessing by analogue’ by which the p and q parameters for the new product
are determined by a guess as to which product or products in the database are likely to
be most similar to the new product in diffusion pattern features”. He continued to suggest
that the market potential parameter should be estimated based on known market
characteristics that could be supplemented with intentions data from a survey. Appendix
D: Bass Model Parameters for various consumer durable products provides a substantial
list of short and long data series derived Bass Model parameters used by Lilien,
Rangaswamy and Van den Bulte (1999).
Messiani and Gohs (2015) critically review the selection of Bass Model parameters
applied to new automotive technologies. They reviewed previously applied parameters
as well as the method in which they were determine compared with the models
performance. They had significant conclusions that could be applicable to this work:
1. There was a large discrepancy/ range among ad-hoc parameter estimates.
18 | P a g e
2. Where ad-hoc estimates have been made, the Bass p parameter appears
unstable and is sensitive to the assumed market potential M.
3. When the proposed potential market is not certain, their results show a variation
in results by a factor of up to 100.
4. The Bass p parameter was highly influenced by proposed market potentials
(when the market potential was exogenous), while the q parameter was only
marginally affected.
Messiani and Gohs (2015) also suggested a two-step parameter selection process.
Firstly, select a Bass q parameter value from the Bass Model with exogenous determined
market potential. Secondly, determine the Bass p parameter value given M and q. If there
is insecurity regarding the market potential, determine the p and M values given the q
value simultaneously.
When considering the effects of the Bass parameters, Bass (2004b, p.1827) stated,
“Since for successful new products the coefficient of imitation will ordinarily be much
larger than the coefficient of innovation, sales will attain its maximum value at about the
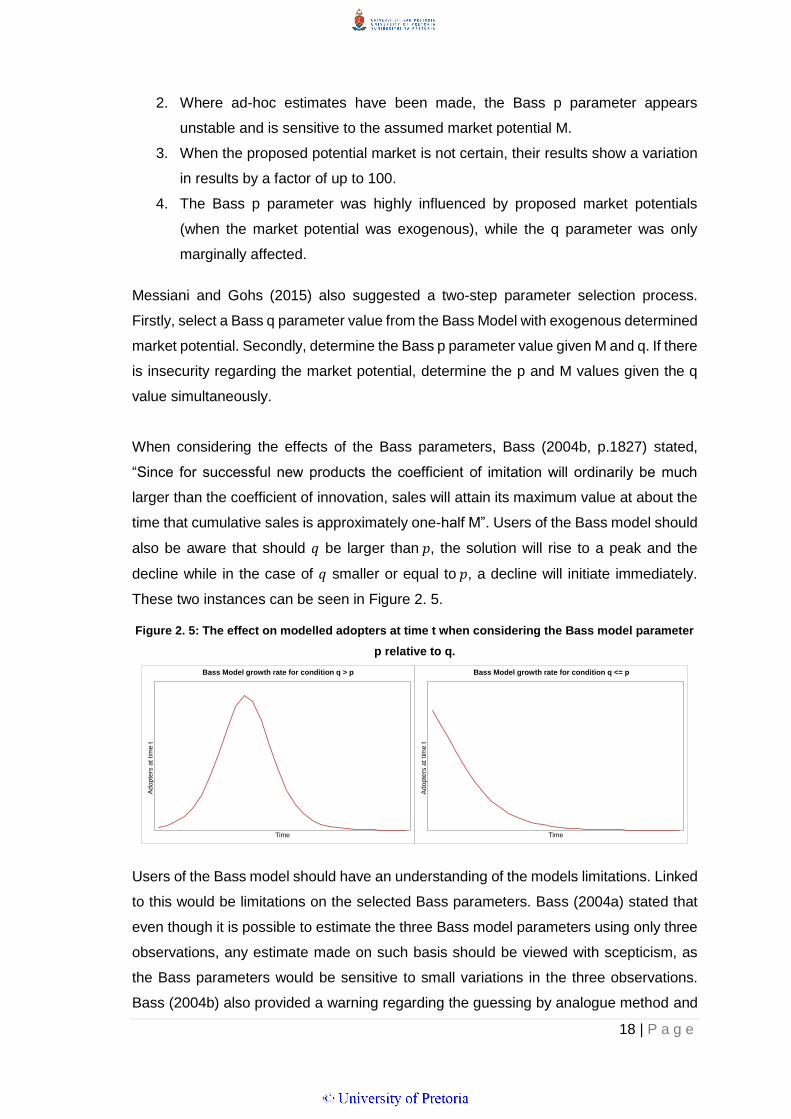
time that cumulative sales is approximately one-half M”. Users of the Bass model should
also be aware that should 𝑞 be larger than 𝑝, the solution will rise to a peak and the
decline while in the case of 𝑞 smaller or equal to 𝑝, a decline will initiate immediately.
These two instances can be seen in Figure 2. 5.
Figure 2. 5: The effect on modelled adopters at time t when considering the Bass model parameter
p relative to q.
Users of the Bass model should have an understanding of the models limitations. Linked
to this would be limitations on the selected Bass parameters. Bass (2004a) stated that
even though it is possible to estimate the three Bass model parameters using only three
observations, any estimate made on such basis should be viewed with scepticism, as
the Bass parameters would be sensitive to small variations in the three observations.
Bass (2004b) also provided a warning regarding the guessing by analogue method and
Adopte
rs a
t tim
e t
Time
Bass Model growth rate for condition q > p
Ado
pte
rs a
t tim
e t
Time
Bass Model growth rate for condition q <= p
19 | P a g e
suggests that users of this method keep in mind that even though the method has been
applied with success, it is still based on a best guess. He further warns that the growth
of the global economy may affect the nature of factors related to multicultural and
international diffusion of new technologies and as such, the model may need revision.
To define the current state of diffusion of additive manufacturing in Gauteng, it was
critical to understand the various diffusion models that have been proposed and applied
in various field but more specifically in the technology. Having reviewed some of the
more relevant models, it was important to understand what is already know about the
additive manufacturing market and how the technology has been diffusing. The following
section will review the available literature on this topic.
Additive Manufacturing
Additive manufacturing is a comparatively new manufacturing technique that has been
possible due to technological developments in the manufacturing industry. Balinski
(2014) indicated that the additive manufacturing industry is actually not a new industry.
It has existed for approximately 25 years. Roth (2014) indicated that the fundamental
principles of additive manufacturing were first demonstrated in 1801 with the invention
of the Jacquard weaving machine (weaved in two planes but built a fabric in a third).
Additive manufacturing has often been associated with Rapid prototyping and was
previously considered a method of producing rapid prototypes. A more recent push
toward production type additive manufacturing equipment has seen these roles reverse.
Rapid prototyping is now considered one application for additive manufacturing
techniques. “Additive manufacturing, also referred to as 3-D printing, involves
manufacturing a part by depositing material layer-by-layer. This differs from conventional
processes such as subtractive processes (i.e., milling or drilling), formative processes
(i.e., casting or forging), and joining processes (i.e., welding or fastening)” (Conner et al.,
2014, p.64).
Balinski (2014) explained that the medical and aerospace industries were the primary
uptakes of the technology for actual production purposes. He further stated that
consolidated parts were driving investment by aerospace companies. Conner et al.
(2014) quoted General Electric’s CEO, Jeff Immelt as having viewed additive
manufacturing as a game changer and that he anticipated GE to be producing over
100,000 additive parts for its LEAP engines by 2020. Adoption of the technology has
20 | P a g e
extended to the point where Loff (2014) told us that in 2014, the National Aeronautics
and Space Administration sent a 3-D printer to the International Space Station and
comparative samples of items made on earth were produced with the intent of paving
the way for future long-term space expeditions.
To follow will be a brief overview of the various technologies that comprise additive
manufacturing as well as a look at the comparative advantages and disadvantages of
this type of manufacturing. Following that will be a review of the adoption of additive
manufacturing at the international and domestic levels.
Additive manufacturing technology
Since its initial invention, additive manufacturing machines have taken many shapes.
Geo & Leu (2013) indicated that since the 1980’s many methods of advanced
manufacturing had been attempted with some having been commercialised. These
include Stereolithography, Fused Deposition Modelling, Selective Laser Sintering,
Laminated Object Manufacturing, 3-D printing and Laser Metal Deposition. Due to the
diversified fabrication methods, a range of materials such as photo-curable resin,
polyamide, wax, acrylonitrile-butadiene-styrene, polycarbonate, metal powders, ceramic
powders and polymer powders have be used. Geo & Leu (2013) provided a few
advantages of additive manufacturing “AM technology allows free form fabrication of
geometrically complex parts without special fixtures as required in material removal
processes. AM processes significantly shorten the lead-time, are cost-effective for single
parts and small batches and can build parts not possible with subtractive manufacturing
techniques”.
Earls and Baya (2014) suggested that the biggest challenge additive manufacturing
faces is in the reduction of manufactured components cost. They stated that additive
manufacturing is still not cost effective for most end-product or high-volume commercial
manufacturing. Conner, et al. (2014) stated that additive manufacture provides high
levels of value when high cost components are being manufactured. They suggest that
a threshold exist after which additional complexity comes at no additional cost when
using additive methods relative to subtractive manufacturing. Figure 2. 6 illustrate this
concept.
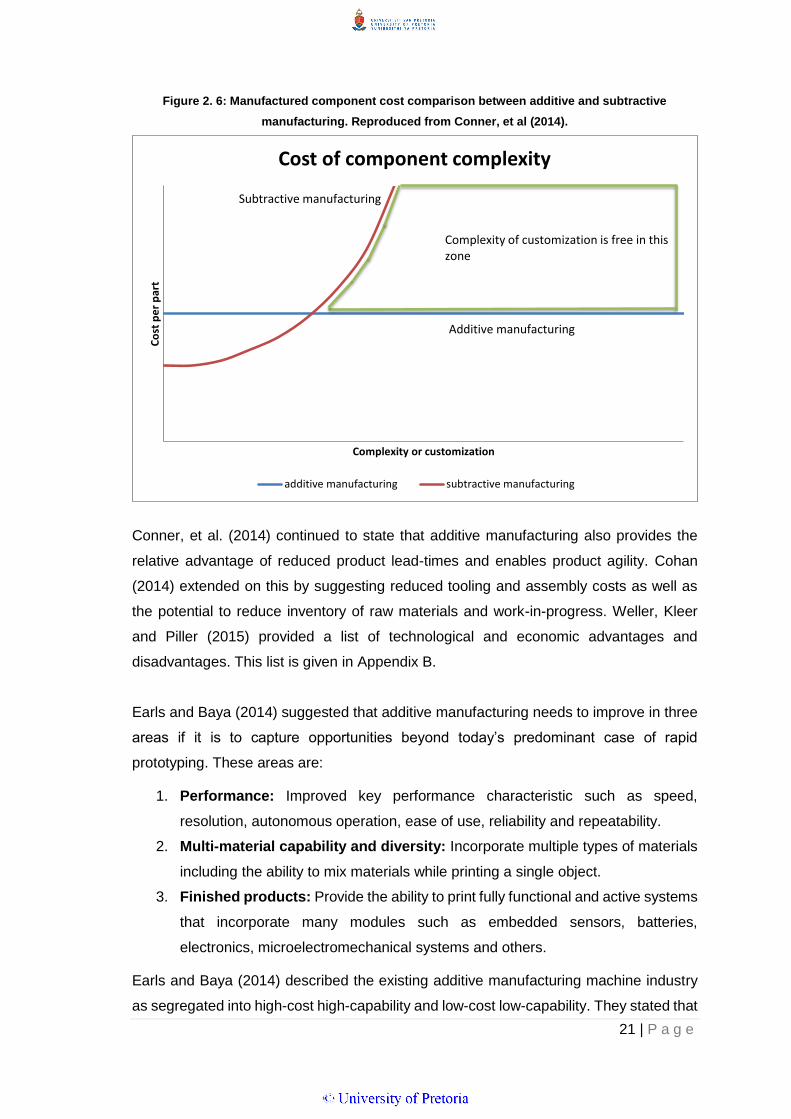
21 | P a g e
Figure 2. 6: Manufactured component cost comparison between additive and subtractive
manufacturing. Reproduced from Conner, et al (2014).
Conner, et al. (2014) continued to state that additive manufacturing also provides the
relative advantage of reduced product lead-times and enables product agility. Cohan
(2014) extended on this by suggesting reduced tooling and assembly costs as well as
the potential to reduce inventory of raw materials and work-in-progress. Weller, Kleer
and Piller (2015) provided a list of technological and economic advantages and
disadvantages. This list is given in Appendix B.
Earls and Baya (2014) suggested that additive manufacturing needs to improve in three
areas if it is to capture opportunities beyond today’s predominant case of rapid
prototyping. These areas are:
1. Performance: Improved key performance characteristic such as speed,
resolution, autonomous operation, ease of use, reliability and repeatability.
2. Multi-material capability and diversity: Incorporate multiple types of materials
including the ability to mix materials while printing a single object.
3. Finished products: Provide the ability to print fully functional and active systems
that incorporate many modules such as embedded sensors, batteries,
electronics, microelectromechanical systems and others.
Earls and Baya (2014) described the existing additive manufacturing machine industry
as segregated into high-cost high-capability and low-cost low-capability. They stated that
Co
st p
er
par
t
Complexity or customization
Cost of component complexity
additive manufacturing subtractive manufacturing
Additive manufacturing
Subtractive manufacturing
Complexity of customization is free in this zone

22 | P a g e
high-end machines targeted enterprises while low-end machines targeted consumers
and hobbyists. However, they continued to state that a new middle class of machines
had started to emerge over the past year. They offered high-end features at low-end
costs. They believed that additive manufacturing products would continue to improve at
a rapid pace over the next few years although the degree and nature of the improvements
would vary across technologies and vendors.
Earls and Baya (2014) ultimately recommended that additive manufacturing be used to
supplement existing methods of manufacturing components and should be used when
items cannot be manufactured any other way.
Many comparative studies have and are being conducted to determine the feasibility of
3-D printing for manufacturing applications. The comparative research by Gill and Kaplas
(2009) concluding that the “proposed RC technologies based on 3-D printing, proved to
be effective for the production of cast technological prototypes, in very short times,
avoiding any tooling phase and with dimensional tolerances that are completely
consistent with metal casting process” was just one of many such studies. Many of these
studies are aiding in the construction of business models that can be used to motivate
adoption of the technology as well as to continue its diffusion.
International adoption of additive manufacturing
Conner et al. (2014) stated that 3-D printing had seen unprecedented attention from the
investment community. This attention reached its pinnacle when President Barack
Obama mentioned 3-D printing in his State of the Union Address in February.
Thilmany (2014) advised that revenue from worldwide additive manufacturing products
and services had increased from $2.3 billion in 2012 to $3.07 billion in 2013, thus
showing an exponential rate of growth. De Jong and de Bruijn (2013) stated that the
additive manufacturing industry had an annual compound growth rate of 26.4% over its
24-year history and that double-digit growth was expected to continue until at least 2019.
Cohen (2014, p.62) stated that additive manufacturing had just started to penetrate the
market with current estimations of market penetration ranging between 1% and 10%. He
continued to put context to the growth by stating that “compared with traditional
manufacturing however, additive manufacturing production volumes are diminutive, and
the technology remains far from gaining mass adoption, especially in direct-part
production”. He stated that global 3-D printer sales were around $0.6 billion while
23 | P a g e
conventional machines tools were around $90 billion and plastic processing equipment
at $25 billion.
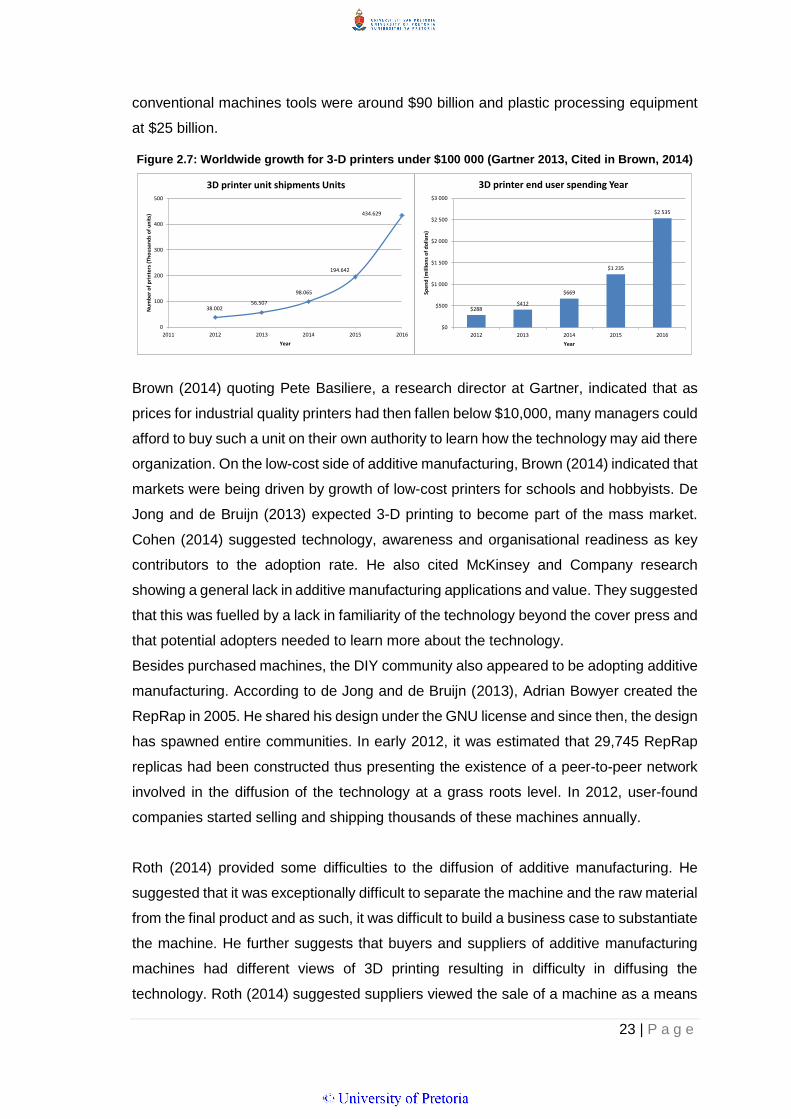
Figure 2.7: Worldwide growth for 3-D printers under $100 000 (Gartner 2013, Cited in Brown, 2014)
Brown (2014) quoting Pete Basiliere, a research director at Gartner, indicated that as
prices for industrial quality printers had then fallen below $10,000, many managers could
afford to buy such a unit on their own authority to learn how the technology may aid there
organization. On the low-cost side of additive manufacturing, Brown (2014) indicated that
markets were being driven by growth of low-cost printers for schools and hobbyists. De
Jong and de Bruijn (2013) expected 3-D printing to become part of the mass market.
Cohen (2014) suggested technology, awareness and organisational readiness as key
contributors to the adoption rate. He also cited McKinsey and Company research
showing a general lack in additive manufacturing applications and value. They suggested
that this was fuelled by a lack in familiarity of the technology beyond the cover press and
that potential adopters needed to learn more about the technology.
Besides purchased machines, the DIY community also appeared to be adopting additive
manufacturing. According to de Jong and de Bruijn (2013), Adrian Bowyer created the
RepRap in 2005. He shared his design under the GNU license and since then, the design
has spawned entire communities. In early 2012, it was estimated that 29,745 RepRap
replicas had been constructed thus presenting the existence of a peer-to-peer network
involved in the diffusion of the technology at a grass roots level. In 2012, user-found
companies started selling and shipping thousands of these machines annually.
Roth (2014) provided some difficulties to the diffusion of additive manufacturing. He
suggested that it was exceptionally difficult to separate the machine and the raw material
from the final product and as such, it was difficult to build a business case to substantiate
the machine. He further suggests that buyers and suppliers of additive manufacturing
machines had different views of 3D printing resulting in difficulty in diffusing the
technology. Roth (2014) suggested suppliers viewed the sale of a machine as a means
38.00256.507
98.065
194.642
434.629
0
100
200
300
400
500
2011 2012 2013 2014 2015 2016
Nu
mb
er
of
pri
nte
rs (
Tho
usa
nd
s o
f u
nit
s)
Year
3D printer unit shipments Units
$288$412
$669
$1 235
$2 535
$0
$500
$1 000
$1 500
$2 000
$2 500
$3 000
2012 2013 2014 2015 2016
Spe
nd
(m
illio
ns
of
do
llars
)
Year
3D printer end user spending Year

24 | P a g e
of making money, thus resulting in constant technical benchmarking of machines against
one another. Buyers on the other hand were not interested in the machine but rather
“How they can use 3D printing as a medium in which to realize their needs and desires”
(Roth 2014, p.8).
Cohen (2014) indicated that many executives were having difficulty deciding on the
technology due to second-order effects on operations and economics. Weller, et al.
(2015) supported this and stated that even with all the hype around the topic, little
research exists on the economic and business effects of additive manufacturing
technology. They believe most academic literature is still focuses on the technological
aspects in the fields of engineering, material science, and computer science.
Adoption of additive manufacturing within South Africa
According to du Preez and de Beer (2006), the first rapid prototyping machines in South
Africa were imported in 1994. Since then, The Rapid Product Development Association
of South Africa (RAPDASA) was formed and has played a critical role in raising
awareness through an annual conference and international ties such as the Global
Alliance of Rapid Prototyping Associations. DefenceWeb (2015) stated that South Africa
no longer only imported rapid prototyping and additive manufacturing machines but also
developed them. They indicated that Boeing and the Council for Scientific and Industrial
Research were developing a large-scale titanium additive manufacturing machine intent
for use in the aviation industry. A titanium beneficiation program funded by the South
African government backed this.
According to de Beer (2008), in 1998 only one privately owned South African company
owned a rapid prototyping machine however, significate adoption was experienced
during 2004 as can be seen in Figure 2.8. Campbell, de Beer and Pei (2011) stated that
by the end of 2005, 74 percent of the rapid prototyping machines in South Africa were
privately owned. By the end of 2008, 88 percent of them were of 3-D printer type.
Campbell et al. (2011) only acknowledged the low-cost low-capability and the high-cost
high-capability market segments. They estimated that the market was 54% (by machine
cost) high-cost high-capability machines and the remainder of low-cost low-capability
type. Wild (2014) stated that recent RAPDASA estimates place the number of low-end
machines in South Africa at approximately 1400 and high-end machines at
approximately 300.

25 | P a g e
Figure 2.8: Number of rapid prototyping machines in South Africa (du Preez et al., 2011).
Wild (2014) stated that the Department of Science and Technology had begun to develop
an additive manufacturing technology road map to set the direction for South African
manufacturing companies. The road map was to be developed in conjunction with the
Council for Scientific and Industrial Research, academia and industry, however she
indicated that no clear indication of a completion date had been made available. In
addition to the lack in clarity surrounding this plan, Campbell et al. (2011) identified the
following weaknesses and threats:
1. The available systems (machines) and raw materials for these systems is limited.
2. Fabrication times could be long.
3. Major South African industries were not embracing additive manufacturing. They
suggest this could be due to dependence on product designs from companies
outside of the country.
4. Lack in fundamental research in higher institutions that made peer-reviewed
publications hard to achieve.
5. Growing competition in the tooling industry from foreign nations.
With the South African economy being dependent on the manufacturing sector for a
significant portion of its revenue generation, it is important to understand the potential
effects and implications of disruptive technologies such as additive manufacturing. To
0
50
100
150
200
250
1999 2000 2001 2002 2003 2004 2005 2006 2007 2008 2009 2010
Nu
mb
er
of
mac
hin
es
(Un
its)
Year
Number of rapid prototyping machines in South Africa
3D printers Total rapid prototyping machines

26 | P a g e
follow will be the presentation of the research question derived from the research
problem with the aid of additional insight gained from the literature study.
27 | P a g e
3 Research Questions
Introduction
This study sets out to further the understanding of the diffusion of additive manufacturing
in Gauteng. Existing literature such as Campbell et al. (2011) suggests the initiation of
diffusion of additive manufacturing in South Africa however he does not suggest to what
extent it has penetrated the manufacturing sector nor does he put forward possible
constructs that may result in or hinder diffusion of additive manufacturing.
This research initiates at the abstract level and intends to develop these constructs thus
allowing further future research to be conducted at the empirical level. Zikmund, Babin,
Carr and Griffin (2013) advised that research questions are used to establish constructs;
propositions are intended to develop the understanding between constructs and
hypotheses are formal statements that explain an outcome and are empirically testable.
This research intends to establish which constructs are relevant and as such, research
questions are presented.
Research Questions
This research aims to answer the following questions:
Question one
To what extent has additive manufacturing been adopted in the Gauteng manufacturing
sector?
Campbell et al. (2011) provided insight into the adoption of the technology across South
Africa, however this adoption was inclusive of learning institutions that are involved in
the technologies development and not industry related manufacturing. This question
aims to define manufacturing related diffusion and discover the depth of penetration.
Question two
Has a dominant design of additive manufacturing machinery emerged?
28 | P a g e
This question draws from the Abernathy-Utterback model of innovation development and
is design to evaluate whether the test population believes that a dominant technology
design has set in. If so, this speaks to the ‘what’, of the current state of additive
manufacturing. Whether or not a dominant design existing, this question will implicitly
answer whether the dominant design line from the Abernathy-Utterback model has been
crossed or not and as such will also suggest at what stage additive manufacturing has
developed relative to this model.
Question three
What factors are driving or hindering the adoption of additive manufacturing?
The aim of this question is to establish the driving and hindering factors of the diffusion
process thus providing insight into ‘why’ diffusion of additive manufacturing is occurring.
This question stems from Rogers (2003) work where he viewed diffusion through a
sociology lens.
Question four
What is the predicted rate of diffusion of additive manufacturing?
This question will be developed with the aid of the Bass Model which has been shown to
be effective in estimating product adoption. This model will be used to establish the time
period in which diffusion can be expected to occur. It is also appropriate to determine
‘when’ diffusion of this technology will reach its maximum potential.

29 | P a g e
4 Research Methodology and Design
Introduction
This research was intent on exploring and describing the current state of diffusion of
additive manufacturing and establishing key constructs that drove or prohibited its
diffusion. This chapter will detail various aspect of the research methodology that was
selected and motives its use.
Research Design
To understand diffusion of innovation it was necessary to observe and understand what
was happening in the real world. The literature study had shown that although models
attempted to simulate reality, certain assumptions are made to obtain the desired result.
As assumptions are made, it was important for the researcher to acknowledge the
research paradigms. Sobh and Perry (2005) suggested that the research paradigm
consists of three elements, ontology which is reality, epistemology which is the
relationship between the reality, the researcher and the methodology which is the
technique the researcher applies to discover the reality. These paradigms suggest the
nature of the knowledge and as such should be provided by the researcher.
Saunders and Lewis (2012, p.105) defined the realism paradigm as “a research
philosophy which stresses that objects exist independently of our knowledge of their
existence”. Sobh and Perry (2005, p.1199) stated that “its (realism) philosophical position
is that reality exists independently of the researchers mind, that is, there is an external
reality”. They continued to explain that “realism refers to this external reality as consisting
of structures that are themselves sets of interrelated objects, and of mechanisms through
which those objects interact”.
This research made use of a survey to sample reality and in so doing aimed to define
constructs that could one day be used to develop theory that simulated reality. As such,
a philosophical approach of realism was adopted for this research. This selection was
consistent with the definitions of realism by Saunders and Lewis (2012) as well as Sobh
and Perry (2005) and as such was suitable.
Within the realism paradigm, a deductive reasoning process is used for this research.
Zikmund et al. (2013, p.43) defined deductive reasoning as “the logical process of

30 | P a g e
deriving a conclusion about a specific instance based on a known general premise or
something known to be true”. He continued to explain that a theory may be developed
by progressing from a general statement to a specific assertion using deductive
reasoning and that this occurred at the abstract or constructs level. Further, he stated
that inductive reasoning should be used to develop theories at an empirical level.
Sanders and Lewis (2012) defined a deductive approach as having five sequential
stages:
1. Defining research question from general theory that exists.
2. Operationalizing these questions.
3. Seeking answers to the questions defining stage one.
4. Analysing the results of the inquiry to determine whether it supports the theory or
suggests the need for its modification.
5. Confirming the initial general theory or modifying it in the light of the findings.
This research was conducted at the abstract level and made use of existing related
theories to develop questions or general premise that were used to explore and define
specific constructs supporting additive manufacturing. Thus, the applied process aligned
with Zikmund et al.’s (2013) definition of deductive reasoning and as such, is motivated
by this definition. Further, the questions developed from theory reviewed in Chapter 2
and proposed in Chapter 3 fulfilled the requirements of Sanders and Lewis’s first stage.
The actions required to complete the subsequent four stages will be present from
Chapter 5 through Chapter 7. Thus, the applied process also complied with Sanders and
Lewis’s (2012) defined deductive approach.
The research questions put forward are of exploratory type. They are intent on
discovering constructs based on related theory on a topic not well defined by previous
literature. This is consistent with Saunders and Lewis (2012) definition of exploratory
research: “research that aims to seek new insights, ask new questions and to assess
topics in a new light”.
A survey strategy was select for the research. Zikmund et al. (2013) suggested that
exploratory research is typically associated with qualitative data, as ideas that lead to
research hypotheses need to be developed. This is consistent with Sanders and Lewis
(2012) who suggested that the most common ways in which exploratory research is
conducted are:
1. Literature review
31 | P a g e
2. Interviewing ‘experts’ in the subject
3. Conducting interviews.
This created a possible argument against the use of a survey strategy for this research.
However, Sanders and Lewis (2012) advocated a survey strategy to be particularly
suitable for asking questions such as ‘Who?’ ‘What?’ ‘Where’ ‘how much?’ and ‘how
many’. They continued to state that their ability to generate answers to such questions
makes them useful for exploratory and descriptive studies. These questions can be
closely tied to the research questions which were principally attempting to establish
‘who?’ ‘what?’ ‘where?’ and ‘how much?’, relative to the diffusion of additive
manufacturing. Further, the diversity of the manufacturing sector with in Gauteng
required a relatively large sample for it to be representative of the population and be
relevant to the industry. As an example, a case-study strategy may have been suitable
in answering the research questions but would be limited to a single instance of adoption.
The intent was to identify constructs that were applicable to all adoptions of additive
manufacturing at the manufacturing industry level and as such, a survey strategy was
selected.
Creswell (2003) provided a comprehensive look at qualitative, quantitative and mixed-
method research. He advocated that any single method is subject to the researcher’s
bias, however combining methods many neutralise or cancel this effect. He continued to
explain that based on the original concept of triangulation, results from one method may
be seen to aid in the development of the results of the other. Creswell (2003) suggests
three possible formats of mixed-method research:
1. Sequential procedure. This is when a researcher seeks to elaborate on the
finding of one method with those from another.
2. Concurrent procedure. When a researcher converges qualitative and quantitative
data to provide a comprehensive analysis of a problem.
3. Transformative procedure. When a research applies a theoretical lens as the
principle perspective within a design that contains both quantitative and
qualitative data.
This research applied a concurrent procedure mixed-method design intent on converging
the data there by providing a comprehensive analysis of the possible constructs that
affected the diffusion of additive manufacturing. Quantitative questions were used to
probe a large spread of possibilities in the field of additive manufacturing. Answers to
those questions were intent on evaluating possible abstract constructs. Those questions
32 | P a g e
were simultaneously supported by qualitative questions which were intended to seeking
out any constructs that were not detected using the quantitative questions. Further, the
qualitative questions may have suggested possible relations between the constructs that
could be tested in future research at an empirical level. Sanders and Lewis (2012) also
advocated this method and provide the following four reasons supporting a mixed-
method design:
1. Some data collection methods are more suited to particular tasks than others are.
2. Focusing on different aspects of the study.
3. Corroborating your research findings with a study using two or more independent
sources of data or data collection methods.
4. Using qualitative methods to explain relationships between quantitative variables.
The research was constructed using a cross-sectional time-horizon however; the
researcher acknowledges that question four did progress into the longitudinal time
horizon. This was deemed acceptable as the longitudinal time horizon used in question
four was based on the current state and was intent on providing further insight into the
field in which this research was being conducted. Further, it was of predictive nature and
not historic which would therefore require future evaluation to determine it validity. This
was still consistent will exploratory research.
Population and Unit of Analysis
Zikmund et al. (2013, p.385) defined a population as “any complete group that shares
some common set of characteristics”. Drawing from this definition, the population was
selected as any individual currently employed within the formal manufacturing sector and
located within the Gauteng provincial boundaries. Previously employed or retired
members were not included in the population.
For the purpose of this study, manufacturing was defined as the process of converting a
raw material into a finished product. Thus, a manufacturing company was an
organisation responsible for arranging manufacturing. Individuals that were defined as
part of the population had the following characteristics:
1. Any individual responsible for the selection or promotion of new or alternative
manufacturing processes and equipment.
2. Any key stakeholder that had a direct affect on the adoption of new technology.
Example of these would have been company owners, directors, engineers, plant
managers and procurement officers.
33 | P a g e
Zikmund et al. (2013, p.118) defined a unit of analysis for a study as “what or who should
provide the data and at what level of aggregation”. The selected unit of analysis was at
the individual level of the selected population. The individual level was closely associated
with those individuals within a company whose perspective or opinion about the adoption
of additive manufacturing could have had an influence on the company’s decision to
adopt or reject the technology.
Sample Method and Size
Marshall, Cardon, Poddar and Fontenot (2013) stated, “Other than selecting a research
topic and appropriate design, no other research task is more fundamental to creating
credible research than obtaining an adequate sample”. The sampling technique selected
for this research was cluster sampling which had the characteristics of a probability
sample. A list of the selected population could not be defined however; it was possible
to determine the population in a specific geographical location. Thus, the selected
sample frame was that of a single industrial area randomly selected with in the Gauteng
province. Zikmund et al. (2013, p.398) confirmed this as a probability sampling technique
based on the principle of cluster samples either having a random selection of the cluster
or a random selection of elements within the cluster. He also added that this type of
sampling was commonly used when lists of the entire population were unavailable.
It was decided that a census of the entire sample frame would be conducted. All elements
within the sample frame were determined by the researcher conducting an internet based
search for manufacturing firms within the cluster. This was supported by the researcher
traversing all the streets in the cluster searching out manufacturing organisations. It is
acknowledged that a sample frame error did exist using this technique but it was believe
that the combination of the internet search as well as the traversing of the cluster would
minimise this error.
Zikmund et al.(2013) did warn of samples not being representative of a population should
the sample not be heterogeneous of the population itself. He also warned of problems
arising when elements within a cluster exhibited characteristics and attitudes that were
similar. As an example, this method would have been a poor selection for evaluate the
Gauteng police force by sampling one cluster. However many of the manufacturing
clusters within Gauteng were built-up of companies competing in differing subsectors
within the manufacturing sector, as such, a homogeneously distributed sample across
34 | P a g e
the subsectors would be obtained. This would result in the difficulties described by
Zikmund et al. being avoided.
Data Collection Instrument
The applied instrument of measurement was an online questionnaire. The online
research tool Survey Monkey was used to generate the questionnaire and collect data.
It was assumed that all people with the means to adopt additive manufacturing would
have access to the internet thus; this selection would not affect the population. Sanders
and Lewis (2012) advocate the use of a questionnaire when the same set of standardised
questions are posed to a large sample. They also provide some generic guidelines when
distributing an online survey. They were complied with.
A pilot study was conducted using readily available respondents that matched the
required characteristics of the population. However, these respondents did not fall within
the industrial cluster of Sebenza and as such were not included in the research survey.
There responses as well as a secondary feedback session were used to confirm both
content and construct validity.
Research Process
The research was broken down into two fundamental components. The first was the
literature review that was presented in Chapter 2. This presented details of the existing
body of knowledge and was aimed at developing a deeper understanding of the possible
constructs affecting additive manufacturing. This provided a foundation for the second
component of the research, which was intent on establishing a set of constructs that
affect the adoption of additive manufacturing.
The industrial cluster of Sebenza (Edenvale) was randomly selected for the second
component of the research. To obtain the contact details of the population, two
processes were followed. The first was an online search of various business indexes. All
listed manufacturing and potential manufacturing companies contact details were
extracted from the indexes and a list was formed. The second process was the traversing
of all the streets in the industrial cluster seeking out potential manufacturing companies.
Their contact details were also collected and added to the list. A total of 121 companies
within the cluster were suspected of being manufacturing companies.
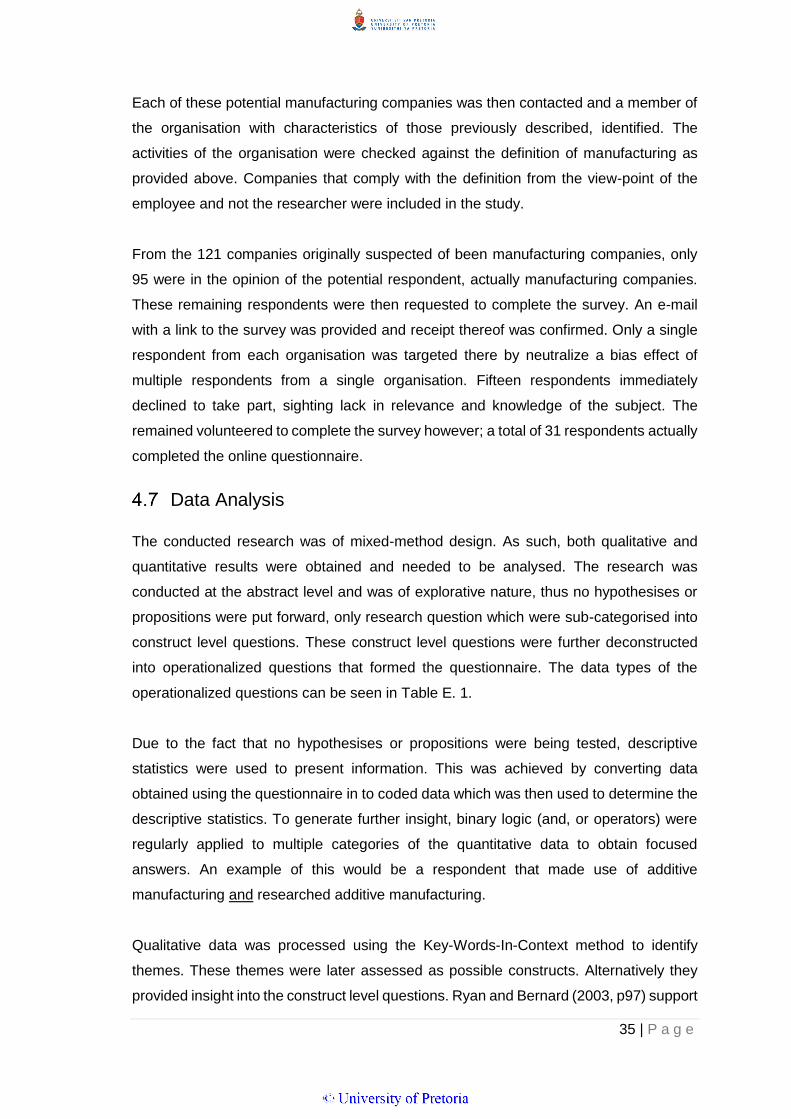
35 | P a g e
Each of these potential manufacturing companies was then contacted and a member of
the organisation with characteristics of those previously described, identified. The
activities of the organisation were checked against the definition of manufacturing as
provided above. Companies that comply with the definition from the view-point of the
employee and not the researcher were included in the study.
From the 121 companies originally suspected of been manufacturing companies, only
95 were in the opinion of the potential respondent, actually manufacturing companies.
These remaining respondents were then requested to complete the survey. An e-mail
with a link to the survey was provided and receipt thereof was confirmed. Only a single
respondent from each organisation was targeted there by neutralize a bias effect of
multiple respondents from a single organisation. Fifteen respondents immediately
declined to take part, sighting lack in relevance and knowledge of the subject. The
remained volunteered to complete the survey however; a total of 31 respondents actually
completed the online questionnaire.
Data Analysis
The conducted research was of mixed-method design. As such, both qualitative and
quantitative results were obtained and needed to be analysed. The research was
conducted at the abstract level and was of explorative nature, thus no hypothesises or
propositions were put forward, only research question which were sub-categorised into
construct level questions. These construct level questions were further deconstructed
into operationalized questions that formed the questionnaire. The data types of the
operationalized questions can be seen in Table E. 1.
Due to the fact that no hypothesises or propositions were being tested, descriptive
statistics were used to present information. This was achieved by converting data
obtained using the questionnaire in to coded data which was then used to determine the
descriptive statistics. To generate further insight, binary logic (and, or operators) were
regularly applied to multiple categories of the quantitative data to obtain focused
answers. An example of this would be a respondent that made use of additive
manufacturing and researched additive manufacturing.
Qualitative data was processed using the Key-Words-In-Context method to identify
themes. These themes were later assessed as possible constructs. Alternatively they
provided insight into the construct level questions. Ryan and Bernard (2003, p97) support

36 | P a g e
this method and state the following “Word-based techniques are typically fast and
efficiency ways to start looking for themes. We find that they are particularly useful at the
early stages of theme identification”.
Following the processing of both quantitative and qualitative data into information, this
information was then consolidated and used to evaluate constructs, which were used to
answer the research questions.
Potential Research Constraints and limitations
All research has limitations and constraints. The following is a list of fundamental
constraints and limitations of this research.
Components of the research that may have been better quantified using a longitudinal
study were limited to a cross-sectional study where a current state is analysed, opposed
to a time-dependant data series. This is because of the allocated time restrictions.
The study is primarily focused on the Sebenza industrial business district within Gauteng.
The relatively small sample size achieved brings in to question the ability to generalise
the results to as large an area as Gauteng even though the adopted method of a random
cluster samples permits such generalisation (Zikmund et al, 2013).
The research was confined to Gauteng due to limited access of suitable respondents
outside of the defined area.
With respect to diffusion theory, an implicit bias of preadoption exists (Straub, 2009).
Thus, the questionnaire questions will have to be carefully constructed with the intent of
creating equal adoption or rejection conditions.
Many of the models reviewed and to be applied are influenced by social cognitive theory
(Straub, 2009). Social cognitive theory is one of the most influential theories in
psychology and it should be acknowledged that theories of adoption and diffusion do not
include many of these aspects.

37 | P a g e
5 Results
Introduction
This chapter presents the results of the online questionnaire that was completed by 31
of the 121-targeted (80 of which the respondents believed they represented a
manufacturing company) respondents. The questionnaire incorporated results that were
of quantitative and qualitative type and as such, both statistical and Key-Word-In-Context
analysis of results are presented.
The research was conducted at an abstract level and as such, relevant statistics will be
presented at a descriptive level, as there was no intent on proving a hypothesis or
proposition. The intention was to discover or establish possible constructs that are
relevant to the research questions.
Table 5. 1 presents the connection between research questions and the operationalized
survey questions. This allows the reader to obtain insight into the generation of the
operationalized survey questions through the constructural-linking questions derived
from the literature and research question. The questionnaire can be seen in Appendix A.
The results will be present in the order of the research questions. Information relevant to
each research questions will be sub-divided and discussed at the conceptual question
level in this chapter (operationalize level data will be processed and presented at
conceptual level) however discussion in Chapter 6 will take a holistic view of the
conceptual level information presented in this chapter and will discuss the results in term
of the research question.

38 | P a g e
Table 5. 1: Research question to operationalized question linking.
1
1
2
3
4
2
5
6
7
3
8
9
4
10
11
12
5
13
14
6
15
7
16
17
8
18
9
19
20
10
21
22
23
11
24
25
12
26
13
27
28
14
29
15
30
31
16
32
17
33
34
18
35
19
36
Does advertising impact the adoption of additive manufacturing?
Does advertising affect the price sensitivity of companies entering the additive manufacturing
industry?
Are additive manufacturing machines seen as durable purchases?
Do you see the company as an innovator or an imitator?
What are the financial implications of additive manufacturing?
Are companies sufficiently exposed to allow for an adoption decision to be made?
Are there sufficient equipment providers in the industry to create confidence in adopting?
Are the required materials available in the additive manufacturing industry?
Do all stakeholders have the same opinion of additive manufacturing?
Is additive manufacturing capable of manufacturing companies existing products?
Conceptual level questions (Sub questions were operationalised
questions)
Linked questionnaire numbers (operationalized
questions), yellow are qualitative questions
Question 3
Question 4
Question 1
Question 2
At what level of penetration is the adoption occurring?
How much adoption is occurring?
When are companies adopting additive manufacturing?
Which manufacturing sub-sectors are adopting additive manufacturing?
How interested are companies in additive manufacturing?
Are companies aware of different technologies and do they have sufficient knowledge of them?
Is there a perceived dominant technology?
Is there a reason for a technology to be seen as dominant
Is there a preferred technology for the respondents operating domain?

39 | P a g e
Question 1
This question was aimed at defining the current state of adoption within the industrial
sector. Although quantification of the current state of adoption is included in this section,
it is only a part thereof. Understanding the depth of the adoption and what the adopted
technology is used for was also the focus. The knowledge of respondents relative to the
additive manufacturing industry was also reviewed as this could affect adoption rates.
How much adoption is occurring?
With the intent of understand the constructs supporting additive manufacturing, it is
highly relevant that the extent to which adoption is occurring is understood. The extent
of adoption was not confined to market penetration but was also focused on the
respondent’s type of application of the technology (e.g. Prototyping, production).
When considering the market penetration of the 31 respondents in the cluster, only 16
percent claimed that their employer leased or owned an additive manufacturing machine.
However, 45 percent of respondents did acknowledge that they personally knew of a
manufacturing company that leased or owned an additive manufacturing machine. This
resulted in 48 percent of respondents being aware of additive manufacturing technology.
Some respondents owned a machine and were aware of another company with a
machine, hence the 48 percent opposed to 61 percent, should there not have been
common respondents.
Following knowledge of someone that owned an additive manufacturing machine,
respondents were asked if they believe additive manufacturing would add value to their
business. Sixty percent of the respondents believed that additive manufacturing would
add value to their business. The definition of ‘value-add’ was left to the respondent
interpretation as it was believed that the decision to adopt the technology would be based
on the respondents definition.
When reviewing respondents that had exposure to additive manufacturing, 19 thought
it would not add value to their business. Concurrently, 19 percent of the respondents with
no direct contact to additive manufacturing believe that the technology would add value
to their business if adopted.
The most common key-word-in-context used by respondents when asked to motivate
their response to additive manufacturing as a business value-add was ‘prototyping’.
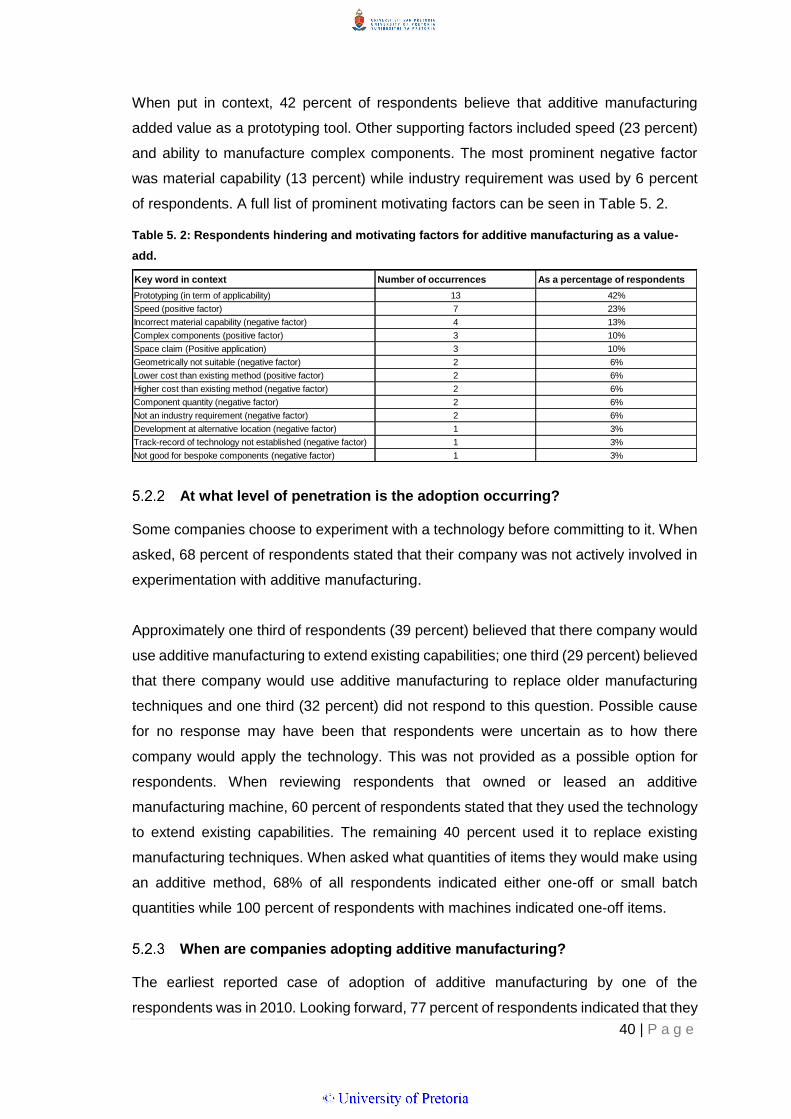
40 | P a g e
When put in context, 42 percent of respondents believe that additive manufacturing
added value as a prototyping tool. Other supporting factors included speed (23 percent)
and ability to manufacture complex components. The most prominent negative factor
was material capability (13 percent) while industry requirement was used by 6 percent
of respondents. A full list of prominent motivating factors can be seen in Table 5. 2.
Table 5. 2: Respondents hindering and motivating factors for additive manufacturing as a value-
add.
At what level of penetration is the adoption occurring?
Some companies choose to experiment with a technology before committing to it. When
asked, 68 percent of respondents stated that their company was not actively involved in
experimentation with additive manufacturing.
Approximately one third of respondents (39 percent) believed that there company would
use additive manufacturing to extend existing capabilities; one third (29 percent) believed
that there company would use additive manufacturing to replace older manufacturing
techniques and one third (32 percent) did not respond to this question. Possible cause
for no response may have been that respondents were uncertain as to how there
company would apply the technology. This was not provided as a possible option for
respondents. When reviewing respondents that owned or leased an additive
manufacturing machine, 60 percent of respondents stated that they used the technology
to extend existing capabilities. The remaining 40 percent used it to replace existing
manufacturing techniques. When asked what quantities of items they would make using
an additive method, 68% of all respondents indicated either one-off or small batch
quantities while 100 percent of respondents with machines indicated one-off items.
When are companies adopting additive manufacturing?
The earliest reported case of adoption of additive manufacturing by one of the
respondents was in 2010. Looking forward, 77 percent of respondents indicated that they
Key word in context Number of occurrences As a percentage of respondents
Prototyping (in term of applicability) 13 42%
Speed (positive factor) 7 23%
Incorrect material capability (negative factor) 4 13%
Complex components (positive factor) 3 10%
Space claim (Positive application) 3 10%
Geometrically not suitable (negative factor) 2 6%
Lower cost than existing method (positive factor) 2 6%
Higher cost than existing method (negative factor) 2 6%
Component quantity (negative factor) 2 6%
Not an industry requirement (negative factor) 2 6%
Development at alternative location (negative factor) 1 3%
Track-record of technology not established (negative factor) 1 3%
Not good for bespoke components (negative factor) 1 3%

41 | P a g e
believed their company would never purchase an additive manufacturing machine.
However, 10 percent of respondents indicated that they believed their employing
company would purchase an additive manufacturing machine in 2017. This was the peak
year for intended machine procurements but, 2016 and 2020 equally split the remaining
12 percent (6 percent each) of planned machine procurements.
Which manufacturing sub-sectors are adopting additive manufacturing?
Having asked respondents about their companies’ interaction with additive
manufacturing, respondents were then questioned about the sub-sector of
manufacturing their company fell into. Sixty-six responses were obtained from the 31
respondents (multiple selections by respondents). Sixteen of these were the ‘other’
criteria, however in all cases examples of the items their company manufactured were
provided opposed to sub-sectors. Nine of the 16 selected sub-sectors as well as the
‘other’ option. For the remaining, based on the product examples provided, these
companies were segmented. The result of this segmentation can been seen in
Figure 5. 1.
Figure 5. 1: Division of respondents into relevant manufacturing sub-sectors.
The primary material used by the respondents were steels (76 percent). Rubber and
plastic material were the next most common materials used. This is graphically
presented in Figure 5. 2. When asked if they believed and equivalent printable raw
material by comparison to their currently use material was available, only 32 percent of
respondents answered yes.
8%
14%
4%
26%
26%
8%
4%
2%
6%2%
Division of respondents into relevant manufacturing sub-sectors with more than one sub-sector selectable
Electronic machinery andapparatus
Engines, turbines, pumps andcompressors
Food, beverage and tobacco
General machinery
Special machinery
Motor vehicle parts
Petroleum products, basicchemicals
Pharmaceutical products
Railway and trams
Transport equipment
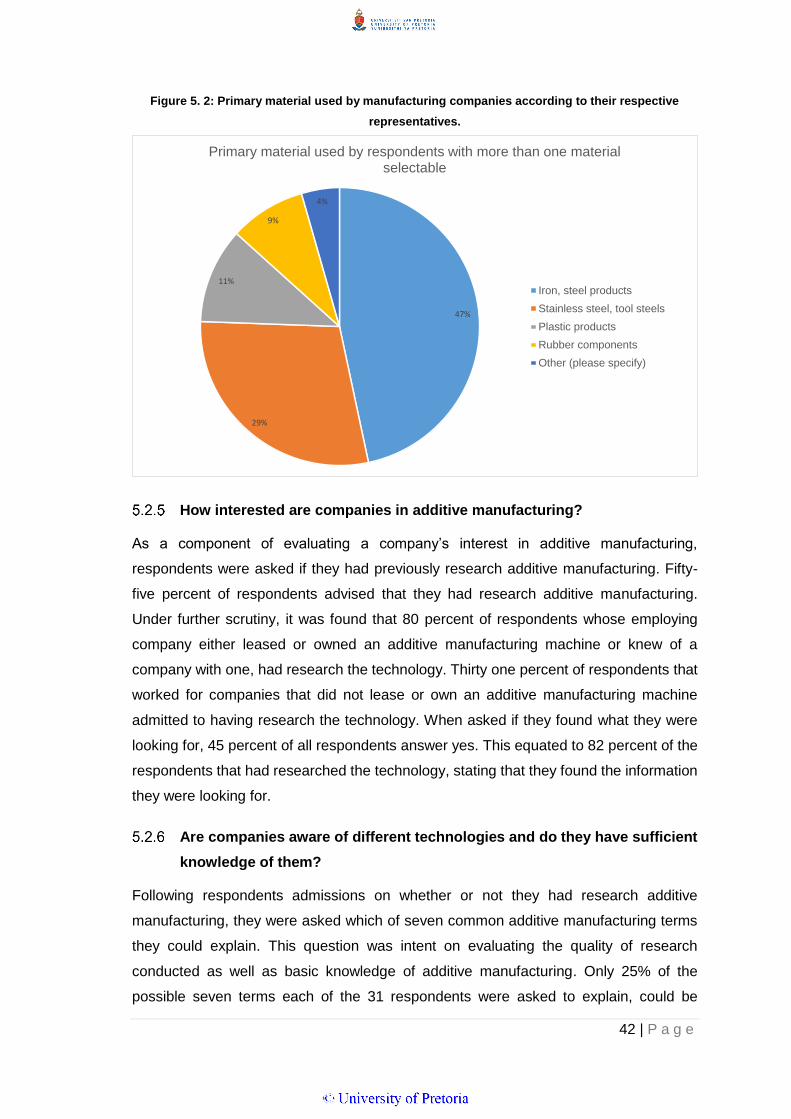
42 | P a g e
Figure 5. 2: Primary material used by manufacturing companies according to their respective
representatives.
How interested are companies in additive manufacturing?
As a component of evaluating a company’s interest in additive manufacturing,
respondents were asked if they had previously research additive manufacturing. Fifty-
five percent of respondents advised that they had research additive manufacturing.
Under further scrutiny, it was found that 80 percent of respondents whose employing
company either leased or owned an additive manufacturing machine or knew of a
company with one, had research the technology. Thirty one percent of respondents that
worked for companies that did not lease or own an additive manufacturing machine
admitted to having research the technology. When asked if they found what they were
looking for, 45 percent of all respondents answer yes. This equated to 82 percent of the
respondents that had researched the technology, stating that they found the information
they were looking for.
Are companies aware of different technologies and do they have sufficient
knowledge of them?
Following respondents admissions on whether or not they had research additive
manufacturing, they were asked which of seven common additive manufacturing terms
they could explain. This question was intent on evaluating the quality of research
conducted as well as basic knowledge of additive manufacturing. Only 25% of the
possible seven terms each of the 31 respondents were asked to explain, could be
47%
29%
11%
9%
4%
Primary material used by respondents with more than one material selectable
Iron, steel products
Stainless steel, tool steels
Plastic products
Rubber components
Other (please specify)

43 | P a g e
explained by the respondents. Further, of the 31 respondents, only two believed they
could explain more than two of the terms provided.
Question 2
Question two was motivated by the Abernathy-Utterback model. The intention was to
determine how far along the product development and process development curves
additive manufacturing technology had progressed and if the dominant design line had
been passed.
Is there a perceived dominant technology?
When asked about a dominant design or technology in the industry, 81 percent of
respondents stated that they did not believe one existed yet. Out of the 19 percent of
respondents that believed a dominant design or technology existed, 50 percent could
motivate their answer however, each respondent motivated a differing technology as
being dominant. When reviewing all respondents, 77 percent acknowledged that they
did not know enough about additive manufacturing to comment.
It was observed that all respondents that believe a dominant technology existed, had
research the technology. However, this group only surmounted to 35 percent of those
that had claimed to have researched additive manufacturing.
Is there a reason for a technology to be seen as dominant?
Having established whether respondents believe a dominant technology existed, they
were asked to provide a criterion on which they though would result in a technology being
dominant. Seventy-one percent advised that they did not know. Thirteen percent
selected diversity in capability and 10 percent diversity in material selection. Complete
results to the evaluation criterion can be seen in Figure 5. 3.

44 | P a g e
Figure 5. 3: Most popular evaluation criterion for additive manufacturing, Single selection per
respondent.
Question 3
The literature review has shown that many factors drive or hinder the product adoption
process. Question 3 was intent on establishing what some of the possible factors could
be.
Is there a preferred technology for the respondents operating domain?
Following from question two where we tried to establish whether there was a dominant
technology, as a sub-section for research question 3, we tried to determine if there was
a dominant technology per industrial sub-sector. The large majority (74 percent) of the
respondents once again advised that they did not know the technology sufficiently well
to decide which was best suited to their organisation. An example of one such response
was as follows “Our products are exposed to intense high pressure, I am therefore not
sure which process would be able to give a suitable replacement to steel or aluminium”.
Thirteen percent of the respondents did select material extrusion as the most preferable
however only 25 percent of those respondents selected a technology that would function
with the raw material they previously selected as there companies primary raw material.
This respondent motivated his selection by stating that it was a technology that they were
already using.
3%
13%
3%
10%
0%
71%
Most popular evaluation criterion for additive manufacturing
Most popular
Most diverse in capability
Best value for money
The variety of materials
Speed of the process
Don’t know
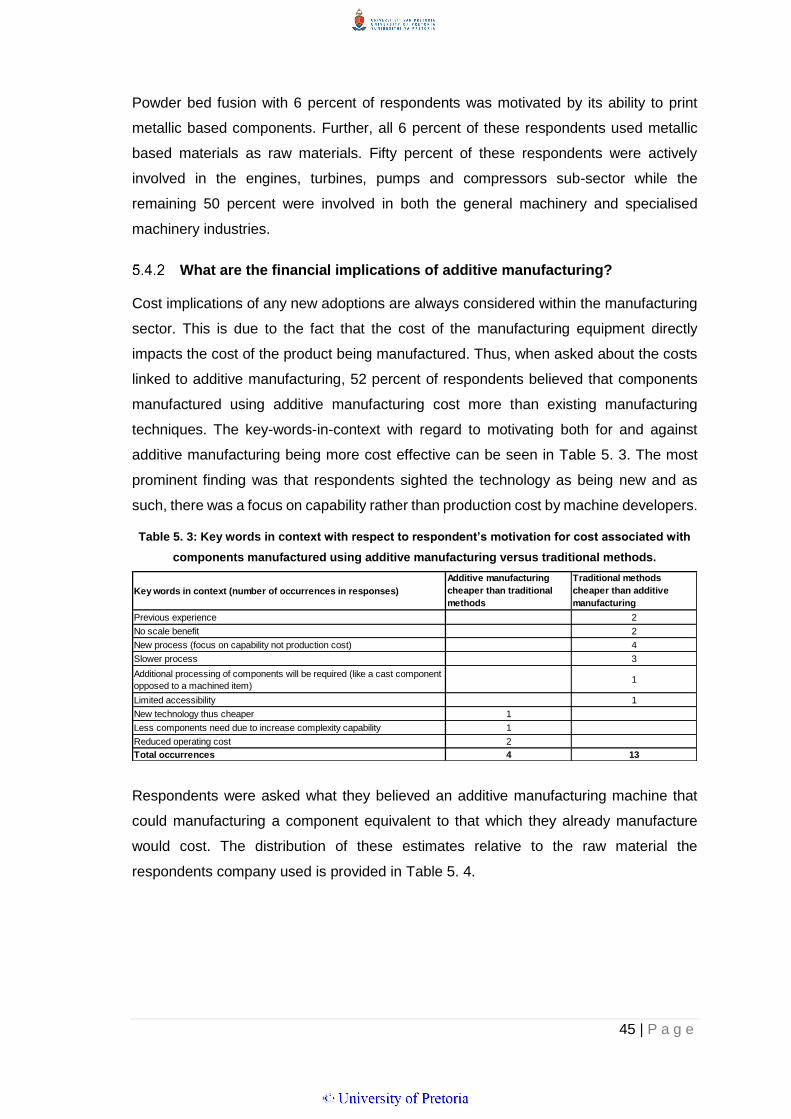
45 | P a g e
Powder bed fusion with 6 percent of respondents was motivated by its ability to print
metallic based components. Further, all 6 percent of these respondents used metallic
based materials as raw materials. Fifty percent of these respondents were actively
involved in the engines, turbines, pumps and compressors sub-sector while the
remaining 50 percent were involved in both the general machinery and specialised
machinery industries.
What are the financial implications of additive manufacturing?
Cost implications of any new adoptions are always considered within the manufacturing
sector. This is due to the fact that the cost of the manufacturing equipment directly
impacts the cost of the product being manufactured. Thus, when asked about the costs
linked to additive manufacturing, 52 percent of respondents believed that components
manufactured using additive manufacturing cost more than existing manufacturing
techniques. The key-words-in-context with regard to motivating both for and against
additive manufacturing being more cost effective can be seen in Table 5. 3. The most
prominent finding was that respondents sighted the technology as being new and as
such, there was a focus on capability rather than production cost by machine developers.
Table 5. 3: Key words in context with respect to respondent’s motivation for cost associated with
components manufactured using additive manufacturing versus traditional methods.
Respondents were asked what they believed an additive manufacturing machine that
could manufacturing a component equivalent to that which they already manufacture
would cost. The distribution of these estimates relative to the raw material the
respondents company used is provided in Table 5. 4.
Key words in context (number of occurrences in responses)
Additive manufacturing
cheaper than traditional
methods
Traditional methods
cheaper than additive
manufacturing
Previous experience 2
No scale benefit 2
New process (focus on capability not production cost) 4
Slower process 3
Additional processing of components will be required (like a cast component
opposed to a machined item)1
Limited accessibility 1
New technology thus cheaper 1
Less components need due to increase complexity capability 1
Reduced operating cost 2
Total occurrences 4 13

46 | P a g e
Table 5. 4: Respondents estimated additive manufacturing machine cost relative to the primary raw
material used by the company.
From Table 5. 4 we can see that 57 percent of the respondents believe that they could
obtain a suitable additive manufacturing machine for between R250 001 and R2 000
000. It is also evident that respondents expect to pay less for an additive manufacturing
machine that processes plastic opposed to steel.
Are companies sufficiently exposed to allow an adoption decision to be
made?
With respondents having answered 23 operationalized questions by this stage, they were
asked whether they believed they would be able to motivate either for or against the
adoption of additive manufacturing at their employing company. Only 6 percent believed
they would be able to motivate either way. The 6 percent that could motivate there
answer both motivated for the adoption of additive manufacturing. Key-words-in-context
used during the explanation of their ability to motivate for or against the adoption of
additive manufacturing can be seen in Table 5. 5.
Table 5. 5: Number of occurrences of key words in context with respect to respondents reasoning
for their ability to motivate for or against adoption of additive manufacturing.
One of the respondents that believed he would not be able to motivate an argument
stated the following “We can’t work out what our costs for such a machine will be as we
have little experience. We understand the costs involved in our lathes and mills”.
Opposed to this, a respondent that could motivate for the adoption of additive
manufacturing stated the following “I own a 3D printer at home. Know how it works and
costs involved”.
Across all
raw materials
Composite ,
glass,
cement
Iron, steel
products
Stainless
steel, tool
steels
Plastic
products
Rubber
components
Exotic steels
(gold, silver)
Other
(please
specify)
R1 - R100 000 2% 0% 0% 0% 0% 0% 0% 50%
R100 001 - R250 000 9% 0% 10% 8% 20% 0% 0% 0%
R250 001 - R750 000 24% 0% 29% 31% 20% 0% 0% 0%
R750 001 - R2 000 000 33% 0% 38% 31% 0% 75% 0% 0%
R2 000 001 and higher 16% 0% 14% 15% 20% 25% 0% 0%
No answered selected 16% 0% 10% 15% 40% 0% 0% 50%
Key words in context (number of occurrences in responses)Could motivate adoption of
additive manufacturing
Couldn't motivate adoption
of additive manufacturing
Have not done sufficient researched 24
Have not researched, not relevant to the company 1
Don’t understand the cost structure relative to traditional methods 1
Previous experience shows it expensive, thus more research needed 1
Not sure of capability 4
Only exposed to it at university, thud don't know enough 1
Own a 3D printer at home, thus understand costs involved. 1
Technology of the future 1
Total occurrences 2 32

47 | P a g e
Are there sufficient equipment providers in the industry to create
confidence in adopting?
One of the respondents suggested that limited access to additive manufacturing
technology has elevated its cost above traditional manufacturing (Table 5. 3). Following
this trend of thought, respondents were asked if they believe sufficient additive
manufacturing suppliers with the required support structures were present in the
Gauteng market. Only 3 percent of respondents believed there were and 23 percent
believing there were not. The remaining 74 percent were uncertain.
Are the required materials available in the additive manufacturing industry?
Raw material is critical to all manufacturing as it is the process of converting raw material
to finished goods. The focus of this this construct revolved around potential difficulties in
the material supply chain should a company change to additive manufacturing.
Respondents were divided on whether a change to additive manufacturing technology
would generate additions difficulties or problems to the material supply chain. Thirty-five
percent believe it would result in challenges, 35 percent believed it would not result in
challenges and 30 percent refrained from answering the question. Respondents were
asked to motivate their answer. The key-words-in-context from their motivation can be
seen in Table 5. 6. Responses from all respondents are not highlighted, only key findings.
As such, the total occurrences do not reflect the total number respondents.
Table 5. 6: Key word in context related to anticipated material supply chain challenges when
shifting to additive manufacturing.
Key words in context (number of occurrences in responses)
Procurement of additive
manufacturing raw material
more problematic that
traditional raw material
Procurement of additive
manufacturing raw material
less or equally problematic
that traditional raw material
Additive material expensive 3
Need alternative material suppliers (not only machine suppliers providing
material)2
Will have to change current material suppliers 1
Uncertain who can supply material 1
Material imported 4
Not many suppliers 2
Difficult to obtain good information 1
Fewer raw materials for additive manufacturing than for traditional methods
(only steel powder, not different size bars, etc.)2
Don’t know enough 1
Additional processing 1
Special formats 1
Machines are available, as such material will be available 1
Very new thus specialized 2
Procurement should be the same as current 2
Total occurrences 7 6
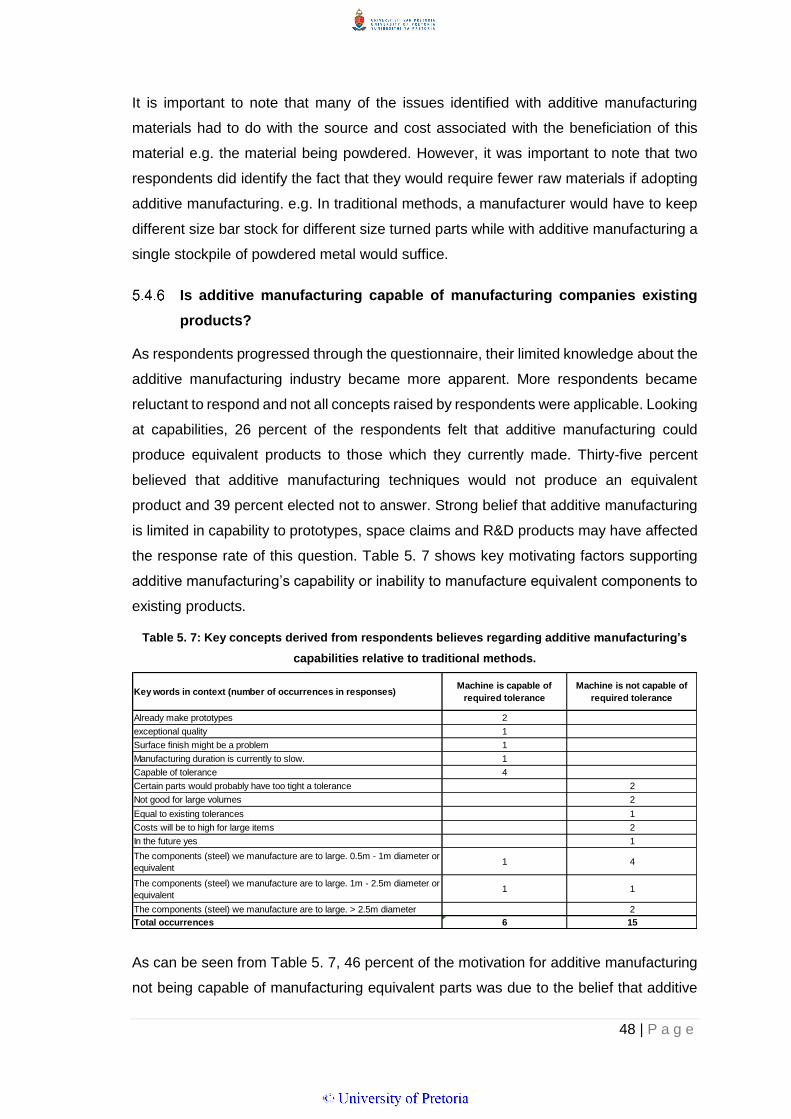
48 | P a g e
It is important to note that many of the issues identified with additive manufacturing
materials had to do with the source and cost associated with the beneficiation of this
material e.g. the material being powdered. However, it was important to note that two
respondents did identify the fact that they would require fewer raw materials if adopting
additive manufacturing. e.g. In traditional methods, a manufacturer would have to keep
different size bar stock for different size turned parts while with additive manufacturing a
single stockpile of powdered metal would suffice.
Is additive manufacturing capable of manufacturing companies existing
products?
As respondents progressed through the questionnaire, their limited knowledge about the
additive manufacturing industry became more apparent. More respondents became
reluctant to respond and not all concepts raised by respondents were applicable. Looking
at capabilities, 26 percent of the respondents felt that additive manufacturing could
produce equivalent products to those which they currently made. Thirty-five percent
believed that additive manufacturing techniques would not produce an equivalent
product and 39 percent elected not to answer. Strong belief that additive manufacturing
is limited in capability to prototypes, space claims and R&D products may have affected
the response rate of this question. Table 5. 7 shows key motivating factors supporting
additive manufacturing’s capability or inability to manufacture equivalent components to
existing products.
Table 5. 7: Key concepts derived from respondents believes regarding additive manufacturing’s
capabilities relative to traditional methods.
As can be seen from Table 5. 7, 46 percent of the motivation for additive manufacturing
not being capable of manufacturing equivalent parts was due to the belief that additive
Key words in context (number of occurrences in responses)Machine is capable of
required tolerance
Machine is not capable of
required tolerance
Already make prototypes 2
exceptional quality 1
Surface finish might be a problem 1
Manufacturing duration is currently to slow. 1
Capable of tolerance 4
Certain parts would probably have too tight a tolerance 2
Not good for large volumes 2
Equal to existing tolerances 1
Costs will be to high for large items 2
In the future yes 1
The components (steel) we manufacture are to large. 0.5m - 1m diameter or
equivalent1 4
The components (steel) we manufacture are to large. 1m - 2.5m diameter or
equivalent1 1
The components (steel) we manufacture are to large. > 2.5m diameter 2
Total occurrences 6 15

49 | P a g e
machines could not manufacture large scale components. This was supported by
concerns that the cost of large components would be uncompetitive due to high raw
material costs of additive manufacturing.
Do all stakeholders have the same opinion of additive manufacturing?
Adoption of new technology can affect multiple stakeholder. This construct level question
focused on stakeholders as a set of decision makers with the power to affect the decision
to adopt additive manufacturing technology or not. More than half (55 percent) of the
respondents felt that various stakeholders would have differing options to their own with
regard to the adoption of additive manufacturing. Only 19 percent felt that relevant
stakeholders in the decision process would have a unified opinion. This was not entirely
unexpected as stakeholders involved in such a decision would have differing viewpoints.
However, this question was intent on priming the respondent with a yes or no starting
point from which they were asked if they believed this would prevent the adoption of
additive manufacturing in their company. Table 5. 8 presents a list of critical statements
regarding differing opinions of stakeholders affecting the adoption of additive
manufacturing. This is presented relative to the respondents response to whether
stakeholders would have differing opinions over the adoption and whether this would
affect the adoption.
Table 5. 8: Key constructs produced by respondents relative to shared or differing stakeholder
opinions and the respondents expectation of the stakeholder opinion unity affecting additive
manufacturing technology adoption.
Upon examination of Table 5. 8 it was noticed that the constructs presented by the
respondents could be divided into two groups:
1. Constructs that can be analytically supported and financially motivated.
2. Constructs that are related to the human aspects of adoption such as persuasion
and change management (Highlighted in yellow).
Key words in context (number of occurrences in responses) Differing opinion Same opinionWon't prevent
adoption
Will prevent
adoption
As long as the cost can be motivate 2 2
Engineering department to determine its value 1 1
Engineering department to determine its value 1 1
Production teams don't like to adopt new types of machines they are not
used to using1 1
Won't be easy to convince other stakeholders 1 1
Older generation engineering personnel are set in their ways 1 1
Our research and product development if overseas 1 1
Management decision based upon commercial viability and optimization in
works processes1 1
If stakeholders are not familiar with the technology 1 1
Total occurrences 9 1 4 6

50 | P a g e
All the statements that were made and had a focused on the human element, had the
same respondent believe that additive manufacturing would not be adopted. Another key
finding was that of two differing respondents using contextually the same argument to
motivate both will, and won’t prevent the adoption of additive manufacturing arguments.
Question 4
The Bass Model was the principle motivator of this question. Principally it would have
been better suited to a longitudinal study however; it was relevant to the cross-sectional
study as conclusions about the current state could be drawn from the model. Specific
constructs needed to be evaluated to enable the development of the Bass Model. This
was done using the following constructural level questions.
Does the brand affect the adoption of additive manufacturing?
Chapter 2.8 refers to later revisions of the Bass Model having incorporated decision
variables. One of these decision variables was related to the effects of consumer
advertising and as such it was necessary to evaluate the potential effects of advertising
relative to the adoption of additive manufacturing. Table 5. 9 presents information
regarding respondents claims to having seen advertising for additive manufacturing. It
also presents earlier findings with regard to respondents companies leasing/ owning an
additive manufacturing machine or the respondent knowing a company that does. In
Table 5. 9 this is termed a respondent that is involved.
Table 5. 9: Additive manufacturing advertising relative to involvement with additive manufacturing.
Table 5. 9 shows that respondents that have seen advertising for additive manufacturing
have a higher tendency to have some form of involvement with additive manufacturing.
It does not prove causality or directionality and as such, it is possible that respondents
that are involved with additive manufacturing may be more aware of advertising
pertaining to additive manufacturing
The table also shows that 32 percent of respondents that have seen advertising for
additive manufacturing are also involved (the counter argument is also possible). This is
in contrast to 13 percent of respondents claiming that they have not seen advertising and
Lease/ own an
additive
manufacturing
machine or know a
company with one.
Respondents that
have seen
advertising for
additive
manufacturing
Have seen
advertising and have
involvement in
additive
manufacturing
Have not seen
advertising and have
involvement in
additive
manufacturing
Have seen
advertising and have
no involvement in
additive
manufacturing
Have not seen
advertising and have
no involvement in
additive
manufacturing
Percentage yes 48% 39% 32% 13% 6% 26%
Percentage no 52% 39% 45% 65% 71% 52%
No response 0% 23% 23% 23% 23% 23%

51 | P a g e
have no involvement with additive manufacturing. This is further supported by the fact
that there were less respondents not involved in additive manufacturing that had seen
advertising (6 percent) than those that had not seen advertising (26 percent). The
constant non-response rate of 23 percent was generated by respondents not having
responded to the question regarding advertising and as such, it carries through to all
conclusions involving this response.
Does advertising affect the price sensitivity of companies entering the
additive manufacturing industry?
The manufacturing machine industry has numerous reputable and no-name (unknown)
suppliers. Significance to the Gauteng market is the alternative of low cost Chinese
machines opposed to the more traditional European and Western suppliers. This fact
was recognised and as such, respondents were questioned to determine if this would
have any immediate effect on consumer habits or adoption pertinent to additive
manufacturing.
Table 5. 10: Additive manufacturing advertising relative to belief that additive manufacturing
machine cost is more important than capability.
Table 5. 10 presents the respondents results when responding whether machine cost
was more important than its capability. Twenty three percent of respondents felt cost was
more important with 45 percent believing capability was more important. However,
advertising does seem to have some relation to cost and capability. The table also shows
that respondents that have seen advertising for additive manufacturing machines value
cost over capability (6 percent) less than those that have not seen advertising (16
percent). Extending on this, respondents that have seen advertising for additive
manufacturing value capability over cost more than those that had not seen advertising.
Thus, simply put (simple version for clarity only, not implying causality or direction of
relation), advertising reduced respondents willingness to pay more for a machine and
increased their belief that capability was more important.
Respondents that
have seen
advertising for
additive
manufacturing
Machine cost more
important than
capability
Have seen
advertising and cost
more important than
capability
Have not seen
advertising and cost
more important than
capability
Have seen
advertising and
capability more
important than cost
Have not seen
advertising and
capability more
important than cost
Percentage yes 39% 23% 6% 16% 26% 0%
Percentage no 39% 45% 61% 52% 42% 68%
No response 23% 32% 32% 32% 32% 32%
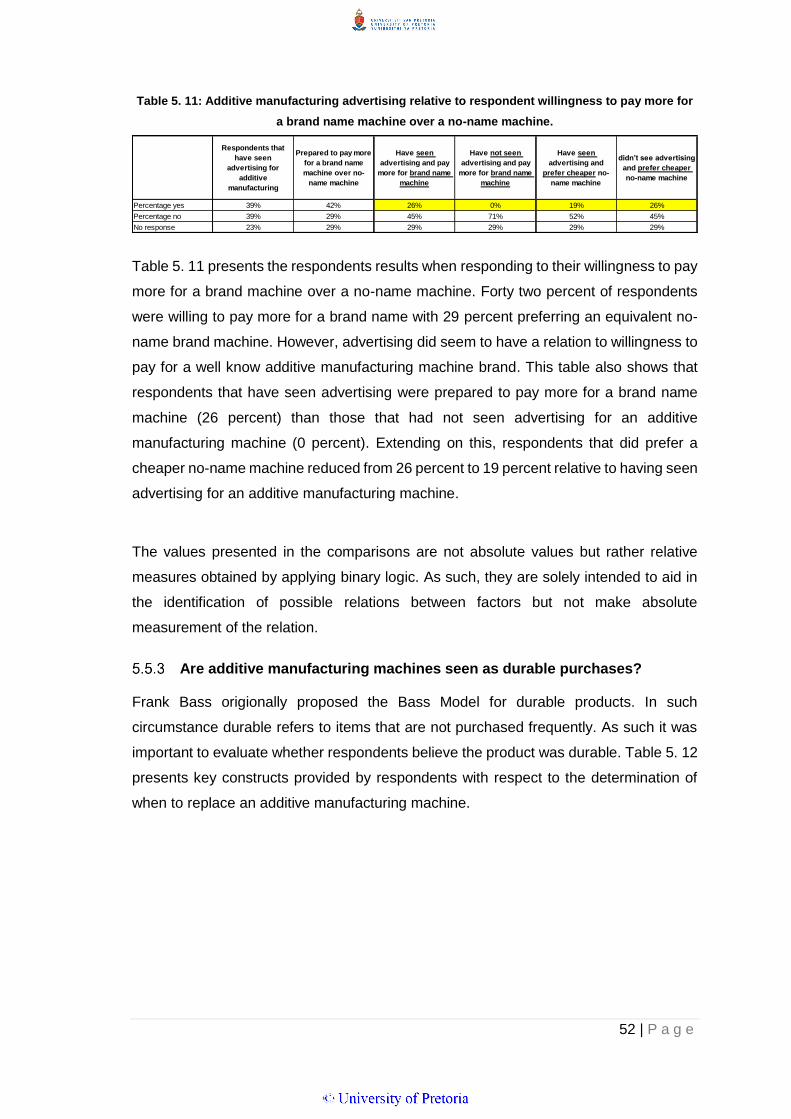
52 | P a g e
Table 5. 11: Additive manufacturing advertising relative to respondent willingness to pay more for
a brand name machine over a no-name machine.
Table 5. 11 presents the respondents results when responding to their willingness to pay
more for a brand machine over a no-name machine. Forty two percent of respondents
were willing to pay more for a brand name with 29 percent preferring an equivalent no-
name brand machine. However, advertising did seem to have a relation to willingness to
pay for a well know additive manufacturing machine brand. This table also shows that
respondents that have seen advertising were prepared to pay more for a brand name
machine (26 percent) than those that had not seen advertising for an additive
manufacturing machine (0 percent). Extending on this, respondents that did prefer a
cheaper no-name machine reduced from 26 percent to 19 percent relative to having seen
advertising for an additive manufacturing machine.
The values presented in the comparisons are not absolute values but rather relative
measures obtained by applying binary logic. As such, they are solely intended to aid in
the identification of possible relations between factors but not make absolute
measurement of the relation.
Are additive manufacturing machines seen as durable purchases?
Frank Bass origionally proposed the Bass Model for durable products. In such
circumstance durable refers to items that are not purchased frequently. As such it was
important to evaluate whether respondents believe the product was durable. Table 5. 12
presents key constructs provided by respondents with respect to the determination of
when to replace an additive manufacturing machine.
Respondents that
have seen
advertising for
additive
manufacturing
Prepared to pay more
for a brand name
machine over no-
name machine
Have seen
advertising and pay
more for brand name
machine
Have not seen
advertising and pay
more for brand name
machine
Have seen
advertising and
prefer cheaper no-
name machine
didn’t see advertising
and prefer cheaper
no-name machine
Percentage yes 39% 42% 26% 0% 19% 26%
Percentage no 39% 29% 45% 71% 52% 45%
No response 23% 29% 29% 29% 29% 29%
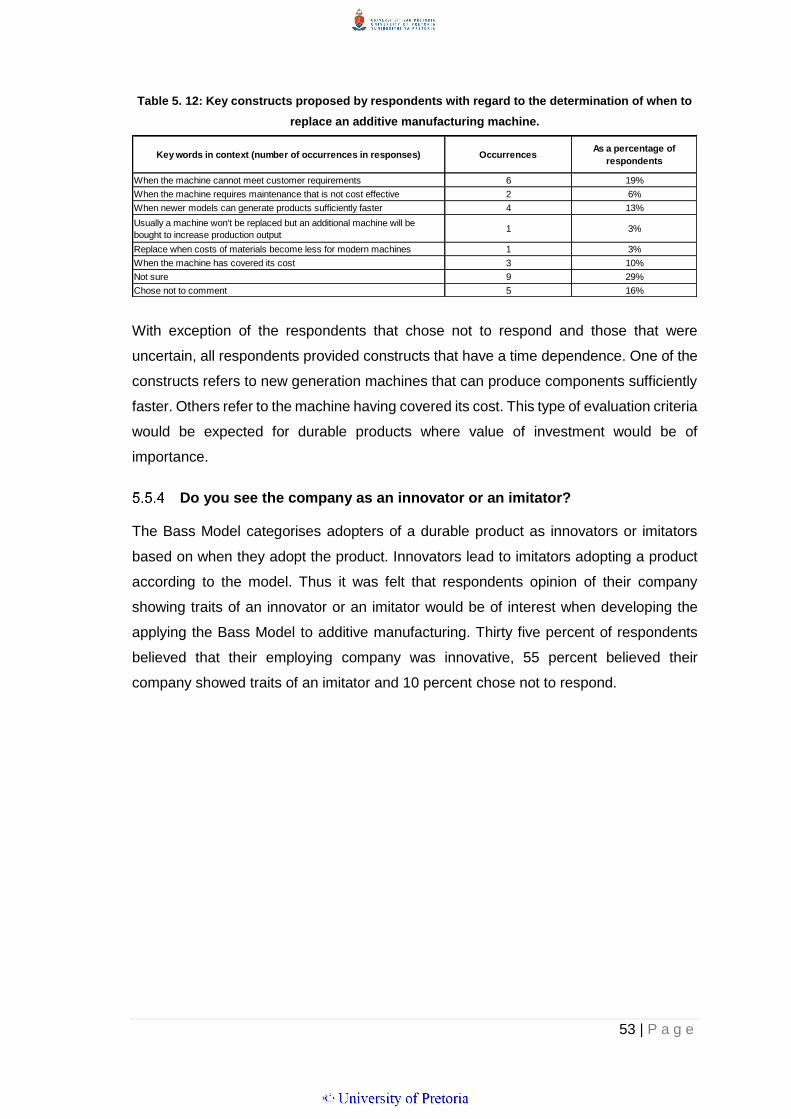
53 | P a g e
Table 5. 12: Key constructs proposed by respondents with regard to the determination of when to
replace an additive manufacturing machine.
With exception of the respondents that chose not to respond and those that were
uncertain, all respondents provided constructs that have a time dependence. One of the
constructs refers to new generation machines that can produce components sufficiently
faster. Others refer to the machine having covered its cost. This type of evaluation criteria
would be expected for durable products where value of investment would be of
importance.
Do you see the company as an innovator or an imitator?
The Bass Model categorises adopters of a durable product as innovators or imitators
based on when they adopt the product. Innovators lead to imitators adopting a product
according to the model. Thus it was felt that respondents opinion of their company
showing traits of an innovator or an imitator would be of interest when developing the
applying the Bass Model to additive manufacturing. Thirty five percent of respondents
believed that their employing company was innovative, 55 percent believed their
company showed traits of an imitator and 10 percent chose not to respond.
Key words in context (number of occurrences in responses) OccurrencesAs a percentage of
respondents
When the machine cannot meet customer requirements 6 19%
When the machine requires maintenance that is not cost effective 2 6%
When newer models can generate products sufficiently faster 4 13%
Usually a machine won't be replaced but an additional machine will be
bought to increase production output1 3%
Replace when costs of materials become less for modern machines 1 3%
When the machine has covered its cost 3 10%
Not sure 9 29%
Chose not to comment 5 16%
54 | P a g e
6 Discussion of Results
Introduction
This chapter discuss the findings from Chapter 5 and consolidate these findings into
results. Construct level questions under each of the research questions will be
consolidated to produce results to the research questions.
Having produced results to the research questions, existing literature will be drawn on to
create a link between the existing work and the additional contribution this work makes
to further the knowledge base of the relevant fields of study. The chapter will be ordered
according to the research questions.
Question 1
Campbell et al. (2011) and du Preez et al. (2011) provide insight into the existing
adoption of additive manufacturing in South Africa with the quantification of the number
of additive manufacturing machines. This question however primarily focused on defining
the existing adoption within the research cluster.
Sixteen percent of the respondents claimed that their employing organisation owned or
leased an additive manufacturing machine and 48 percent claimed to be aware of a
company that owned or leased an additive manufacturing machine. Although the
ownership of additive manufacturing equipment seemed low, by Cohen’s (2014)
estimation of additive manufacturing penetration of the market ranging between 1% and
10%, the current level of machine ownership appears to be ahead of the international
trend.
The current level of adoption is also set for further growth when considering 60 percent
of the respondents believed that additive manufacturing would add value to their
business. This is further supported by the fact that only 19 percent of respondents that
claim to have been exposed to additive manufacturing believe that it does not add value
to their business. Thus, beyond new adopters, there is a potential for 80 percent of the
already adopting additive manufacturers repurchasing a replacement machine in the
future or extending their current capacity.

55 | P a g e
Figure 6. 1: Number of rapid prototyping machines in South Africa (du Preez et al., 2011).
Figure 6. 1 presents du Preez et al. (2011) data showing the present number of machines
within South Africa. Their data has been extended to include adoption data from the
sampled cluster. By visual inspection it is clear that adoption is been occurring however
this adoption appears linear and slower than the national cumulative adoption numbers
presented by du Preez et al. (2011). However when the future expected adoption is
included (survey data), the form appears to progress to exponential. This may be due to
the examination period being very early in the adoption cycle, alternatively it may be
evidence that imitators can be expected to be joining innovators in the adoption of
additive manufacturing in the near future. Bass (2004a) like Rogers (2003) define
innovators as the first 2.5% of all adopters. Thus, should imitators only begin adopting
additive technology now (already 19% adoption within the sample), they will be late by
definition.
Adoption is occurring in the target cluster; however, it is not for production items but
rather prototyping. Sixty eight percent of respondents that owned a machine indicated
that they only produced one-off items while 100 percent of all respondents indicated that
they did or intended on using the machine for one-off or small batch production. This is
typical of prototypes, jigs and fixtures or specialised items. When respondents provided
0
2
4
6
8
10
12
14
16
0
50
100
150
200
250
1999 2002 2005 2008 2011 2014 2017 2020
Re
spo
nd
en
ts n
um
be
r o
f m
ach
ine
s (U
nit
s)
Nu
mb
er
of
mac
hin
es
(Un
its)
Year
Number of additive manufacturing machines within South Africa and respondent cluster
3D printers
Total rapid prototyping machines
Respondents existing and projected ownership of additive manufacturing machines
Total number of respondents with direct knowledge a company that owns or leases an additivemanufacturing machine

56 | P a g e
reasons for additive manufacturing adding value to their business, prototyping (42
percent of respondents) was the key word used by respondents when taken in the
context in which it was used. Thus, it is suggested that prototyping, jigs and fixtures and
specialist items may be motivating the adoption of additive manufacturing at this stage.
Figure 5. 1 showed that 52 percent of respondents categorised themselves as
participants in the general machinery and specialist machinery (26 percent) sub-sectors.
The engines, turbines, pumps and compressors subsector had the second largest
contribution with 14 percent. Thus with a large percentage of respondents taking part in
the special machinery sector, this further motivates the use of additive manufacturing
with in the cluster for the production of prototypes and equivalent one-off items. Further,
engines, turbines, pumps and compressors are often customised to meet application
specific duty-points and as such may further drive the use of additive manufacturing for
one-off items. Seventy-six percent of respondents also claimed that their primary raw
material was a type of steel followed by 11 percent claiming a type of plastic as their
primary material (Figure 5. 2). Additive manufacturing techniques can be used to process
both of these materials to produce final products however; metallic additive
manufacturing machines lie within the high-cost, high-capability division which only
comprises 21 percent of the machines within South Africa (Wild, 2014). When
considering this in combination with the key factor of incorrect material availability (Table
5. 2) being a key hindrance to additive manufacturing adding value to a business, this
once again supports additive manufacturing primarily being used for one-off prototype
application opposed to mass production type manufacturing.
When quantifying the adoption within the cluster, it was suspected that knowledge was
key component to the adoption of additive manufacturing. Rogers (2003) who referred
to the adoption process as the innovation-decision process with knowledge being the
first step in the process supported this statement (p.8). Fifty-five percent of respondents
stated they had research the additive manufacturing and 45 percent of respondents
claimed to have found the information they were looking for. This was substantially higher
than the 16 percent that had already adopted the technology thus showing considerable
interest by respondents that had not yet adopted. The result was 2.8 times as many
people have research the topic and found the information they seek by comparison to
existing adopters. Thus suggesting a pool of adopters large enough to support
exponential growth of adoptions. However, when considering only 25% of respondents
could explain common additive manufacturing terminology, it is improbable that the level

57 | P a g e
of research conducted was sufficient to support the persuasion stage of Rogers (2003)
innovation-decision process. This suggests that there are a sufficient number of
respondents interested in additive manufacturing to support exponential growth;
however, it is questionable whether the research being conducted or the information
currently available is sufficient to persuade potential adopters to adopt.
Question 2
The Abernathy-Utterback model (Abernathy, 1978) is a classic model describing the link
between product development and process development. It plays an important part in
the explanation of diffusion of production type equipment as it can explain the shift in
focus from the product to the product integration into existing manufacturing
environments. The model proposes that following the establishment of a dominant
technology, design focus shifts from product to process.
Eighty-one percent of respondents believed that a dominant technology does not exist
and of the remaining 19 percent, none selected the same technology as dominant. This
is therefore viewed as 100 percent of respondents not agreeing on a dominant
technology. The presented literature (p.20) can be interpreted to support this because
multiple additive manufacturing technologies are currently available in the local market
(Guo & Leu, 2013). Further, the development of a middle-class of machines (Earls &
Baya, 2014) has the potential to challenge any existing technologies that seems to be
developing a dominant position. Figure 6. 2 presents the Abernathy-Utterback model as
presented in Chapter 2. However, it includes a proposed current design line based on
respondents lack in belief of a dominant design as well as findings from literature.
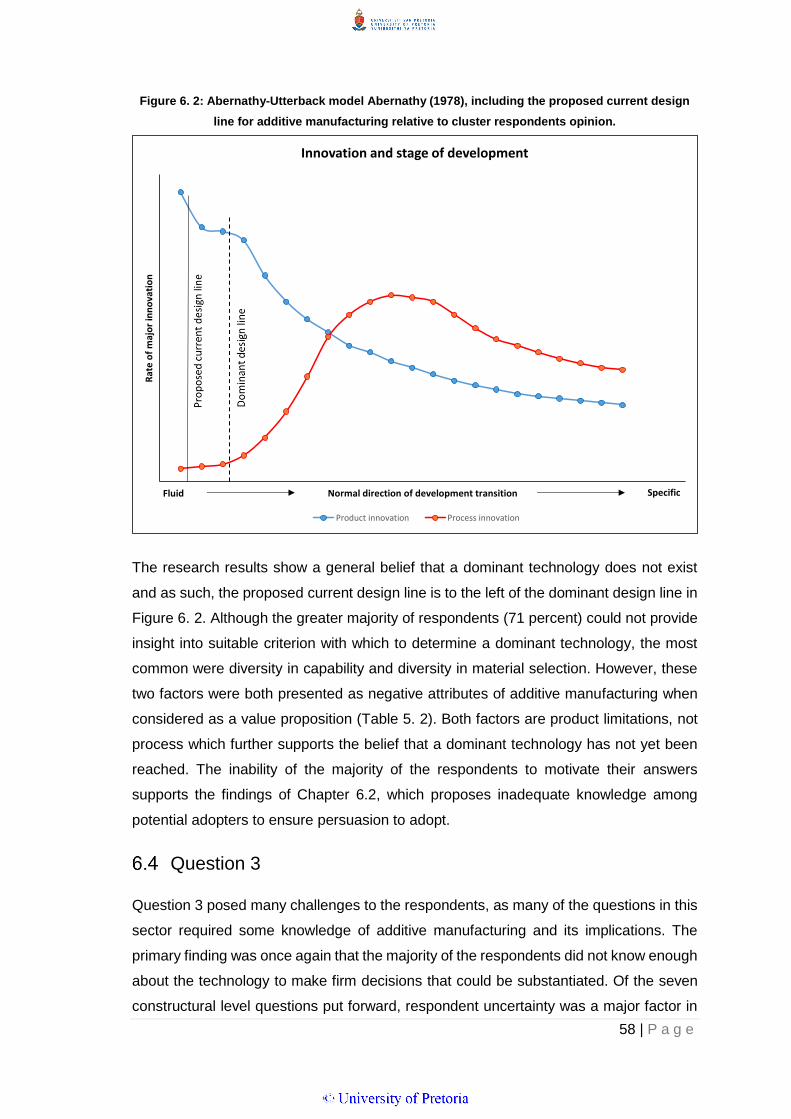
58 | P a g e
Figure 6. 2: Abernathy-Utterback model Abernathy (1978), including the proposed current design
line for additive manufacturing relative to cluster respondents opinion.
The research results show a general belief that a dominant technology does not exist
and as such, the proposed current design line is to the left of the dominant design line in
Figure 6. 2. Although the greater majority of respondents (71 percent) could not provide
insight into suitable criterion with which to determine a dominant technology, the most
common were diversity in capability and diversity in material selection. However, these
two factors were both presented as negative attributes of additive manufacturing when
considered as a value proposition (Table 5. 2). Both factors are product limitations, not
process which further supports the belief that a dominant technology has not yet been
reached. The inability of the majority of the respondents to motivate their answers
supports the findings of Chapter 6.2, which proposes inadequate knowledge among
potential adopters to ensure persuasion to adopt.
Question 3
Question 3 posed many challenges to the respondents, as many of the questions in this
sector required some knowledge of additive manufacturing and its implications. The
primary finding was once again that the majority of the respondents did not know enough
about the technology to make firm decisions that could be substantiated. Of the seven
constructural level questions put forward, respondent uncertainty was a major factor in
Rat
e o
f m
ajo
r in
no
vati
on
Normal direction of development transition
Innovation and stage of development
Product innovation Process innovation
Fluid Specific
59 | P a g e
five. This equates to 71 percent of all questions asked. As part of this discussion,
information suggesting weaker and stronger areas of respondent knowledge will be
presented.
When reviewing preferable sub-technologies within the additive manufacturing industry,
it was found that a significant lack in understanding of the technology existed. This was
supported by 74 percent of respondents admitting so. It was also found that a substantial
portion of the respondents that believed they understood the technology actually did not.
This can be motivated by the fact that only 25 percent of respondents that selected
material extrusion technique could actually apply this technique with their selected
primary raw material. Further, of the 76 percent of respondents that chose a type of steel
as their primary raw material, only 6 percent selected an additive manufacturing method
that supported construction with this material.
Understanding the cost implications of additive manufacturing is exceptional complex
with companies unable to grasp the implications. So much so that this has spawned an
industry of specialist consultants assisting companies in determining such implications.
One such example would be Senvol.
Respondents were split on whether additive manufacturing was more cost effective than
other existing manufacturing techniques. This was a perfectly acceptable answer as
there are many highly complex factors that contribute to the cost of item production. So
much so that computer simulation of the manufacturing process is often used to
determine the cost effectiveness. This is linked to Conner et al. (2014) model showing
possible areas of advantage to additive manufacturing (p.21).
Table 5. 4 presented the anticipated costs that respondents expected to pay for an
additive manufacturing machine. The first observation was the normal distribution of the
cost estimates about the R750 001 – R2 000 000 amount. When broken down into
material categories, the distribution remained normal in both the iron, steel products and
the Stainless steel, tool steel market sub-segments. However, the distributions in the
plastic products and rubber components industries were not normal. These distributions
supported the fact that the majority of the respondents were from the steel industry (76
percent) and suggested that conclusions draw from this research would be applicable to
the steel additive manufacturing industry however caution should be exercised should
conclusions be drawn about the plastic or rubber additive manufacturing markets.
60 | P a g e
Rogers (2003) referred to the adoption process as the innovation-decision process. He
explained that the innovation-decision process was a five steps process:
1. Knowledge
2. Persuasion
3. Decision
4. Implementation
5. Confirmation
When asked if respondents believed they could motivate either for or against the
adoption of additive manufacturing, only 6 percent believed they could. The remaining
used the key-words-in-context “Have not done sufficient research” which suggests
insufficient knowledge. According to Rogers innovation-decision model, knowledge is the
first step which supports the second, persuasion. Without knowledge, persuasion cannot
occur. This is consistent with the research findings.
When reviewing other-key-words-in-context with respect to the motivation for or against
additive manufacturing, support for key constructs emerged. Uncertainty regarding
machine capability and lack in understanding of manufactured item cost structures using
additive manufacturing were both highlighted. Both these constructs had appeared in
previous areas of the research. Of interest was one of the respondents that stated he
understood the cost structures involved as he had a simple 3-D printer at home.
The earlier literature review presented The Technology, Organisation and Environment
framework (p.13). This model consisted of three primary constructs each with multiple
sub-constructs. The sub-constructs of availability and technology support infrastructure
were believe to be of importance should additive manufacturing intend on gaining traction
in Gauteng and as such were tested. Seventy-four percent of respondents felt they were
uncertain if there were sufficient equipment suppliers within the Gauteng area, 23
percent believed there were an insufficient number of suppliers and only 3 percent
believed there were sufficient suppliers. Thus, based on The Technology, Organisation
and Environment framework, a technological innovation decision would be exceptionally
difficult as neither the external task environment nor the technology construct could
support a decision due to failure of sub-constructs.
Manufacturing is the process of converting a raw material into a finished product.
However, beyond just the raw material is the second order affect surrounding availability
61 | P a g e
and the ease of procurement. Respondents were split with regards to the second order
effects of additive manufacturing on material procurement (35 percent believed it would
result in additional challenges, 35 percent believed it would not and 30 percent chose to
refrain from answering. This was consistent with Cohen (2014) who stated that
executives do not understand the second order effects of additive manufacturing on their
organisations.
Primary problems sighted by respondents were not of second order nature but rather
primary. Additional material expense, difficulties importing materials and insufficient
material suppliers were sighted. These problems are not uncommon for manufacturing
companies using traditional methods. However, one valuable insight obtained was from
a respondent who stated, “Need alternative material suppliers”. This respondent was
making reference to the fact that within the additive manufacturing industry raw material
is supplied by machine manufacturers (much like a conventional paper printer). However,
in the traditional manufacturing industry, material come from one supplier while
manufacturing equipment comes from another. This potential second order affect could
have substantial effects on companies’ procurement policy (companies being tied to
single suppliers).
If additive manufacturing is to continue being adopted, it needs to demonstrate its ability
to produce finished goods and in so doing build confidence in its capability. Only 26
percent of respondents believed that additive manufacturing could manufacture an
equivalent finished product to that which they currently make. When looking at the key-
words-used-in-context as motivation for their argument, just under 50 percent of the
respondents that did not think additive manufacturing could produce an equivalent
product, believe size was an issue. The cost of large components was also raised. This
was consistent with Cohen (2014) who stated that additive manufacturing is still not cost
effective for most end-product or high-volume commercial manufacturers.
The last construct evaluated was that of shared opinions of the various stakeholders.
This was somewhat present in both the Diffusion of Innovation Model (Oliveira & Martins,
2011) and The Technology, Organization and Environment Framework (Oliveira ^
Martins, 2011). A little over half (55 percent) of the respondents believed that the various
stakeholders would have a shared opinion over the adoption of additive manufacturing.
However, as shown in chapter five, the motivation for their thoughts could clearly be
divided into two categories:
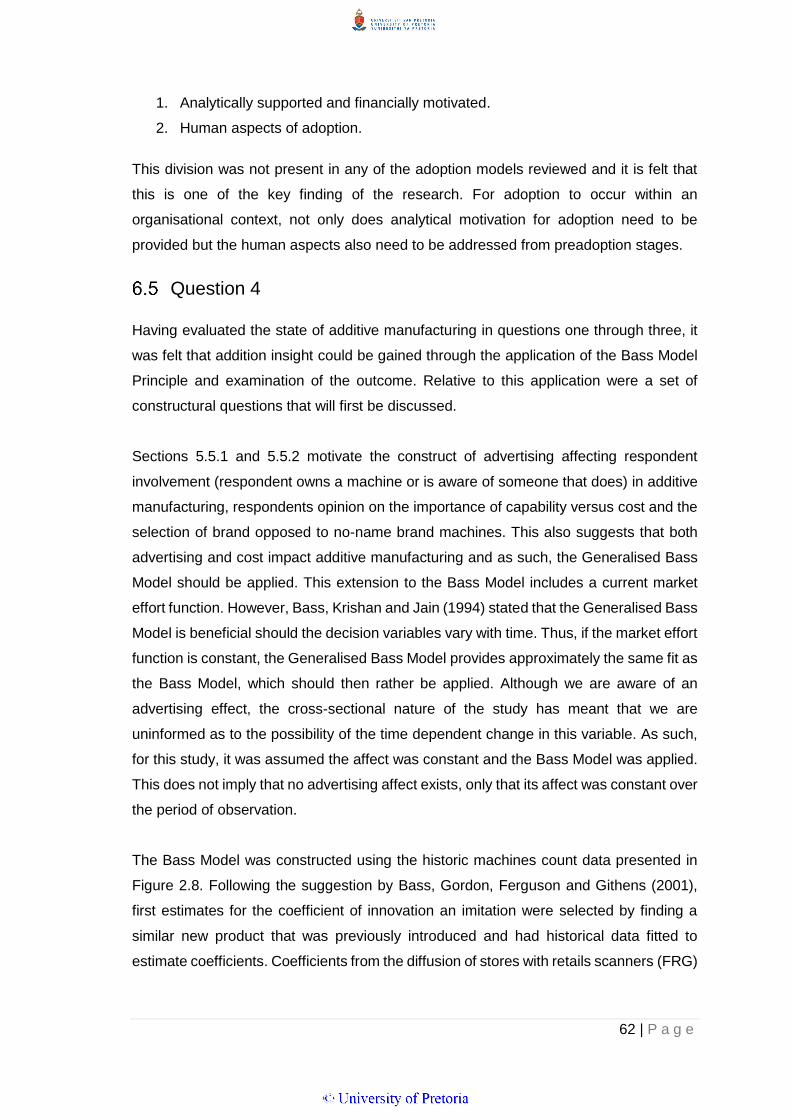
62 | P a g e
1. Analytically supported and financially motivated.
2. Human aspects of adoption.
This division was not present in any of the adoption models reviewed and it is felt that
this is one of the key finding of the research. For adoption to occur within an
organisational context, not only does analytical motivation for adoption need to be
provided but the human aspects also need to be addressed from preadoption stages.
Question 4
Having evaluated the state of additive manufacturing in questions one through three, it
was felt that addition insight could be gained through the application of the Bass Model
Principle and examination of the outcome. Relative to this application were a set of
constructural questions that will first be discussed.
Sections 5.5.1 and 5.5.2 motivate the construct of advertising affecting respondent
involvement (respondent owns a machine or is aware of someone that does) in additive
manufacturing, respondents opinion on the importance of capability versus cost and the
selection of brand opposed to no-name brand machines. This also suggests that both
advertising and cost impact additive manufacturing and as such, the Generalised Bass
Model should be applied. This extension to the Bass Model includes a current market
effort function. However, Bass, Krishan and Jain (1994) stated that the Generalised Bass
Model is beneficial should the decision variables vary with time. Thus, if the market effort
function is constant, the Generalised Bass Model provides approximately the same fit as
the Bass Model, which should then rather be applied. Although we are aware of an
advertising effect, the cross-sectional nature of the study has meant that we are
uninformed as to the possibility of the time dependent change in this variable. As such,
for this study, it was assumed the affect was constant and the Bass Model was applied.
This does not imply that no advertising affect exists, only that its affect was constant over
the period of observation.
The Bass Model was constructed using the historic machines count data presented in
Figure 2.8. Following the suggestion by Bass, Gordon, Ferguson and Githens (2001),
first estimates for the coefficient of innovation an imitation were selected by finding a
similar new product that was previously introduced and had historical data fitted to
estimate coefficients. Coefficients from the diffusion of stores with retails scanners (FRG)
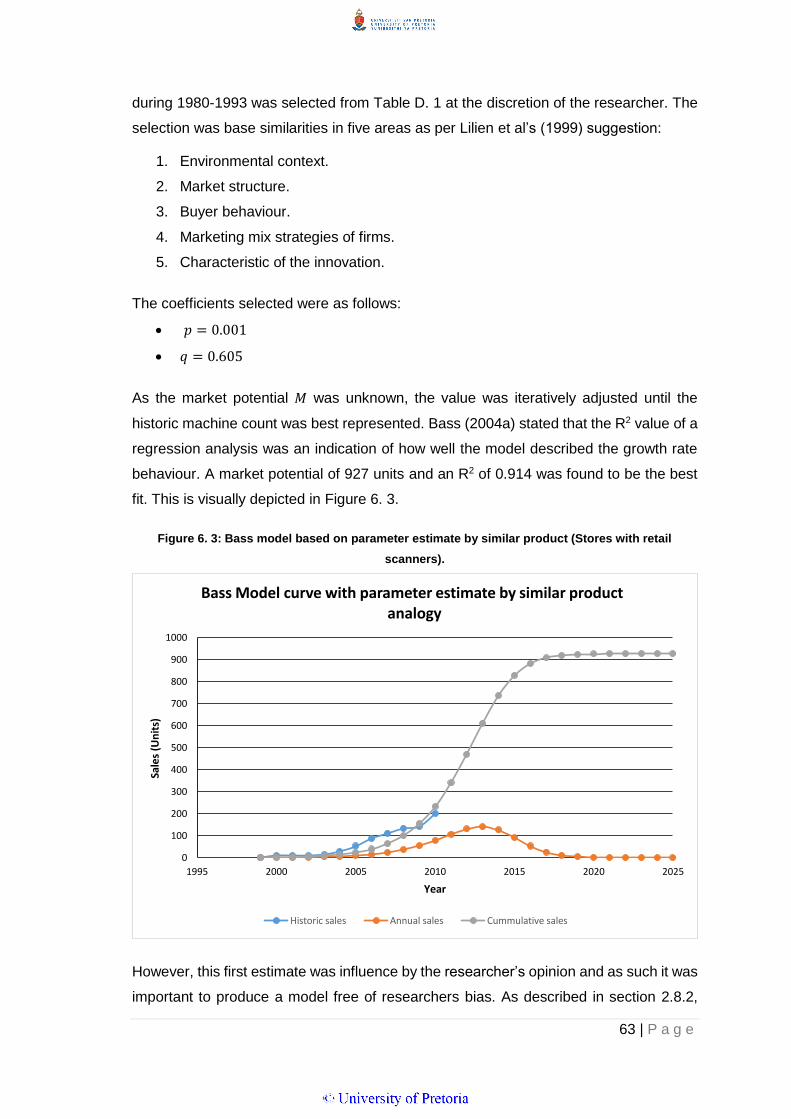
63 | P a g e
during 1980-1993 was selected from Table D. 1 at the discretion of the researcher. The
selection was base similarities in five areas as per Lilien et al’s (1999) suggestion:
1. Environmental context.
2. Market structure.
3. Buyer behaviour.
4. Marketing mix strategies of firms.
5. Characteristic of the innovation.
The coefficients selected were as follows:
𝑝 = 0.001
𝑞 = 0.605
As the market potential 𝑀 was unknown, the value was iteratively adjusted until the
historic machine count was best represented. Bass (2004a) stated that the R2 value of a
regression analysis was an indication of how well the model described the growth rate
behaviour. A market potential of 927 units and an R2 of 0.914 was found to be the best
fit. This is visually depicted in Figure 6. 3.
Figure 6. 3: Bass model based on parameter estimate by similar product (Stores with retail
scanners).
However, this first estimate was influence by the researcher’s opinion and as such it was
important to produce a model free of researchers bias. As described in section 2.8.2,
0
100
200
300
400
500
600
700
800
900
1000
1995 2000 2005 2010 2015 2020 2025
Sale
s (U
nit
s)
Year
Bass Model curve with parameter estimate by similar product analogy
Historic sales Annual sales Cummulative sales

64 | P a g e
Bass (2004a) provided a method of obtaining all three of the required parameters by
applying the discrete analogue (equation 2-6) to the Bass Model Principle (equation 2-5).
However, when applying this method, two negative solutions for the coefficient of
imitation were obtained. These resulted in negative solutions for both the coefficient of
innovation as well as the potential market. Thus, the obtained solution could not be real
and the diffusion could not be modelled using Bass’s discrete analogue method.
Massiani and Gohs (2015) reported having encountering the same problem with this
method.
They continue to advise that other authors have recommended estimation of the Bass
coefficients directly from the differential equation (2-5) as a solution. However, Masiani
and Gohs (2015) do advise that the superiority of estimating the Bass parameters directly
from the differential equation (2-5) rather than its discrete analogue (2-6) is not
established. When solving for the parameters directly, the following values were
obtained:
𝑝 = 0.012
𝑞 = 0.468
𝑀 = 927 units
The calculation of these values was followed by a regression analysis that resulted in an
R2 = 0.98. This model is shown in Figure 6. 4.
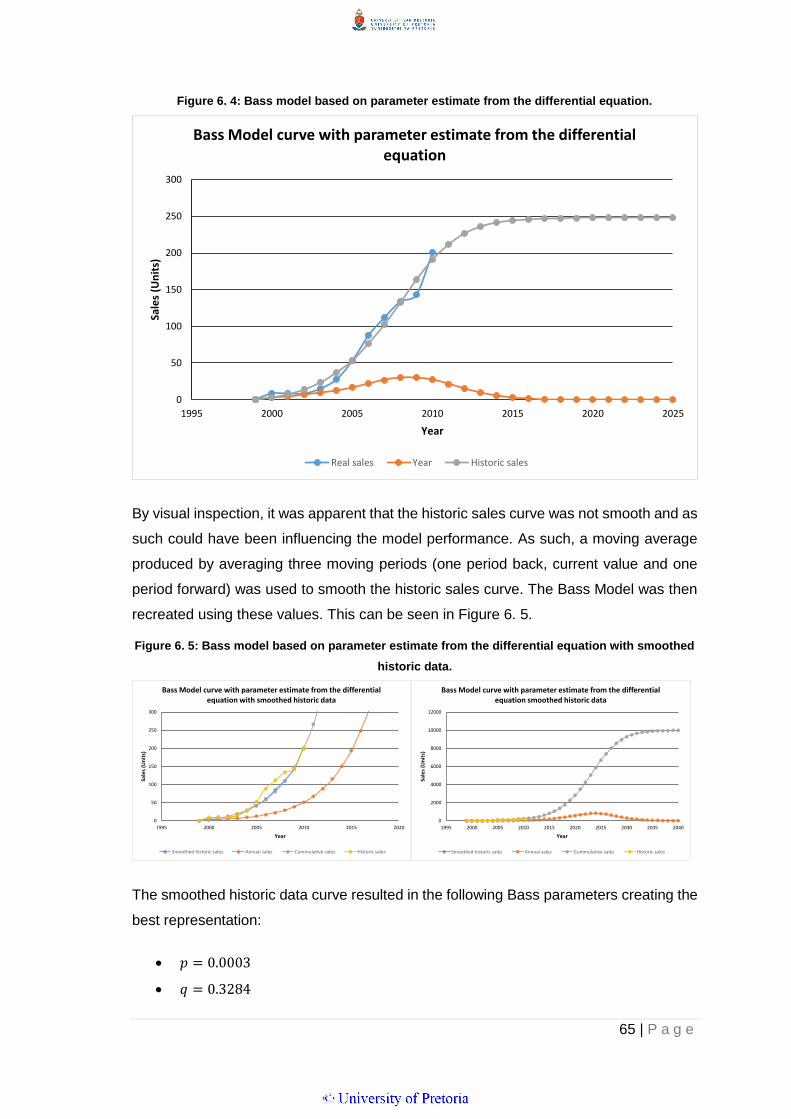
65 | P a g e
Figure 6. 4: Bass model based on parameter estimate from the differential equation.
By visual inspection, it was apparent that the historic sales curve was not smooth and as
such could have been influencing the model performance. As such, a moving average
produced by averaging three moving periods (one period back, current value and one
period forward) was used to smooth the historic sales curve. The Bass Model was then
recreated using these values. This can be seen in Figure 6. 5.
Figure 6. 5: Bass model based on parameter estimate from the differential equation with smoothed
historic data.
The smoothed historic data curve resulted in the following Bass parameters creating the
best representation:
𝑝 = 0.0003
𝑞 = 0.3284
0
50
100
150
200
250
300
1995 2000 2005 2010 2015 2020 2025
Sale
s (U
nit
s)
Year
Bass Model curve with parameter estimate from the differential equation
Real sales Year Historic sales
0
50
100
150
200
250
300
1995 2000 2005 2010 2015 2020
Sale
s (U
nit
s)
Year
Bass Model curve with parameter estimate from the differential equation with smoothed historic data
Smoothed historic sales Annual sales Cummulative sales Historic sales
0
2000
4000
6000
8000
10000
12000
1995 2000 2005 2010 2015 2020 2025 2030 2035 2040
Sale
s (U
nit
s)
Year
Bass Model curve with parameter estimate from the differential equation smoothed historic data
Smoothed historic sales Annual sales Cummulative sales Historic sales

66 | P a g e
𝑀 = 10000 units
The regression analysis relative to the smoothed historic data and the subsequent Bass
Model yielded a R2 = 0.997 while the actual historic data to the Bass Model (created
using the smoothed curve) R2 = 0.96.
The three model have a significant variation in outcome with the market potential
estimate ranging from 248 units peak by 2018 through 10000 units by 2045. However,
Massiani and Gohs (2015) suggest that coefficient of innovation values should lie
between 0.00007 and 0.03 while coefficient of imitation values should range between
0.38 and 0.53. Should this be applied, the curve created by analogue to a similar product
and displayed in Figure 6. 3 becomes invalid (this brings in to question the values of the
initial estimate). However, this removes the nominal estimate leaving the two extremes.
When reviewing the historic sales data, there is a clear reduction in growth of sales in
2009 which was the time of the global financial crisis. Thus if we remove the effects of
this, we effectively obtain the results show in Figure 6. 5 which would be the
recommended Bass Model for additive manufacturing machine diffusion in South Africa.
Figure 1. 1 shows that the Gauteng province contributes 34 percent to the national Grows
Domestic Product. As such, if we assume that 34 percent of all additive manufacturing
machine projected are located in Gauteng, it is estimated that approximately 26 additive
manufacturing machine should currently be located within the Gauteng province.

67 | P a g e
7 Conclusion
Introduction
This study aimed to determine the status of additive manufacturing within the Gauteng
province of South Africa and identify factors that are motivating or prohibiting this
technologies uptake. Following the discussion of the results in the previous chapter, a
model connecting the various theories and the key research finding will now be
presented. The relevance of this research to company manager will then be presented
as well as the limitations of this research and recommendations for future for research
within the adoption of additive manufacturing field.
Principle Findings
This research was conducted at the abstract level and as such, in defining the status of
additive manufacturing, constructs that affect the adoption of additive manufacturing
were identified and composed with existing theoretical models to create Figure 7. 1. The
arrows in this figure do not indicate directionality of constructs or their implications but
rather suggest a direction of process flow for clarity purposes.
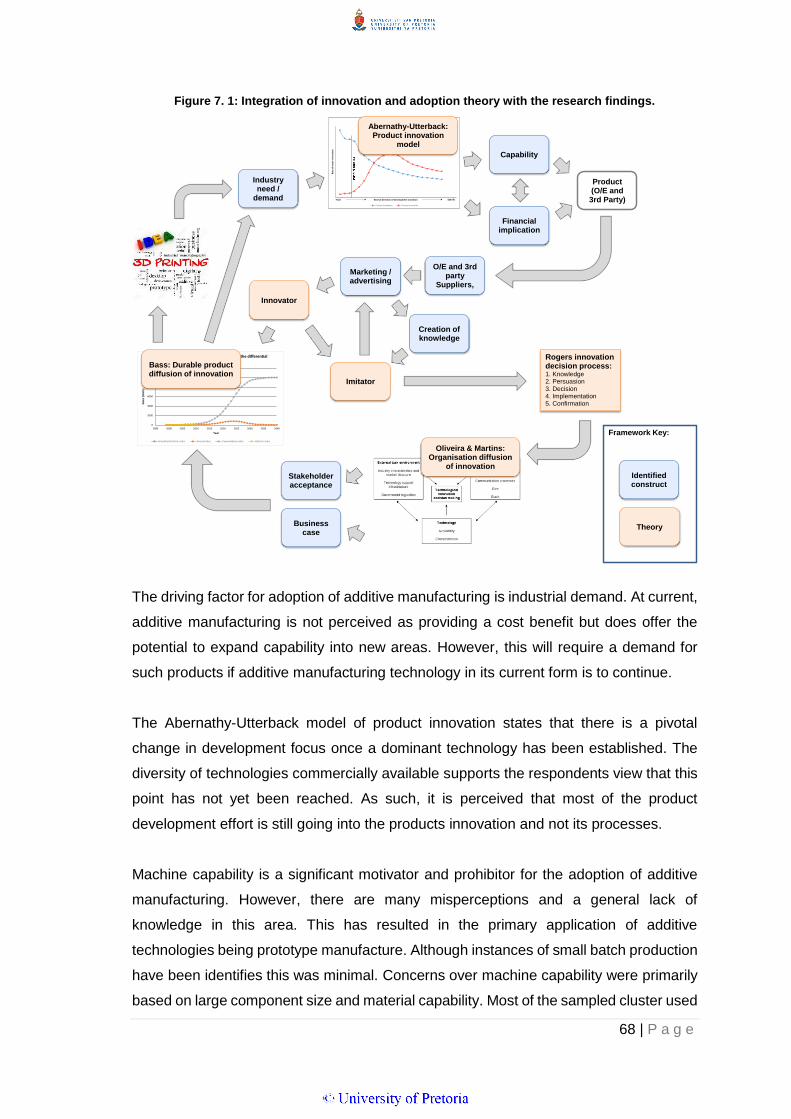
68 | P a g e
Figure 7. 1: Integration of innovation and adoption theory with the research findings.
The driving factor for adoption of additive manufacturing is industrial demand. At current,
additive manufacturing is not perceived as providing a cost benefit but does offer the
potential to expand capability into new areas. However, this will require a demand for
such products if additive manufacturing technology in its current form is to continue.
The Abernathy-Utterback model of product innovation states that there is a pivotal
change in development focus once a dominant technology has been established. The
diversity of technologies commercially available supports the respondents view that this
point has not yet been reached. As such, it is perceived that most of the product
development effort is still going into the products innovation and not its processes.
Machine capability is a significant motivator and prohibitor for the adoption of additive
manufacturing. However, there are many misperceptions and a general lack of
knowledge in this area. This has resulted in the primary application of additive
technologies being prototype manufacture. Although instances of small batch production
have been identifies this was minimal. Concerns over machine capability were primarily
based on large component size and material capability. Most of the sampled cluster used
Rat
e o
f m
ajo
r in
no
vati
on
Normal direction of development transition
Innovation and stage of development
Product innovation Process innovation
Fluid Specific
0
2000
4000
6000
8000
10000
12000
1995 2000 2005 2010 2015 2020 2025 2030 2035 2040
Sale
s (U
nit
s)
Year
Bass Model curve with parameter estimate from the differential equation smoothed historic data
Smoothed historic sales Annual sales Cummulative sales Historic sales
Rogers innovation decision process:1. Knowledge2. Persuasion3. Decision4. Implementation5. Confirmation
Bass: Durable product diffusion of innovation
Abernathy-Utterback:Product innovation
model
Marketing / advertising
Financialimplication
Capability
Industryneed /
demand
Creation of knowledge
Oliveira & Martins: Organisation diffusion
of innovation
O/E and 3rd party
Suppliers,
Product (O/E and 3rd Party)
Innovator
Imitator
Businesscase
Stakeholderacceptance
Identified construct
Theory
Framework Key:
69 | P a g e
steels as the primary raw material and as such, introduction of cost effective additive
manufacturing machines may start a shift into product manufacturing and not just
prototypes.
The research found that the cost structure of additive manufacturing is not well
understood. Direct product costs (raw materials) are assumed to be expensive as they
are imported and have additional beneficiation as a raw material (e.g. powderized, plastic
extrusion). Further, machine overheads and secondary costs are also not understood.
Extension of the titanium beneficiation program (DefenceWeb, 2015) to include other
raw materials required by manufacturers may prove to be advantageous to the adoption
of the technology in the local context.
Roth (2014) proposed that seller and purchasers of additive manufacture equipment
have differing views about the value of these machines. Consistent with this, it is evident
that machine suppliers and purchases have a differing viewpoints on the supply of
material. Respondents expect to purchase material from third party material suppliers
and not the machine supplier, as is currently thhe norm for materials used by traditional
manufacturing equipment. However, it appears that local machine suppliers are following
the same model as paper printer manufacturers, which supply both machine and
material. This may result in unsettled executives as this model effectively ties
manufacturers to suppliers.
Marketing in the form of advertisements has had an effect on the opinion of respondents.
It was found that it affected the clusters respondents machine cost versus performance
as well as their brand versus no-name brand perception. As we were only intending on
identifying influential constructs, neither causality nor directionality was tested or proven
however evidence of its affect was found.
Rogers (2003) originally categorised adopters into five categories. Bass (2004) later
simplified this categorisation into innovators and imitators. Innovators are akin to impulse
buyers that have to be the first to own a product. Imitators are slower and adopt a product
later in the cycle. Critical to this is that the innovators influence imitators. Bass (2004)
defines the increasing influence or pressure on an imitator to purchase as a linear
association. Imitators are also more dependent on information and product knowledge
to motivate an adoption. The research found a complete lack in subject knowledge
beyond cover press. This is in support of Cohen’s (2014) findings. Based on Rogers

70 | P a g e
(2003) innovation decision process, knowledge and persuasion are the first two steps.
Thus if the individual does not have sufficient knowledge of the field, it is unsightly that
they will be able to persuade themselves that adoption of the technology is the correct
option. Thus, the quantity, quality and relevance of the additive manufacturing related
media is critical at this stage in the Gauteng industry based on results from the cluster.
Should an imitator be able to persuade himself that adoption is the correct option, in
many settings within Gauteng, he will have to persuade relevant stakeholders of the
value in the adoption. This connects to Oliveira & Martins (2011) Technology,
Organisation and Environment Framework as well as their Diffusion of innovation model
(more than one stakeholder). Beyond the constructs already discussed, the research
highlighted the need for technology support, which could be connected to the models.
The research showed that the greater majority of the respondents felt that there were
insufficient machine supplier and inadequate support.
Critical to the adoption was the alignment in opinions of stakeholders. The research
found that there were two constructs that needed to be addressed in relation to the
adoption of additive manufacturing. The first was the financial justification (business
case) while the other was the human aspect. Many respondents believed individuals
would resist the change. Some suggestions were provided to why this could be however
insufficient evidence was available to motivate the presentation of sup-constructs in this
field. Cohen (2014) found that a lack of knowledge surrounding additive manufacturing
was a major problem and as such, suggest the identification of champions within upper
management to promote technologies such as additive manufacturing within the
organisation before attempting adoption.
The result of this flow present in Figure 7. 1 was technology adoption. This was modelled
using The Bass Model Principle and historic sales data compiled by du Preez et al.
(2011). The model showed an increase in the rate of diffusion of the additive
manufacturing machines until 2023 at which time the rate of diffusion will slow until the
maximum market penetration is achieved in 2045. However, a constant market effort
was assumed due to the available information produced by the cross-sectional research.
Should the market effort (e.g. increase advertising and diffusion of accurate information)
deviate from its current, it is expected that the Bass Model produced for this research
will become inaccurate.

71 | P a g e
Implications for Management
This research is academic in nature however; it has far-reaching implication for
management of both additive manufacturing equipment companies as well as product
manufacturing companies. Based on the insights gained from the research, the following
implications for managers are put forward.
There is an immense hype currently surrounding additive manufacturing however, this
research shows that there are exceptionally few people competent in making an
argument for or against the adoption of the technology. It is recommended that time be
invested in obtaining the required knowledge prior to make any decision for or against
the adoption of the technology.
Marketing for additive manufacturing equipment is having an effect on both the
perception of cost versus capability as well as brand name versus no-brand name
machine adoption. Thus, it is recommended that machine manufacturers be cautious of
the message being portrait in the current press the technology is receiving. Should
machine manufacturers wish to increase the market potential, or rate of diffusion, a
significant increase in the market effort will be required.
Additive manufacturing’s primary area of deployment is currently in prototype
manufacture. However, based on the fact that a dominant technology has not yet been
achieved, this signals that substantial development to additive manufacturing equipment
is yet to come. This may lead to solutions to factors currently limiting the technology. As
such, it is recommended that executives keep track of the technology until it reaches a
dominant design, which should signal a stabilisation in the technology. Further, many
executives are having difficulty understanding the second order effects of the technology.
This will be clarified once the technology development stabilises and efforts are invested
in process development.
There is a clear gap between the perceptions of those selling additive manufacturing
machines and those purchasing them. This gap extends from the motivation of the initial
capital outlay of the machine to material supplier conflict. It is suggested that manager
seeking to adopt additive manufacturing technology understand the material supply
chain prior to adoption.

72 | P a g e
Limitations of the Research
The research findings have been presented and discussed however it is important to
understand the limitations and constraints of the research so as to avoid
misinterpretation. To follow will be a discussion on some of the limitations of this
research.
The research design was one of abstract level research and not empirical level. Thus,
constructs that have a high probability of affect the adoption of additive manufacturing
were identified. The level of construct correlation was not determined and causality was
not proven.
The findings of this research were established on survey data obtained from respondents
located in the Sebenza industrial business district within Gauteng. The relatively small
sample size realized may limit the credibility of results when generalised to large areas
even though the adopted method of a random cluster samples permits such
generalisation (Zikmund et al., 2013).
The sub–sector of manufacturing in which respondents conduct their business as well
as the type of primary material they use would have an effect on their perspective and
as such the research data. The majority of the respondents were orientated towards the
metallic item trade and as such, the influencing factors on these respondents needs to
be considered when generalising the results presented in this report to all forms of
additive manufacturing.
With respect to diffusion theory, an implicit bias of preadoption exists (Straub, 2009).
Thus, the questionnaire questions were carefully constructed with the intent of creating
equal adoption or rejection conditions. However, this bias may still be evident.
Many of the models reviewed and applied are influenced by social cognitive theory
(Straub, 2009). Social cognitive theory is one of the most influential theories in
psychology and it should be acknowledged that theories of adoption and diffusion do not
include many of these aspects.

73 | P a g e
Suggestions for the Future
Following this research, the following suggestion for future research is made:
Many constructs have been identified at an abstract level. Extending on this work and
verifying the presented findings at an empirical level would extend the knowledge and
understanding of adoption in South African industrial markets.
The generation of Bass Models from data collected in other industrial clusters within
South Africa’s major hubs would provide valuable comparison data and could provide
insight into South African industrial technology appetite within South Africa.
Extending on the application of the Bass model, it would be of interest to study the
marketing of additive manufacturing in South Africa. This knowledge could then be used
to derive conclusions with regard to the current market effort and recreate a Bass model
using the Generalised Bass Model thus showing the effects of marketing on the adoption
of additive manufacturing.
The research suggested that adopters are uncomfortable with machine manufacturers
supplying machines and raw materials. With traditional manufacturing methods,
machines and raw materials were procured from different suppliers thus reducing the
dependability of product manufacturers on machine manufacturers. It further encouraged
competition among material suppliers as product differentiation was not possible. Thus,
the relationship between suppliers and adopters should be studied and compared to that
of existing manufacturers and material suppliers relations.
74 | P a g e
References
Abernathy, W. J., & Utterback, J. M. (1978). Patterns of industrial innovation.
Technology Review, 80(7), 40-47.
Abernathy, W. J. (1978). The productivity dilemma: Roadblock to innovation in the
automotive industry. Baltimore: John Hopkins University Press.
Akiike, A. (2013). Where is Abernathy and Utterback model? Annals of Business
Administrative Science, 12, 225-236.
Balinski, B. (2014). What’s behind the 3D printing boom? Manufacturers' Monthly,
August, 22-23.
Bass, F. M. (2004a). A new product growth for model consumer durables. Management
Science, 50(12), 1825-1832. doi:10.1287/mnsc.1040.0264
Bass, F. M. (2004b). Comments on "A new product growth for model consumer
durables". Management Science, 50(12), 1833-1840.
doi:10.1287/mnsc.1040.0300
Bass, F. M., Gordon, K., Ferguson, T. L., & Githens, M. L. (2001). DIRECTV:
Forecasting diffusion of a new technology prior to product launch. Interfaces,
31(3), S82-S93.
Bass, F. M., Krishnan, T. V., & Jain, D. C. (1994). Why the bass model fits without
decision variables. Marketing Science, 13(3), 203-223.
Brown, A. S. (2014, February). By the numbers: A big forecast. Mechanical
Engineering, 28-29.
75 | P a g e
Campbell, R., De Beer, D., & Pei, E. (2011). Additive manufacturing in South Africa:
Building on the foundations. Rapid Prototyping Journal, 17(2), 156-162.
doi:10.1108/13552541111113907
Canalys. (2014). 3D printing market to grow to US$16.2 billion in 2018. Retrieved from
http://www.canalys.com/newsroom/3d-printing-market-grow-us162-billion-
2018#sthash.jovzltNE.dpuf
Cohen, D. L. (2014). Fostering mainstream adoption of industrial 3D printing:
Understanding the benefits and promoting organizational readiness. 3D Printing
and Additive Manufacturing, 1(2), 62-69.
Cohen, D., Sargeant, M., & Somers, K. (2014, 3-D printing takes shape. Mckinsey
Quarterly, 1-6.
Conner, B. P., Manogharan, G. P., Martof, A. N., Rodomsky, L. M., Rodomsky, C. M.,
Jordan, D. C., & Limperos, J. W. (2014). Making sense of 3-D printing: Creating a
map of additive manufacturing products and services. Additive Manufacturing,
1(4), 64.
Creswell, J. W. (2003). Research design: Qualitative, quantitative, and mixed methods
approaches (Second Edition ed.). Thausand Oaks, California: Sage publications.
Davis, F. D. (1989). Perceived usefulness, perceived ease of use and user acceptance
of information technology. Management Information Systems Research Center,
University of Minnesota, 13(3), 319-340.
De Beer, D. J. (2008). South Africa 2007 additive fabrication (AF) landscape.
().RAPDASA Annual RP Growth in South Africa.

76 | P a g e
de Jong, J. P. J., & de Bruijn, E. (2013). Innovation lessons from 3-D printing.
MITSloan Management Review, 54(2), 43-52.
DefenceWeb. (2013). Boeing and CSIR collaborate on titanium powder manufacturing.
Retrieved from
http://www.defenceweb.co.za/index.php?option=com_content&view=article&id=30
811:boeing-and-csir-collaborate-on-titanium-powder-
manufacturing&catid=7:Industry&Itemid=116
du Preez, W., & de Beer, D. (2006). RAPDASA–A vehicle for product development
technology diffusion in South Africa.
Earls, A., & Baya, V. (2014). The road ahead for 3-D printers. (No. 2). New York:
PricewaterhouseCoopers.
Geelhoed, A. (2014) 3D printing: The new industrial revolution that will change the
landscape of credit risk management. Business Credit, 34-37.
Gill, S. G., & Kaplas, M. (2009). Comparative study of 3D printing technologies for rapid
casting of aluminium alloy. Materials and Manufacturing Processes, 24(12), 1405-
1411. doi:10.1080/10426910902997571
Guo, N., & Leu, M. C. (2013). Additive manufacturing: Technology, applications and
research needs. Frontiers of Mechanical Engineering, 8(3), 215-243.
Lilien, G. L., & Rangaswamy, A. (2007). Marketing engineering: Computer-assisted
marketing analysis and planning DecisionPro.
Lilien, G., Rangaswamy, A., & Van den Bulte, C. (1999). Diffusion models: Managerial
applications and software. (No. ISBM Report 7-1999). Pennsylvania: Institute for
the Study of Business Markets, Pennsylvania State University.
77 | P a g e
Loff, S. (2014). International space station's 3-D printer. Retrieved from
https://nasa.gov/content/interational-space-station-s-3-d-printer
Manyika, J., Chui, M., Bughin, J., Dobbs, R., Bisson, P., & Marrs, A. (2013). Disruptive
technologies: Advances that will transform life, business, and the global economy.
().Mckinsey Global Institute.
Marshall, B., Cardon, P., Poddar, A., & Fontenot, R. (2013). Does sample size matter
in qualitative research?: A review of qualitative interviews in IS research. Journal
of Computer Information Systems, 54(1), 11-22.
Massiani, J., & Gohs, A. (2015). The choice of bass model coefficients to forecast
diffusion for innovative products: An empirical investigation for new automotive
technologies. Research in Transportation Economics, 50, 17-28.
Mavuso, Z. (2014). Can South Africa’s manufacturing sector rise again? Retrieved from
http://www.engineeringnews.co.za/article/can-south-africas-manufacturing-sector-
rise-again-2014-10-31-1
Mbatha, A., & Cohen, M. (2014). South Africa’s ANC struggles to contain union conflict.
Retrieved from http://www.bloomberg.com/news/articles/2014-11-10/south-africa-
s-ruling-coalition-crumbles-as-unions-split
Norton, J. A., & Bass, F. M. (1987). A diffusion theory model of adoption and
substitution for Successive generations of high-technology products. Management
Science, 33(9), 1069-1086.
Oliveira, T., & Martins, M. F. (2011). Literature review of information technology
adoption models at firm level. The Electronic Journal Information Systems
Evaluation, 14(1), 110-121.

78 | P a g e
Porter, M. E. (2007). Technology and competitive advantage. The Journal of Business
Strategy, 5(3), 60-78.
Robinson, B., & Lakhani, C. (1975). Dynamic price models for new-product planning.
Management Science, 21(10), 1113-1122.
Rogers, E. M. (Ed.). (2003). Diffusion of innovation (5th Edition ed.). New York: Simon
& Schuster.
Roth, S. (2014). The cash is in the medium: On the stage management of 3D printing.
Ryan, G. W., & Bernard, H. R. (2003). Techniques to identify themes. Field Methods,
15(1), 85-109.
Saunders, M., & Lewis, P. (2012). Doing research in business & management, an
essential guide to planning your project. Essex, England: Harrow: Financial Times
Prentice Hall.
Savage, N. (2014). Time for a change. Communications of the ACM, 57(6), 16-18.
doi:10.1145/2601075
Small Enterprise Development Agency. (2012). Research on the performance of the
manufacturing sector.
(http://www.seda.org.za/Publications/Pages/ResearchPublications.aspx).
Johannesburg, South Africa: Um Jwali Market Research.
Sobh, R., & Perry, C. (2005). Research design and data analysis in realism research.
European Journal of Marketing, 40(11/12), 1194-1209.
doi:10.1108/03090560610702777

79 | P a g e
Statistics South Africa. (2012). Census 2011. Retrieved from
http://www.statssa.gov.za/publications/P03014/P030142011.pdf
Statistics South Africa. (2014). Gross domestic product. Annual estimates 2004-2013,
regional estimates 2004-2013, third quarter 2014. Retrieved from
http://www.statssa.gov.za/publications/P0441/P04413rdQuarter2014.pdf
Statistics South Africa. (2015a). Exports and imports unit value indicies may 2015.
Retrieved from
http://www.statssa.gov.za/publications/P01427/P01427May2015.pdf
Statistics South Africa. (2015b). Gross domestic product first quarter 2015. Retrieved
from http://www.statssa.gov.za/publications/P0441/P04411stQuarter2015.pdf
Statistics South Africa. (2015c). Quarterly employment statistics (QES) march 2015.
Retrieved from
http://www.statssa.gov.za/publications/P0277/P0277March2015.pdf
Straub, E. T. (2009). Understanding technology adoption: Theory and future directions
for informal learning. Review of Educational Research, 79(2), 625-649.
doi:10.3102/0034654308325896
The White House. (2014). President Obama announces two new public-private
manufacturing innovation institutes and launches the first of four new
manufacturing innovation institute competitions. Retrieved from
https://www.whitehouse.gov/the-press-office/2014/02/25/president-obama-
announces-two-new-public-private-manufacturing-innovatio
Thilmany, J. (2014, October). By the numbers: Growth by addition. Mechanical
Engineering, 30-31.
80 | P a g e
Utterback, J. M., & Abernathy, W. J. (1975). A dynamic model of process and product
innovation. Omega, 3(6), 645.
Venkatesh, V., Morris, M. G., Davis, G. B., & Davis, F. D. (2003). User acceptance of
information technology: Toward a unified view. Management Information Systems
Research Center, University of Minnesota, 27(3), 425-478.
Weller, C., Kleer, R., & Piller, F. T. (2015). Economic implications of 3D printing: Market
structure models in light of additive manufacturing revisited. International Journal
of Production Economics, 164, 43-56.
Wild, S. (2014). SA joins 3D printing revolution. Retrieved from
http:mg.co.za/article/2014-09-26-sa-joins-3d-printing-revolution
Zikmund, W., Babin, B., Carr, J., & Griffin, M. (2013). Business research methods (9th
Edition ed.) Cengage Learning.

81 | P a g e
Appendices
Appendix A: Research questionnaire
(Reproduced using Survey Monkey tool)
Dear Participant
You are here with invited to participate in an academic research project. Given the recent
press additive manufacturing (the formal name for 3D printing) has recent received; this
research aims to evaluate the adoption of the additive manufacturing technology in the
manufacturing industry in the Gauteng province.
Please note that your participation in this survey is completely voluntary and you can
withdraw at any time without penalty. Your responses will be treated with the highest
confidentiality and is to be used solely for the purpose of research. The research findings
will be available on request from Daniel Kunniger ([email protected]).
By completing this research questionnaire, it is accepted that you give full consent to the
researcher to make use of your responses for the described research. It is acknowledged
that the provided information will be used for academic research purposes ONLY and
that your responses will be treated in an anonymous and confidential manner.
There are a total of 19 fundamental questions that need to be completed. Please answer
all questions. The questionnaire should take approximately 15 minutes of your time.
I truly appreciate your willingness to participate in this important research project and the
valuable time you are willing to commit in completing this research questionnaire.
Kind Regards
Researcher:
Daniel Kunniger

82 | P a g e
How much adoption is occurring?
1. Does your company own or lease an additive manufacturing machine?
(Yes/ No)
2. Do you know any manufacturing companies that own an additive
manufacturing machine? (Yes/ No)
3. Do you believe additive manufacturing does/ could add value to your
business? (Yes/No)
4. Why? (Explanation)
At what level of penetration is the adoption occurring?
5. Does/ would your company use additive manufacturing machine for
technology experimentation (learning about additive manufacturing)?
(Yes/ No)
6. Does/ would your company your company use additive manufacturing to
replace older manufacturing techniques or extend current capabilities?
(Tick-box to select one of the two options)
7. Would/ are the majority of the items you manufacture using an additive
manufacturing machine: one-off/ small batch/ mass production items?
(Tick-box to select one of the three)
When are companies adopting additive manufacturing?
8. If you company owns an additive machine, when did you procure it?
(Year or N/a)
9. If your company is considering procuring an additive machine, when do
you anticipate this acquisition to happen? (Year or N/a)
In what industries is additive manufacturing being adopted?
10. Would you consider your company to be a general manufacturing
company (will manufacture anything for anyone) or would it be specific
to an industry? (Tick-boxes with pre-selected fields including other)
11. What is the primary raw material your company works with (e.g. Mild
steel, tool steel, ABS plastic)? (Tick-boxes with pre-selected fields
including other)
12. Do you believe additive manufacturing machines can “print” an
equivalent raw material to that which your company currently uses?
(Yes/ No)
How interested are companies in additive manufacturing?
83 | P a g e
13. Have you researched additive manufacturing in any way? This includes
reading magazine articles, attending presentation, internet searches etc.
(Yes/No)
14. Did you find the information you were looking for? (Yes/ No)
Are companies aware of different technologies and do they have
sufficient knowledge of them?
15. Indicate which of the following additive manufacturing processes you
believe you could explain in layman’s terms (Tick-boxes with pre-
selected fields including none):
i. Binder jetting
ii. Direct energy deposition
iii. Material extrusion
iv. Material jetting
v. Powder bed fusion
vi. Sheet lamination
vii. Vat photopolymerization
viii. None
Is there a perceived dominant technology?
16. Do you believe any one of the above process is preferable. (Yes/ No)
17. Please explain your answer?
Is there a reason for a technology to be seen as dominant?
18. Which of the following best describes the reason you believe the
process you selected in question 6 is dominant? (Tick-box)
i. Most popular.
ii. Most diverse in capability.
iii. Best value for money.
iv. The variety of materials.
v. Speed of the process.
vi. Don’t know.
Is there a preferred technology for the respondents operating domain?
19. Which technology do you believe is best suited to your company? (Tick-
boxes with the same list as question 18)
20. Please explain your answer?
What are the financial implications of additive manufacturing?
21. Do you believe additive manufacturing costs more to manufacture an
equivalent item than using traditional manufacturing techniques? Please
motivate your answer. (Yes/ No)
22. Please explain your answer?

84 | P a g e
23. How much do you anticipate an additive manufacturing machine
capable of manufacturing your company’s products to cost? (Tick-box to
select a price category: R0 – R100 000; R100 001 – R250 000; R250
001 - R750 000; R750 001 – R2 000 000; Over R 2 000 000)
Are companies sufficiently exposed to allow for an adoption decision to
be made?
24. Do you believe you have sufficient knowledge on additive manufacturing
to motivate a decision for or against the adoption of additive
manufacturing? Why (Yes/ No)
25. Please explain your answer?
Are there sufficient equipment providers in the industry to create
confidence in adopting?
26. Do you believe there are sufficient machine suppliers in Gauteng with
the correct support structures available? (Yes/ No/ Not sure)
Are the required materials available in the additive manufacturing
industry?
27. Do you believe raw material procurement for additive manufacturing
equipment will require more effort or pose more problems than that of
existing materials and if so, why? (Yes/ No)
28. Please explain you answer?
Is additive manufacturing capable of manufacturing companies existing
products?
29. Do you believe additive manufacturing machines are geometrically
capable of manufacturing your products (i.e. tolerance, size, etc.)?
Please specify any units you do not believe will be possible. E.g., we
manufacture item 1m in diameter that I believe is too big for additive
manufacturing equipment that is available. (Unit and explanation)
Do all stakeholders have the same opinion of additive manufacturing?
30. Do you believe different departments/personal in your company will
have differing opinions on whether to adopt or not to adopt additive
manufacturing in the future?(Yes/No)
31. Do you believe this will prevent adoption of additive manufacturing in
your company? (Explanation)
Does advertising impact the adoption of additive manufacturing?
32. Have you seen any advertising for additive manufacturing services or
equipment? (Yes/ No)
Does advertising affect the price sensitivity of companies entering the
additive manufacturing industry?

85 | P a g e
33. Would the cost of an additive manufacturing machine be more
important to you then machines capabilities? (Yes/ No)
34. Would you be prepared to pay more for a reputable name brand
machine opposed to a lesser known machine with an equivalent
specification? (Yes/ No)
Are additive manufacturing machines seen as durable purchases?
35. How do you believe you should determine when to replace an
additive manufacturing machine? I.e. get a newer model, discard, or
replace with the same machine only newer. (Descriptive)
Do you see the company as an innovator or an imitator?
36. Do you consider your company to be an innovator or an imitator
(more of a follower) in its product design and manufacture? (Tick-box,
Innovator or imitator)
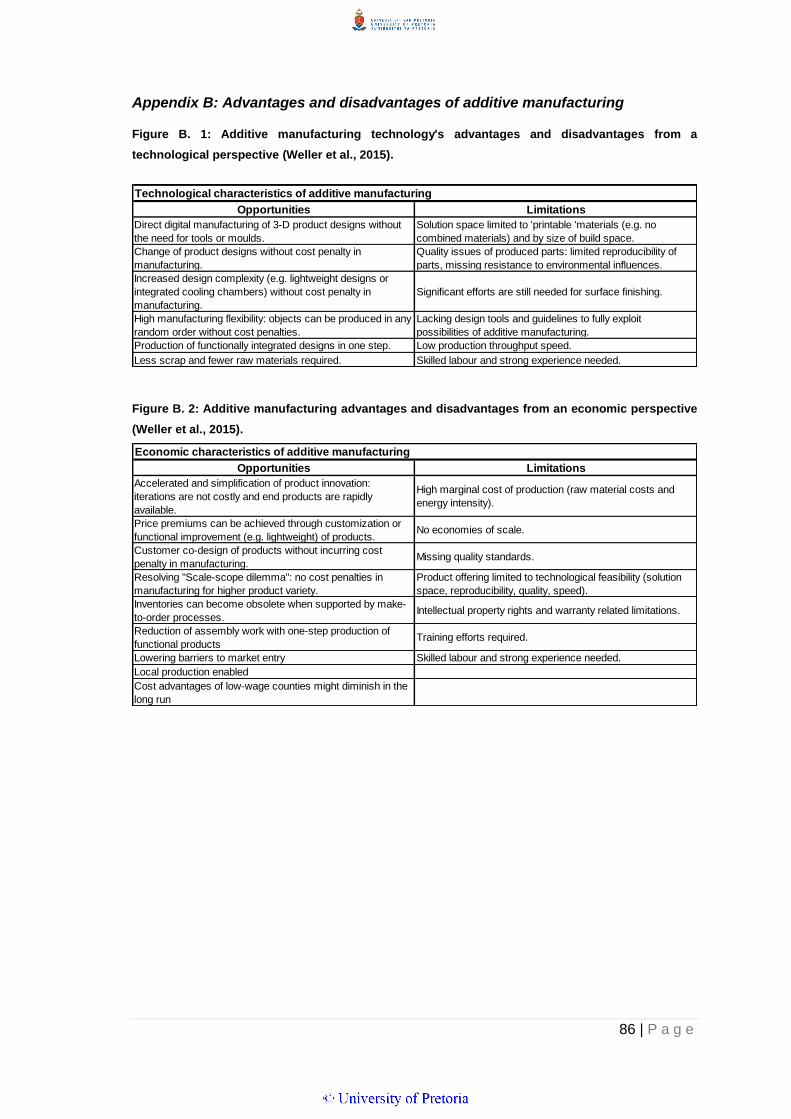
86 | P a g e
Appendix B: Advantages and disadvantages of additive manufacturing
Figure B. 1: Additive manufacturing technology's advantages and disadvantages from a
technological perspective (Weller et al., 2015).
Figure B. 2: Additive manufacturing advantages and disadvantages from an economic perspective
(Weller et al., 2015).
Opportunities Limitations
Direct digital manufacturing of 3-D product designs without
the need for tools or moulds.
Solution space limited to 'printable 'materials (e.g. no
combined materials) and by size of build space.
Change of product designs without cost penalty in
manufacturing.
Quality issues of produced parts: limited reproducibility of
parts, missing resistance to environmental influences.
Increased design complexity (e.g. lightweight designs or
integrated cooling chambers) without cost penalty in
manufacturing.
Significant efforts are still needed for surface finishing.
High manufacturing flexibility: objects can be produced in any
random order without cost penalties.
Lacking design tools and guidelines to fully exploit
possibilities of additive manufacturing.
Production of functionally integrated designs in one step. Low production throughput speed.
Less scrap and fewer raw materials required. Skilled labour and strong experience needed.
Technological characteristics of additive manufacturing
Opportunities Limitations
Accelerated and simplification of product innovation:
iterations are not costly and end products are rapidly
available.
High marginal cost of production (raw material costs and
energy intensity).
Price premiums can be achieved through customization or
functional improvement (e.g. lightweight) of products.No economies of scale.
Customer co-design of products without incurring cost
penalty in manufacturing.Missing quality standards.
Resolving "Scale-scope dilemma": no cost penalties in
manufacturing for higher product variety.
Product offering limited to technological feasibility (solution
space, reproducibility, quality, speed).
Inventories can become obsolete when supported by make-
to-order processes.Intellectual property rights and warranty related limitations.
Reduction of assembly work with one-step production of
functional productsTraining efforts required.
Lowering barriers to market entry Skilled labour and strong experience needed.
Local production enabled
Cost advantages of low-wage counties might diminish in the
long run
Economic characteristics of additive manufacturing

87 | P a g e
Appendix C: Bass Model Parameters for eleven consumer durable products
Table C. 1: Bass Model input parameters for eleven consumer durable products (Bass 2004a, p.1828).
Product Period covered a (103) b c(10-7) m(103) p q
electronic refrigerators 1920-1940 104,67 0,21350 -0,053913 40,001 0,0026167 0,21566
Home freezers 1946-1961 38,12 0,15298 -0,077868 21,973 0,018119 0,17110
Black and white television 1946-1961 2696,20 0,22317 -0,025957 96,717 0,027877 0,25105
Water softeners 1949-1961 0,10 0,27925 -512,59 5,793 0,017703 0,29695
Room air conditioners 1946-1961 175,69 0,40820 -0,24777 16,895 0,010399 0,41861
Clothes dryers 1948-1961 259,67 0,33968 -0,23647 15,092 0,017206 0,35688
Power lawnmowers 1948-1961 410,98 0,32871 -0,075506 44,751 0,0091837 0,33790
Electric bed coverings 1949-1961 450,04 0,23800 -0,031842 76,589 0,005876 0,24387
Automatic coffee makers 1948-1961 1008,20 0,28435 -0,051242 58,838 0,017135 0,30145
Steam irons 1949-1960 1594,70 0,29928 -0,058875 55,696 0,028632 0,32791
Recover players 1952-1961 543,94 0,62931 -0,29817 21,937 0,024796 0,65410

88 | P a g e
Appendix D: Bass Model Parameters for various consumer durable products
Table D. 1: Parameters of the Bass model in several product categories based on penetration data
and long series data (Lilien et al, 1999).
Product/Technology Period of analysis p q m
Tractors (thousands of units) 1921-1964 0 0,134 5201
Hybrid corn 1927-1941 0 0,797 100
Artificial insemination 1943-1959 0,028 0,307 73,2
Bale hay 1943-1959 0,013 0,455 92,2
Ultrasonic imaging 1965-1978 0 0,534 85,8
Mammography 1965-1978 0 0,729 57,1
CT scanner (50-99 beds) 1980-1993 0,044 0,35 57,9
CT scanner (>100 beds) 1974-1993 0,036 0,268 95
Oxygen steel furnace (USA) 1955-1980 0,002 0,435 60,5
Oxygen steel furnace (France) 1961-1980 0,008 0,279 88,4
Oxygen steel furnace (Japan) 1959-1975 0,049 0,333 81,3
Steam (vs. sail) merchant ships (UK) 1815-1965 0,006 0,259 86,7
Plastic milk containers (1 gallon) 1964-1987 0,02 0,255 100
Plastic milk containers (half gallon) 1964-1987 0 0,234 28,8
Stores with retail scanners (FRG, units) 1980-1993 0,001 0,605 16702
Stores with retail scanners (Denmark, units) 1986-1993 0,076 0,54 2061
Room air conditioner 1950-1979 0,006 0,185 60,5
Bed cover 1949-1979 0,008 0,13 72,2
Blender 1949-1979 0 0,26 54,5
Can opener 1961-1979 0,05 0,126 68
electric coffee maker 1955-1979 0,042 0,103 100
Clothes dryer 1950-1979 0,009 0,143 701
Clothes washer 1923-1971 0,016 0,049 100
Coffee maker ADC 1974-1979 0,077 1,106 32,2
Curling iron 1974-1979 0,101 0,762 29,9
Dishwasher 1949-1979 0 0,213 47,7
Disposer 1950-1979 0 0,179 50,4
Fondue 1972-1979 0,166 0,44 4,6
Freezer 1949-1979 0,019 0 94,2
Fry pan 1957-1979 0,142 0 65,6
Hair dryer 1972-1979 0,055 0,399 51,6
Hot plates 1932-1979 0,056 0 26,3
Microwave oven 1972-1990 0,002 0,357 91,6
Mixer 1949-1979 0 0,134 97,7
Power leaf blower (gas or electric) 1986-1996 0,013 0,315 26
Range 1925-1979 0,004 0,065 63,6
Range, built-in 1957-1979 0,048 0,086 21,7
Refrigerator 1926-1979 0,025 0,126 99,7
Slow cooker 1974-1979 0 1,152 34,4
Steam iron 1950-1979 0,031 0,128 100
Toaster 1923-1979 0,038 0 100
Cable television 1981-1994 0,1 0,06 68
calculators 1973-1979 0,143 0,52 100
Camcorder 1986-1996 0,044 0,304 3,5
CD player 1986-1996 0,055 0,378 29,6
Cellular telephone 1986-1996 0,008 0,421 45,1
Cordless telephone 1984-1996 0,004 0,338 67,6
electronic toothbrush 1991-1996 0,11 0,548 14,8
Home PC (millions of units) 1982-1988 0,121 0,281 258
Radio 1922-1933 0,027 0,435 100
Telephone answering device 1984-1996 0,025 0,406 69,6
Television, black and white 1949-1979 0,108 0,231 96,9
Television, colour 1965-1979 0,058 0,146 100
VCR 1981-1994 0,025 0,603 76,3
Average 0,37 0,327
25th percentile; median; 75th percentile 0,004; 0,025; 0,054 0,134; 0,28; 0,435
Agricultural
Unless indicated, the model was estimated on penetration data collected in the USA
Consumer Electronics
Electrical appliances
Production Technology
Medical equipment
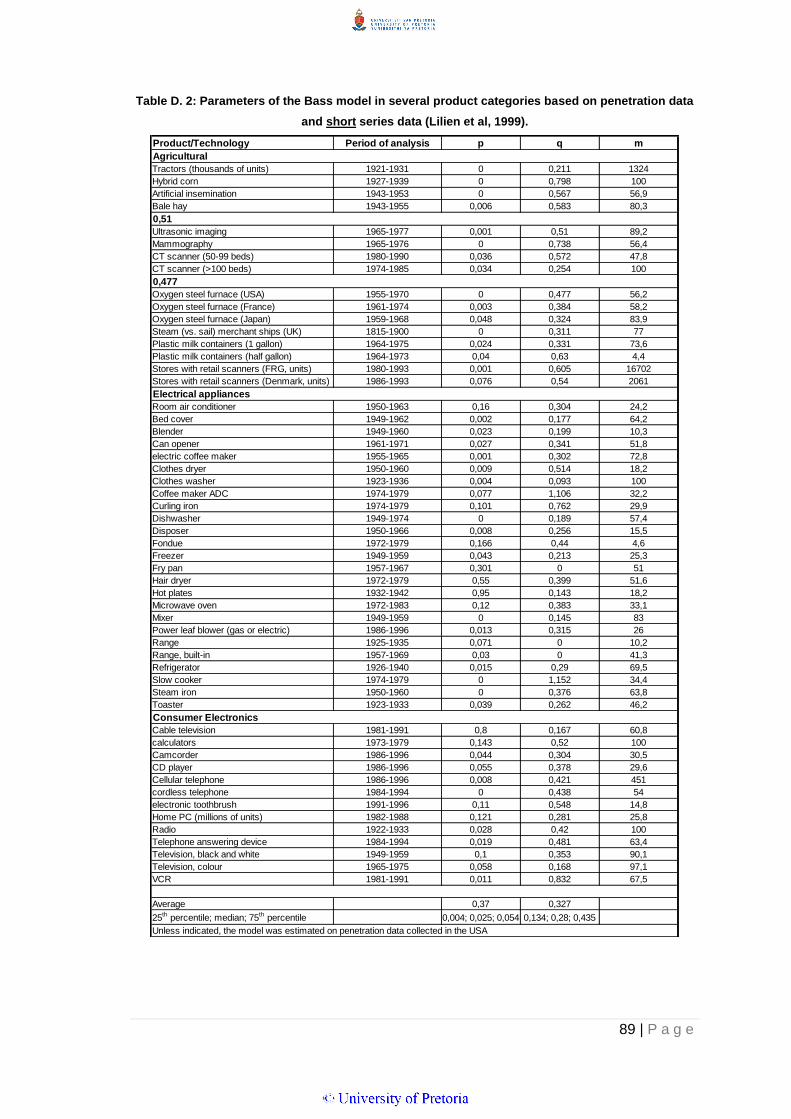
89 | P a g e
Table D. 2: Parameters of the Bass model in several product categories based on penetration data
and short series data (Lilien et al, 1999).
Product/Technology Period of analysis p q m
Tractors (thousands of units) 1921-1931 0 0,211 1324
Hybrid corn 1927-1939 0 0,798 100
Artificial insemination 1943-1953 0 0,567 56,9
Bale hay 1943-1955 0,006 0,583 80,3
Ultrasonic imaging 1965-1977 0,001 0,51 89,2
Mammography 1965-1976 0 0,738 56,4
CT scanner (50-99 beds) 1980-1990 0,036 0,572 47,8
CT scanner (>100 beds) 1974-1985 0,034 0,254 100
Oxygen steel furnace (USA) 1955-1970 0 0,477 56,2
Oxygen steel furnace (France) 1961-1974 0,003 0,384 58,2
Oxygen steel furnace (Japan) 1959-1968 0,048 0,324 83,9
Steam (vs. sail) merchant ships (UK) 1815-1900 0 0,311 77
Plastic milk containers (1 gallon) 1964-1975 0,024 0,331 73,6
Plastic milk containers (half gallon) 1964-1973 0,04 0,63 4,4
Stores with retail scanners (FRG, units) 1980-1993 0,001 0,605 16702
Stores with retail scanners (Denmark, units) 1986-1993 0,076 0,54 2061
Room air conditioner 1950-1963 0,16 0,304 24,2
Bed cover 1949-1962 0,002 0,177 64,2
Blender 1949-1960 0,023 0,199 10,3
Can opener 1961-1971 0,027 0,341 51,8
electric coffee maker 1955-1965 0,001 0,302 72,8
Clothes dryer 1950-1960 0,009 0,514 18,2
Clothes washer 1923-1936 0,004 0,093 100
Coffee maker ADC 1974-1979 0,077 1,106 32,2
Curling iron 1974-1979 0,101 0,762 29,9
Dishwasher 1949-1974 0 0,189 57,4
Disposer 1950-1966 0,008 0,256 15,5
Fondue 1972-1979 0,166 0,44 4,6
Freezer 1949-1959 0,043 0,213 25,3
Fry pan 1957-1967 0,301 0 51
Hair dryer 1972-1979 0,55 0,399 51,6
Hot plates 1932-1942 0,95 0,143 18,2
Microwave oven 1972-1983 0,12 0,383 33,1
Mixer 1949-1959 0 0,145 83
Power leaf blower (gas or electric) 1986-1996 0,013 0,315 26
Range 1925-1935 0,071 0 10,2
Range, built-in 1957-1969 0,03 0 41,3
Refrigerator 1926-1940 0,015 0,29 69,5
Slow cooker 1974-1979 0 1,152 34,4
Steam iron 1950-1960 0 0,376 63,8
Toaster 1923-1933 0,039 0,262 46,2
Cable television 1981-1991 0,8 0,167 60,8
calculators 1973-1979 0,143 0,52 100
Camcorder 1986-1996 0,044 0,304 30,5
CD player 1986-1996 0,055 0,378 29,6
Cellular telephone 1986-1996 0,008 0,421 451
cordless telephone 1984-1994 0 0,438 54
electronic toothbrush 1991-1996 0,11 0,548 14,8
Home PC (millions of units) 1982-1988 0,121 0,281 25,8
Radio 1922-1933 0,028 0,42 100
Telephone answering device 1984-1994 0,019 0,481 63,4
Television, black and white 1949-1959 0,1 0,353 90,1
Television, colour 1965-1975 0,058 0,168 97,1
VCR 1981-1991 0,011 0,832 67,5
Average 0,37 0,327
25th percentile; median; 75th percentile 0,004; 0,025; 0,054 0,134; 0,28; 0,435
Unless indicated, the model was estimated on penetration data collected in the USA
Agricultural
0,51
0,477
Electrical appliances
Consumer Electronics
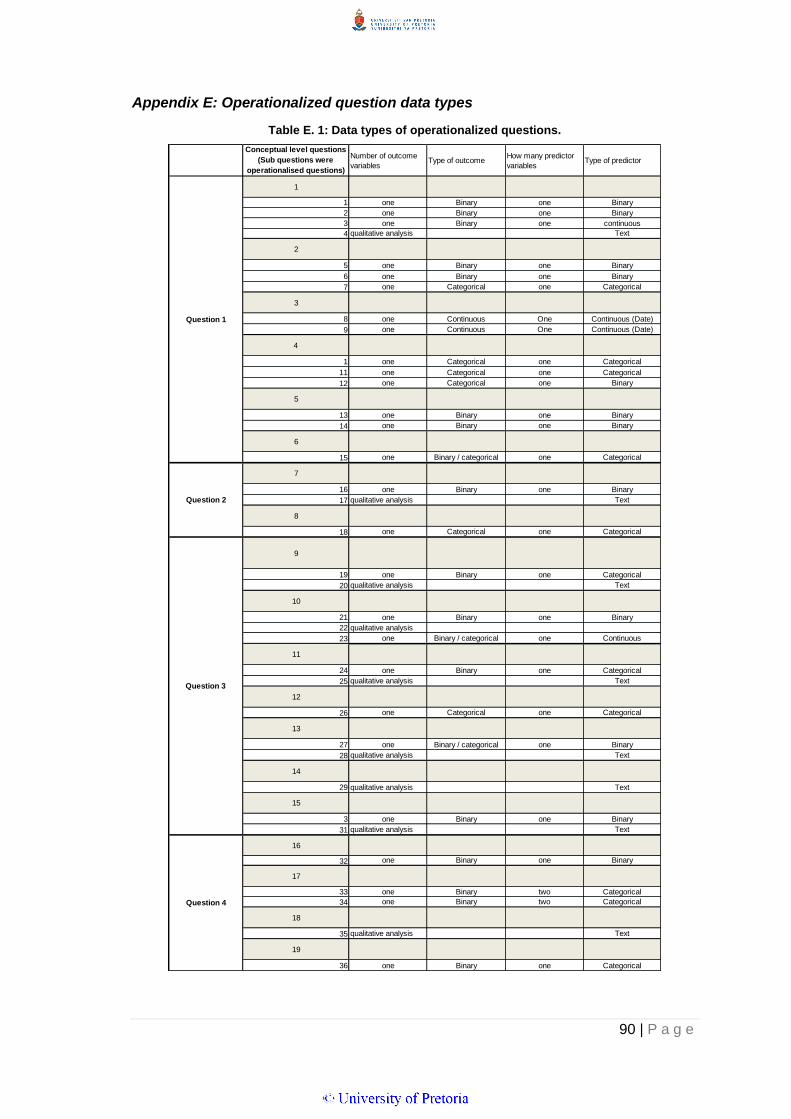
90 | P a g e
Appendix E: Operationalized question data types
Table E. 1: Data types of operationalized questions.
Number of outcome
variablesType of outcome
How many predictor
variablesType of predictor
1
1 one Binary one Binary
2 one Binary one Binary
3 one Binary one continuous
4 qualitative analysis Text
2
5 one Binary one Binary
6 one Binary one Binary
7 one Categorical one Categorical
3
8 one Continuous One Continuous (Date)
9 one Continuous One Continuous (Date)
4
1 one Categorical one Categorical
11 one Categorical one Categorical
12 one Categorical one Binary
5
13 one Binary one Binary
14 one Binary one Binary
6
15 one Binary / categorical one Categorical
7
16 one Binary one Binary
17 qualitative analysis Text
8
18 one Categorical one Categorical
9
19 one Binary one Categorical
20 qualitative analysis Text
10
21 one Binary one Binary
22 qualitative analysis
23 one Binary / categorical one Continuous
11
24 one Binary one Categorical
25 qualitative analysis Text
12
26 one Categorical one Categorical
13
27 one Binary / categorical one Binary
28 qualitative analysis Text
14
29 qualitative analysis Text
15
3 one Binary one Binary
31 qualitative analysis Text
16
32 one Binary one Binary
17
33 one Binary two Categorical
34 one Binary two Categorical
18
35 qualitative analysis Text
19
36 one Binary one Categorical
Conceptual level questions
(Sub questions were
operationalised questions)
Question 3
Question 4
Question 1
Question 2

91 | P a g e
Appendix F: Ethical clearance approval