direct characterization of kerogen by x-ray and solid ... - sim… · direct characterization of...
TRANSCRIPT

Direct Characterization of Kerogen byX-ray and Solid-State 13C NMR Methods
26th Oil Shale Symposium
S. R. Kelemen, M. Afeworki, H. Freund M. L. Gorbaty, M. Sansone, M. Siskin, C.WaltersExxonMobil Research and Engineering Company, Annandale, NJ, 08801
M. Solum, R. J. PugmireDepartments of Chemical Engineering and Chemistry,
University of Utah, Salt Lake City, Utah, 84112

1
Background
• Understanding the chemistry of complex carbonaceous materials is aided by developing representative chemical structural models
– Ideally want to link chemical structure models to reactivity models
• In the past, model development was aided by information gatheredusing an indirect characterization strategy
– Mildly decompose the organic solid, separate, identify and quantify the components using liquid and gaseous characterization methods
– Employ selective nondestructive chemical derivatization and analysis
• A large amount of chemical detail must be self-consistently integrated in order to derive a molecular level model of organiccomposition via indirect methods
– Approach has been used to elucidate chemical structure of the organic matter in Green River and Rundle Ramsey Crossing Oil Shale

2
Original Organic Matter Models for Rundle and Green River Oil Shale from Indirect Characterization
Rundle Organic Matter Model Green River Organic Matter Model
Siskin,M.; Scouten, C. G.; Rose, K. D.; Axzel,T.; Colgrove, S. G.; Pabst, R. E., Jr.; in Geochemistry and Conversion of Oil Shales, ed. By C. Snape, NATO Series, 1995
Scouten, C. G.; Siskin,M.; Scouten, C. G.; Rose, K. D.; Axzel,T.;Colgrove, S. G.; Pabst, R. E., Jr.; Prepr. Am. Chem. Soc.,Div. Pet. Chem. 1989, 36 (1), 43

3
Inherent Uncertainties with Indirect Characterization
• Mildly decompose the organic solid and analyze products– Incomplete decomposition of the organic solid– Chemical transformation during decomposition
• Chemical derivatization and analysis– Non-selective, incomplete or destructive derivatization of organic matter– Accuracy of methodologies to quantify derivatized products
• Combination of Indirect characterization with new direct characterization methods can mitigate uncertainties

4
Direct Chemical State Probes for Carbonaceous Materials
• Significant advances made over the past decade for different direct chemical state probes of complex carbonaceous samples
– Provides average chemical composition
• X-ray Photoelectron Spectroscopy (XPS)– Heteroatom (N, S, O), higher energy/spatial resolution, non-conducting samples
• X-ray Absorption Near Edge Structure Spectroscopy (XANES)– Sulfur, Carbon and Nitrogen
• Solid-State NMR Spectroscopy– 13C NMR for Carbon structures & oxygen functionalities, 15N NMR for speciation
• Multiple technique strategy developed to quantify the average chemical structure of kerogen including Green River and Rundle oil shale (Type I Kerogen)

5
Feature Approach Feature Approach
H/C ElementalAnalysis
AverageAromaticRing Size
13C NMR
% Aromatic/Aliphatic Carbon
13C NMRXPS
Aromatic/Naphthenic RingSize Distribution
IndirectMethods
% MethylCarbon
13C NMR Average AliphaticCarbon Chain
Length
13C NMR
Fraction ofAromatic Carbonwith Attachments
13C NMR Alkyl Carbon ChainLength Distribution
(Isomerization)
IndirectMethods
Feature Approach Feature Approach
Pyridinic 15N NMRXPS, XANES
N/C Elemental AnalysisXPS
Amine 15N NMRXPS, XANES
NO, NO215N NMR
XPS, XANES
Amide 15N NMRXPS, XANES
Pyridinic(O-Environment)
15N NMRXPS, XANES
Pyrrolic 15N NMRXPS, XANES
Quaternary(Amonium Salt)(Pyridinum ion)(Ar-Bridgehead)
15N NMRXPS, XANES
Feature Approach Feature Approach
Aromatic C-O 13C NMR O/C Elemental AnalysisXPS
Aliphatic C-OO-CH3
13C NMR Σ C-O XPS
C=O 13C NMR C=O, O-C-O XPS
O=C-O, O=C-N 13C NMR O=C-O, O=C-N XPS
Feature Approach Feature Approach
R-S-S-R XANESXPS
S/C Elemental AnalysisXPS
R-S-R(H) XANESXPS
Thiophenic XANESXPS
Ar-S-Ar(H) XANESXPS
SO, SO2, SO3 XANESXPS
Multiple Technique Strategy for Defining the Organic Composition of Complex Carbonaceous Solids
Organic Forms of Oxygen
Organic Forms of Nitrogen
Carbon (H) Chemical/Skeletal Features
Organic Forms of Sulfur
10-100 micron Spectroscopy (Yes)

6
Van Krevelen Diagram for Kerogen and Rock-Eval Data
Rock-Eval Sample Kerogen
Type Tmax (°C) Hydrogen
Index (mg/g)
Green River I 446 739 Rundle I 444 995 Duvernay (A) II 414 532 Duvernay (B) II 438 439 Duvernay (C) II 443 242 Duvernay (D) II 479 22 Oxford Clay II 413 577 Paradox II 438 401 Malm II 420 670 Draupne II 424 581 Bakken II 419 580 Monterey IIS 411 621 Gippsland (A) IIIC 415 251 Gippsland (B) IIIC 436 226 Proprietary (A) IIIC 427 295 Proprietary (B) IIIC 453 235 Proprietary (C) IIIC 479 120 Fruitland IIIC 424 237
0
20
40
60
80
100
120
140
160
180
0 5 10 15 20Organic Oxygen (per 100 C) XPS
Hyd
roge
n (p
er 1
00 C
)
Type IType IIType IIIC
Type I
Type II
Type III
Green River Rundle
• Lacustrine source rocks from the Green River and Rundle formations contain hydrogen-rich algal kerogen (Type I) derived primarily from cyanobacteria or various Chlorophyta and dinoflagellates, respectively

7
Complimentary XPS and 13C NMR Data for Aromatic Carbon
• The amount of aromatic carbon, measured by both 13C NMR and XPS, increases with decreasing H/C
– Surface composition comparable to the bulk
– XPS percent aromatic carbon from calibrated carbon (1s) πto π* Signal (1)
• Green River and Rundle Kerogen (Type I) have less aromatic carbon than other organic matter types at comparable levels of maturity
(1) S. R. Kelemen et.al. Applied Surf. Sci., 1993, 64,167
25
50
75
100
125
150
175
200
0 20 40 60 80 100Aromatic Carbon (Percent)
Hyd
roge
n (p
er 1
00 C
arbo
n)
Type I (XPS)Type II (XPS)Type IIIC (XPS)Type I (NMR)Type II (NMR)Type IIIC (NMR)
Green River
Rundle

8
XPS Carbon (1s) Spectra of Kerogen and Curve Resolution into Different Components
Binding Energy (eV)
O=C-O
C=O
C-O
RundleType IKerogen
C
Binding Energy (eV)
Duvernay (B)Type IIKerogen
O=C-O
C=O
C-O
C
9
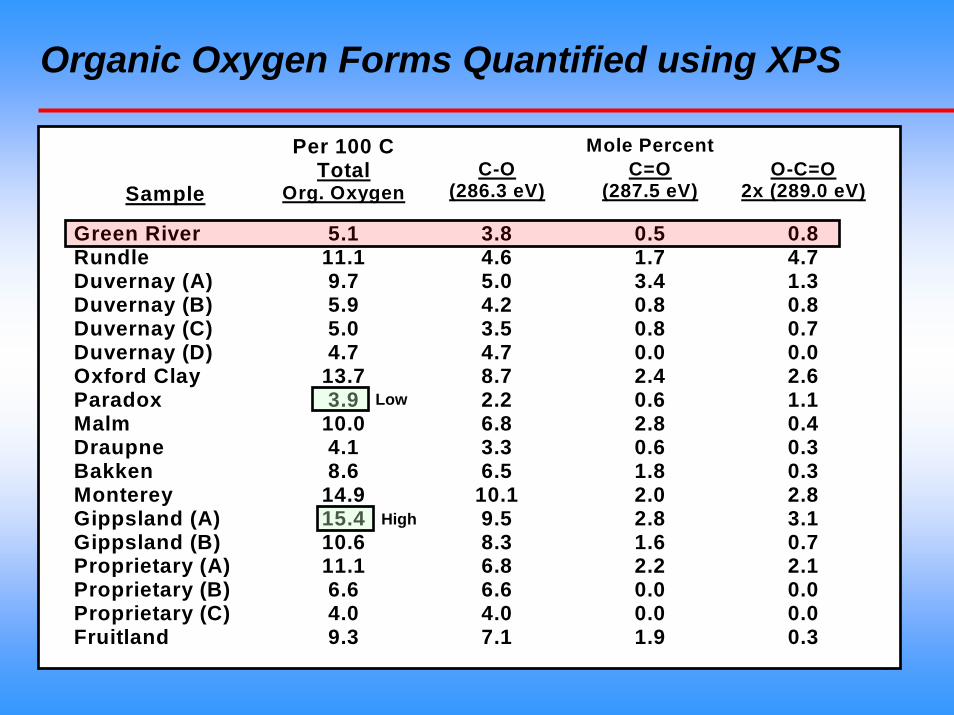
Organic Oxygen Forms Quantified using XPS
Per 100 C Mole Percent
Sample Total
Org. Oxygen C-O
(286.3 eV)
C=O (287.5 eV)
O-C=O 2x (289.0 eV)
Green River 5.1 3.8 0.5 0.8 Rundle 11.1 4.6 1.7 4.7 Duvernay (A) 9.7 5.0 3.4 1.3 Duvernay (B) 5.9 4.2 0.8 0.8 Duvernay (C) 5.0 3.5 0.8 0.7 Duvernay (D) 4.7 4.7 0.0 0.0 Oxford Clay 13.7 8.7 2.4 2.6 Paradox 3.9 2.2 0.6 1.1 Malm 10.0 6.8 2.8 0.4 Draupne 4.1 3.3 0.6 0.3 Bakken 8.6 6.5 1.8 0.3 Monterey 14.9 10.1 2.0 2.8 Gippsland (A) 15.4 9.5 2.8 3.1 Gippsland (B) 10.6 8.3 1.6 0.7 Proprietary (A) 11.1 6.8 2.2 2.1 Proprietary (B) 6.6 6.6 0.0 0.0 Proprietary (C) 4.0 4.0 0.0 0.0 Fruitland 9.3 7.1 1.9 0.3
High
Low

10
XPS Nitrogen (1s) Spectra of Kerogen and Curve Resolution into Different Components
Binding Energy (eV)
Binding Energy (eV)
MontereyType IIS
Prop. (C)Type IIIC
Binding Energy (eV)
Binding Energy (eV)
DraupneType II
Gippsland (B)Type IIIC
Quaternary
Pyrrolic
Amine
Pyridinic
Pyrrolic
Pyridinic
Quaternary
Pyrrolic
Amine
Pyridinic
Pyrrolic
Pyridinic
Quaternary

11
XPS Nitrogen (1s) Spectra of Type I Kerogen and Curve Resolution into Different Components
Binding Energy (eV) Binding Energy (eV)
Green RiverType IKerogen
RundleType IKerogen
Pyridinic
PyrrolicPyrrolic
Quaternary
Quaternary
AmineAmine
Pyridinic

12
Nitrogen Forms Quantified using XPS Total Mole Percent (XPS)
Sample Per 100 C Pyridinic 398.6 eV
Amine 399.4 eV
Pyrrolic 400.2 eV
Quaternary401.4 eV
Green River 2.2 20 9 57 13 Rundle 1.8 5 9 52 35 Duvernay (A) 2.9 27 4 52 18 Duvernay (B) 2.0 19 4 59 18 Duvernay (C) 2.1 18 0 65 17 Duvernay (D) 2.1 15 0 62 23 Oxford Clay 2.4 17 15 53 15 Paradox 3.1 23 5 59 13 Malm 2.3 15 9 54 22 Draupne 2.3 10 8 65 17 Bakken 3.5 20 7 52 21 Monterey 3.3 16 5 62 17 Gippsland (A) 0.8 18 0 62 20 Gippsland (B) 1.9 34 0 56 10 Proprietary (A) 1.7 31 0 57 11 Proprietary (B) 1.1 35 0 57 7 Proprietary (C) 1.1 36 0 64 0 Fruitland 1.7 30 0 57 13
High
Low

13
Plot of Relative Amounts of Nitrogen Forms for Kerogen
0
20
40
60
80
0 20 40 60 80Percent Aromatic Carbon (XPS)
Mol
e Pe
rcen
t
398.6 eV + 401.4 eV399.4 eV400.2 eV
Pyridinic (398.6 eV) + Quaternary (401.4 eV)
Pyrrolic(400.2 eV)
Amine(399.4 eV)
Green River
Rundle

14
XPS Sulfur (2p) Spectra of Kerogen and Curve Resolution into Different Components
Binding Energy (eV)
OxfordType II
SO4
Aromatic
Aliphatic
FeS2
Duvernay (C)Type IISO4
Aromatic
Aliphatic
FeS2
Binding Energy (eV)
2P3/2
2P1/2

15
Sulfur Forms Quantified using XPS
Sample Total Org. S
AliphaticSulfide
Aromatic (Thiophenic) Sulfoxide
Sulfate Pyrite
Green River 0.5 17 10 9 50 14 Rundle 0.6 15 9 4 66 6 Duvernay (A) 1.4 33 28 13 25 2 Duvernay (B) 1.2 16 20 5 46 13 Duvernay (C) 0.6 11 13 0 69 7 Duvernay (D) 1.0 5 20 5 66 4 Oxford Clay 3.2 37 23 10 17 13 Paradox 1.4 16 22 2 45 15 Malm 1.9 22 16 7 45 10 Draupne 2.1 19 20 8 52 1 Bakken 2.2 25 32 10 30 2 Monterey 2.7 39 21 4 16 20 Gippsland (A) 2.7 36 44 8 10 2 Gippsland (B) 0.5 31 58 0 11 0 Proprietary (A) 0.2 24 33 0 42 0 Proprietary (B) 0.2 22 58 0 20 0 Proprietary (C) 0.1 8 56 0 36 0 Fruitland 0.4 37 51 0 12 0
High
Low

16
S-XANES Absorbance and Third Derivative Absorbance Spectra of Kerogen
2465 2470 2475 2480 2485Energy (eV)
Thir
d D
eriv
ativ
e A
bsor
banc
e
SpectrumFit
2465 2470 2475 2480 2485Energy (eV)
Abs
orba
nce
SpectrumFitAliphaticAromaticSulfoxideSulfitePyrite
FeS2
Aliphatic
Aromatic
2465 2470 2475 2480 2485
Thir
d D
eriv
ativ
e A
bsor
ban Spectrum
Fit
2465 2470 2475 2480 2485Energy (eV)
Abs
orba
nce
SpectrumFitAliphaticAromaticSulfiteSulfoxideSulfatePyrite
FeS2 AliphaticAromatic
2465 2470 2475 2480 2485Energy (eV)
Thir
d D
eriv
ativ
e A
bsor
banc
e
SpectrumFit
2465 2470 2475 2480 2485Energy (eV)
Abs
orba
nce
SpectrumFitAliphaticAromaticSulfoxideSulfitePyrite
FeS2
Aliphatic
Aromatic
2465 2470 2475 2480 2485
Thir
d D
eriv
ativ
e A
bsor
ban Spectrum
Fit
2465 2470 2475 2480 2485Energy (eV)
Abs
orba
nce
SpectrumFitAliphaticAromaticSulfiteSulfoxideSulfatePyrite
FeS2 AliphaticAromatic
2465 2470 2475 2480 2485
Thir
d D
eriv
ativ
e A
bsor
ban Spectrum
Fit
2465 2470 2475 2480 2485Energy (eV)
Abs
orba
nce
SpectrumFitAliphaticAromaticSulfiteSulfoxideSulfatePyrite
FeS2 AliphaticAromatic
Duvernay (A)Type II
OxfordType II

17
Combined S-XANES and XPS Results for Sulfur Forms
0
20
40
60
80
100
0 20 40 60 80 100
Percent Aromatic Carbon
Mol
e %
Aro
mat
ic S
(Non
Ox.
Org
. Bas
is)
S-XANES 3rd Der. Abs.S-XANES Abs.XPS
0.0
0.2
0.4
0.6
0.8
1.0
0 20 40 60 80 100
Percent Aromatic Carbon
Alip
hatic
/(Aro
mat
ic +
Alip
hatic
)
. Type IType IIType IIICType II (Mat. Seq.)Type IIIC (Mat. Seq.)
GreenRiver
Rundle

18
Summary
• A direct characterization strategy is used to quantify the average chemical structure of kerogen (mitigates indirect approach uncertainties)
– Solid-state 13C NMR, XPS and S-XANES– Wide range of organic matter types and maturities– Basis for developing specific chemical structural models of kerogen
linked to reactivity models
• Total amounts of organic nitrogen and sulfur vary among kerogen, however, patterns emerge for the relative abundances of nitrogen and sulfur forms
– The relative amount of aliphatic sulfur decreases with increasing aromatic carbon+ High aliphatic sulfur levels for Green River and Rundle kerogen
– The majority of nitrogen exists as pyrrolic nitrogen in all kerogens+ Pyridinic, amine and quaternary found in Green River and Rundle kerogen
• Green River and Rundle Kerogen (Type I) have more hydrogen than other kerogen organic matter types (at equivalent levels of maturity)
– Both 13C NMR and XPS show aromatic carbon increases with decreasing H/C– Carbon structural features from solid-state 13C NMR appear in a companion poster