outcrop-based gamma-ray characterization …digital.library.okstate.edu/etd/umi-okstate-1616.pdf ·...
TRANSCRIPT

OUTCROP-BASED GAMMA-RAY
CHARACTERIZATION OF THE WOODFORD SHALE
OF SOUTH-CENTRAL OKLAHOMA
By
ALISCHA M. KRYSTYNIAK
Bachelor Science in Geology
Lake Superior State University
Sault Sainte Marie, Michigan
2003
Submitted to the Faculty of the Graduate College of the
Oklahoma State University in partial fulfillment of
the requirements for the Degree of
MASTER OF SCIENCE December, 2005

ii
OUTCROP-BASED GAMMA-RAY
CHARACTERIZATION OF THE WOODFORD SHALE
OF SOUTH-CENTRAL OKLAHOMA
Thesis Approved:
Stanley T. Paxton
Darwin Boardman
Jim Puckette
William Coffey
Dr. Gordon Emslie
Dean of the Graduate College

iii
Acknowledgements
I would like to express deep gratitude to my thesis advisor, Dr. Stan Paxton.
Without his dedication to this project, his motivational talks and the countless hours spent
with me in the scorching heat of Oklahoma, bush-whacking through poison ivy and
dodging chiggers, this project may not have been completed. I would also like to thank
the rest of my committee; Dr. Bill Coffey, Dr. Darwin Boardman, and Dr. Jim Puckette
for their ideas, support and encouragement throughout my graduate career.
I want to thank Devon Energy Corporation for allowing me access to all of their
resources for this project. I would like to extend special thanks to David Deering for
helping with figures and adjustments to my thesis. I would also like to thank Brad Biddy,
Pam Peters, Jenny Munday and Rick Coleman for their assistance. I would like to thank
Dr. Elizabeth Catlos for allowing me to use her digital camera to photograph thin-
sections. I would like to give the Oklahoma Geological Society my gratitude for the Kate
Scholarship that helped with the funding of this project. Special thanks are also given to
Julie Turrentine, Willie Parker, and Ali Jaffri for assisting me with fieldwork.
I would like to thank my family for their endless support of my academic pursuits.
Steven Bates, Rebecca Klein and Melissa Stefos are acknowledged for boosting my
morale, especially for the times when I wanted to give up and move to Alaska. Most
importantly, I would like to thank my best friend, Gregory Gromadzki, for the technical
assistance that he provided me as well as the constant moral and emotional support. I
couldn’t have done this thesis without you.

iv
TABLE OF CONTENTS
Chapter Page I. Introduction ................................................................................................................1
Study Area ...............................................................................................................2 Objective and Approach ..........................................................................................2 Stratigraphy..............................................................................................................5 Structural History.....................................................................................................9 Deposition ..............................................................................................................10 II. Literature Review………………………………………………………………....11 III. Methodology Gamma Ray ...........................................................................................................17 Outcrop Selection...................................................................................................19 Thin-Section Analysis............................................................................................22 X-Ray Diffraction ..................................................................................................23 Total Organic Carbon ............................................................................................23 Statistical Analysis.................................................................................................24 IV. Gamma-Ray Characterization ...............................................................................26 Log Characteristics ................................................................................................26 Gamma-Ray Characterization................................................................................26 Discussion..............................................................................................................43 Correlation .............................................................................................................53 V. Petrology Results ...................................................................................................31 Lithofacies in Outcrop ...........................................................................................57 Thin-Section Analysis............................................................................................60 XRD Data...............................................................................................................77 TOC Data ...............................................................................................................80

v
VI. Summary and Conclusions ....................................................................................86 Future Work ...........................................................................................................90 REFERENCES ............................................................................................................91 APPENDIX A: Outcrop-Based Gamma-Ray Data......................................................96 McAlester Cemetery Shale Pit...............................................................................97 I-35 Outcrop...........................................................................................................99 Hunton Quarry .....................................................................................................101 Brimley Residence ...............................................................................................103 Henryhouse Creek................................................................................................104 APPENDIX B: Frequency Distributions of Compiled Outcrop Gamma-Ray Data .111 Uranium ...............................................................................................................112 Thorium................................................................................................................113 Potassium .............................................................................................................114 API Units .............................................................................................................115 APPENDIX C: Thin-Section Photographs ..............................................................116 I-35 Thin-Sections within Undesignated Areas of the Outcrop...........................117 I-35 Thin-Sections within Documented Areas of the Outcrop ............................119 Thin-Sections from Henryhouse Creek ...............................................................123 Thin-Sections from McAlester Cemetery Shale Pit.............................................131 APPENDIX D: X-Ray Diffraction Data ..................................................................136 APPENDIX E: TOC Data ........................................................................................138 APPENDIX F: Vitrinite Reflectance Data .............................................................140

vi
LIST OF FIGURES
Figure Page 1. Map of the five Woodford Shale outcrop locations...................................................3 2. Woodford Shale exposure in the Arbuckle Mountains..............................................6 3. Stratigraphic relationship of the Woodford Shale .....................................................8 4. Portable gamma-ray spectrometer .............................................................................4 5. Woodford Shale locations in South-Central Oklahoma...........................................20 6. Thin section photographs of the three types of kerogen ..........................................27 7. Well log from Logan County, Oklahoma ................................................................27 8. Photographs of the McAlester Cemetery shale pit………………………………...29 9. Gamma-ray profile of McAlester Cemetery shale pit..............................................30 10. Frequency distributions of uranium measurements ...............................................31 11. Frequency distributions of thorium measurements ...............................................32 12. Frequency distributions of potassium measurements ............................................33 13. I-35 Woodford Shale outcrop ................................................................................35 14. I-35 gamma-ray profile ..........................................................................................37 15. Hunton quarry gamma-ray profile .........................................................................39 16. Brimley residence gamma-ray profile ...................................................................40 17. Henryhouse Creek gamma-ray profile...................................................................42 18. Frequency distribution of API units from the Woodford Shale.............................44 19. Frequency distribution of uranium from the five outcrops....................................45 20. Marine Woodford in comparison with Gromadzki’s continental red-beds ...........48 21. Outcrop derived gamma-ray profile of Henryhouse Creek ...................................49

vii
22. Outcrop derived gamma-ray profile of the I-35 outcrop .......................................50 23. Stratigraphic section representing the four stages of phosphate distribution in the Chattanooga Shale ...............................................................52 24. Henryhouse section showing the division of the shale members ..........................54 25. Siliceous and fissile Woodford Shale from the I-35 outcrop.................................58 26. Woodford Shale from the I-35 outcrop..................................................................58 27. Woodford Shale from the Brimley residence outcrop ...........................................59 28. Woodford Shale at the Henryhouse Creek outcrop ...............................................61 29. Dolomite bed and organic-rich shale with a coaly-like appearance ......................62 30. Thin-section photograph of the lower Woodford Shale ........................................63 31. Siliceous shale from the Henryhouse Creek outcrop.............................................65 32. Fissile shale from the Henryhouse Creek outcrop .................................................66 33. Thin-section photographs of fissile Woodford Shale ............................................67 34. Thin-section photographs of phosphatic Woodford Shale.....................................68 35. Thin-sections of siliceous shale samples collected from the I-35 outcrop ............70 36. Dolomite bed from McAlester Cemetery shale pit ................................................71 37. Shale from Henryhouse Creek containing small dolomite beds............................72 38. Fissile samples from the Henryhouse Creek outcrop ............................................73 39. Thin-sections from the upper Woodford Shale......................................................74 40. Thin-sections of siliceous shale ............................................................................76 41. Shale compaction around phosphate nodules ........................................................78 42. Phosphate nodules..................................................................................................79 43. Frequency distribution of the TOC content in outcrop samples ............................81 44. Shale samples representing the three categorized TOC values .............................82

viii
45. Thermal maturity distribution of the Woodford Shale ..........................................85

ix
LIST OF PLATES
Plate Page 1. Lithology of the I-35 Outcrop................................................................................146 2. Outcrop location map.............................................................................................147 3. Correlation of the outcrop-based gamma-ray profiles ...........................................148 4. Correlation of outcrop-based gamma-ray profile to the subsurface ......................149

1
Chapter I
Introduction
Problem Statement
The rise in oil prices as well as the depletion of natural resources has led many
companies to consider unconventional gas-shale plays. One such possibility that may
prove to be economically viable is the Woodford Shale. The Woodford is considered to
be the most prolific source rock for oil and gas in Oklahoma (Johnson et al., 1990). The
Woodford is present throughout most parts of the Oklahoma Basin and ranges from 200-
900 ft thick in the southern Oklahoma aulacogen to 50-100 ft thick in most of the shelf
areas (Amsden, 1975; Johnson and others, 1988). The Woodford is considered to be a
“hot shale” on well logs with API readings of 150 and higher. This organic rich black
shale contains Types II and III kerogen. Type II is oil prone and is composed of mixed
terrestrial and marine source material. Type III organic matter is gas prone and contains a
woody terrestrial source material (Raymond, 2002).
A detailed study of the Woodford would result in a better conceptual
understanding of hydrocarbon source rocks and their role as possible unconventional gas-
shale plays. For instance, to evaluate this possibility, the relationship between the
lithofacies both in outcrop and subsurface can be established relative to gamma-ray
profile on the well log. Analyzing the results of the gamma-ray readings relative to
lithofacies character (bedding style, internal thickness, and lithology) along with Total
Organic Carbon (TOC) and mineralogy from x-ray diffraction (XRD) could potentially
reveal much needed information regarding the economic viability of the Woodford Shale.

2
Study Area
The Woodford Shale is found extensively in the subsurface throughout the state of
Oklahoma. Outcrop exposures are found in both the south-central portion of the state as
well as some exposures in the northeast. This study focused on five Woodford outcrops
that are located in south-central Oklahoma (Fig. 1). Outcrops that were analyzed are
located in Murray, Carter, and Pontotoc counties (Plate. 1). This area offered the best
outcrops for the purpose of this study in terms of size, location, and accessibility.
Objective & Approach
The rising cost of energy resources has caused many petroleum companies to
explore unconventional gas-shale plays. In the basins for which estimates have been
made, shale-gas resources are substantial, with in-place volumes of 497-783 tcf (Curtis,
2002). The Woodford Shale of south-central Oklahoma is a possible gas-shale resource.
The objective of this study is to establish and document the geochemical and geological
characters of this organic-rich black shale relative to lithology and in correspondence
with spectral gamma-ray response (potassium, uranium, and thorium). This approach has
the potential to improve our ability to predict properties of black shales and to project the
characteristics of these black shales into the subsurface by way of outcrop-based gamma-
ray logs.

3
Figure 1. Map of the five Woodford Shale outcrop locations.

4
Approach:
1. Perform fieldwork to collect gamma-ray data and construct vertical gamma-ray
profiles from five outcrops in Carter, Murray and Pontotoc counties. The gamma-ray
measurements (K, U, and Th) are used to classify the lithofacies, identify depositional
environments (Gromadzki, 2004), and possibly assist in locating gas-bearing zones
2. Collect samples from outcrops for thin sections, TOC and XRD.
(A). Perform thin-section analysis of samples to document details of texture and
composition of different lithofacies found within the outcrop sections. Thin section
analysis helps to determine the types of minerals making up the shale, some of which are
detrital and others diagenetic.
(B). Evaluate the TOC and XRD data. TOC provides the amount of organic material
found within a sample. XRD analysis of the samples is used to determine the mineralogy
and relative proportions of minerals, including clays and clay types.
3. Construct a detailed lithofacies description of outcrops. Compare and contrast the
lithofacies description in relation to the gamma-ray data, and attempt to quantitatively
establish the correspondence between gamma-ray and lithofacies.
4. Determine the strength of statistical association between gamma-ray response and
lithofacies using SAS (Statistical Analysis System). Assuming these associations yield
significant relationships, recommend methods by which the gamma-ray profile in the
outcrop can be used to define lithofacies in the subsurface.
5. Test the assumption that outcrop based gamma-ray profiles can be correlated into the
subsurface by comparison with well log data.

5
Stratigraphy
The Woodford Shale is exposed in a series of folds and faults of the Arbuckle
Mountains, the result of late Pennsylvanian deformation (Fig. 2), (Over, 1990). This
organic-rich black shale is late Devonian (Frasnian, Fammenian) and basal Mississippian
(Tournasian) in age and consists of gray-black siliceous and fissile shale and phosphatic
shale. The Woodford also contains rare chert, some bedded limestone, bedded dolomite,
and phosphate nodules. The term Woodford is derived from the town of Woodford in
Carter County. This name was first used by Taff (1903, 1904) in studies of strata exposed
in Indian Territory and Oklahoma at the turn of the century (Over, 1990).
The Woodford Shale was deposited when the southern margin of North America
was located in the tropics (Woodrow et al., 1973). The Late Devonian was characterized
by widespread deposition of black shales in the eastern and central United States (U.S.
Department of Energy, Morgantown Energy Technology Center, 1981). The Woodford
Shale records a transition from primarily carbonate deposition in the early Paleozoic to
predominately clastic deposition in the late Paleozoic (Ham and Wilson, 1967, p. 393-
396). Time-stratigraphic equivalents of the Woodford Shale include the New Albany,
Chattanooga, Ohio, Millboro, Burket, Geneseo, and Antrim Shales and the Arkansas
Novaculite (Conant and Swanson, 1961). The Woodford Shale and its equivalents form
the base of the Kaskaskia sequence in the Midcontinent (Sloss, 1963). A period of
regional exposure and erosion prior to the deposition of these rocks resulted in the
incision of major stream channels in pre-Kaskaskian strata, and was followed by a marine
transgression that

6
Figure 2. Woodford Shale exposure in the Arbuckle Mountains (modified after Over, 1990).

7
advanced onto the craton from the south (Bunker et al., 1988). A minor regression at the
end of the Woodford deposition marks the upper boundary of the Kaskaskia (Sloss 1988).
The base of the Woodford is composed of the Misener sandstone in north-central
and eastern Oklahoma. This sandstone is known as the Sylamore in northwestern
Arkansas. When the Misener is present, it is often only 3.3 ft (1m) or less in thickness
(Lee, 1956; Hilpman, 1967, Amsden and Klapper, 1972; Newell, 1989). It apparently
developed where Ordovician –age Simpson Group sandstones subcropped beneath the
pre-Kaskaskian erosional surface, becoming a source of sand-sized clastic detritus in the
early stages of the Kaskaskian transgression (Lambert, 1993). There is no well-developed
basal sandstone in the Woodford shale exposures in the Arbuckle Mountain region,
although locally a few inches of conglomerate is present (Amsden and Klapper 1972).
The Woodford unconformably overlies either Silurian to Early Devonian Hunton Group
carbonates or older sediments (Sullivan, 1985).
The Hunton Group (Fig. 3) are mainly shallow-marine carbonates that are clean-
washed skeletal limestones in the lower part (Chimneyhill Subgroup), argillaceous and
silty carbonates in the middle (Henryhouse and Haragan-Bois d’Arc formations) and
clean-washed limestones at the top (Frisco Formation), (Jolly, 1988). Above the
Woodford lies the upper Mississippian Sycamore Formation. The Sycamore is a fine-
grained, silty limestone with interbedded thin dark shales (Jolly, 1988).

8
Figure 3. Stratigraphic relationship of the Woodford Shale with overlying Sycamore and underlying Hunton Group

9
Structural History
According to Cardott and Lambert (1982), the Anadarko basin of the southern
Oklahoma aulacogen is a northwest-trending, axially asymmetric, sedimentary structural
basin of Paleozoic age in western Oklahoma and the Texas panhandle. The aulacogen is
bordered on the south by the Amarillo-Wichita uplift and the Marietta basin (Cardott and
Lambert, 1982). The aulacogen is bordered on the southeast by the Ardmore basin and
the Arbuckle uplift and on the east by the Nemaha ridge, and on the north and west by the
northern shelf areas (Cardott and Lambert 1982). Crustal extension occurred in the
southern Oklahoma aulacogen during the Cambrian (Burke and Dewey, 1973). This
event produced normal faults and emplaced igneous rocks in the deepest part of the
present Anadarko basin and Amarillo-Wichita uplift (Cardott and Lambert, 1982).
Subsidence of the aulacogen occurred in many phases from the Late Cambrian through
early Mississippian (Hoffman et al., 1974). During the early Pennsylvanian intense
crustal shortening occurred in this region (Cardott and Lambert, 1982). This shortening is
potentially associated with late Paleozoic continental collision involving the Ouachita
orogenic belt (Cardott and Lambert, 1982). This event raised vertical blocks in the
Amarillo-Wichita uplift along reactivated zones of weakness produced during the initial
graben stage (Ham et al., 1964). Intense folds and faults were produced in the frontal
Wichita fault zone and the adjacent deep Anadarko basin with less intense activity toward
the north (Amsden, 1975). The Desmoinesian through the Permian represented a time
when the rate of subsidence slowed, owing to “thermal contraction as the lithosphere
returned to thermal equilibrium” (Garner and Turcotte, 1984, p. 5).
10
According to Over (1990), the Woodford is exposed in a series of folds and fault
blocks of the Arbuckle Mountains in an eight county area of south-central Oklahoma.
The current outcrop exposures in this region are found in Criner Hills, an outlier of
Paleozoic strata at the southern limit of the Arbuckles, the southern, northern, and eastern
Arbuckles that comprise the main Arbuckle Mountain region, and the Lawrence uplift, a
fault-bound block of gently dipping predominantly Lower Paleozoic strata exposed in the
northernmost extension of the Arbuckles (Over, 1990).
Deposition
The Woodford Shale represents a transition from thick, Early Paleozoic
carbonates to Paleozoic clastics (Cardott and Lambert, 1985). The shales of the
Woodford Formation were deposited from the northeast and east, during late Devonian to
early Mississippian shelf sedimentation (Denison, 1982; Cardott and Lambert, 1985). The
Deposition occurred slowly, with low oxygen content at the sediment-water interface
(Sullivan, 1985). According to Over (1990), a stratified water column and anoxic bottom
waters developed after initial Woodford sedimentation as the water deepened. The depth
of the water during the Woodford deposition is estimated to have been between 50 to 400
meters (Over, 1990). This depth is based upon modern studies of depth to the oxygen
minimum zone, and phosphatic sedimentation in upwelling areas.
11
Chapter 2
Literature Review
The Woodford Shale of south-central Oklahoma is an extensively studied
hydrocarbon source rock. This organic-rich black shale is of great interest to both
petroleum companies and researchers. There has been much work regarding the
Woodford Shale in terms of deposition, gamma-ray emitting elements, radioactivity,
geochemistry and the phosphate nodules found within some intervals. There has also
been much literature written about the Woodford’s overlying and underlying units, the
Sycamore Limestone and the Hunton Group respectively.
In a study by Over (1990), the Woodford Shale of south-central Oklahoma is
described as being the result of deposition in an offshore quiet, oxygen-poor setting. This
deposition occurred on the southern margin of North America. Conodonts were used to
determine the Frasnian-Famennian and Devonian-Carboniferous boundaries. Over
(1990), indicated that the Frasnian-Famennian (F/F) boundary occurs in the lower 20
meters of Woodford. In south-central Oklahoma, it is mentioned that the F/F boundary
lies within the fine-grained, quiet water siliclastic sediments of the Woodford. According
to Over (1990), the very basal Woodford unconformity is locally composed of quartzose
sand, phosphate, limestone pebble conglomerate, and green-brown shale. Organic-rich
black shales and cherts lie directly above the basal beds of the Woodford Shale.
Jolly (1988), investigated the correlation of individual gamma-ray emitting
elements (K-wt%, U-ppm, Th-ppm) of the Woodford Shale. Eighty-four samples of
Woodford were collected at one meter intervals. These samples were analyzed using
laboratory methods to determine gamma-ray emittence. Results yielded ranges for K

12
(0.2-2.1%), uranium (up to 60 ppm) and Th (up to 9 ppm). According to Jolly (1988),
potassium is transported in solution and in detritus when it occurs as a constituent of
some major minerals such as orthoclase, muscovite and biotite. Thorium is transported in
suspension with resistates such as minerals and clays. Uranium is transported in
suspension and solution and is highly insoluble under reducing conditions, but soluble
under oxidizing conditions in open ocean water.
Lambert (1993), describes the Woodford Shale as an organic rich shale that is an
important source of hydrocarbons in many of the intracratonic basins of the Mid-
continent. The Woodford was deposited under generally anoxic conditions during the
Kaskaskian marine transgression and can be divided into several members. The middle
shale member is the most radioactive and has the greatest extent and thickness in south-
central Oklahoma. TOC content of the three radioactive shale members decreases
towards the north, with the middle shale member being the most organic-rich. The three
radioactive members of the Woodford shale represent a third-order depositional sequence
that is bounded both below and above by unconformities.
Cardott and Lambert (1982), describe the thermal maturity of the Woodford
Shale. Their work focused on the Anadarko Basin in western Oklahoma. This study
analyzed whole-rock cuttings and core material that was selected from 10-ft intervals of
the Woodford in 28 wells. The results of this analysis yielded computer-generated plots
with vitrinite reflectance versus depth. This analysis produced a regression equation that
can be used to predict the vitrinite reflectance of the Woodford Shale at any depth in the
Anadarko Basin. This equation can also be used to determine the amount of erosion.

13
Olson (1982), conducted a study that involved characterizing the Woodford Shale
of south-central Oklahoma in terms of uranium distribution. Samples of Woodford were
collected, and analyzed for uranium. Uranium content in the Woodford Shale was found
to be as high as 121 ppm. Olson (1982), found that uranium is primarily associated with
the kerogen fraction of the organic material and uranium increases with increasing
organic carbon content. Kerogen type was found to be quite uniform across the study
area. Thermal maturity of the Woodford Shale was found to increase from immature in
the central portion of Oklahoma to advanced in the Anadarko Basin. Positive (statistical)
correlations were found between quartz and uranium. Negative correlations were found
between illite and uranium. The negative correlation between uranium content and illite
is thought to reflect the rapid burial of the organic matter, limiting the length of time
available for uranium-organic interaction.
Swanson (1962), reports on a series of studies that involved the geology and
geochemistry in marine black shales. Over two hundred shale formations e were checked
for their radioactivity during the study period of 1944-1957. Outcrops, well core, drill
cuttings and gamma-ray logs were analyzed relative to geology and geochemistry data.
Swanson’s (1962) studies reveal that uranium in marine black shales is thoroughly
disseminated throughout the rock. The uranium in the marine black shales is from sea
water. Sources for uranium in sea water are igneous, metamorphic and sedimentary rocks
that have released uranium to surface and ground waters during weathering processes.
Swanson (1962), also determined that there are four stages of phosphate nodule
development. The Woodford Shale of south-central Oklahoma represents a stage 2, in
which the uranium availability in the waters was low or had already been depleted by
14
direct hydrogen sulfide precipitation, leaving little or no uranium to be incorporated into
the phosphate.
Siy (1988) examined the geochemical and petrographic study of phosphate
nodules of the Woodford Shale of southern Oklahoma. The relationship of the phosphate
nodules to the surrounding shales indicates that the nodules are early diagenetic, in situ
features which formed in the upper few centimeters of organic-rich marine sediments.
Conditions favoring the inorganic precipitation of marine apatite in the form of carbonate
fluoro-apatite were enhanced by 1) anaerobic conditions in the lower portion of the water
column, 2) the presence of a highly productive offshore algae community, and 3) the high
stand of sea level brought on by a major transgressive event in the Late Devonian-Early
Mississippian. Siy (1988), determined that enrichment of lathanum (La) over cesium
(Ce) in the nodules and depletion of cesium in shales indicates that the depositional
environment was influenced by deep oceanic bottom water.
Dennis (2004), in a study for Logan County, Oklahoma suggests that the Misener
interval exhibited characteristics that would make it a potential reservoir. More than 150
wells in Oklahoma have produced petroleum from the Woodford. Dennis describes the
Woodford in some localities as being porous and permeable. Subsurface matrix porosity
in the Misener may be so extensive that the Woodford may be considered a widespread
commercial reservoir.
Champlin (1959), conducted an investigation of the stratigraphic relationship, and
depositional environments of the Sycamore and related formations. This study was an
attempt to apply detailed lithologic descriptions to time rock correlations. The study
determined the Sycamore to be gray to buff, dense, silty, massive bedded limestones of

15
the Meramecian series. Sedimentary analysis and thin section examination show that
these limestones were probably deposited as fine-grained sand or silt sized carbonate
material. Calcite occurs as a pore-filling cement (sparry calcite).Champlin (1959)
determined that a facies change that occurs between the upper part of the Sycamore and
the lower part of the Caney was controlled by a chain of low relief islands, with a north-
west-southeast alignment.
Cole (1988), conducted a subsurface study of the Sycamore Limestone along the
north flank of the Arbuckle Anticline. This study focused on the lithostratigraphy and
depositional history of the Sycamore Formation. Cole found six facies in the Sycamore
Formation that are divided based on lithological variations. These lithofacies are 1)
glauconitic shale, 2) bioturbated shale, 3) organic shale, 4) fossiliferous mudstones and
wackstones, 5) silty pelletal packstones, and 6) pellet rich siltstones. These lithofacies
represent four depositional environments. The present day distribution of the above
mentioned lithofacies is the result of tectonic activity of the Washita Valley Fault System.
Coffey (2000), conducted a study to examine the depositional system of the
Sycamore Formation in the area of the Carter-Knox field. Coffey (2000) indicates that the
depositional system for the Sycamore consists of a reciprocal sedimentation model where
silty pelletal packstone facies were deposited in two main phases. The first stage involved
a transgressive rise in sea level that allowed the moderate water depth carbonate portion
of the Sycamore Formation to develop. The second stage involved a lowstand drop in sea
level to allow the accumulation of fine-grained clastic material to be released into the
system as derived/turbidity current deposits.

16
Rottmann (2000), states that the underlying Hunton Group is the principal
hydrocarbon-producing carbonate reservoir in western Oklahoma. After deposition of the
Hunton Group, subsequent regional uplift and erosion modified the Hunton, this created
erosional features that were preserved by the Woodford Shale. According to Rottmann
(2000), the shale was probably deposited by the gradual inundation by the Devonian sea.
The inundation was initially confined to the post-Hunton erosional channels, filling and
preserving them. A rise in sea level caused the Devonian seas to eventually spread out
over the non-channnelized Hunton surface, depositing a regional Woodford Shale facies.

17
Chapter 3
Methodology
Gamma-ray
Outcrop gamma-ray profiles were constructed using a portable gamma-ray
spectrometer from Exploranium (GR-320 enviSpec). The GR-320 (Fig. 4) is calibrated
on test pads traceable to GSC (gamma-ray spectral calibration) standards to assure the
accuracy of each instrument. The internal calibration constants are used to measure
concentrations of potassium (K, wt %), uranium (U, ppm) and thorium (Th, ppm). The
GR-320 constructs automatic natural isotope spectrum stripping, and then carries out a
full peak analysis to identify any isotopes located in the stripped spectrum. The individual
isotope exposure rate is then computed by using internal calibration data details available
at (www.saic.com). The Gr-320 is calibrated to provide results of the area sampled within
60 seconds. This “at-surface” characteristic allows one to reliably relate the measured
radioactivity contrasts to mapped bedrock, surficial geology and alterations associated
with mineral deposits (Gromadzki, 2004). The detector is 4.5 inches in diameter and 15.5
inches long. The benefits of using this instrument versus laboratory measurements of
radioactivity are real time readings, the minimization of costs associated with rock
collection, shipping, lab preparation and chemical analysis for elements of samples
collected.

18
Figure 4. Photograph of the portable gamma ray spectrometer that was used to collect gamma-ray measurements from the Woodford Shale (Exploranium GR-320 Manual).
19
The natural radioactivity of sedimentary rocks is variable and dependent upon
lithology. Fluvial deposited sediments tend to have higher amounts of thorium (Th) and
marine deposited sediments tend to contain higher amounts of uranium (U). The Spectral
gamma ray also provides measurements of potassium (K). The occurrence of potassium
can be associated with clays such as illite and smectite. Using the data provided by the
gamma ray, geologists can define lithofacies and infer depositional environments.
Outcrop Selection
Five outcrop locations were selected to conduct the study on the Woodford Shale
(Fig. 5). The five outcrop locations; (1) McAlester Cemetery shale pit, (2) I-35, (3)
Hunton quarry, (4) Brimley residence and (5) Henryhouse Creek. The outcrops are
located in Carter, Murray and Pontotoc counties. The above-mentioned outcrops offered
the best exposures in terms of lithofacies, stratigraphic contacts, and accessibility.
McAlester Cemetery pit is located in the southern Criner Hills area (SW1/4, Sec.
36 T.5S., R.lE. Overbrook Quadrangle. The entire Woodford Shale is reported by Over
(1990), to be exposed in the southwest sloping quarry floor and face. 87 feet (26 M) and
68 gamma-ray readings of the quarry bottom were measured perpendicular to bedding in
order to construct a vertical gamma-ray profile. Attempts were made to take readings on
flat surfaces of the quarry floor that were not covered by too much weathered shale.
The I-35 Woodford is exposed on the west side of the southbound lane of
I-35 (NW1/4, SE1/4, Sec. 25 T.2S., R.2E, Springer Quadrangle). A 68 ft (20 m)

20
Figure 5. The location of the five Woodford Shale outcrops.

21
vertical profile was constructed from the base of the outcrop to the upper portion of the
outcrop. Wire markers were strung perpendicular to bedding in order to measure from
one bed to another. A total of 62 gamma-ray measurements were collected, and a detailed
lithofacies description was constructed.
The Hunton Quarry outcrop is located in an abandoned shale quarry on the south
side of Goddard Youth Camp road off of Route 10 near Sulphur, Oklahoma (NW1/4,
Sec. 31, T1S., R.3E. Dougherty Quadrangle). A 55 ft (17 m) vertical profile was
constructed from the base of the outcrop towards the top of the Woodford. A total of 63
gamma-ray measurements were collected perpendicular to bedding and a detailed
lithofacies description was constructed.
Brimley residence outcrop exposure is located along the banks of the Jack Fork
Creek near Ada, Oklahoma (NW1/4, NW1/4, Sec. 34 T.3N., R.6E. Ahloso Quadrangle).
A 15 ft (4 m) vertical profile was constructed from the base of the outcrop and a total of
17 gamma-ray readings were collected perpendicular to bedding as well as a detailed
lithofacies description.
The Henryhouse Creek outcrop is located along the banks of Henryhouse Creek
(SW 1/4, SW 1/4, SE 1/4, SE 1/4, NE 1/4, Sec. 18 T.4S., R.2E). The Woodford Shale at
this location is dipping 27o almost due south in the direction of stream flow (Over, 1990).
A 233 ft (71 m) vertical profile was constructed and a total of 291 gamma-ray readings
were collected. Hand samples were taken of the Woodford Shale at the Henryhouse
location for thin section analyses.
In an attempt to obtain an accurate reading from the gamma ray, fresh rock
surfaces that provided a flat, smooth planar surface, perpendicular to bedding were

22
chosen when possible. This allowed the area of contact between the detector and
collection site within the outcrop to be maximized. The gamma-ray detector was held
steady against the outcrop for 60 seconds until the measurement was accumulated. The
sampled diameter of the rock is 6.56 ft (2m) with the main contribution to the gamma-ray
reading being the 1.64 ft (0.5 m) diameter around the detector (Gromadzki 2004).
In order to correlate the outcrops into the subsurface, K %, U-ppm, and Th-ppm
were converted into API gamma ray units. This was accomplished with the equation
available in Heron and Heron (1996). This equation provides the necessary data to
convert the portable gamma-ray readings to API units:
API = 8 (+/- ) 2 x (U-ppm) + 4 (+/-1) x (Th-ppm) + 16 (+-) 2 x (K wt %).
The data provided by the above equation allows for the radioactive measurements
collected from outcrop to be converted into a gamma-ray profile. This gamma-ray profile
can then be used to correlate into the subsurface to well logs taken from Murray County
and towards the east of the studied locations.
Thin-Section Analysis
Thin sections were prepared by Mineralogy Inc., in Tulsa, Oklahoma. Thin
sections were collected from two locations. Thin sections were prepared using a blue dye
and were cut perpendicular to bedding. These thin sections were also pressure
impregnated. Seventy-three thin sections of the Woodford Shale were visually inspected
for composition, texture and grain size. Ten oversize (2’x3”) thin sections were prepared
for microscope analysis. Thirteen samples were prepared with special techniques because
of clay sensitivity and extreme fissility. The goal of the thin sections analysis was to

23
obtain a more detailed view of the organic-rich matrix of the shale, the mineralogical
composition of the lithofacies and the relationship between the minerals and the organics.
Analysis of thin sections has the potential to determine whether the minerals are detrital
or diagenetic in origin.
X – Ray Diffraction (XRD)
Thirty-eight samples from the I-35 outcrop were analyzed for XRD by
Mineralogy Inc. Samples were crushed and a portion of the sample was ground in
acetone in an agate mortar and then placed on a glass slide and scanned. Diagnostic peaks
of minerals identified on the resulting diffractogram were rescanned on duplicate
samples. The approximate weight percentages of mineral phases were determined by
comparing diagnostic peak intensities with those generated by pure standard phases
mixed in various known proportions. The goal of XRD is to determine the mineralogy
and clays in the sample in terms of weight percent. This information can be used to help
determine the composition of the shale relative to lithofacies as well as diagenetic history.
Total Organic Carbon (TOC)
Thirty-eight samples from the I-35 outcrop were analyzed for TOC by Humble
Geochemical in Houston, Texas. TOC is the total organic carbon present in dry rock and
is generally represented in weight percent. According to Schlumberger, TOC results
represent anywhere from 70 to 90 percent of the kerogen (depending on type). Kerogen is
a naturally occurring, insoluble organic matter that occurs in source rocks. Algae and
woody plant material are typical organic constituents of kerogen. Kerogens are classified

24
based on three main types (Fig. 6). According to Schlumberger (2005), Type 1 kerogen
consists of algal and amorphous material that is presumably also algal in origin. Type 1
kerogen is highly likely to generate oil. Type 2 kerogen is composed of mixed terrestrial
and marine source material. Type 2 generates a waxy type of oil. Type 3 kerogen is
contains a woody terrestrial source material and typically generates gas. TOC is
measured by Rock Eval Pyrolysis or LECO. Humble geochemical analyzed the samples
for TOC using LECO. This procedure involves the sample to be ground and weighed, the
sample is then acidified with HCl (this removes all carbonates). Samples are then rinsed,
dried and then analyzed in a combustion furnace. The furnace combusts the organic
carbon and then the combusted organic carbon is then weighed as a percentage.
Understanding the percentage of TOC and kerogen found within an outcrop could lead to
the potential of predicting the hydrocarbon economic viability of the shale.
Statistical Analysis
K, U, Th and calculated API gamma-ray data were imported into SAS (Statistical
Analysis System) and frequency distributions were constructed. The computer generated
frequency charts from SAS provide information regarding the strength of the gamma-ray
response in regards to lithofacies in the outcrops and the distribution of the key elements,
K, U, and Th in the lithofacies. If these statistical associations hold significant
relationships, then the gamma-ray profile in the outcrop can confidently by used to
determine lithofacies in the subsurface.

25
Figure 6. Thin section photographs representing the three kerogen types (Jarvie, Daniel (2004), Humble Geochemical Services).
Kerogen Type Assessment
I. Algal & amorphous material (oil prone)
II. Mixed terrestrial and marine (oil & gas prone)
III. Woody, terrestrial source material (gas prone)

26
Chapter 4
Gamma-Ray Characterization Results
Log Characteristics
The Woodford Shale of south-central Oklahoma is considered a “hot” shale that is easily
identified on well logs. Radioactivity of the Woodford contrasts greatly with that of the
underlying Hunton strata (Dennis, 2004). In comparison, rocks of the Hunton show gamma-ray
deflection in the range of 10 to 60 API units, whereas shales of the Woodford are commonly in
the range of 90 to 200+ API units (Dennis, 2004). The Woodford Shale was previously divided
into three shale members from well-logs by Hester et al. (1988), (Fig. 7). According to Lambert
(1996), the lower shale member has a gamma-ray deflection of more than 300 API units in the
Oklahoma aulacogen. The middle shale member has a response that can be more than 320 API
and the upper shale member produces a response that exceeds 213 API units in northwestern
Oklahoma. Isopach maps of the shale members in northwestern Oklahoma and Kansas indicate
that the middle Woodford Shale member has the greatest aerial extent and thickness (Lambert,
1996).
Gamma-Ray Characterization
A portable gamma-ray scintillometer was used to record gamma-ray radiation
measurements on the surface of the Woodford Shale from the five studied outcrop locations; (1)
McAlester Cemetery shale pit, (2) I-35, (3) Hunton quarry, (4) Brimley residence and (5)
Henryhouse Creek. The radioactivity measurements were plotted against cumulative formation
thickness in order to construct the vertical gamma-ray profile.

27
Figure 7. Well log from Logan County, Oklahoma showing the three Woodford Shale members; lower (4), middle (3) and upper (2), (as first defined by Hester 1988), (modified after Dennis, 2004).

28
The main objective is to determine the controls on gamma-ray response and to describe the
outcrop based upon this response, so that rock properties can be deduced from sections in the
subsurface.
McAlester Cemetery shale pit is located in the Criner Hills area. The Woodford Shale
beds at this location are dipping 35o to the northeast. The entire Woodford Shale is exposed in
the southwest sloping quarry floor and face. The contact between the Hunton Group and the
Woodford is represented at this location, but is not visible because of pond water coverage.
McAlester outcrop transitions from fissile shale in the quarry floor, to siliceous, blocky shale,
and then to a white chalk like shale moving up section that is composed of large phosphate
nodules and concretions (Fig. 8). According to D.W. Kirkland and et al., (1992), the chalky
white portion of the Woodford at this location is probably the result of weathering that occurred
during the Quaternary. According to Kirkland et al., (1992), individual phosphate nodules in the
upper Woodford contain thin, elongated nuclei that appear to be individual pieces of crustacean
carapace. Some phosphate nodules contain nuclei that are interpreted to be the operculum (a
plate that closed over the aperture) of ammonoids (Kirkland et al., 1992). Large, boulder size
calcite concretions were noted at the McAlester location, but they were not in place. The source
of these boulder-size concretions is unclear and they were not studied in detail by the author. A
total of 87 feet (26 m) and 68 gamma-ray readings of the quarry bottom were measured to
construct a vertical gamma-ray profile (Fig. 9). The entire gamma-ray profile is constructed from
measurements taken from fissile shale. Gamma-ray results for this site yield uranium readings of
32.9 ppm (Fig.10), thorium 5.7 ppm (Fig.11) and potassium levels of 1.2% (Fig. 12)
29
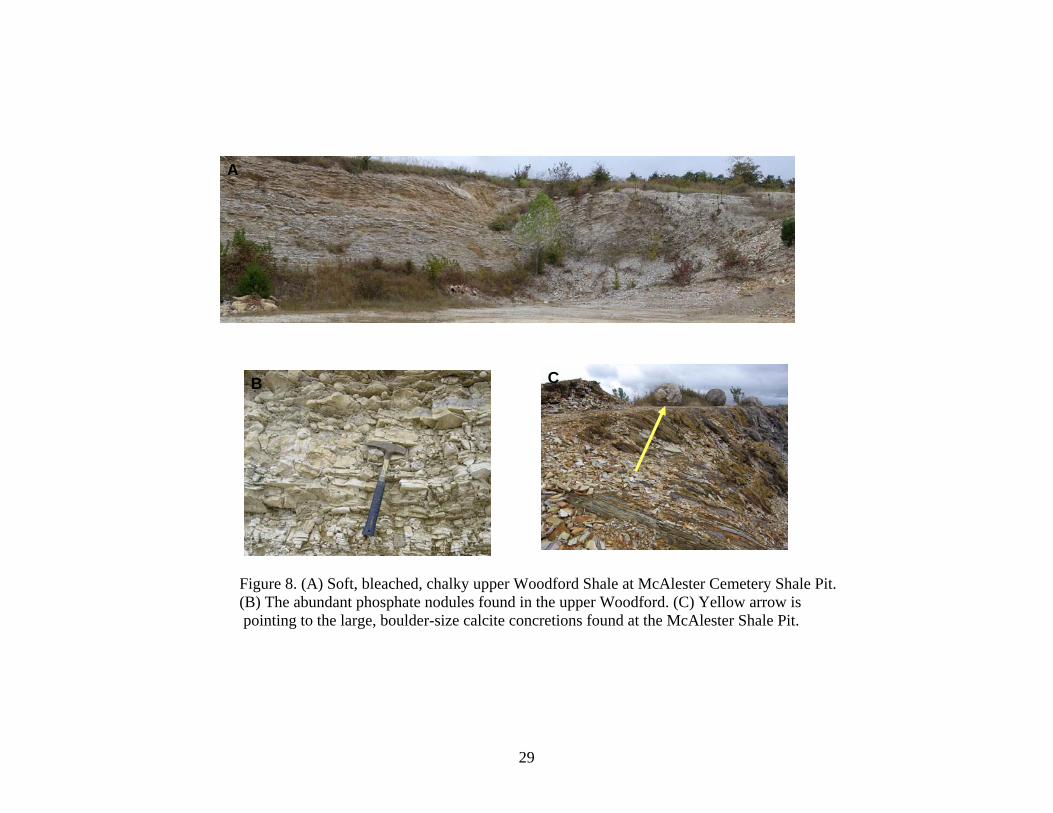
Figure 8. (A) Soft, bleached, chalky upper Woodford Shale at McAlester Cemetery Shale Pit. (B) The abundant phosphate nodules found in the upper Woodford. (C) Yellow arrow is pointing to the large, boulder-size calcite concretions found at the McAlester Shale Pit.
A
B C

30
Figure 9. (A) McAlester Cemetery shale pit gamma-ray profile constructed from 87 feet (26 m) of fissile shale. (B) Gamma-ray profile constructed from data collected from McAlester Cemetery Shale Pit.
B
A Base of Section

31
Figure 10. Gamma-ray frequency distribution for uranium measurements collected in the Woodford Shale study locations.

32
Figure 11. Gamma-Ray frequency distributions for thorium (ppm) content collected in the Woodford Shale study locations.

33
Figure 12. Gamma-ray frequency distributions for potassium % collected from the Woodford Shale study locations.
34
on average. The McAlester outcrop yielded uranium levels as low as 21.2 ppm and as
high as 45 ppm.
The gamma-ray profile at this location (Fig. 9) is marked by transitions from
increasing to decreasing API units that are documented on the profile moving up
stratigraphic section. The base of the outcrop is characterized by a gamma-ray response
of nearly 300 API units; this is followed by a decrease to 200 API units at 14 feet (4 m) in
the section. Moving up stratigraphic section the gamma-ray profile shows an API
deflection to the right that reaches over 400 units. This deflection in gamma-ray is then
followed by a trend of both increasing and decreasing API units, but the API does not
reach over 400 units again in this measured section. From 21 feet (6 m) to 25 feet (7 m)
the gamma-ray profile is the “hottest” and is represented by over 400 API units.
Weathering and an accumulation of rock debris caused missing values from 54 feet (16
m) to 65 feet (20 m).
The I-35 outcrop is located on the west side of the southbound lane of interstate
35. The upper Woodford Shale is exposed at this location with beds dipping 38o to the
south. The Hunton Group is located on the north side of the outcrop and the Sycamore
Limestone on the south. The base of the Woodford is not exposed at this location and was
probably eroded away by a small stream channel, which separates the Woodford from the
Hunton Group. Because of high vegetation and precarious climbing conditions the
contact point between the Sycamore Limestone and the Woodford was not established,
but is presumed to be located within a highly vegetated area where a healthy
Cottonwood tree is growing (Fig.13). A 68 ft (20 m) vertical profile was constructed
from the base of the outcrop towards the top of the outcrop. This outcrop transitions

35
Figure 13. I-35 Woodford Shale outcrop. Pink arrow is pointing in the general area of the presumed Woodford and Sycamore Limestone contact. Black line is the Devonian-Carboniferous boundary according to Over (1990).

36
upward into fissile shale, intermittent beds of siliceous and fissile shale, phosphate
nodules, and a limestone bed (Plate. 2). A total of 62 gamma-ray measurements were
collected from the I-35 location (Fig. 14). Gamma-ray results yield uranium readings on
average to be 33.2 ppm, thorium 5.6 ppm and potassium 1.0% (Figs 10, 11, 12). I-35
outcrop yielded uranium readings as high as 57.4 ppm and as low as 6.9 ppm. The
gamma-ray profile for I-35 outcrop is representative of the upper Woodford Shale. The
interval starting at the base of the I-35 section has an API unit of 400 that is followed by
a decrease to 350 API units as you move up stratigraphic section. From 2 feet (0.6 m) to
15 feet (4.5 m) data is missing because of the amount of rock debris covering the outcrop.
Progressing up stratigraphic section, at 16 feet (4.8 m) the gamma-ray profile has an API
value of over 500. This is the “hottest” zone on the profile and is found from 16 feet (4.8
m) to about 19 feet (5.7 m). Continuing up stratigraphic section, the gamma-ray API units
decrease. This decrease is represented by the light gray to darker gray shales, and the
phosphate nodules that are common to the upper Woodford Shale.
The Hunton quarry outcrop is located in an abandoned shale pit on the south side
of the Goddard Church Camp Road off of Route 10, heading south from Davis,
Oklahoma. The Hunton Group limestone is clearly visible in this quarry, but a contact
point was not established at this location. The base of the measured section is composed
of siliceous shale with intermittent fissile shale. Progressing up the outcrop the Woodford
Shale becomes more brittle and fissile. This is likely the result of quarrying. The
Sycamore Limestone is not visible at this location. 55 feet (17 m) of vertical profile was
constructed from the base of the outcrop towards the top of the outcrop. A total of 63

37
Figure 14. (A) I-35 outcrop showing general location of gamma-ray profiles. (B) Composite gamma-ray profile constructed from data collected from I-35.
A
B

38
gamma-ray measurements were collected from the Hunton quarry outcrop (Fig. 15).
Gamma-ray results yield uranium readings on average of 42.0 ppm, thorium 6.6 ppm and
potassium 1.4% (Figs. 10,11,12). The Hunton quarry yielded gamma-ray readings as
high as 63.2 ppm, and as low as 28.2 ppm. The base of the Hunton Quarry gamma-ray
profile is noted to be 440 API units. The API units decrease to 350 and then increase to
600 API units from 5 feet (1.5 m) to7 feet (2 m). This change in gamma-ray is followed
by both increasing and decreasing API units, none of which falls below 250 or above 590
API units.
Brimley residence outcrop is located along the banks of the Jack Fork Creek near
Ada, Oklahoma. The section contains gray to light gray colored shales and phosphate
nodules and was determined to represent the upper Woodford Shale based on appearance
alone. A 15 ft (4.5 m) vertical profile was constructed from the base of the outcrop to the
top of the outcrop and a total of 17 gamma-ray readings were collected (Fig.16). Average
uranium readings are around 24.2 ppm, thorium 6.3 ppm and 1.7 % potassium (Figs. 10,
11, 12). The Brimley residence yields uranium readings as high as 35.3 and as low as
11.8 ppm. Because of the thin exposure of the upper Woodford at this location,
evaluations of the internal characters of the gamma-ray profile is limited.
The Henryhouse outcrop is located along the banks of Henryhouse Creek just
south of the falls. The Woodford Shale at this location is dipping 27o almost due south in
the direction of stream flow (Over, 1990). The length of exposure along the creek is
about 527 feet (160 m). The Woodford Shale in its entirety is represented at this location.
The Hunton Group is visible on the northern side of the outcrop. The Sycamore
Limestone is visible on the southern side of the outcrop. There is no direct contact

39
Figure 15. (A) Woodford Shale outcrop located at the Hunton quarry (staff is 1.5 m in height) Red arrow indicates the base of where the section was first measured. (B) Woodford Shale gamma-ray profile constructed from the Hunton quarry.
A
B
40
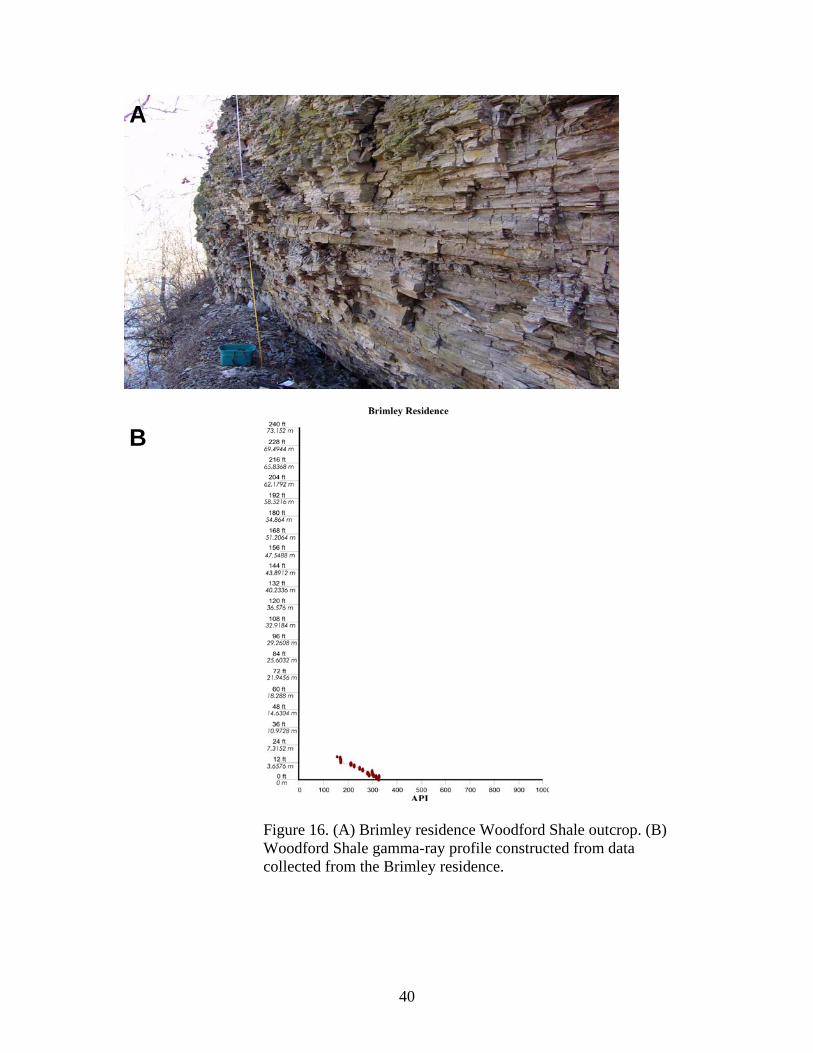
Figure 16. (A) Brimley residence Woodford Shale outcrop. (B) Woodford Shale gamma-ray profile constructed from data collected from the Brimley residence.
A
B
41
between the Sycamore Limestone and Woodford Shale at this location. A vertical profile
of 233 feet (71 m) perpendicular to bedding was constructed from data collected at the
outcrop. A total of 291 gamma-ray readings were collected from this outcrop (Fig. 17).
The base is composed of organic-rich black shales, and siliceous shales with intermittent
fissile shales. The middle Woodford is generally highly fissile and gray in color
(weathered color). Transitioning from the middle Woodford weathering colors in the
fissile shale are generally orange in color that transition into a siliceous shale that is
blocky and occasionally greenish brown. The upper Woodford is composed of siliceous
blocky beds, silty and phosphatic shales and phosphate nodules. Uranium was found on
average to be 41.1 ppm, thorium 7.4 ppm and potassium 1.8% (Figs. 10, 11, 12). Within
the Henryhouse Creek outcrop uranium is found as high as 106.3 ppm and as low as 13.3
ppm. The basal portion of the Henryhouse Creek profile is represented by a gamma-ray
reading of 300 API units. Progressing up stratigraphic section, there is an increase of up
to 600 API units in the gamma-ray profile between 10 feet (3 m) to 15 feet (4.5 m).
Following this increase, the API units are found to vary between 250 to 450 API from 17
feet (5.1 m) to 153 feet (46.6 m). This is followed by a tremendous increase in the
gamma-ray profile with API units reaching nearly 1000. This occurs from 154 feet to
173 feet (52.7 m) in the gamma-ray profile. This is then followed by a general decrease in
the gamma-ray profile of API units that range from 150 to 500 API in the upper 59 feet
(17.9 m) of the outcrop.

42
Figure 17. (A) Henryhouse Creek outcrop located near the falls area. (B) Gamma-ray profile constructed from data collected from the Henryhouse Creek section. Blue arrows indicate high gamma-ray peaks that are the direct result of the enrichment of uranium.
A
NS
B

43
Discussion
Outcrop gamma-derived profiles from the five locations yield much higher API units than
were previously documented by Lambert (1996). The studied outcrops yield an average
API of 360 (Fig. 18) with a minimum value of 79 and a maximum value of 943 API
units. The largest peaks that occur on the gamma-ray profile are interpreted to be
maximum flooding surfaces (Fig. 17). These maximum flooding surfaces are enriched in
uranium and suggest slow sediment accumulation period in which uranium would have
ample time to diffuse downward into the chemically reducing sediment and become
immobilized. Swanson (1962) calls the Woodford equivalent (Chattanooga) a
uraniferous shale. To meet this classification, black shales should contain in excess 20
ppm, or 0.020 percent of uranium. The Woodford Shale outcrops in south-central
Oklahoma meet this classification with average uranium content of 38.5 ppm (Fig. 19)
and a maximum value of 106 ppm. Uniformity in uranium content and the high
radioactivity compared with other sedimentary rocks are the reasons why the Woodford
and most other black shales are used as “marker beds” in interpreting subsurface
stratigraphy over large geographic areas (by gamma-ray logs from subsurface (Swanson,
1962). These observations support the conclusions that the uranium in this marine black
shale was deposited nearly at the same time as the enclosing sediment and that the only
logical source of the uranium in the black shales is the overlying sea water (Swanson,
1962). According to Swanson, (1962) the major sources of uranium in sea water are
igneous, metamorphic, and sedimentary rocks that release their uranium to surface and
ground waters as they are disintegrated by weathering processes. Most of the uranium is
dissolved in the ground and surface waters and then transported to the sea in streams

44
Woodford Shale API
0
20
40
60
80
100
120
140
160
0 50 150 200 250 300 350 400 450 500 550 600 650 700 750 800 850 900 950
API
Freq
uenc
y
Figure 18. Frequency distributions of API units from the five Woodford Shale outcrops.

45
Woodford Shale Uranium ppm
0
20
40
60
80
100
120
140
5 10 15 20 25 30 35 40 45 50 55 60 65 70 75 80 85 90 95 100 105 110
Uranium ppm
Freq
uenc
y
Figure 19. Uranium frequency distributions from the five studied Woodford Shale outcrops.

46
or rivers. More recent global mass balance calculations for uranium in the oceans
support this conclusion. The dissolved uranium in the sea water may be present in
several forms and is dependent mainly on the Eh of the water. Generally with a low Eh
reducing environment uraninite precipitates (Jolly, 1988). In the normal slightly alkaline
and oxidizing environment of sea water (pH about 8.0, Eh about +0.1), practically all the
uranium is present in the hexavalent, or uranyl, form which combines with carbonate,
sulfate, and other complex ions. These ions are highly soluble and widely distributed in
the sea water (Swanson, 1962). Of all the sedimentary rocky types, only black shales
have been found to contain large concentrations of syngenetic uranium (Olson, 1982).
There are two main reasons why uranium is concentrated in black shales; (1) H2S is
produced by the decomposition of sulfur bearing organic debris. This lowers the Eh and
uranium is deposited as uraninite (Swanson, 1961), (2) Uranium is extracted from sea
water by humic acids. Hydrogen ions are displaced by ion exchange in slightly alkaline
waters. With an Eh drop, the uranium bearing humic acids flocculate and fall to the sea
floor. The uranium in black shales is disseminated in the rock (Jolly, 1988). In
comparison, marine black shales that are deposited in rapidly subsiding marginal basins
contain less uranium than black shales that are deposited in epicontinental seas on the
more stable cratonic areas. This observation suggests sedimentation rates may influence
uranium content (Swanson, 1961). If the depositional environment is humic-acid rich,
such as in the case of a black shale, variations in uranium content would vary directly
with sedimentation rate. In addition, Olson (1982), determined that the amount of
uranium associated with the organic fraction is proportional to the length of time between
introductions of the organic material to reducing marine waters through burial to a depth

47
where uranium can no longer effectively diffuse from the overlying water column into
the pore water adjacent to the organic material. This period of time is believed to be
largely controlled by the rate of sediment accumulation. Data results from elemental,
visual, and pyrolysis studies indicate that organic matter type is uniform within south-
central Oklahoma and therefore kerogen type cannot be a factor in controlling the
uranium content of the Woodford Shale (Olson, 1982).
Gromadzki (2004), used outcrop-based gamma-ray profiles to analyze arsenic
occurrence in relationship to sedimentary lithofacies and depositional environments in
continental red-bed aquifers. Gromadzki’s data for the mudstones and siltstones in
comparison with the marine deposited shales of the Woodford yields uranium on average
of 3.1 ppm, thorium 12.38 ppm and 1.5% potassium (Fig. 20). The Woodford outcrops
average uranium is 38.5 ppm, thorium 6.8 ppm and 1.5% potassium. Continental red-
beds and fluvial deposits in the rock record are expected to be lower in uranium content
than black marine shales because uranium content is mobilized under oxidizing
conditions (subarial weathering).
One might assume that a uraniferous organic-rich black shale such as the
Woodford would also contain uranium-enriched nodules. Outcrop gamma-ray profiles of
the upper Woodford show a decrease in the amount of uranium in the upper Woodford
where the nodules are located, suggesting this is not the case. Moreover, the whole-rock
geochemistry data from Siy (1988), who studied the nodules, reports no uranium. This
change in the gamma-ray profile is represented in the upper portion of the Henryhouse
Creek and I-35 outcrops (Figs. 21, 22) and at the Brimley residence.

48
Figure 20. Marine Woodford in comparison with Gromadzki’s continental red beds of Oklahoma Note the scale change in uranium histogram (A vs. C), (Gromadzki, 2004).
CD

49
Figure 21. Outcrop derived gamma-ray profile of the Henryhouse Creek section, above the black line indicates phosphate nodule zone.
Henryhouse Creek

50
Figure 22. Outcrop derived gamma-ray profile of the I-35 outcrop, above black line indicates phosphate nodule zone.

51
According to Swanson (1962), the occurrence of uranium content in nodules depends on
the timing of the nodule formation and is represented by four scenarios (Fig. 23). The
four scenarios are as follows; (1) phosphate is not deposited and uranium is concentrated
in the sediment by organic matter or by chemical reduction through the action of
hydrogen sulfide, (2) scattered phosphate nodules form in the sediment but the amount of
uranium that substitutes for calcium in the carbonate fluorapatite is in large part
dependent on the availability of the uranium in the waters where precipitation of
phosphate takes place; when considering the phosphate nodules of the upper Chatanooga
Shale, Swanson concluded the uranium in these waters had already been depleted by
direct hydrogen sulfide precipitation, and the resulting phosphate nodules contain little or
no uranium, (3) major phosphate deposition takes place at the sea floor sufficient water
circulation involved to result in phosphate nodules containing 0.01 to 0.10 percent
uranium and scenario (4) a minor amount of phosphate is precipitated, the phosphatic
particles may have a high uranium content, but the rocks that house the nodules rarely
contain more than a few parts per million uranium (Swanson, 1962). The Woodford
Shale phosphate nodules probably represent scenario 2 and may be indicative of a lesser
amount of uranium accumulation. If sulfide had not reached the location of phosphate
precipitation, and uranium was available in the waters, the phosphate nodules in the
upper Woodford deposited during scenario 2 could have the potential to contain several
hundredths percent uranium (Swanson, 1962). Siy, (1988) determined that certain
elements other than uranium are enriched in the phosphate nodules of the Woodford
Shale. Sr, Y, La, Ce, and Sc are some elements that are enriched in the I-35 phosphate

52
Figure 23. Stratigraphic section representing the four stages as related to the distribution of phosphate in the Chattanooga Shale with interpreted pH and Eh that existed in the time of deposition in upper Devonian-Mississippian black shales (modified after Swanson, 1962).

53
nodules either by substitution of calcium or by association with specific apatite
morphologies (La, Ce, and Nb), (Siy, 1988).
Correlation
The three shale members of the Woodford as defined by Hester et al., (1988), for
the Permian basin, by Lambert (1992) in Kansas, and by Dennis (2004) for Logan
County, Oklahoma are clearly visible on the outcrop based gamma-ray profiles of the
Woodford Shale constructed for this study (Fig. 24). These three shale members are
informally named the lower, middle, and upper members, nomenclature adopted by
Lambert, (1992). The Henryhouse outcrop profile is used to highlight these three
members because at this location the entire Woodford Shale is exposed. The lower
Woodford Shale at Henryhouse is about 60 feet (18 m) thick and is represented by
uranium readings from 19.8 to 66 ppm with an average of 36.9 ppm. API units in the
lower Woodford Shale member fall between 198-602 API units with an API average of
355. The middle shale member is about 120 feet (36 m) thick with uranium readings that
fall between 22.4 to 106 ppm with an average of 43.4 ppm. API units in the middle
Woodford Shale range from 242-943 API with an average of 410 API units. The upper
Woodford Shale is about 60 feet (18 m) thick and is represented by uranium readings
from 13.3 to 57.5 ppm with an average of 39.2 ppm. The API units in the upper
Woodford range from 130 to 510 API units with an average API of 355. The outcrop-
based gamma-ray profile suggests that the upper Woodford Shale can further be divided
into a fourth member. This member is based upon the occurrence of abundant phosphate
nodules at Henryhouse (Fig. 24) and is represented by the upper 14 feet (4 m) of the

54
Figure 24. Henryhouse section showing the lower, middle and upper shale members. The blue line indicates the top of the lower shale member and the bottom of the middle shale member. The green line indicates the top of the middle shale member and the bottom of the upper shale member. The purple line indicates the bottom of the fourth member (zone where the phosphate nodules appear).

55
Woodford Shale. Uranium readings from this zone are from 13.3 to 57 ppm with an
average of 36.3. API units in the phosphate zone range from 130-496 API units with an
average of 329 API.
The shale members in the outcrop-based gamma-ray profile of the Henryhouse
section can then be correlated to the other four studied outcrops in south-central
Oklahoma (Plate. 3). The upper 30 feet (9 m) of the Woodford Shale from the
Henryhouse section can be correlated to the 68 foot (20 m) of the I-35 section where only
the upper Woodford is exposed. The I-35 section can then be correlated to the Brimley
residence outcrop where the upper Woodford Shale is 17 feet (5 m) thick. A portion of
the middle shale member from 81 feet (24 m) to 147 feet (45 m) of the Henryhouse
section can be correlated to McAlester Cemetery shale pit from about 23 feet (7 m) to
about 85 feet (26 m). The McAlester outcrop from about 21 feet (6 m) to about 81 feet
(24 m) can be correlated to the Hunton quarry outcrop from about 6 feet (1.8 m) to about
54 feet (16 m).
These members along with outcrop-based gamma-ray profiles can also be used to
correlate outcrops into the subsurface (Plate. 4) Because gamma-ray logs are continuous
curves, in contrast to the sequences of closely spaced, connected points composing a
vertical outcrop profile, gamma-ray logs and outcrop profiles are not identical
(Ettensohn, 1979). That outcrop-based gamma-ray profiles of the Woodford can be
correlated into the subsurface has economic significance. The ability to correlate
between outcrop profiles provides an important context for which rock properties can be
projected into the subsurface. These properties provide insight as to the potential zones
that may be the most economically viable for gas in the subsurface. For instance,

56
viewing what the siliceous shales look like in outcrop and making comparisons to
subsurface, potentially can help exploration geologists locate portions of the section that
are; 1) easily fractured and 2) difficult to drill through, particularly in the case of
horizontal drilling.

57
Chapter 5
Petrology Results
Lithofacies in Outcrop
The Woodford Shale of south-central Oklahoma is an organic-rich black shale
that also contains phosphatic shale, siliceous shale, rare chert, rare bedded limestone,
bedded dolomite and phosphate nodules. The bulk of the shale in the Woodford has two
main habits, fissile and non-fissile (Fig. 25). The non-fissile habit contains phosphatic
shale, rare chert, siliceous shale, phosphate nodules (housed in the fissile shale) and
(occasionally) a carbonate bed. Lithofacies found within the fissile shales category are
the more highly organic-rich shales, phosphatic shales and phosphate nodules. The fissile
lithofacies are composed of laminations that are between 1-4 centimeters thick (Fig. 26)
and are occasionally silty (<.065mm). Portions of these organic-rich fissile shales are
very finely laminated (<3mm). Siliceous shale has a blocky appearance and ranges
between 1-6 centimeters (Fig. 27) in thickness. On occasion both siliceous and fissile
shales are interlaminated on about a 1-2 cm scale, suggesting lateral gradation changes
occur between these two lithofacies and are noted in outcrop.
Dark gray to black shales are commonly found at the base of the Woodford just
above the carbonates of the Hunton Group. The lower basal Woodford is represented by
a maximum flooding surface that is common on the gamma-ray profile (Fig. 17). For
wells located to the east of the study area, the base of the Woodford just above the
Hunton Group carbonates contains dolomitic rip-ups and rock fragments (Devon Study,
2004). According to the Henryhouse outcrop, the lower Woodford Shale is about

58
Figure 25. Woodford Shale along I-35, green arrow indicates siliceous shale, pink arrow indicates fissile shale (penny for scale).
Figure 26. Woodford Shale along I-35, yellow circle indicates fissile shale that is laminated <1 cm thick.

59
Figure 27. Woodford Shale at Brimley residence; yellow arrows indicate siliceous, blocky shale.

60
60 feet (18 m) thick. The middle section of the Woodford Shale is 120 feet (36 m) thick
in outcrop and contains both a fissile and a gray to black silty shale that is horizontally
laminated. Diagenetic nodular pyrite, marcasite and detrital mica are visible in outcrop.
The pyrite concretions are the result of anaerobic oxidation of organic matter by sulfate
reducing bacteria (D.W. Kirkland et al., 1992). The upper section of the Woodford Shale
is 60 feet (18 m) thick in outcrop and is much lighter in color than the base and the
middle Woodford, and is generally light grey to sometimes white. Phosphate, siliceous
phosphate, phosphate nodules and occasionally chert compose the upper portion of the
Woodford Shale (Fig. 28). Dolomite beds are found in the lower, middle and upper
Woodford (Fig. 29) Organic-rich beds that have a coal-like appearance occur in the upper
Woodford at the Henryhouse outcrop.
Thin-section Analysis
Thin sections were collected from the upper Woodford Shale from the I-35 and House
Creek localities and thin sections from the lower Woodford Shale were analyzed by
TerraTek in Salt Lake City, Utah. A 2004 Devon Study revealed that the base of the
Woodford is made up of dolomitic rip-up clasts, rock fragments, including reworked
sandstone clasts and other mineral grains: glauconite, quartz and chert (Fig. 30).
Glauconite is usually a result of locally reducing conditions in an oxidizing environment
and is commonly found in the basal portions of Transgressive System Tracts (Devon
Study, 2004). Importantly, a high gamma-ray well log response is common to the base of
the Woodford, over the top of the pre-Woodford unconformity. The lower Woodford

61
Figure 28. Woodford Shale at Henryhouse Creek; yellow circle indicates phosphate nodules. Orange arrow indicates siliceous shale bed.

62
Figure 29. (A) Hydrocarbon-bearing dolomite bed found in the upper Woodford Shale at Henryhouse (yellow arrow). (B) Organic-rich shale that has a coaly-like appearance found in the upper Woodford at Henryhouse Creek (yellow arrow).

63
Figure 30. Thin section photograph magnified 40x of the lower Woodford Shale near the contact with the underlying Hunton Group. Thin section shows The presence of glauconite (pink arrows) rounded quartz grains, and rock fragments.

64
shale is composed of repetitive siliceous shale beds that are 1-4 centimeters thick and
fissile shale that is 1-4 centimeters thick.
The middle section of the Woodford Shale is largely composed of fissile shale
with some siliceous shale. Nodular pyrite and marcasite in the form of concretions is also
found weathering out of the fissile shale. There were no inspections of the thin sections
from the middle section of the Woodford Shale.
Inspection of thin sections of the lower portion of the upper Woodford Shale
indicates that the shale is composed of biogenic quartz (chalcedony) derived from
radiolarians, pyrite, phosphate, and clay (Fig. 31). Thin sections made from fissile shale
portions indicate that it is an organic-rich part of the Woodford. Radiolarians in the fissile
portion of the shale are compacted and wisps of phosphate are apparent (Fig. 32).
Alginite, tasmanities, crushed foraminifers, bituminite and framboidal pyrite is also
commonly found in the lower portion of the Woodford Shale (Fig.33). Alginite is a type
of kerogen that is made from decomposed algae and other plant material. Alginite is also
known as “amorphous organic matter” (Szabo, 2003). Thin sections indicate that this
portion of the Woodford is very organic-rich. This observation is based upon the
increasing reddish-brown color of the thin sections (common color of some organic
matter types). Phosphate nodules are also becoming much more distinct in thin section.
Fragments of bivalves and crushed foraminifers are also represented in the lower portion
of the upper Woodford (Fig. 34). Small dolomite beds ranging from 1 – 2 centimeters are
also occasionally found in this portion of the section and phosphate stringers are found
within the dolomite beds.
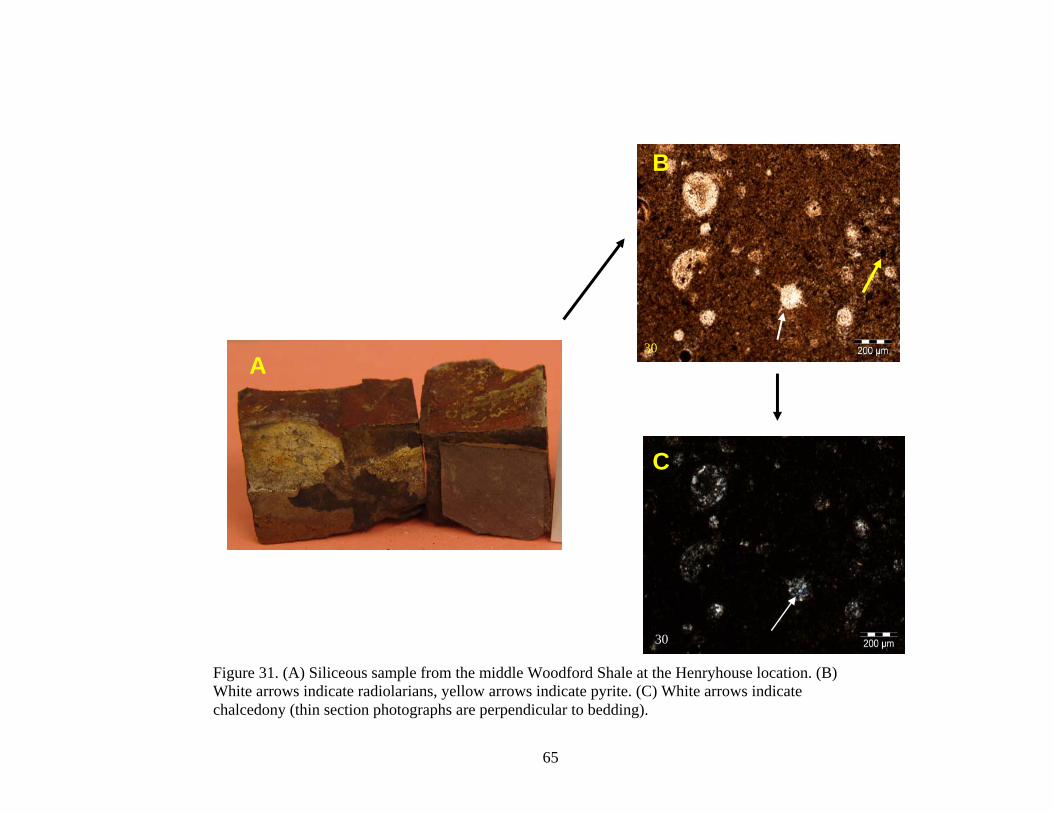
65
A
B
C
30
30
Figure 31. (A) Siliceous sample from the middle Woodford Shale at the Henryhouse location. (B) White arrows indicate radiolarians, yellow arrows indicate pyrite. (C) White arrows indicate chalcedony (thin section photographs are perpendicular to bedding).

66
Figure 32. Fissile shale samples taken from the middle of the Woodford Shale at the Henryhouse outcrop. (A) and (B), pink arrows indicate radiolarians, yellow arrows indicate wisps of phosphate.
A
B
21
19

67
A D
C
B
20
7
Figure 33. Photographs are from fissile Woodford Shale. (A) Thin section photograph, pink arrows indicate pyrite (thin section photograph is perpendicular to bedding). (B) Green arrows show wisps of bituminite, blue arrow represents a crushed foraminifer, yellow arrow indicates tasmanities and white arrow shows alginite. (C) Hand sample from Henryhouse used to prepare thin section in D. (D) Thin section photograph from hand sample C, white arrow indicate bituminite, yellow arrows indicate alginite. Note, the discontinuous algal mat type appearance of thin section D.
13
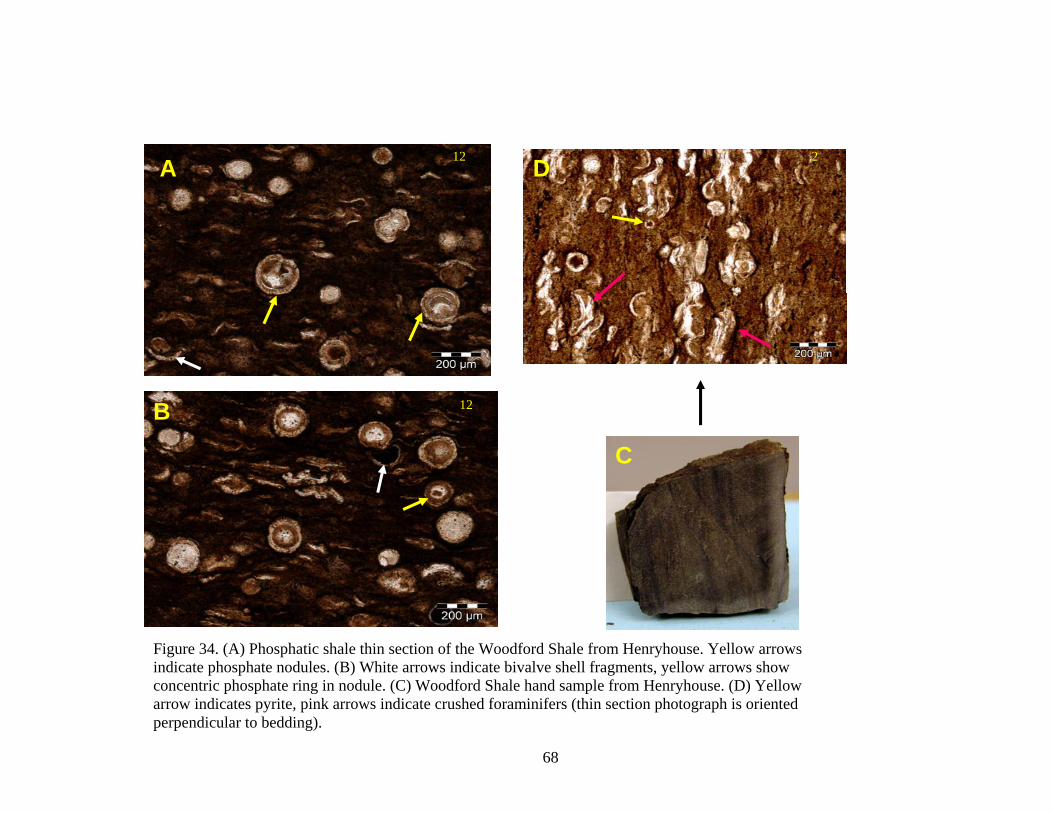
68
A
B
C
D 2
12
Figure 34. (A) Phosphatic shale thin section of the Woodford Shale from Henryhouse. Yellow arrows indicate phosphate nodules. (B) White arrows indicate bivalve shell fragments, yellow arrows show concentric phosphate ring in nodule. (C) Woodford Shale hand sample from Henryhouse. (D) Yellow arrow indicates pyrite, pink arrows indicate crushed foraminifers (thin section photograph is oriented perpendicular to bedding).
12

69
Progressing up stratigraphic section in the upper Woodford, shales are composed
of repetitive siliceous shale beds that are 1-3 centimeters thick and fissile shale that is 1-3
centimeters thick. Minerals visible in siliceous shale hand samples are detrital quartz and
diagenetic pyrite. Thin sections (siliceous samples) indicate the presence of radiolarians,
phosphate, clays, pyrite and amorphous organic material (Fig. 35). Distinctive
laminations of clay materials are apparent in thin section as well. Dolomite beds are also
found in outcrop (Fig. 36). Dolomite beds are much more noticeable in thin section than
in outcrop (Fig. 37) because of their physical similarities to siliceous shales. These
dolomite beds are potentially the result of diagenetic replacement of shaly limestones.
The occurrence of pelagic organisms such as radiolarians and the organic-rich
environment supports a deep marine depositional setting for shaly limestones.
Continuing up stratigraphic section, the upper Woodford Shale consists of
siliceous and phosphatic shales and nodules. Inspection of thin-sections reveals that the
upper Woodford contains silt sized particles, phosphates, clays and disseminated pyrite
(Fig. 38). The shales of the upper Woodford are becoming more silty and phosphatic
than the shales found in the lower portion of the upper Woodford (Fig. 39). According to
Schieber (2000), the quartz found in the upper Woodford is not detrital but instead
precipitated very early in diagenesis in algal cysts and other pore spaces, with silica
derived from the dissolution of radiolarians or diatomic opal.

70
A B
C D
E F
10
10 10
10
Figure 35. Thin sections of siliceous shale samples collected from the I-35 outcrop. (A) Transmitted light, red arrows indicate radiolarians, orange arrows indicate phosphate. (B) Previous slide with cross polarization, red arrows indicate chalcedony. (C) Pink circle is representative of amorphous organic material, (D) previous slide with cross polarization / note the abundance of chalcedony. (E) Clay-rich thin section, white circle represents layers between clays and phosphate; blue arrows indicate framboidal and pyrite blebs (thin section photograph is perpendicular to bedding). (F) Blue arrow is pointing to pyrite (thin section photograph is perpendicular to bedding).

71
A B
Figure 36. (A) Hand Sample of dolomite bed from McAlester shale pit. (B) Thin section made from hand sample, showing the presence of dolomite (thin section photograph is oriented perpendicular to bedding).
1

72
A B
Plane
Crossed
Plane
Crossed
28 10
Figure 37. (A) Shale from Henryhouse containing small dolomite beds, noticeable only in thin section. (B) Dolomite bed found in the upper Woodford Shale at Henryhouse. The thin section photographs are oriented perpendicular to bedding.

73
A
B
C
11
11
Figure 38. (A) Fissile hand sample from Henryhouse location. (B) White arrow indicates disseminated pyrite, yellow arrow indicates phosphate. (C) Thin section with cross-polarization, yellow arrow indicates silt grains (view is perpendicular to bedding.

74
A B
C
6 / 86 / 8
6 / 8
Figure 39. (A), (B) and (C) Woodford Shale thin sections from the upper Woodford Shale at I-35 representing the increase in silica (radiolarian remains).

75
Organic-rich black shales that have a coal-like appearance are also found in the
upper sections of the Woodford Shale. Schieber (2001) suggests that organic-rich black
shales with a coal-like appearance originated in the following manner: (1) accumulation
of layers of organic debris that is stabilized by microbial slime, (2) compaction and
further maturation of these layers follows, thus leading to streaks of bituminite.
Therefore, these coal-like streaks may actually represent compressed layers of essentially
pure organic debris (Schieber, 2001).
Rare occurrences of chert occur in the upper Woodford. Thin section analyses of
samples reveal a high concentration of chalcedony (Fig.40). The chalcedony is the result
of dissolving radiolarian tests, which are originally composed of opaline silica and
provided the silica for initial chalcedony precipitation (Schieber, 2000). Upon burial of
the radiolarians, opaline silica undergoes transformation. The transformation of opaline
silica is generally a two step process. First, siliceous oozes are altered to porcellanite
(represented in the upper Woodford at McAlester Cemetery shale Pit), which is
composed primarily as cristobalite. The cristobalite is then converted to a chert
containing mainly micro quartz and chalcedony (Scholle and Arthur, 1983).
Phosphate nodules are found in the upper Woodford shale. Phosphate nodules
weather light to gray to white and are easily recognized in the darker shales. The majority
is pebble-sized, but diameters range from 0.5-9 centimeters (Siy, 1988). According to
Siy, (1988) phosphate nodules are early diagenetic, in situ features which formed in the
upper few centimeters of the Woodford Shale. Sufficient concentrations of phosphorous
and euxinic, (anaerobic) conditions in the lower water column enhanced the inorganic

76
A
B
Figure 40. (A) Cross-polarization of thin sections from siliceous shale found at McAlester Cemetery shale pit show the abundance of chalcedony (yellow arrow). (B) Thin section in transmitted light, showing radiolarians (yellow arrow).
1 / 2

77
precipitation of apatite during a major transgressive episode (Siy, 1988). The Woodford
Shale phosphatic nodules are composed of carbonate fluorapatite resulting from varying
amounts of diagenetic alterations of the apatite (Siy, 1988). Nodules of this interval
contain 15-38 wt % P2O5, which is high enough to permit classification of the shale
phosphorites (Siy, 1988). All shales are compressed around phosphate nodules. This
confirms that phosphogenesis preceded shale compaction (Fig. 41), (Siy, 1988). Thin
section analysis confirms the phosphatic composition of the nodules and the presence of
phosphate minerals such as wavellite (Fig. 42).
XRD Data
XRD (X-Ray diffraction) data from siliceous and fissile samples reveals that the
upper Woodford Shale is composed of between 5% - 19% mixed layered illite / smectite.
Quartz constitutes between 40-76% of the sample. Jarosite percentages lie within the 2-
5% range with occasional trace amounts. Jarosite is not a common mineral and occurs as
a crust of crystals on the surface of the rock. Jarosite is classified as a potassium iron
sulfate hydroxide. The presence of jarosite is probably the result of a pyrite-oxidizing
environment (modern weathering). Na-plagioclase, calcite and dolomite are also found as
trace amounts within the samples.

78
Figure 41. Fissile shale compaction around phosphate nodules found at the Henryhouse outcrop.

79
A
B
C
D
Figure 42. (A) Siliceous sample of phosphate nodules from I-35. (B) Thin section showing phosphate, white arrow indicates radiolarian. (C) Phosphate nodule from McAlester shale pit. (D) Thin section of phosphate nodule, white arrow is pointing to mineral wavellite (phosphate mineral).

80
TOC Data
Thirty eight samples were analyzed for TOC by Humble Geochemical in
Houston, Texas. The samples were collected at the I-35 Outcrop on the southern flank of
the Arbuckle Mountains. The sample interval is from the base of the outcrop to 52ft
towards the top of the outcrop (up stratigraphic section). TOC results reveal that there is
distinct variation in total organic carbon within the measured section. Samples were
organized according to increasing TOC and range from about 0.8 -17.0 wt%, with an
average of 10 wt% (Fig. 42). TOC analysis in coordination with hand samples (Fig. 43),
reveals lower TOC values, 0.6 – < 6 wt % are characteristic of the siliceous, blocky,
lithofacies. Samples with TOC values in the middle range 6-< 14 wt% are slightly
siliceous and fissile. The highest TOC values correspond with fissile organic-rich shales.
This organic-rich fissile shale has TOC values of >14 wt %. D.W. Kirkland others
(1992) completed a TOC study from the McAlester outcrop. This previous study had
TOC values between (0.3-17.0%) and an average of 8.0%. The high percentages of TOC
are potentially the result of dissolved organic molecules (common in seawater) being
absorbed into the crystal lattice of smectite clay minerals. The organic matter that is
associated with the clays is protected from oxidization and metabolization (Kennedy,
Pevear, and Hill, 1992). Schmoker (1980) showed a relationship for TOC based on color
of Devonian Shales in the western Appalachian Basin. Schmoker used a Munsell color
system to show that high TOC content is associated with dark-medium to gray colored
shales. An attempt was made to

81
Figure 43. Frequency distribution of the TOC content in outcrop samples from the I-35 location (n=38).
Woodford Shale
0
1
2
3
4
5
6
7
8
9
10
0 2 4 6 8 10 12 14 16 18 20
TOC
Freq
uenc
y

82
Figure 44. Samples of the Woodford Shale from the I-35 location representing the three categorized TOC values.
Siliceous, blocky
83
establish a similar relationship within the TOC samples from the I-35 outcrop. Samples
were categorized according to the Munsell color charts and then graphed to determine if a
relationship exists between TOC and color. A relationship can be determined within the
fissile lithofacies because fresh, non-weathered samples are represented by high TOC
values and dark colors. However, a direct relationship between TOC and siliceous
samples cannot be determined. Siliceous samples are represented by both light and dark
colors, yet the dark colors have low TOC values, thus there is not enough strong evidence
to establish the relationship between TOC and color in the Woodford Shale.
Humble Geochemical in Houston, Texas conducted calculations on four outcrop
samples from the I-35 location to determine vitrinite reflectance for estimating (%/Ro)
thermal maturity. Vitrinite reflectance estimates are important because they reveal the
thermal maturity of an area and the potential zones for oil and gas. Vitrinite reflectance
ranges from the I-35 outcrop are between 0.70% and 0.72%. This data suggests that the
thermal maturity of the four samples lies in the early “Oil window maturity zone”. This
categorization is based upon the following data; (1) <0.60% immature oil window, (2)
0.60-1.00 oil window, (3) 1.00-1.40 condensate / wet gas window and >1.40 dry gas
window. Producible gas may be found at about 1.0%Ro (Jarvie, 2004). Amorphous
kerogen is a dominating characteristic within the samples. Humble Geochemical (2005)
also noted the presence of tasmanities and bitumen. The amounts of bitumen indicate that
some liquid hydrocarbons were generated in the past. Cardott (2001) determined the
thermal maturity of the Woodford Shale by measuring vitrinite reflectance of well
cuttings. Cardott (2001) determined that the average vitrinite reflectance of the Woodford

84
Shale ranges from about 0.5% - 6.4%. Cardott (2001) also indicates that the thermal
maturation of the Woodford Shale increases from west to east and with increasing depth
in the Arkoma basin. Olson (1982) determined that thermal maturation of the Woodford
Shale increased from immature in the central portion of Oklahoma (current depth of
burial less than 6000 feet) to advanced maturity in the Anadarko Basin (current depth of
burial greater than 14,000 feet) and Ouachita Mountains (Fig. 44).

85
Figure 45. Modified after Olson (1982), thermal maturity distribution of the Woodford Shale. Yellow area indicates author’s field area.

86
Chapter 6
Summary and Conclusions The current rise in oil prices has led many companies to consider unconventional
gas-shale plays. One such possibility that may prove economically viable is the
Woodford Shale of south-central Oklahoma. The Woodford Shale is an organic-rich
black shale that is upper Devonian- lower Mississippian in age. On well logs, the
Woodford has API gamma-ray readings of 150 and higher and is therefore classified as a
“hot” shale.
A detailed study of the Woodford Shale would result in a better conceptual
understanding of hydrocarbon source rocks and their role as possible unconventional gas-
shale plays. For instance, to evaluate this possibility, relationships between lithofacies
both in outcrop and the subsurface can be established relative to outcrop-based gamma-
ray profiles in correspondence with potassium (K %), uranium, (U ppm) and thorium (Th
ppm) along with subsurface gamma-ray logs.
This study was conducted to determine if a relationship exists between outcrop
lithofacies and gamma-ray response and if ultimately this relationship can be extended
into the subsurface. This data, along with data collected through the examination of five
outcrops, in conjunction with thin-section analyses, TOC and XRD data allows for the
potential to improve our ability to predict the properties of black shales and project them
into the subsurface.
On the basis of the above data, the following conclusions are drawn for the
Woodford Shale of south-central Oklahoma.

87
1. The bulk of the Woodford contains two main shale habits, fissile and non-
fissile. Lithofacies found in or associated with the non-fissile category are phosphatic
shale, siliceous shale, dolomite beds, phosphate nodules and rare occurrences of chert and
limestone. Siliceous shales are generally blocky and range from 1-10 cm in thickness.
The siliceous beds are found to be thicker and less common in the lower Woodford Shale
and thinner and more prevalent in the upper Woodford Shale. Siliceous shale is
commonly absent in the middle Woodford. Phosphate nodules and phosphatic shale is
found in the upper 20-40 feet (6-12 m) of Woodford. Some dolomite beds are found in
the lower and upper Woodford Shale. Dolomite beds are from 7-15 cm in thickness. A
12 cm thick limestone bed was found in the upper Woodford at the I-35 locations, but
was not found in any of the other studied outcrops. According to past conodont work,
this limestone is probably Mississippian (Kinderhookian) in age.
The fissile shale habits are composed of laminations that are <1cm thick and are
the most organic-rich of the Woodford Shales. The fissile shales are dominantly found in
the middle Woodford, but are also in the upper and lower Woodford. The fissile shales in
the upper and lower Woodford are interlaminated with siliceous shales on the 1-2 cm
scale. The association of siliceous and fissile shale is suggestive of local, lateral facies
changes on the sea floor.
2. The occurrence of pelagic organisms such as radiolarians and the organic-rich
carbonate environment supports a deep marine depositional setting for shaly limestones.
Dolomite beds are apparent in outcrop, but may be more abundant than previously noted.
The reason for this is because in some instances, dolomite in outcrop is internally black

88
and appears similar to siliceous shale. The dolomite does not readily react with acid in
the field, but is obvious in thin-section.
3. Thin-section analysis of the upper Woodford indicates that radiolarians are the
main source for silica in the Woodford. Radiolarian tests can be seen in thin sections cut
from siliceous shale samples.. Analysis of thin-sections of the upper Woodford also
indicates that the upper Woodford is composed of silty and phosphatic shales. Thin-
sections cut from phosphate nodules and surrounding shales suggests that radiolarians
provide the nuclei for phosphate development.
4. Thirty-eight samples analyzed for total organic carbon (TOC) from the upper
Woodford at I-35 have values that are about 0.8-17 wt%. The fissile shales have the
greatest weight percentage of TOC. Values for the fissile shale fall between 5-17 wt %.
The average TOC found within the I-35 outcrop is 10.5 wt% with a standard deviation of
4.4. In contrast to reports in the literature, the degree of TOC content could not be
determined by color alone. Some samples of Woodford Shale are dark to almost black in
color and would appear to be organic-rich, yet thin-section analysis reveals them to be
highly siliceous or even dolomitic in composition. These dark colored siliceous samples
yield TOC values as low as 0.83-3.5 wt%.
5. Thirty-eight samples analyzed using x-ray diffraction (XRD) from the upper
Woodford at I-35 reveals that the upper Woodford Shale is composed of 5-19% mixed
layered illite / smectite. Quartz constitutes between 40-76% of the samples. Jarosite
percentages lie within the 2-5% range with occasional trace amounts. The presence of
jarosite is the result of a pyrite-oxidizing environment (weathering). Na-plagioclase,
calcite and dolomite are also found as trace amounts within the collected samples.

89
6. The Woodford Shale falls into the uraniferous shale category (>20 ppm) with
uranium readings as high as 106 ppm. Uranium is the main constituent controlling
gamma-ray character. The amount of uranium in ppm along with its variation and
occurrence in the outcrop is well documented. The greatest occurrence of uranium occurs
in the lower Woodford and in the top of the middle Woodford. The lower Woodford
Shale is 60 feet (18 m) thick has uranium values from 19.8-66 ppm and an average
uranium content of 36.9 ppm. API units in the lower Woodford range from 198-602 API
with an average of 355. The middle Woodford Shale is 120 (36 m) thick with uranium
values that fall between 22.4-106 ppm and an average of 43.4 ppm. API units in the
middle Woodford range from 242-943 API with an average of 410. The upper Woodford
Shale is 60 feet (18 m) thick and is represented by uranium readings from 13.3-57 ppm
with an average of 39.2 ppm. API units in the upper Woodford range from 130-510 API
with an average of 355. The phosphate zone found in the upper 14 feet (4.2 m) of the
upper Woodford Shale contains uranium that ranges from 13.3-57 ppm with an average
of 36.3. API units in the phosphate zone are from 130-496 API with an average of 329.
7. The phosphate nodules found in the upper Woodford Shale represent an
interval in which the availability of uranium in the sea waters where phosphate
precipitation takes place was low. The uranium appears to have already been depleted by
chemically reducing waters associated with hydrogen sulfide precipitation. Consequently,
the phosphate nodules have little or no uranium.
8. The Woodford outcrop-based gamma-ray profiles can be correlated into the
subsurface. This correlation is based upon pattern recognition of the connected points

90
that compose a gamma-ray profile in comparison with the gamma-ray logs which are
continuous curves.
Future Work
The Woodford Shale has been and remains an extensively studied organic-rich
marine black shale. Despite this fact, there is still much more work that needs to be
completed in order to develop a conceptual understanding of this unit. This work could
be addressed by the following procedures: (1) Creation of detailed maps indicating
locations of the Woodford Shale outcrops in Oklahoma along with their thicknesses.
This will enhance future researchers in their search for outcrops to study. (2) Collect
gamma-ray measurements from additional outcrops along with a detailed lithofacies
description of the Woodford. This data can then be correlated and mapped into the
subsurface to determine the extent of thickness and the members of the Woodford Shale
on a more regional basis. (3) Collect samples for paleontology, TOC and XRD analysis.
In particular, samples should be collected every six inches from the Henryhouse Creek
location. The entire Woodford Shale is exposed at Henryhouse Creek, thus this data has
the potential to lead to a more accurate assessment of hydrocarbon potential. This could
also lead to information regarding depositional environments, time of deposition, and
environmental factors, such as climate. (4) Well and outcrop fracture characterization of
the Woodford Shale. Understanding the fracture patterns and their relationship to
lithofacies has the ability to aid in the gas recovery of horizontal wells.

91
References Adams, S. J. A., and Weaver, C. E. 1958. Thorium-to-Uranium Ratios as Indicators of
Sedimentary Processes: Examples of Concept of Geochemical Facies. Bulletin of the American Association of Petroleum Geologist, vol. 42, no. 2, pp. 387 – 430.
Amsden, T., 1975, Hunton Group (Late Ordovician, Silurian, and Early Devonian) in the
Anadarko basin of Oklahoma: Oklahoma Geological Survey Bulletin 121, 214 p. Amsden, T., and Klapper, G., 1972, Misener Sandstone (Middle-Upper Devonian), north-
central Oklahoma: AAPG Bulletin, v. 56, p. 2323-2334. Burke, K., 1977, Aulacogens and continental breakup: Annual Review of Earth and
Planetary Sciences, v. 5, p. 371-396 _______and J.F. Dewey, 1973, Plume-generated triple junctions: key indicators in
applying plate tectonics to old rocks: Journal of Geology, v. 81, p. 406-433. Cardott, B. J. 2001. Thermal Maturation of the Woodford Shale in Eastern Oklahoma.
Oklahoma Geological Survey Circular 106. Cardott, B. J., and Lambert, M. W. 1985. Thermal Maturation by Vitrinite Reflectance of
Woodford Shale, Anadarko Basin, Oklahoma. The American Association of Petroleum Geologists Bulletin, v. 69, no. 11, pp. 1982 –1998.
Champlin, S. C. 1959. A Stratigraphic Study of the Sycamore and Related Formations in
the Eastern Arbuckle Mountains. Unpublished Masters Thesis, University of Oklahoma, pp. 66.
Coffey, W.S., 2000. The Diagenetic History and Depositional System of the Sycamore
Formation (Mississippian), Carter-Knox Field, Grady and Stephens Counties, Oklahoma. Doctorate of Philosophy dissertation, 167 pp. Oklahoma State University, Stillwater, Oklahoma.
Cole, T. 1988. A Surface to Subsurface Study of the Sycamore Limestone
(Mississippian) Along the North Flank of the Arbuckle Anticline. Unpublished Masters Thesis, University of Oklahoma, pp. 99.
Conant, L., C., and V. E. Swanson, 1961, Chattanooga Shale and related rocks of central
Tennessee and nearby areas: U.S. Geological Survey Professional Paper 357, 91p. Comer, J. B., and Hinch, H. H. 1987. Recognizing and Quantifying Expulsion of Oil
from the Woodford Formation and Age-Equivalent Rocks in Oklahoma and Arkansas. The American Association of Petroleum Geologists Bulletin, v. 71, no. 7, pp. 844 –858.

92
Curtis, J. B. 2002. Fractures Shale-Gas Systems. American Association of Petroleum
Geologist Bulletin, vol. 86, no. 11, pp. 1921 – 1938. Davis, D. K., and Vessell, R. K. 2002. Gas Production from Shales. Gulf Coast
Association of Geological Societies Transactions, vol. 52, pp. 1079 – 1091. Dennis, L. F. N. 2004. The Woodford Shale in Portions of Logan County, Oklahoma:
Feasibility of Defining an Algorithm for Mapping and Exploration. Unpublished Masters Thesis, Oklahoma State University, pp. 73.
Denison, R.E., 1982, Geologic cross section from the Arbuckle Mountains to the
Muenster arch, southern Oklahoma and Texas: GSA Map and Chart Series MC-28R, 1 sheet, 8 p.
Devon Study, 2004: Proprietary Ettensohn, F. R., Fulton, L. P., and Kepferle, R. C. 1979. Use of Scintillometer and
Gamma-ray Logs for Correlation and Stratigraphy in Homogeneous Black Shales: Summary. Geological Society of America Bulletin, Part I, vol. 90, pp. 421 – 423.
Garner, D.L., and D.L. Turcotte, 1984, The thermal and mechanical evolution of the
Anadarko basin: Tectonophysics, v. 107, p. 1-24 Gromadzki, G. A., 2004. Outcrop-Based Gamma-Ray Characterization of Arsenic-
Bearing Lithofacies in the Garber-Wellington Formation, Cetral Oklahoma Aquifer (COA), Cleveland County, Oklahoma. Unpublished Masters Thesis, Oklahoma State University, pp. 232.
Ham, W.E., and J.L. Wilson, 1967, Paleozoic epeirogeny in the central United States:
American Journal of Science, v. 265, no. 5, p. 332-407 Herron, S.L., and M.L. Herron, 1996 Quantitative Lithology: An Application for Open
and Cased Hole Spectroscopy: Transactions of the SPWLA thirty-seventh annual Logging Symposium, New Orleans, LA, June 16-19, 1996. Paper E.
Hester, T., Sahl, H., and Schmoker, J., 1988, Cross sections based on gamma-ray,
density, and resistivity logs showing stratigraphic units of the Woodford Shale, Anadarko basin, Oklahoma: United States Geological Survey Miscellaneous Field Studies Map 2054, 2 plates.
Hilpman, P., 1967, Devonian Stratigraphy in Kansas: a progress report: Tulsa Geological
Society Digest, v. 35, p. 88-98 Hoffman, P., J. F. Dewey, and K. Burke, 1974, Aulacogens and their genetic relation to
geosynclines, with a Proterozoic example from Great Slave Lake, Canada, in

93
Modern, U.S.A., in Aspects of diagenesis: SEPM Special Publication 19, p. 38-55.
Jarvie, D., 2004 Evaluation of Hydrocarbon Generation and Storage in the Barnett Shale,
Ft. Worth Basin, Texas. Humble Geochemical Website www.humble-inc.com/ Johnson, G. J., Klapper, G., and Sandberg, A. C., 1985. Devonian Eustatic Fluctuations
in Euramerica. Geological Society of America Bulletin, v. 96, pp. 567 – 587. Johnson, K., 1989, Geologic evolution of the Anadarko basin, in K. Johnson, ed.,
Anadarko basin symposium, 1988: Oklahoma Geological Survey Circular 90, p. 3-12.
Jolly, G. D. 1988. Correlation of the Woodford Formation in South-Central Oklahoma
Using Gamma-ray Scintillation Measurements of the Natural Background Radiation. Unpublished Masters Thesis, Stephen F. Austin State University, pp. 154.
Kennedy, M. J., Pevear, D. R., and Hill, R. J. 2002. Mineral Surface Control of Organic
Carbon in Black Shale. Science, v. 295, pp. 657 – 660. Kirkland, W. D., Denison, E. R., Summers, M. D and Gormly, R. J. 1992. Geology and
Organic Geochemistry of the Woodford Shale in the Criner Hills and Western Arbuckle Mountains, Oklahoma. Oklahoma Geological Survey Circular 93, pp. 38 – 69.
Lambert, M., 1993. Internal Stratigraphy and Organic Facies of the Devonian-
Mississippian Chattanooga (Woodford) Shale in Oklahoma and Kansas. AAPG Studies in Geology, v. 37, pp 163-176.
Lee, W., 1956, Stratigraphy and structural development of the Salina basin area: Kansas
Geological Survey Bulletin 121, 167 p. Newell, K., 1989, Salina basin: distribution of the Upper Devonian-Lower Mississippian
Misener Sandstone (superimposed on sub-Chattanooga subcrop map): Kansas Geological Survey Open File Report 89-18, 1 plate.
Olson, R.K., 1982, Factors Controlling Uranium Distribution in Upper Devonian-Lower
Mississippian Black Shales of Oklahoma and Arkansas, Doctoral, University of Tulsa, Tulsa, Oklahoma, 224 p.
Over, J. D. 1992. Conodonts and the Devonian-Carboniferous Boundary in the Upper
Woodford Shale, Arbuckle Mountains, South-Central Oklahoma. Journal of Paleontology, v. 66, no. 2, pp. 293 –311.

94
Over, J. D., and Barrick, J. E. 1990. The Devonian / Carboniferous Boundary in the
Woodford Shale, Lawrence Uplift, South-Central Oklahoma. Oklahoma Geological Survey Guidebook, pp. 63 – 73.
Raymond, Loren. A., 2002. Petrology: The Study of Igneous, Sedimentary and
Metamorphic Rocks. 2nd Edition. New York, New York. McGraw Hill., 720pp. Rottmann, K., 2000. Defining the role of Woodford-Hunton depositional relationships in
Hunton stratigraphic traps of western Oklahoma, in Johnson, K. S. (ed.), Platform carbonates in the southern Midcontinent, 1996 symposium: Oklahoma Geological Survey Circular 101, p. 139-146.
Schieber, J. 2001. A Role for Organic Petrology in Integrated Studies of Mudrocks:
Examples from Devonian Black Shales of the Eastern US. International Journal of Coal Geology, v. 47, issues 3-4, pp. 171 – 187.
Siy, S. E. 1988. Geochemical and Petrographic Study of Phosphate Nodules of the
Woodford Shale (Upper Devonian – Lower Mississippian) of Southern Oklahoma. Unpublished Masters Thesis, Texas Tech University, pp. 170.
Sloss, L., 1963, Sequencesin the cratonic interior of North America: Geological Society
of America Bulletin, v. 74, p. 93-114. Spears, D. A. 1980. Towards a Classification of Shales. The Geological Society of
London, vol. 137, pp. 125 – 129. Sullivan, K., 1985, Organic facies variation of the Woodford Shale in western Oklahoma:
Shale Shaker, v. 35, p. 76-89. Swanson, V. E. 1961. Geology and Geochemistry of Uranium in Marine Black Shales.
Geological Survey Professional Paper 356-C. Swanson, V.E. and E.R. Landis, 1962, Geology of a uranium-bearing black shale of late
Devonian age in north-central Arkansas: Arkansas Geol. And Conservation Comm. Inform. Circ. No. 22.
Tourtelot, H. A. 1979 Black Shale – Its Deposition and Diagenesis. Clays and Clay
Minerals, vol. 27, no. 5, pp. 313 – 321. U.S. Department of Energy, Morgantown Energy Technology Center, 1981, Evaluation
of Devonian shale potential in (New York: DOE/METC-118) (Pennsylvania: DOE/METC-119) (West Virginia: DOE/METC-120, available from NTIS) (Eastern Kentucky/Tennessee: DOE/METC-121) (Ohio: DOE/METC-124): prepared for publication by Tetra Tech, Columbus, Ohio.

95
Woodrow, D., Fletcher, F., and Ahrnsbrak, W., 1973, Paleogeography and paleoclimate at the deposition sites of the Devonian Catskill and Old Red Sandstone Facies: Geological Society of America Bulletin, v. 84, p. 3051-3064.

96
APPENDIX A
Outcrop-Based Gamma-Ray Data

97
McAlester Cemetery Shale Pit
U (ppm) TH(ppm)
K (%) API
API (+) API(-)
DEPTH (in)
40.8 5.8 1.0 365.60 455.00 276.20 1870 30.5 6.8 1.3 292.00 362.40 221.60 1824 39.0 7.9 1.4 366.00 454.70 277.30 1805 36.1 5.9 1.5 336.40 417.50 255.30 1769 41.2 6.4 1.5 379.20 471.00 287.40 1757 37.7 7.1 1.8 358.80 444.90 272.70 1745 41.5 5.5 1.9 384.40 476.70 292.10 1738 35.8 7.8 1.4 340.00 422.20 257.80 1702 33.2 6.5 1.5 315.60 391.50 239.70 1690 34.8 6.3 0.8 316.40 393.90 238.90 1678 38.4 6.1 0.8 344.40 428.90 259.90 1666 39.2 10.7 1.3 377.20 468.90 285.50 1654 39.8 5.8 1.5 365.60 454.00 277.20 1610 36.7 6.3 1.8 347.60 430.90 264.30 1577 38.7 5.5 1.7 358.80 445.10 272.50 1551 38.3 6.9 1.4 356.40 442.70 270.10 1524 36.5 4.2 1.7 336.00 416.60 255.40 1506 33.9 4.7 1.9 320.40 396.70 244.10 1452 29.3 5.4 1.8 284.80 352.40 217.20 1428 29.1 5.0 1.4 275.20 341.20 209.20 1188 35.0 5.5 1.1 319.60 397.30 241.90 1166 35.7 4.4 1.6 328.80 407.80 249.80 1151 30.5 6.3 1.9 299.60 370.70 228.50 1124 35.2 7.3 1.3 331.60 411.90 251.30 1112 38.2 6.6 1.3 352.80 438.40 267.20 1078 33.4 5.1 1.6 313.20 388.30 238.10 1057 32.9 4.7 1.2 301.20 374.10 228.30 1016 30.7 6.0 1.4 292.00 362.20 221.80 992 33.2 7.0 1.1 311.20 386.80 235.60 950 33.2 4.6 1.5 308.00 382.00 234.00 936 31.1 7.5 1.5 302.80 375.50 230.10 920 35.8 7.9 1.6 343.60 426.30 260.90 890 38.3 7.2 1.5 359.20 446.00 272.40 874 36.8 8.4 1.4 350.40 435.20 265.60 848 37.4 7.5 0.9 343.60 427.70 259.50 839 31.3 5.6 1.6 298.40 369.80 227.00 824 38.1 4.3 1.2 341.20 424.10 258.30 803 36.8 5.2 1.1 332.80 413.80 251.80 761 36.8 4.2 1.6 336.80 417.80 255.80 740 35.2 6.2 0.8 319.20 397.40 241.00 713 28.4 5.2 1.2 267.20 331.60 202.80 668 31.8 5.5 1.1 294.00 365.30 222.70 638 29.2 4.1 1.0 266.00 330.50 201.50 620 26.6 3.5 0.8 239.60 297.90 181.30 584 29.2 5.0 1.1 271.20 336.80 205.60 540

98
McAlester Cemetery Shale Pit Continued
U (ppm) TH(ppm)
K (%) API
API (+) API(-)
DEPTH (in)
40.5 5.4 1.6 371.20 460.80 281.60 516 34.3 7.4 1.7 331.20 410.60 251.80 492 33.1 4.8 1.1 301.60 374.80 228.40 471 28.6 6.1 1.4 275.60 341.70 209.50 454 45.0 5.1 1.3 401.20 498.90 303.50 437 32.8 7.7 1.6 318.80 395.30 242.30 420 31.6 5.3 0.6 283.60 353.30 213.90 396 29.2 4.2 0.9 264.80 329.20 200.40 384 23.5 3.0 0.4 206.40 257.20 155.60 372 24.8 3.8 0.6 223.20 277.80 168.60 360 27.1 5.6 0.9 253.60 315.20 192.00 348 21.9 4.6 0.9 208.00 258.20 157.80 336 21.2 4.6 0.8 200.80 249.40 152.20 324 21.7 3.2 0.5 194.40 242.00 146.80 312 21.5 2.7 0.6 192.40 239.30 145.50 282 24.6 4.0 0.7 224.00 278.60 169.40 264 29.2 6.0 0.9 272.00 338.20 205.80 192 28.6 4.2 0.6 255.20 317.80 192.60 180 34.0 4.3 0.9 303.60 377.70 229.50 127 32.3 6.7 1.1 302.80 376.30 229.30 96 28.0 5.2 0.5 252.80 315.00 190.60 82 30.2 4.9 0.7 272.40 339.10 205.70 48 23.1 8.1 1.2 236.40 293.10 179.70 16

99
I-35
U (ppm) TH(ppm)
K (%) API
API (+) API(-)
DEPTH (in)
17.3 3.5 0.5 160.40 199.50 121.30 820 20.0 3.5 0.8 186.80 231.90 141.70 814
6.9 2.4 0.9 79.20 97.20 61.20 808.5 18.7 4.2 0.5 174.40 217.00 131.80 804.5 17.9 3.9 0.6 168.40 209.30 127.50 793 16.3 5.2 0.7 162.40 201.60 123.20 785.5 14.9 4.6 0.6 147.20 182.80 111.60 782 12.5 4.1 0.9 130.80 161.70 99.90 765 16.5 4.1 0.7 159.60 198.10 121.10 745 23.6 4.9 0.5 216.40 269.50 163.30 720 23.6 4.2 0.5 213.60 266.00 161.20 713 29.7 3.3 0.9 265.20 329.70 200.70 684 26.8 4.6 0.8 245.60 305.40 185.80 672 34.8 5.5 0.1 302.00 377.30 226.70 660 40.6 5.5 0.8 359.60 447.90 271.30 649 44.1 5.7 0.3 380.40 474.90 285.90 632 37.3 6.2 1.3 344.00 427.40 260.60 625 40.1 7.4 0.9 364.80 454.20 275.40 618 34.9 4.5 0.4 303.60 378.70 228.50 615 34.9 4.9 0.8 311.60 387.90 235.30 608.5 36.1 3.7 0.7 314.80 392.10 237.50 604.5 34.4 5.7 0.9 312.40 388.70 236.10 590 36.2 4.4 1.2 326.40 405.60 247.20 583 36.3 5.6 0.8 325.60 405.40 245.80 570 37.9 4.7 1.3 342.80 425.90 259.70 559 36.8 4.3 1.0 327.60 407.50 247.70 554 33.2 6.9 1.3 314.00 389.90 238.10 542.5 32.0 5.3 1.0 293.20 364.50 221.90 531 36.6 5.4 1.1 332.00 412.80 251.20 528 36.8 4.1 1.1 328.40 408.30 248.50 508 33.0 6.9 1.6 317.20 393.30 241.10 478 35.0 5.4 1.0 317.60 395.00 240.20 447 27.7 4.9 1.1 258.80 321.30 196.30 441 30.0 6.0 0.9 278.40 346.20 210.60 378 23.1 5.0 1.0 220.80 274.00 167.60 352 25.3 5.4 1.0 240.00 298.00 182.00 343 38.4 6.5 1.0 349.20 434.50 263.90 328 36.7 7.7 0.8 337.20 419.90 254.50 303 37.2 6.6 0.8 336.80 419.40 254.20 272 36.0 4.9 1.4 330.00 409.70 250.30 266 29.6 5.0 1.4 279.20 346.20 212.20 255 30.9 4.9 1.3 287.60 356.90 218.30 248 33.7 6.2 1.0 310.40 386.00 234.80 241.5 34.1 6.0 1.1 314.40 390.80 238.00 229 34.6 4.5 0.8 307.60 382.90 232.30 225.5

100
I-35 Continued
U (ppm) TH(ppm)
K (%) API
API (+) API(-)
DEPTH (in)
33.6 4.9 1.2 307.60 382.10 233.10 220 37.1 4.7 1.3 336.40 417.90 254.90 216 37.4 4.5 1.4 339.60 421.70 257.50 212.5 40.9 4.9 0.6 356.40 444.30 268.50 211.5 38.1 6.5 1.2 350.00 435.10 264.90 207 41.0 6.1 1.4 374.80 465.70 283.90 204 42.4 5.2 1.1 377.60 469.80 285.40 193.5 43.1 7.9 1.2 395.60 492.10 299.10 186 45.5 7.5 1.4 416.40 517.70 315.10 180 57.4 10.7 1.8 530.80 659.90 401.70 168 55.5 8.4 1.0 493.60 615.00 372.20 157.5 35.9 7.0 1.4 337.60 419.20 256.00 27.5 35.5 7.5 1.6 339.60 421.30 257.90 22.5 37.4 7.6 1.7 356.80 442.60 271.00 18 40.7 7.9 1.8 386.00 478.90 293.10 13.5 41.2 8.1 1.6 387.60 481.30 293.90 8.5 42.8 8.7 2.0 409.20 507.50 310.90 4

101
Hunton Quarry
U (ppm) TH(ppm)
K (%) API
API (+) API(-)
DEPTH (in)
37.7 6.1 1.1 343.60 427.30 259.90 1163 37.0 4.6 1.2 333.60 414.60 252.60 1155 44.4 4.4 1.1 390.40 485.80 295.00 1137 43.6 5.0 0.9 383.20 477.20 289.20 1126 49.5 8.3 1.7 456.40 567.10 345.70 1112 51.8 7.5 1.6 470.00 584.30 355.70 1100 49.7 8.6 1.6 457.60 568.80 346.40 1084 46.0 8.6 1.8 431.20 535.40 327.00 1072 44.0 7.2 1.6 406.40 504.80 308.00 1058 48.0 7.4 2.1 447.20 554.80 339.60 1041 53.5 6.2 1.8 481.60 598.40 364.80 1028 34.3 5.0 1.1 312.00 387.80 236.20 1024 32.7 4.2 0.8 291.20 362.40 220.00 1020 31.3 3.1 0.8 275.60 342.90 208.30 920 30.0 4.0 0.7 267.20 332.60 201.80 907 50.8 5.7 0.9 443.60 552.70 334.50 840 46.3 4.4 0.9 402.40 501.20 303.60 821 45.7 5.6 0.6 397.60 495.80 299.40 812 42.9 4.6 1.0 377.60 470.00 285.20 806 41.4 7.5 1.0 377.20 469.50 284.90 773 41.8 6.3 0.9 374.00 465.70 282.30 760 44.7 4.4 0.8 388.00 483.40 292.60 747 40.6 3.5 0.5 346.80 432.50 261.10 721 42.5 5.3 1.2 380.40 473.10 287.70 695 35.0 4.5 0.9 312.40 388.70 236.10 671 32.3 4.5 1.0 292.40 363.50 221.30 663 34.6 5.8 1.2 319.20 396.60 241.80 647 39.0 3.8 0.4 333.60 416.20 251.00 579 36.0 6.1 1.3 333.20 413.90 252.50 566 40.7 6.0 0.9 364.00 453.20 274.80 539 51.5 6.4 1.0 453.60 565.00 342.20 512 49.6 7.0 0.8 437.60 545.40 329.80 494 46.0 4.6 1.1 404.00 502.80 305.20 476 35.4 5.9 1.2 326.00 405.10 246.90 437 37.5 6.3 0.7 336.40 419.10 253.70 425 44.7 5.7 1.3 401.20 498.90 303.50 380 40.3 7.5 1.5 376.40 467.50 285.30 360 45.7 7.3 0.9 409.20 509.70 308.70 350 43.7 4.9 0.8 382.00 475.90 288.10 349 39.5 5.7 1.1 356.40 443.30 269.50 343 38.0 5.2 1.4 347.20 431.20 263.20 331 37.2 5.5 1.1 337.20 419.30 255.10 318 28.2 6.3 0.8 263.60 327.90 199.30 282 28.3 5.5 0.9 262.80 326.70 198.90 268 33.7 5.5 1.7 318.80 395.10 242.50 247

102
Hunton Quarry Continued
U (ppm) TH(ppm)
K (%) API
API (+) API(-)
DEPTH (in)
35.9 7.4 1.5 340.80 423.00 258.60 232 45.6 6.7 1.5 415.60 516.50 314.70 217 42.0 5.4 1.3 378.40 470.40 286.40 213 42.6 5.4 1.9 392.80 487.20 298.40 186 38.9 7.8 1.4 364.80 453.20 276.40 174 43.0 7.5 1.7 401.20 498.10 304.30 121 48.6 7.4 2.1 452.00 560.80 343.20 120 63.2 11.5 2.2 586.80 729.10 444.50 111 50.6 10.4 1.7 473.60 588.60 358.60 103 51.0 11.2 2.8 497.60 616.40 378.80 98 53.7 10.1 2.2 505.20 627.10 383.30 91 46.0 8.8 2.8 448.00 554.40 341.60 84 40.5 10.7 2.8 411.60 508.90 314.30 73 40.9 10.4 2.0 400.80 497.00 304.60 63 35.8 9.9 2.2 361.20 447.10 275.30 50 36.0 10.6 2.5 370.40 458.00 282.80 42 36.7 7.9 1.9 355.60 440.70 270.50 16 45.6 7.4 2.4 432.80 536.20 329.40 0

103
Brimley Residence
U (ppm) TH(ppm)
K (%) API
API (+) API(-)
DEPTH (in)
11.8 7.8 1.9 156.00 191.20 120.80 183 15.0 5.5 1.6 167.60 206.30 128.90 168 14.2 7.6 1.6 169.60 208.80 130.40 158 14.1 5.9 2.1 170.00 208.30 131.70 139 18.4 7.5 2.1 210.80 259.30 162.30 125 19.5 6.5 1.9 212.40 261.70 163.10 120 21.5 4.7 2.1 224.40 276.30 172.50 111 25.0 5.8 1.5 247.20 306.00 188.40 91 26.9 5.9 1.4 261.20 323.70 198.70 74 29.3 8.4 1.9 298.40 369.20 227.60 61 28.1 6.3 1.9 280.40 346.70 214.10 48 31.8 5.5 1.5 300.40 372.50 228.30 41 30.0 5.9 1.5 287.60 356.50 218.70 36 32.0 5.3 1.7 304.40 377.10 231.70 28 35.3 6.6 1.2 328.00 407.60 248.40 23 35.0 3.9 1.3 316.40 392.90 239.90 21 34.4 8.0 1.1 324.80 403.80 245.80 0

104
Henryhouse Creek
U (ppm) TH(ppm)
K (%) API
API (+) API(-)
DEPTH (in)
31.8 2.8 0.9 280.00 348.20 211.80 2709 29.8 4.5 0.8 269.20 334.90 203.50 2703 27.4 3.7 1.1 251.60 312.30 190.90 2697 28.0 3.1 0.7 247.60 308.10 187.10 2691 26.5 3.1 0.8 237.20 294.90 179.50 2685 26.1 3.7 0.6 233.20 290.30 176.10 2679 27.4 3.0 0.7 242.40 301.60 183.20 2673 29.8 4.1 0.5 262.80 327.50 198.10 2667 22.6 3.7 0.5 203.60 253.50 153.70 2661 22.0 5.0 0.8 208.80 259.40 158.20 2655 19.9 2.8 0.7 181.60 225.60 137.60 2649 15.9 3.7 0.9 156.40 193.70 119.10 2643 17.1 4.3 0.6 163.60 203.30 123.90 2637 13.3 3.2 0.7 130.40 161.60 99.20 2631 34.2 4.6 1.0 308.00 383.00 233.00 2625 39.6 7.4 1.3 367.20 456.40 278.00 2618 45.8 4.5 1.0 400.40 498.50 302.30 2612 49.4 7.5 0.9 439.60 547.70 331.50 2606 43.5 7.0 1.1 393.60 489.80 297.40 2600 43.8 6.2 1.2 394.40 490.60 298.20 2594 42.8 6.1 1.3 387.60 481.90 293.30 2588 47.6 6.5 1.6 432.40 537.30 327.50 2582 49.2 6.5 1.4 442.00 549.70 334.30 2576 50.2 6.4 1.0 443.20 552.00 334.40 2570 54.6 5.1 1.5 481.20 598.50 363.90 2564 57.0 6.5 0.9 496.40 618.70 374.10 2558 52.8 7.1 1.6 476.40 592.30 360.50 2552 52.4 8.3 1.1 470.00 585.30 354.70 2546 51.8 5.9 1.7 465.20 578.10 352.30 2540 44.5 6.0 1.7 407.20 505.60 308.80 2537 42.1 6.6 1.5 387.20 481.00 293.40 2529 43.6 4.6 1.8 396.00 491.40 300.60 2523 40.0 7.0 1.5 372.00 462.00 282.00 2517 45.0 7.2 1.2 408.00 507.60 308.40 2511 45.3 5.3 1.3 404.40 502.90 305.90 2505 44.2 7.2 1.3 403.20 501.40 305.00 2499 41.5 5.5 1.2 373.20 464.10 282.30 2493 45.4 5.3 1.0 400.40 498.50 302.30 2487 45.3 6.9 1.8 418.80 519.90 317.70 2481 46.7 5.9 1.3 418.00 519.90 316.10 2475 46.7 6.8 1.7 428.00 531.60 324.40 2467 38.9 5.0 0.9 345.60 430.20 261.00 2464 36.1 5.8 1.3 332.80 413.40 252.20 2455 38.2 5.7 1.5 352.40 437.50 267.30 2448 38.2 5.9 1.1 346.80 431.30 262.30 2442

105
Henryhouse Creek Continued
U (ppm) TH(ppm)
K (%) API API (+) API(-)
DEPTH (in)
38.2 5.9 1.1 346.80 431.30 262.30 2442 38.7 7.7 1.3 361.20 448.90 273.50 2436 42.9 6.1 1.4 390.00 484.70 295.30 2433 31.3 5.3 1.0 287.60 357.50 217.70 2392 31.9 6.6 0.8 294.40 366.40 222.40 2380 30.4 4.8 1.2 281.60 349.60 213.60 2374 26.2 5.1 1.2 249.20 309.10 189.30 2362 24.7 5.7 1.0 236.40 293.50 179.30 2350 32.7 5.6 1.1 301.60 374.80 228.40 2338 36.3 6.9 1.3 338.80 420.90 256.70 2329 35.0 5.9 1.3 324.40 402.90 245.90 2317 41.7 7.1 1.3 382.80 475.90 289.70 2305 37.3 6.5 1.4 346.80 430.70 262.90 2293 39.9 5.7 1.4 364.40 452.70 276.10 2281 46.2 6.7 1.4 418.80 520.70 316.90 2275 43.9 7.7 1.8 410.80 509.90 311.70 2263 44.5 2.8 1.8 396.00 491.40 300.60 2251 41.5 5.6 1.3 375.20 466.40 284.00 2248 38.3 4.5 1.7 351.60 436.10 267.10 2236 44.9 7.6 1.1 407.20 506.80 307.60 2224 50.0 4.4 1.3 438.40 545.40 331.40 2212 57.5 7.0 1.4 510.40 635.20 385.60 2200 48.6 5.1 1.2 428.40 533.10 323.70 2188 46.9 5.7 1.1 415.60 517.30 313.90 2176 45.1 6.0 1.5 408.80 508.00 309.60 2164 40.6 5.5 1.6 372.40 462.30 282.50 2152 42.0 5.4 1.1 375.20 466.80 283.60 2140 36.8 4.6 1.3 333.60 414.40 252.80 2137 44.1 5.5 1.8 403.60 500.90 306.30 2125 50.1 7.6 2.1 464.80 576.80 352.80 2113 40.4 6.4 1.7 376.00 466.60 285.40 2101 42.1 5.8 1.0 376.00 468.00 284.00 2089 39.8 6.4 1.3 364.80 453.40 276.20 2083 38.5 5.1 1.1 346.00 430.30 261.70 2077 43.9 5.0 1.1 388.80 483.80 293.80 2065 87.2 8.1 1.8 758.80 944.90 572.70 2053 102.5 12.2 2.3 905.60 1127.40 683.80 2041 100.2 7.7 1.1 850.00 1060.30 639.70 2038 106.3 8.3 3.1 933.20 1160.30 706.10 2026 77.0 7.2 2.0 676.80 842.00 511.60 2014 77.3 7.9 2.2 685.20 852.10 518.30 2002 80.9 10.0 1.8 716.00 891.40 540.60 1990 103.5 12.0 2.5 916.00 1140.00 692.00 1981 105.9 12.1 3.0 943.60 1173.50 713.70 1969

106
Henryhouse Creek Continued
U
(ppm) TH(ppm) K
(%) API API (+) API(-) DEPTH
(in) 86.9 10.7 3.3 790.80 981.90 599.70 1957 82.5 11.4 2.9 752.00 934.20 569.80 1945 93.5 10.9 1.9 822.00 1023.70 620.30 1942 81.8 11.1 2.9 745.20 925.70 564.70 1918 72.7 9.1 2.5 658.00 817.50 498.50 1906 65.9 8.8 2.3 599.20 744.40 454.00 1894 62.9 11.4 2.3 585.60 727.40 443.80 1882 65.5 12.3 2.1 606.80 754.30 459.30 1870 47.7 9.0 1.8 446.40 554.40 338.40 1858 40.9 8.8 2.3 399.20 494.40 304.00 1851 46.1 11.5 2.6 456.40 565.30 347.50 1839 38.0 6.7 2.4 369.20 456.70 281.70 1827 44.5 8.3 2.0 421.20 522.50 319.90 1815 43.7 9.7 1.9 418.80 519.70 317.90 1803 41.6 8.8 2.0 400.00 496.00 304.00 1791 36.2 6.3 2.5 354.80 438.50 271.10 1779 41.6 8.8 2.3 404.80 501.40 308.20 1767 42.9 7.9 2.3 411.60 509.90 313.30 1755 39.6 8.4 2.5 390.40 483.00 297.80 1743 42.4 9.0 2.4 413.60 512.20 315.00 1731 45.4 6.1 2.3 424.40 525.90 322.90 1719 36.2 10.0 2.4 368.00 455.20 280.80 1707 39.6 7.1 2.4 383.60 474.70 292.50 1695 37.8 7.1 2.3 367.60 454.90 280.30 1683 39.6 8.4 2.2 385.60 477.60 293.60 1671 41.6 8.7 2.4 406.00 502.70 309.30 1659 41.7 8.1 2.5 406.00 502.50 309.50 1647 35.1 7.2 2.3 346.40 428.40 264.40 1635 35.0 8.5 2.0 346.00 428.50 263.50 1623 35.6 7.9 1.7 343.60 426.10 261.10 1611 33.2 8.8 1.8 329.60 408.40 250.80 1599 32.3 7.2 2.4 325.60 402.20 249.00 1587 42.1 7.6 1.7 394.40 489.60 299.20 1575 42.8 5.8 1.6 391.20 485.80 296.60 1563 37.1 5.5 1.9 349.20 432.70 265.70 1551 37.9 6.3 2.3 365.20 451.90 278.50 1539 42.2 7.4 1.8 396.00 491.40 300.60 1527 38.5 8.6 2.2 377.60 467.60 287.60 1515 36.7 6.3 1.7 346.00 429.10 262.90 1503 32.3 9.1 2.1 328.40 406.30 250.50 1491 32.7 5.1 2.3 318.80 393.90 243.70 1479 34.7 7.5 2.2 342.80 424.10 261.50 1467

107
Henryhouse Creek Continued
42.3 8.5 2.8 417.20 515.90 318.50 1386 37.8 7.9 2.2 369.20 457.10 281.30 1374 48.3 10.1 2.3 463.60 574.90 352.30 1362 46.6 9.5 2.2 446.00 553.10 338.90 1350 45.6 8.3 2.6 439.60 544.30 334.90 1338 46.4 11.1 2.5 455.60 564.50 346.70 1326 35.9 8.7 2.6 363.60 449.30 277.90 1323 37.7 7.4 1.7 358.40 444.60 272.20 1311 39.6 8.1 2.1 382.80 474.30 291.30 1299 35.9 11.2 2.4 370.40 458.20 282.60 1287 36.0 9.4 2.6 367.20 453.80 280.60 1275 36.2 7.9 2.1 354.80 439.30 270.30 1263 35.0 8.3 2.4 351.60 434.70 268.50 1251 34.8 7.1 2.3 343.60 424.90 262.30 1239 35.6 9.2 2.0 353.60 438.00 269.20 1233 35.2 8.3 2.5 354.80 438.50 271.10 1227 41.1 12.3 2.9 424.40 524.70 324.10 1224 40.0 7.5 2.5 390.00 482.50 297.50 1212 38.7 8.6 3.0 392.00 484.00 300.00 1206 35.3 7.9 1.9 344.40 426.70 262.10 1203 34.8 8.1 2.0 342.80 424.50 261.10 1201 31.4 6.6 2.2 312.80 386.60 239.00 1189 31.7 8.3 2.2 322.00 398.10 245.90 1177 22.4 9.3 1.9 246.80 304.70 188.90 1174 28.5 7.9 2.4 298.00 367.70 228.30 1168 31.0 7.6 2.2 313.60 387.60 239.60 1162 31.9 6.7 1.9 312.40 386.70 238.10 1156 27.9 7.6 1.9 284.00 351.20 216.80 1152 33.3 9.2 2.2 338.40 418.60 258.20 1140 32.4 7.8 1.7 317.60 393.60 241.60 1134 22.4 7.9 2.0 242.80 299.50 186.10 1126 26.8 10.6 2.1 290.40 358.80 222.00 1122 27.7 10.1 2.2 297.20 367.10 227.30 1110 30.2 7.5 2.2 306.80 379.10 234.50 1098 32.4 5.1 1.8 308.40 381.90 234.90 1086 36.9 9.6 2.1 367.20 454.80 279.60 1080 26.6 7.6 1.6 268.80 332.80 204.80 1074 30.7 4.5 1.3 284.40 352.90 215.90 1068 27.0 4.8 1.7 262.40 324.60 200.20 1062 27.8 5.2 1.5 267.20 331.00 203.40 1056 29.6 5.6 1.8 288.00 356.40 219.60 1050 28.5 8.3 1.9 291.60 360.70 222.50 1044 33.8 5.7 1.7 320.40 397.10 243.70 1038 32.0 8.4 1.7 316.80 392.60 241.00 1032 33.6 5.4 1.8 319.20 395.40 243.00 1026 33.7 5.5 1.9 322.00 398.70 245.30 1020

108
Henryhouse Creek Continued
38.2 8.0 1.8 366.40 454.40 278.40 1014 39.8 8.1 1.9 381.20 472.70 289.70 1008 41.0 6.3 1.9 383.60 475.70 291.50 1005 50.9 8.5 1.8 470.00 583.90 356.10 999 45.8 8.6 1.8 429.60 533.40 325.80 993 38.9 7.4 1.8 369.60 458.40 280.80 987 38.5 6.6 1.6 360.00 446.80 273.20 981 33.9 7.2 1.5 324.00 402.00 246.00 975 33.3 6.9 1.8 322.80 399.90 245.70 969 36.2 6.3 1.3 335.60 416.90 254.30 963 38.0 5.5 1.3 346.80 430.90 262.70 957 37.0 5.9 1.7 346.80 430.10 263.50 954 36.1 8.6 1.8 352.00 436.40 267.60 948 36.5 6.5 2.0 350.00 433.50 266.50 942 41.0 7.7 1.9 389.20 482.70 295.70 936 40.2 9.0 1.7 384.80 477.60 292.00 930 40.9 7.8 1.5 382.40 475.00 289.80 924 41.3 6.8 1.8 386.40 479.40 293.40 918 43.8 6.0 1.6 400.00 496.80 303.20 912 36.7 7.8 1.6 350.40 434.80 266.00 906 43.3 7.5 1.5 400.40 497.50 303.30 900 38.4 7.6 2.5 377.60 467.00 288.20 894 39.2 8.3 2.3 383.60 474.90 292.30 888 40.1 8.8 2.1 389.60 482.80 296.40 882 44.6 7.5 2.4 425.20 526.70 323.70 876 49.2 7.8 2.1 458.40 568.80 348.00 870 48.8 8.0 2.0 454.40 564.00 344.80 864 43.2 10.2 1.7 413.60 513.60 313.60 858 42.1 5.8 1.5 384.00 477.00 291.00 852 40.4 8.4 1.7 384.00 476.60 291.40 846 36.4 9.9 1.7 358.00 444.10 271.90 843 38.3 8.3 1.7 366.80 455.10 278.50 837 44.5 7.0 1.6 409.60 508.80 310.40 831 47.0 8.4 1.7 436.80 542.60 331.00 825 50.6 9.0 1.9 471.20 585.20 357.20 819 47.2 5.8 1.7 428.00 531.60 324.40 813 37.2 6.4 2.0 355.20 440.00 270.40 807 45.1 6.4 1.1 404.00 502.80 305.20 806 42.9 5.3 0.9 378.80 471.70 285.90 800 40.9 6.6 1.3 374.40 465.40 283.40 794 43.9 8.2 1.4 406.40 505.20 307.60 788 48.2 10.3 1.5 450.80 560.50 341.10 782 44.5 8.1 1.6 414.00 514.30 313.70 776 42.3 10.3 1.8 408.40 506.90 309.90 770 38.8 6.8 1.5 361.60 449.00 274.20 764 41.0 5.2 1.6 374.40 464.80 284.00 758

109
Henryhouse Creek Continued
U (ppm) TH(ppm)
K (%) API
API (+) API(-)
DEPTH (in)
41.4 5.1 1.1 369.20 459.30 279.10 752 35.2 6.5 0.9 322.00 400.70 243.30 746 37.4 7.5 1.6 354.80 440.30 269.30 740 39.0 8.4 1.8 374.40 464.40 284.40 734 31.5 9.3 1.7 316.40 392.10 240.70 722 34.9 8.8 1.8 343.20 425.40 261.00 710 39.6 8.5 2.2 386.00 478.10 293.90 698 34.5 8.8 1.9 341.60 423.20 260.00 686 40.0 7.7 2.2 386.00 478.10 293.90 674 47.5 11.7 2.9 473.20 585.70 360.70 662 47.5 7.0 1.3 428.80 533.40 324.20 650 32.6 6.0 1.6 310.40 384.80 236.00 638 29.1 7.6 1.5 287.20 356.00 218.40 626 29.2 7.0 1.6 287.20 355.80 218.60 614 33.6 5.8 1.2 311.20 386.60 235.80 602 28.1 7.1 1.8 282.00 348.90 215.10 590 27.4 9.3 1.8 285.20 352.90 217.50 578 44.7 9.6 2.5 436.00 540.00 332.00 566 34.8 7.4 2.0 340.00 421.00 259.00 554 29.0 8.1 2.2 299.60 370.10 229.10 542 27.8 7.2 1.8 280.00 346.40 213.60 530 32.8 6.6 1.7 316.00 391.60 240.40 518 30.6 9.9 1.5 308.40 382.50 234.30 506 31.4 7.3 1.8 309.20 382.90 235.50 494 37.8 10.0 2.0 374.40 464.00 284.80 482 34.1 8.5 1.5 330.80 410.50 251.10 470 34.7 6.3 1.9 333.20 412.70 253.70 465 33.8 8.5 2.2 339.60 420.10 259.10 455 35.4 8.4 2.4 355.20 439.20 271.20 443 39.6 7.1 1.6 370.80 460.30 281.30 431 38.6 8.8 1.8 372.80 462.40 283.20 419 28.5 6.6 1.4 276.80 343.20 210.40 407 36.9 5.3 1.2 335.60 417.10 254.10 395 48.1 6.6 1.4 433.60 539.20 328.00 383 45.5 4.8 1.4 405.60 504.20 307.00 371 37.5 8.1 1.1 350.00 435.30 264.70 359 34.5 6.6 1.8 331.20 410.40 252.00 347 36.3 5.1 1.7 338.00 419.10 256.90 335 30.1 7.2 1.3 290.40 360.40 220.40 323 30.7 7.8 1.4 299.20 371.20 227.20 299 46.5 8.0 2.2 439.20 544.60 333.80 287 38.0 8.8 1.7 366.40 454.60 278.20 275 28.0 5.8 1.1 264.80 328.80 200.80 263 28.4 8.6 1.4 284.00 352.20 215.80 251

110
Henryhouse Creek Continued
U (ppm) TH(ppm)
K (%) API
API (+) API(-)
DEPTH (in)
37.8 8.5 2.0 368.40 456.50 280.30 239 51.1 9.0 2.3 481.60 597.40 365.80 227 41.2 7.0 1.6 383.20 475.80 290.60 215 39.8 7.1 1.6 372.40 462.30 282.50 203 42.9 7.1 1.2 390.80 486.10 295.50 191 43.4 7.6 1.0 393.60 490.00 297.20 179 65.7 11.2 1.2 589.60 734.60 444.60 167 59.6 10.0 1.9 547.20 680.20 414.20 155 56.1 9.7 2.2 522.80 649.10 396.50 143 56.4 8.7 2.5 526.00 652.50 399.50 131 66.0 10.5 2.0 602.00 748.50 455.50 119 20.4 8.5 2.4 235.60 289.70 181.50 108 27.9 10.3 2.0 296.40 366.50 226.30 81 29.6 12.9 2.1 322.00 398.30 245.70 64 20.4 9.6 1.9 232.00 286.20 177.80 51 31.3 9.4 1.3 308.80 383.40 234.20 40 28.5 9.9 1.8 296.40 366.90 225.90 33 24.3 8.0 1.9 256.80 317.20 196.40 21 19.8 5.3 1.2 198.80 246.10 151.50 3

111
APPENDIX B
Frequency Distributions of Compiled Outcrop Gamma-Ray Data

112
Woodford Shale Uranium ppm
0
20
40
60
80
100
120
140
5 10 15 20 25 30 35 40 45 50 55 60 65 70 75 80 85 90 95 100 105 110
Uranium ppm
Freq
uenc
y
Average: 38.5 ppm Standard deviation: 12.6

113
Thorium
0
10
20
30
40
50
60
0 0.5 1 1.5 2 2.5 3 3.5 4 4.5 5 5.5 6 6.5 7 7.5 8 8.5 9 9.5 10 10.5 11 11.5 12 12.5 13
Thorium ppm
Freq
uenc
y
Average: 6.8 ppm Standard deviation: 1.97

114
Potassium
0
10
20
30
40
50
60
70
80
0 0.2 0.4 0.6 0.8 1 1.2 1.4 1.6 1.8 2 2.2 2.4 2.6 2.8 3 3.2 3.4
Potassium ppm
Freq
uenc
y
Average: 1.5 % Standard deviation: 0.575

115
Woodford Shale API
0
10
20
30
40
50
60
1.5 2 2.5 3 3.5 4 4.5 5 5.5 6 6.5 7 7.5 8 8.5 9 9.5 10 10.5
API
Freq
uenc
y
Average: 360 API Standard deviation: 108.9

116
APPENDIX C
I-35 THIN-SECTION PHOTOGRAPHS
LOCATED WITHIN UNDESIGNATED AREAS OF THE OUTCROP

117
I-35 thin section photographs from undesignated areas of the outcrop.

118
I-35 thin section photographs from undesignated areas of the outcrop.

119
APPENDIX C
I-35 THIN-SECTION PHOTOGRAPHS
LOCATED WITHIN DOCUMENTED AREAS OF THE OUTCROP

120
Photographs of thin sections from the upper Woodford Shale (left side represents transmitted light and the right side represents cross polarization).
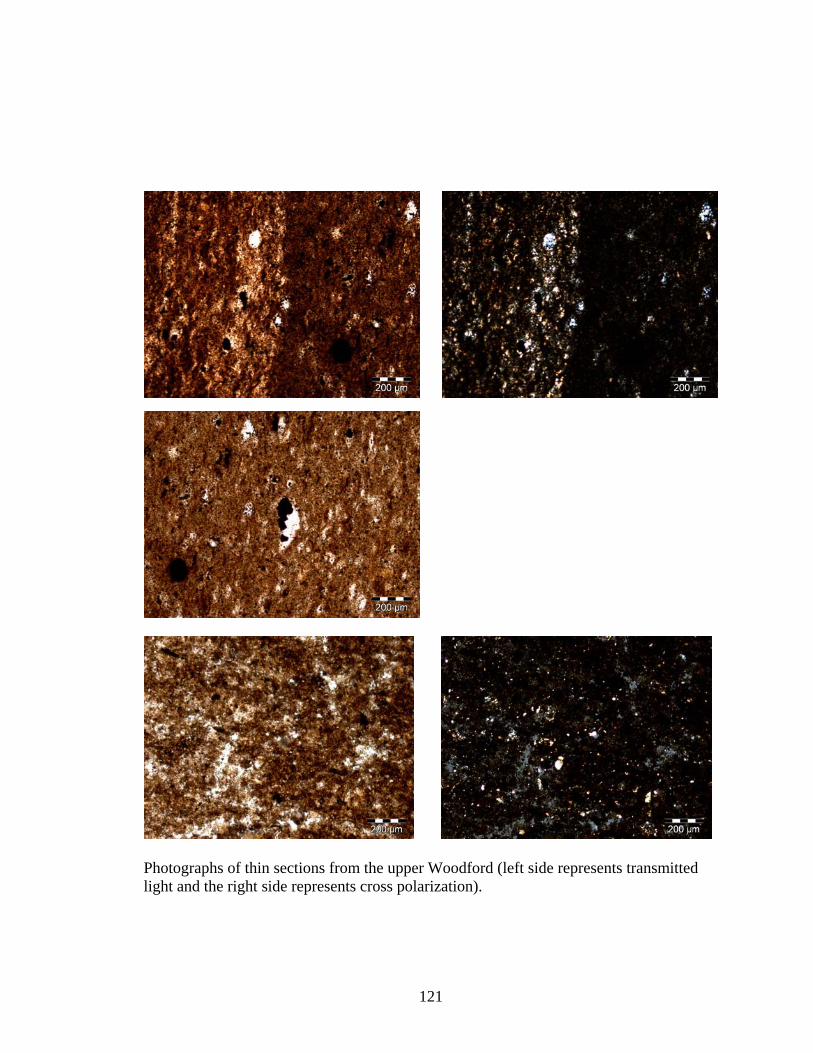
121
Photographs of thin sections from the upper Woodford (left side represents transmitted light and the right side represents cross polarization).

122
Photographs of thin sections from the upper Woodford Shale.

123
APPENDIX C
HENRYHOUSE CREEK ROCK SAMPLES AND THIN-SECTION PHOTOGRAPHS
LOCATED WITHIN DOCUMENTED AREAS OF THE OUTCROP

124
Siliceous shale sample collected from the Upper Woodford shale.

125
Siliceous shale sample with a phosphate nodule that was collected from the Upper Woodford shale.
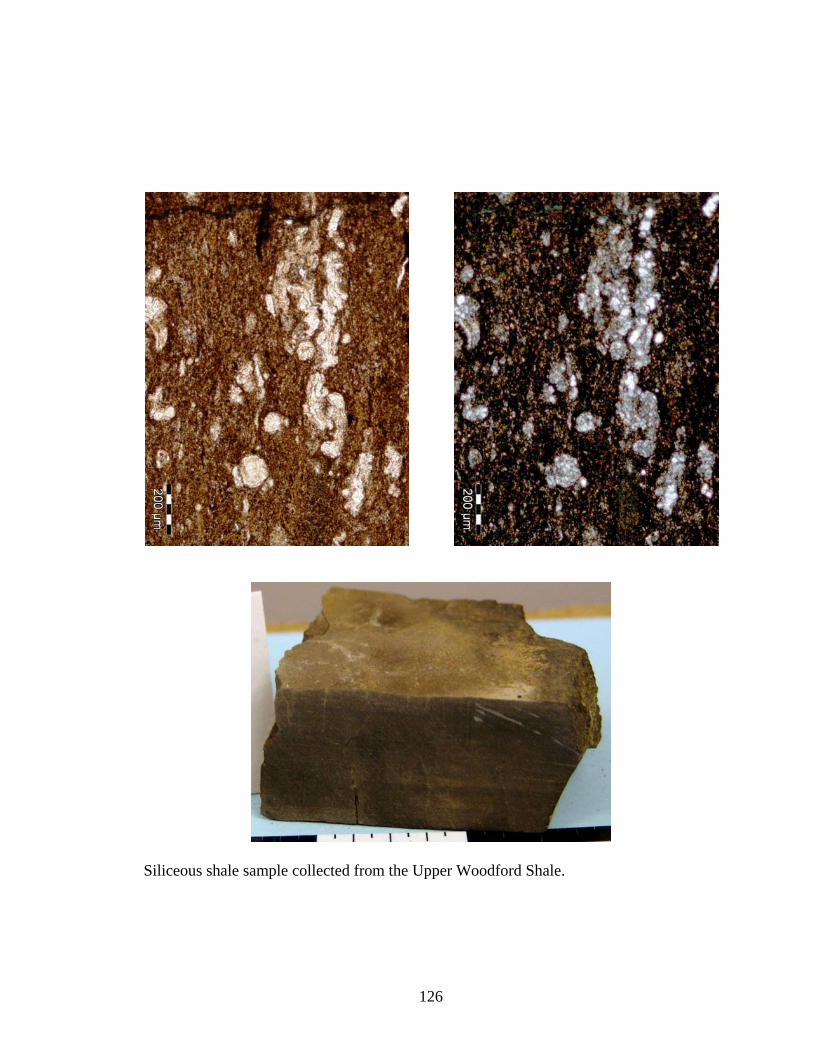
126
Siliceous shale sample collected from the Upper Woodford Shale.

127
(A) Siliceous shale sample with dolomite located in the upper Woodford Shale. (B) Fissile shale sample with dolomite located in the upper Woodford Shale.
A
B

128
Fissile shale samples collected from the middle Woodford Shale.

129
Siliceous shale sample collected from the middle Woodford Shale.

130
Siliceous shale sample collected from the middle of the Woodford Shale.

131
APPENDIX C
MCALESTER CEMETERY SHALE PIT ROCK SAMPLES AND THIN SECTION PHOTOGRAPHS
LOCATED WITHIN DOCUMENTED AREAS OF THE OUTCROP
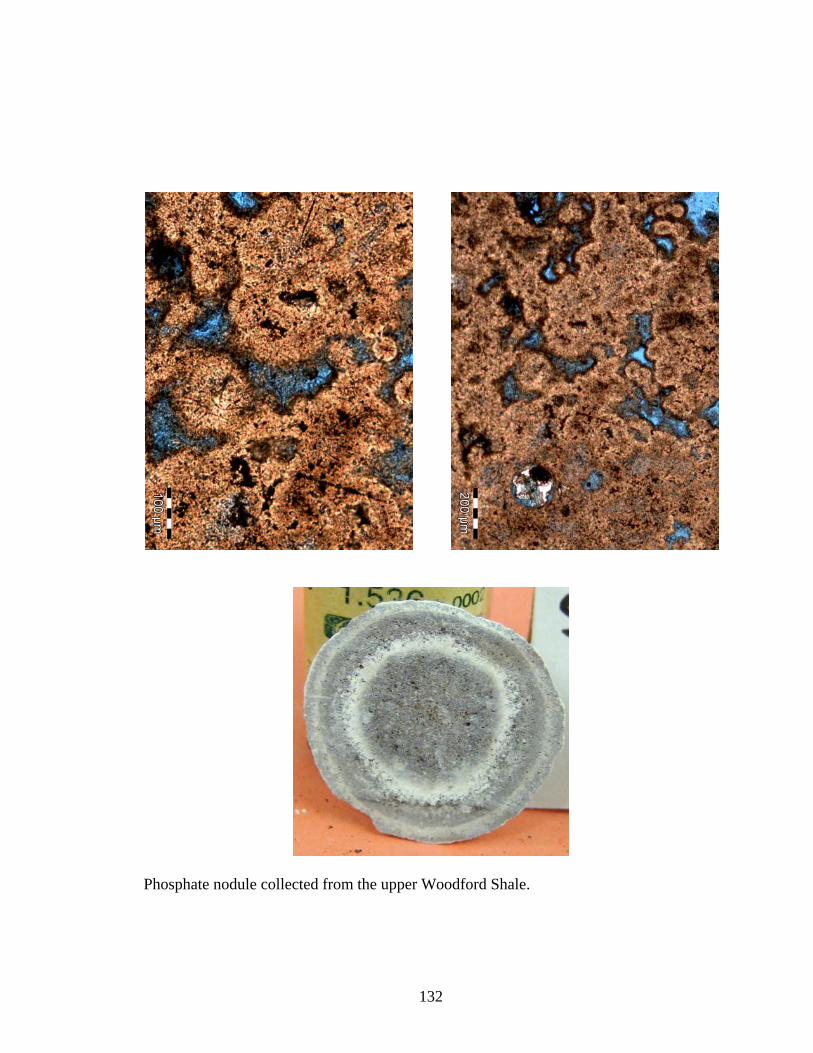
132
Phosphate nodule collected from the upper Woodford Shale.
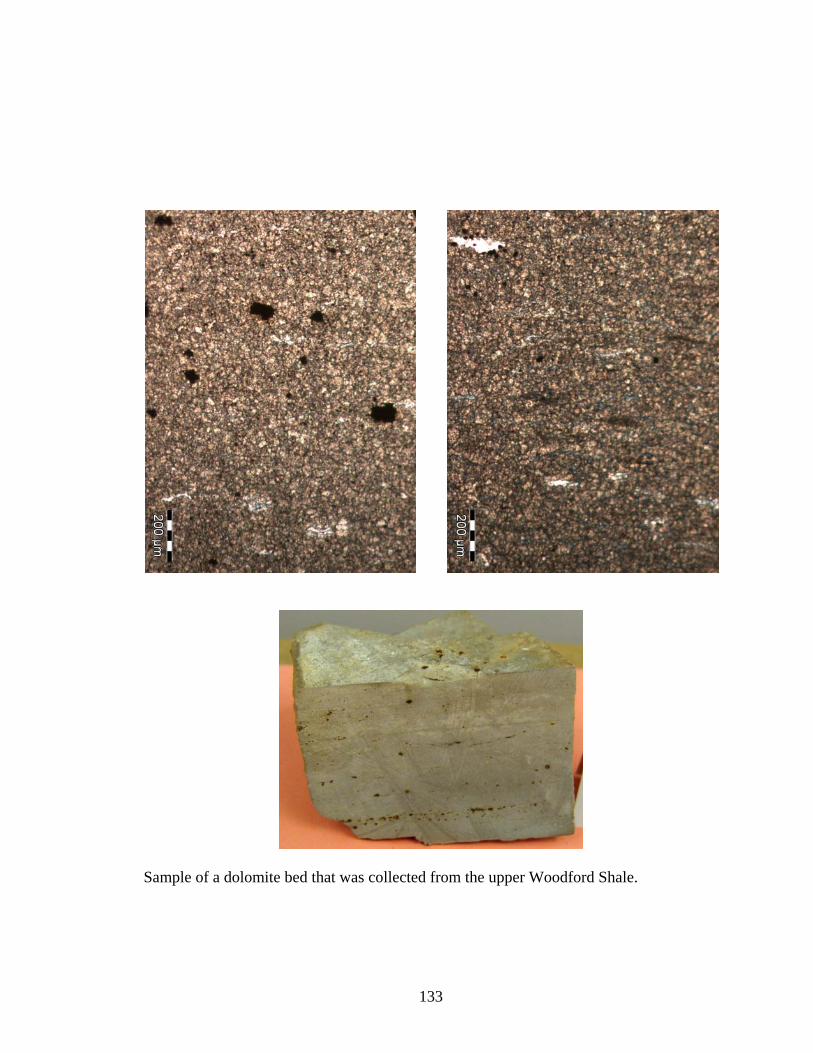
133
Sample of a dolomite bed that was collected from the upper Woodford Shale.
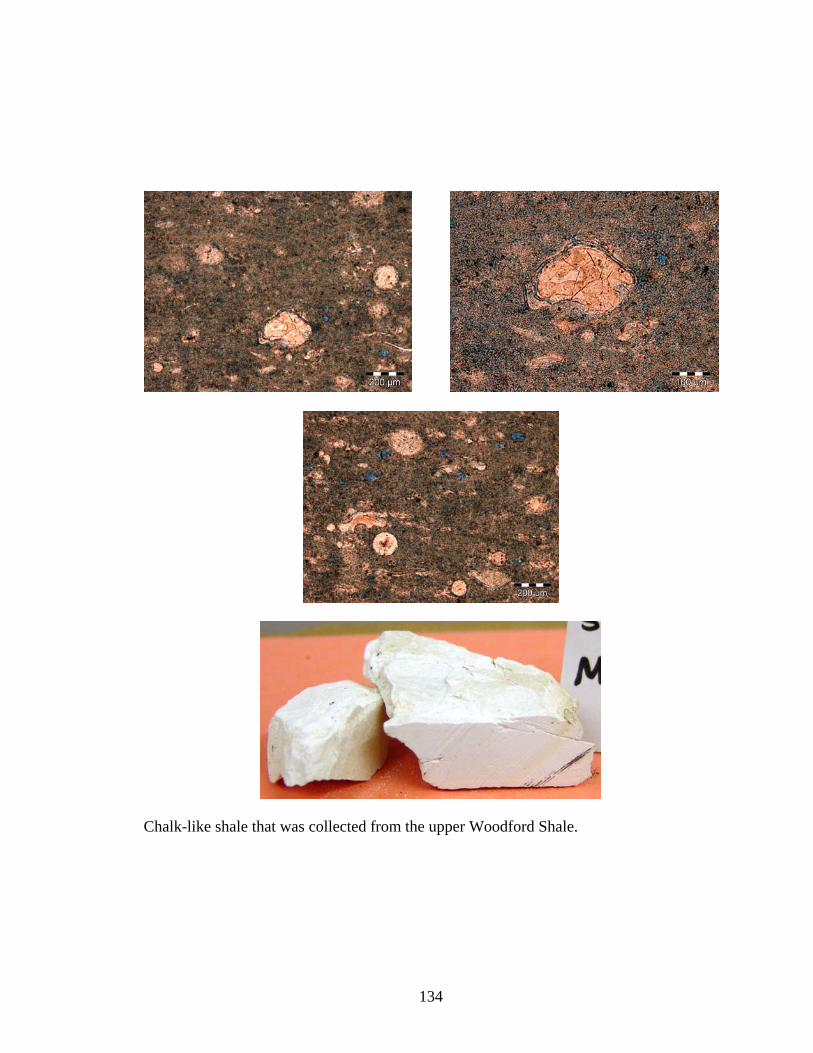
134
Chalk-like shale that was collected from the upper Woodford Shale.

135
Chert sample that was collected from the upper Woodford Shale.

136
APPENDIX D
X-RAY DIFFRACTION DATA COLLECTED FROM THE I-35 OUTCROP
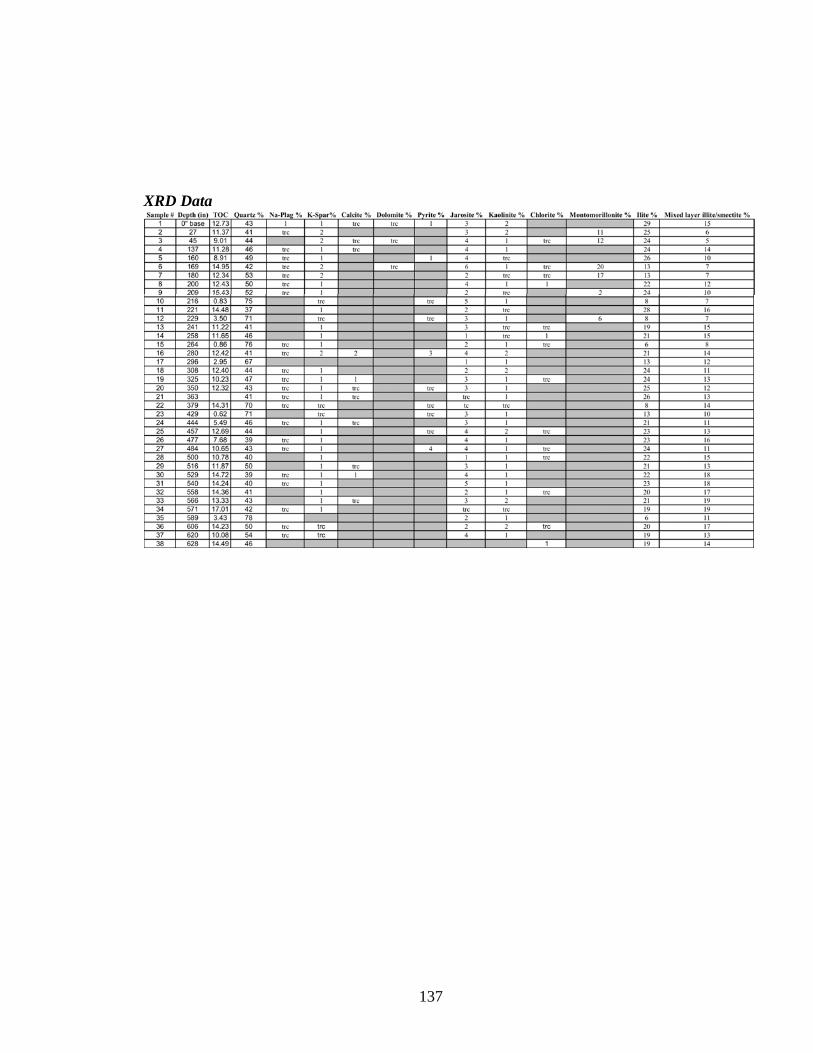
137
XRD Data

138
APPENDIX E
TOC VALUES FROM SAMPLES COLLECTED AT THE I-35 OUTCROP

139
Sample ID Depth
(Inches) TOC 1 0 12.73 2 27 11.37 3 45 9.01 4 137 11.28 5 160 8.91 6 169 14.95 7 180 12.34 8 200 12.43 9 209 15.43
10 216 0.83 11 221 14.48 12 229 3.50 13 241 11.22 14 258 11.65 15 264 0.86 16 280 12.42 17 296 2.95 18 308 12.40 19 325 10.23 20 350 12.32 22 379 14.31 23 429 0.62 24 444 5.49 25 457 12.69 26 477 7.68 27 484 10.65 28 500 10.78 29 516 11.87 30 529 14.72 31 540 14.24 32 558 14.36 33 566 13.33 34 571 17.01 35 589 3.43 36 606 14.23 37 620 10.08 38 628 14.49

140
APPENDIX F
VITRINITE REFLECTANCE DATA

141

142

143

144

145


Alischa M. Krystyniak
Candidate for the Degree of
Master of Science Thesis: OUTCROP BASED GAMMA-RAY CHARACTERIZATION OF THE
WOODFORD SHALE OF SOUTH-CENTRAL OKLAHOMA Major Field: Geology Biographical:
Personal Data: Born in Westbranch, Michigan on March 20, 1978, the daughter of Chester and Frances Krystyniak
Education: Graduated from Standish-Sterling High School, Standish, Michigan
in June 1997; received Bachelor of Science degree in Geological Sciences from Lake Superior State University of Sault Sainte Marie, Michigan in May 2003. Completed the requirements for the Master of Science degree with a major in Geology at Oklahoma State University in December, 2005.
Experience: Conodont research with Dr. Lew Brown at Lake Superior State
University from January 1998 to May 2003; Worked as a teaching assistant for the School of Geology at Oklahoma State University from August 2003 to May 2005; Worked as an Intern at Devon Energy Corporation in Oklahoma City from May 2005 to December 2005.
Professional Memberships: Geological Society of America American Association of Petroleum Geologists

Name: Alischa M. Krystyniak Date of Degree: December, 2005 Institution: Oklahoma State University Location: Stillwater, Oklahoma Title of Study: OUTCROP-BASED GAMMA-RAY CHARACTERIZATION OF THE
WOODFORD SHALE OF SOUTH-CENTRAL OKLAHOMA Pages in Study: 149 Candidate for the Degree of Master of Science
Major Field: Geology Scope and Method of Study: The late Devonian (Frasnian, Fammenian) and basal
Mississippian (Tournasian) in age Woodford Shale was studied in Murray, Carter, and Pontotoc Counties, Oklahoma. The purpose of this study was to determine if a relationship exists between outcrop lithofacies and gamma-ray response and if ultimately this relationship can be extended into the subsurface. Over 500 gamma-ray readings were collected from five studied outcrops to complete this work. Thin-section analysis, total organic carbon, x-ray diffraction and vitrinite reflectance data were also integrated in this study.
Findings and Conclusions: The Woodford Shale falls into the uraniferous shale category
(>20 ppm) with uranium readings as high as 106 ppm. Uranium is the main constituent controlling gamma-ray character. The greatest occurrence of uranium occurs in the lower Woodford and in the top of the middle Woodford.
The bulk of the Woodford contains two main shale habits, fissile and non-fissile.
Lithofacies found in or associated with the non-fissile category are phosphatic shale, siliceous shale, dolomite beds, phosphate nodules and rare occurrences of chert and limestone. The fissile shale habits are composed of laminations that are <1 cm thick and are the most organic-rich of the Woodford shales.
Thin-section analysis of the upper Woodford indicates that radiolarians are the
main source for silica in the Woodford. Thin-sections cut from phosphate nodules and surrounding shales suggests that radiolarians provide the nuclei for phosphate development.
The Woodford outcrop-based gamma-ray profiles can be correlated into the
subsurface. This correlation is based upon pattern recognition of the connected points that compose a gamma-ray profile in comparison with the gamma-ray logs which are continuous curves.
ADVISER’S APPROVAL: Stanley T. Paxton