direct quantification of alkaloid mixtures by electrospray ionization mass spectrometry
TRANSCRIPT

JOURNAL OF MASS SPECTROMETRYJ. Mass Spectrom. 33, 1232È1236 (1998)
Direct QuantiÐcation of Alkaloid Mixtures byElectrospray Ionization Mass Spectrometry
D. S. Selby,1 M. Guilhaus,1* J. Murby2 and R. J. Wells21 School of Chemistry, University of New South Wales, Sydney, NSW 2052, Australia2 Australian Government Analytical Laboratories, 1 Suakin St. Pymble, NSW 2073, Australia
For two-component mixtures, Kebarle and Tang observed that the ionization efficiency (i.e., yield of ions per unitconcentration) depends strongly on the concentration and nature of other ionizable species and weakly on totalconcentration of ionized species. In this work, the model used by Kebarle and Tang was extended to severalcomponents. The extended model was tested in a study to determine whether analysis by extrospray ionizationcould be used as a fast method to screen and quantify Ðve alkaloids present in illicit heroin samples. The samplesanalysed included authentic standards. Solutions of the samples were infused directly into the electrospray ionsource of a Finnigan TSQ 700 instrument. The resulting spectra contained a peak for each species at M + 1. NosigniÐcant fragmentation was observed for any of the Ðve analytes. It was found that the “ionization efficienciesÏ(assumed constants in the Kebarle and Tang model) showed a dependence on total alkaloid concentration. In ablind study of 16 sample solutions, each containing Ðve alkaloids (one used as an internal standard), the errordistributions for the 64 results obtained were skewed when calculated on the basis of a simple extension of theKebarle model. When the variation of ionization efficiency with total alkaloid concentration was taken intoaccount, the error distribution was normal. Errors were characterized (relative to total alkaloid mass) by anaverage error of Ô0.24% , a standard deviation of errors of 2.48% , a maximum error of 6.84% and a minimumerror of Ô9.51% . 1998 John Wiley & Sons, Ltd.(
KEYWORDS: electrospray ; quantiÐcation ; alkaloids ; heroin ; ionization mechanism
INTRODUCTION
Electrospray ionization mass spectrometry (ESI-MS) is asoft ionization technique capable of generating gas-phase ions directly from ions in solution,1 with little orno fragmentation. The signal response is often pro-portional to analyte concentration,2 allowing quantitat-ive applications. The presence of additional ionizablespecies during gas-phase ion formation suppresses theanalyte signal.3 Hence ESI is usually used for the quan-tiÐcation of mixtures in tandem with chromatographictechniques, typically high-performance liquid chroma-tography (HPLC)4 or capillary electrophoresis.5
Illicit heroin is a mixture of opiate alkaloids andimpurities.6 Authorities are primarily interested in thelevels of opiates present as major components in conÐs-cated samples, namely the amount of diacetylmorphine(DAM), 6-O-monoacetylmorphine (MAM) and acetyl-codeine (AC).7 QuantiÐcation is typically provided bygas chromatography8 or HPLC.9 Alkaloids are idealcandidates for ESI-MS as they form abundant [M ] 1]ions by single proton addition. Alkaloids have beenused in fundamental studies of the mechanism ofESI.10,11 Thus ESI-MS analysis of illicit heroin appears
* Correspondence to : M. Guilhaus, School of Chemistry, Universityof New South Wales, Sydney, NSW 2052, Australia.
particularly attractive because each of its opiates DAM,MAM, AC, papaverine (Pap) and narcotine (Narc) has adi†erent nominal mass and can be expected to formwell resolved ions in ESI-MS.
The relationship between the analyte concentrationand detected ion abundance, including suppressione†ects, has been investigated by Kebarle and Tang3,10and Mann.2 An analyteÏs signal was found to depend onits own concentraton and the concentration and natureof other substances present, leading to the followingequation for a two component system:3,12
IA` \ kA[A`]kA[A`]] kB[B`]
pfI (1a)
\ [A`][A`]] (kB/kA)[B`]
pfI (1b)
where is the mass spectrometrically detected ionIA`current of A`, p is a constant expressing the efficiencyof the mass spectrometer for sampling the gaseous ioncurrent, f is the efficiency of conversion of dropletcharge to gas phase ions, I is the current leaving theESI capillary and [A`], [B`] and [C`] are the concen-trations of the ions in the electrosprayed solution.Strictly, and are constants expressing the rate ofkA kBtransfer of the respective species from the liquid to thegas phase. In analytical applications the absolute valuesof these constants are unimportant, as the signaldetected is directly related to the value of the ratio kB/kA
CCC 1076È5174/98/121232È05 $17.50 Received 3 June 1998( 1998 John Wiley & Sons, Ltd. Accepted 9 September 1998

DIRECT QUANTIFICATION OF MIXTURES BY ESMS 1233
in Eqn (1b). Hence all that needs to be determinedexperimentally are the relative values of the rate con-stants, so values can be found for and that arekA kBproportional to liquid-to-gas transfer rates. Since theseare relative values and not true thermodynamic rateconstants, they are more correctly referred to as andkA@
This equation has been shown to work well for [email protected] three components in one solution, two analytes andco-eluting electrolyte impurities.10 In this study, weattempted to generalize the model to n components. Wealso examined the potential use of the model for thequantitative analysis of simple mixtures, where directsample introduction is desirable (no chromatography)or where chromatography is characterized by co-elutingpeaks.
EXPERIMENTAL
Instrumentation
All experiments were performed on a Finnigan MATTSQ700 triple-quadrupole mass spectrometer with aFinnigan ESI source. Samples were introduced into theESI source from a Unimetrics 250 ll syringe with aHarvard Apparatus Model 22 syringe infusion pump.The syringe pump and mass spectrometer were con-trolled by a DEC 2110 computer, operating ICISVersion 8.0 software provided by Finnigan.
Reagents
Opiate standards of diacetylmorphine, MAM, AC,papaverine and narcotine were obtained from com-mercial suppliers and certiÐed to be of 99% or betterpurity. Seized illicit heroin samples were provided bythe Forensic section of the Australian GovernmentAnalytical Laboratories. Solvents used included Milli-Q-puriÐed water and HPLC-grade methanol. All sol-vents were acidiÐed with reagent-grade acetic acid andÐltered through 0.2 lm Ðlters prior to use.
Analysis of heroin
Solutions were made in 50 : 50 methanolÈwater acidiÐedwith 1% acetic acid from standards generating mixturesof diacetylmorphine, MAM, AC, papaverine and nar-cotine. The concentration of each compound was variedfrom 0.05 to 10 pmol ll~1 in four di†erent solutionsprepared in duplicate to investigate the stability of therelative ionization factors. Spectra were obtained usingthe selected ion monitoring (SIM) scan mode, in whichthe masses 327.7È328.7 (MAM), 339.6È340.4 (Pap),341.7È342.7 (AC), 369.7È370.7 (DAM) and 413.7È414.7(Narc) were observed within a 2 s interval. Data wereaveraged over 1 min to give the resulting spectrum.
Analysis of data was performed using an iterativeapproach in a spreadsheet program (Microsoft Excel,Version 4.0). In initial experiments, the concentration ofeach standard and the measured ion abundance for[M] 1]` ions were entered. The relative liquid-to-gas-phase transfer rate of diacetylmorphine was set, arbi-trarily, to 1. Arbitrary estimates were entered for the
mass spectrometric parameter i (see Eqn (4) below) andthe relative transfer rates of the other four opiates. Anion abundance for each compound was then calculatedby application of the function described by Eqn (4). Aresidual based on the sum of the di†erences betweenmeasured and calculated ion abundances was com-puted, given as * by Eqn (2). The residual was deÐnedas a value to be minimized by iterative adjustment ofthe transfer rates, for all opiates except DAM.km@,
*\ (Il`
)observed[ (Il`
)calculated (2)
The spreadsheet procedure was modiÐed to allow theanalysis of unknowns. In this mode, the algorithm per-formed an almost identical task, with the only di†erencebeing that it was given the relative liquid to gas phasetransfer rates and asked to determine the concentrationsof all species except one, papaverine, which was used asan internal standard. Scan parameters used in the quan-tiÐcation of unknowns were identical with those used toÐnd the relative rates.
The method was tested by conducting a blind studyin which eight test mixtures were prepared, in duplicate,from standards independently of the analyst. Threespectra were obtained by the analyst for each solution.Finally, the results of the analysis were compared withthe true values by a third independent participant.
RESULTS AND DISCUSSION
Multicomponent model
Equation (1a) can be extended to an n-componentmixture and simpliÐed in the following manner :
Ixl` \ pfIkl@[X
l`]
A;l/1
nkl@[X
l`]B
] C(3)
where p, f and I represent the same parameters as speci-Ðed in Eqn (1) and is the mass spectrometricallyI
xl`observed ion abundance of the lth component, andkl@
represent the relative liquid to gas phase ion[Xl`]
transfer rate and solution concentration of the lthspecies and C is the solvent term, which represents thesummed liquid to gas transfer of all impurity (non-analyte) ions.
If p, f, I and C are known or measurable and kl@
values are available from the spectra of standards, theconcentrations of analytes, can be determined[X
l`],
numerically with Eqn (3). In practice, p, f, I and C aredifficult to measure and can vary between analyses. Forinstance, p diminishes as the sampling capillary of theES source gradually becomes blocked and C will varyfrom sample to sample. However, during the acquisitionof any single spectrum, these parameters remain essen-tially constant, providing justiÐcation for rearrangingthe equation and grouping them into a single term, i, asillustrated in Eqn (4). If previously determined valuesare available for analyte relative transfer rates the(k
l@),
use of an internal standard allows, in principle, thedetermination of i and the concentrations of theanalytes.
( 1998 John Wiley & Sons, Ltd. J. Mass Spectrom. 33, 1232È1236 (1998)

1234 D. S. SELBY ET AL .
Figure 1. Liquid to gas phase transfer rates (k ¾) found for MAM,Pap, AC and Narc, relative to the liquid to gas phase transfer rateof DAM, arbitrarily set to 1. The k¾ values are plotted against totalopiate concentration.
IXl`\ pfI
(kl@[X
l`])]
A;l/1
nkl@[X
l`]B
GA;l/1
nkl@[X
l`]B
] CH
]A
;l/1
nkl@[X
l`]B
or
IXl`\ i
kl@[X
l`]
;l/1
nkl@[X
l`]
(4)
where
i \ pfI;l/1
nkl@[X
l`]
A;l/1
nkl@[X
l`]B
] C
Results obtained with this equation for the liquid togas phase transfer rates of MAM, AC, Pap and Narcrelative to DAM are displayed in Fig. 1. The relative
transfer rates of Pap and MAM appear to be signiÐ-cantly a†ected by the total opiate concentration. Theyshow an increase in liquid to gas transfer rates relativeto DAM at low opiate concentrations. Empirical inves-tigation of the apparent dependence showed a reason-ably linear correlation between the reciprocal of therates and the reciprocal of the total opiate concentra-tion. This is shown in Fig. 2. The correlation wasincorporated into a modiÐed version of the model byincluding the following relationship :
kl@\
;l/1
n[X
l`]
a ] b ;l/1
n[X
l`]
(5)
where is the relative liquid to gas phase transfer ratekl@
of the species, gives the total opiate concen-;l/1n [X
l`]
tration, measured in pmol ll~1, a represents the slopeof the plot in pmol ll~1, a represents the slope of theplot in pmol ll~1 and b represents the intercept of theplot. In this relationship, the b term dominates at highconcentration ( f ] 1/b). The term could be related tothe ability of the compound to compete for surface siteson the droplets, as total surface charge tends to satu-rate. At low concentration the a term becomes moreimportant. This may be related to the ability of theanalyte to di†use to the surface of the drop.
QuantiÐcation of test mixtures
The relative ionization efficiencies obtained above wereused to investigate the ability of the model in determin-ing the concentrations of text mixtures, allowing for onecompound to be an internal standard. Papaverine waschosen, somewhat arbitrarily in this case, because it wasgeneraly found to be present in low concentration in thesamples simulated in this study. The data obtained fromthe spectra were analysed with Eqn (4) using twomethods of Ðnding the relative liquid to gas phasetransfer rates. The Ðrst deÐned the relative liquid to gasphase transfer rates as a function of total opiate concen-tration according to Eqn (5) and used the algorithm toobtain an optimum solution and give analyte concen-trations. In the second method, the average of the rela-tive transfer rate for each species was obtained fromFig. 1. Using Ðxed transfer rates allowed concentrationsto be determined by taking the ratio of Eqn (4) for the
Table 1. Summary of the accuracy of quantitative results obtained from unknown alkaloid samples usingrelative liquid to gas phase transfer rates which were (a) a function of total opiate concentrationor (b) held constant
Mean error Standard deviation of Mean error Standard deviation of
Compound (% concentration)a molar error (%) (% by mass)b (mas error (%)
(a) (b) (a) (b) (a) (b) (a) (b)
Diacetylmorphine 3.1 21.5 11.3 15.7 É1.29 5.58 4.60 2.41
Monoacetylmorphine 10.6 11.0 20.0 20.4 0.98 1.24 2.60 2.75
Acetylcodeine 7.4 32.4 26.9 31.1 0.16 2.23 0.68 1.18
Narcotine É1.7 17.6 9.8 12.2 É0.86 2.58 1.16 2.54
a Mean error (% concentration) is the average error for each component as a percentage of that species’ actualconcentration (lM).b Mean error (% by mass) is the average error for each component expressed as a percentage of total opiatealkaloid mass.
( 1998 John Wiley & Sons, Ltd. J. Mass Spectrom. 33, 1232È1236 (1998)
DIRECT QUANTIFICATION OF MIXTURES BY ESMS 1235
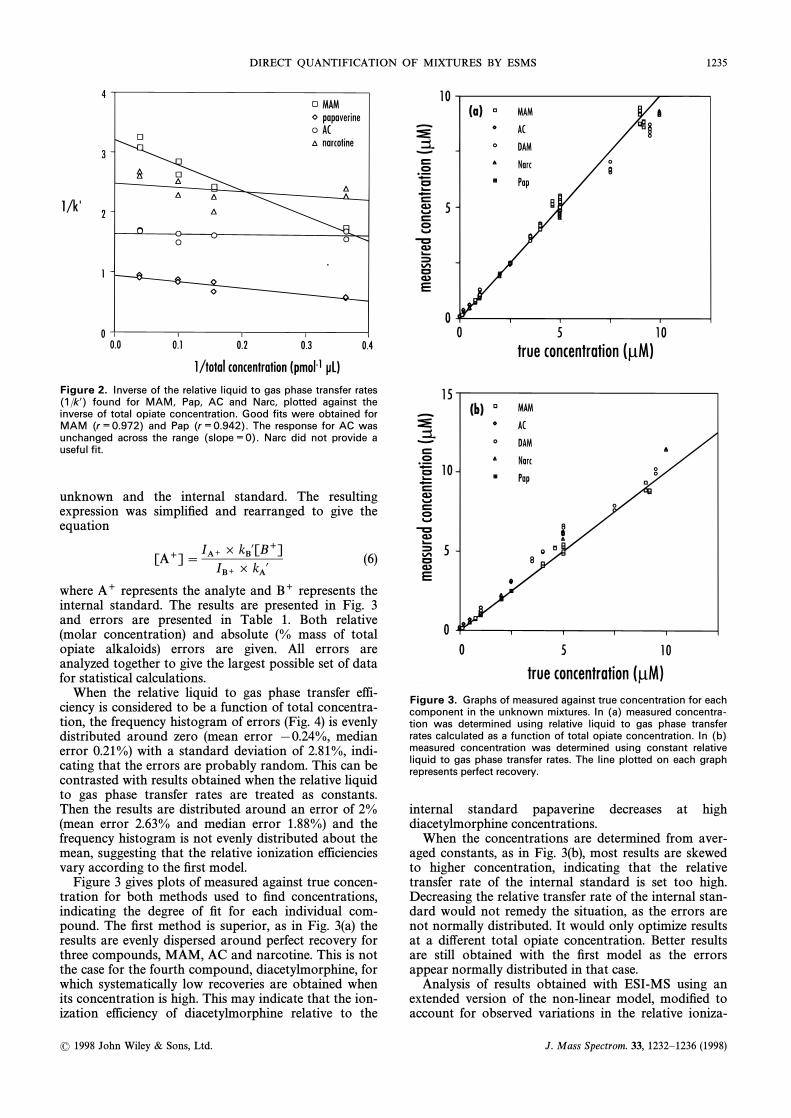
Figure 2. Inverse of the relative liquid to gas phase transfer rates(1/k ¾) found for MAM, Pap, AC and Narc, plotted against theinverse of total opiate concentration. Good fits were obtained forMAM (r ¼0.972) and Pap (r ¼0.942). The response for AC wasunchanged across the range (slope ¼0). Narc did not provide auseful fit.
unknown and the internal standard. The resultingexpression was simpliÐed and rearranged to give theequation
[A`]\ IA` ] kB@[B`]IB` ] kA@
(6)
where A` represents the analyte and B` represents theinternal standard. The results are presented in Fig. 3and errors are presented in Table 1. Both relative(molar concentration) and absolute (% mass of totalopiate alkaloids) errors are given. All errors areanalyzed together to give the largest possible set of datafor statistical calculations.
When the relative liquid to gas phase transfer effi-ciency is considered to be a function of total concentra-tion, the frequency histogram of errors (Fig. 4) is evenlydistributed around zero (mean error [0.24%, medianerror 0.21%) with a standard deviation of 2.81%, indi-cating that the errors are probably random. This can becontrasted with results obtained when the relative liquidto gas phase transfer rates are treated as constants.Then the results are distributed around an error of 2%(mean error 2.63% and median error 1.88%) and thefrequency histogram is not evenly distributed about themean, suggesting that the relative ionization efficienciesvary according to the Ðrst model.
Figure 3 gives plots of measured against true concen-tration for both methods used to Ðnd concentrations,indicating the degree of Ðt for each individual com-pound. The Ðrst method is superior, as in Fig. 3(a) theresults are evenly dispersed around perfect recovery forthree compounds, MAM, AC and narcotine. This is notthe case for the fourth compound, diacetylmorphine, forwhich systematically low recoveries are obtained whenits concentration is high. This may indicate that the ion-ization efficiency of diacetylmorphine relative to the
Figure 3. Graphs of measured against true concentration for eachcomponent in the unknown mixtures. In (a) measured concentra-tion was determined using relative liquid to gas phase transferrates calculated as a function of total opiate concentration. In (b)measured concentration was determined using constant relativeliquid to gas phase transfer rates. The line plotted on each graphrepresents perfect recovery.
internal standard papaverine decreases at highdiacetylmorphine concentrations.
When the concentrations are determined from aver-aged constants, as in Fig. 3(b), most results are skewedto higher concentration, indicating that the relativetransfer rate of the internal standard is set too high.Decreasing the relative transfer rate of the internal stan-dard would not remedy the situation, as the errors arenot normally distributed. It would only optimize resultsat a di†erent total opiate concentration. Better resultsare still obtained with the Ðrst model as the errorsappear normally distributed in that case.
Analysis of results obtained with ESI-MS using anextended version of the non-linear model, modiÐed toaccount for observed variations in the relative ioniza-
( 1998 John Wiley & Sons, Ltd. J. Mass Spectrom. 33, 1232È1236 (1998)

1236 D. S. SELBY ET AL .
Figure 4. Frequency histogram, showing the frequency of mass composition errors (% of total opiate mass). Model 1 assumed all relativeliquid to gas phase transfer rates were constant, while model 2 calculated the transfer rates for Pap and MAM as a function of total opiateconcentration, from the data plotted in Fig. 2.
tion efficiencies, appears to predict the concentrationdependence of results obtained for solutions containingup to Ðve opiate standards, for total alkaloid concentra-tions of up to 22 pmol ll~1. Future work should inves-tigate the use of the model in the quantitative analysisof illicit heroin and see if impurities interfere with thequantiÐcation process.
CONCLUSION
This study has shown that direct ESI-MS, withoutinitial separation of components, can be used for thequantiÐcation of simple Ðve-component alkaloid mix-tures with an extended version of the Kebarle and Tangmodel. Keeping relative liquid to gas phase transferrates constant gave results which were skewed to posi-tive values. Better results were obtained with the
extended model when relative liquid to gas phase trans-fer rates for Pap and MAM were calculated as a func-tion of total opiate concentration and not treated asconstants. Results were both more accurate and ran-domly distributed. This may be useful for quantiÐcationin coupled chormatographic/ESI-MS techniques, whereanalytes co-elute. It should allow accurate quantiÐca-tion even when the ratio of analyte and standard liquidto gas phase transfer rates vary as a function of totalconcentration.
Acknowledgements
The authors thank M. Y. Croft for preparing the testmixtures and for helpful discussions during the experi-ments. They are grateful to J. Skopetz, whose know-ledge of current methods of heroin analysis provedinvaluable.
REFERENCES
1. M. H. Allen and B. I. Shushan, LC·GC 11, 112 (1993).2. M. Mann,Org.Mass Spectrom. 25, 575 (1990).3. L. Tang and P. Kebarle, Anal . Chem. 65, 3654 (1993).4. D. M. Bunk and M. J. Welch, J. Am. Soc. Mass Spectrom 8,
1247 (1997).5. J. Y. Zhao, P. Thibault, T. Tazawa and M. A. Quilliam, J.
Chromatogr . A 781, 555 (1997).6. C. Barnfield, S. Burns, D. L. Byrom and A. V. Kemmenoe,
Forensic Sci . Int . 39, 107 (1988).7. United Nations, United Nations Division of Narcotic Drugs
Manual (ST /NAR /6). United Nations, Vienna (1986).
8. P. DeZan and J. Fasanello, J . Chromatogr . Sci . 10, 333(1972).
9. K. Grogg-Sulser, H. J. Helmlin and J. T. Clerc, J . Chromatogr .A 692, 121 (1995).
10. P. Kebarle and L. Tang, Anal . Chem. 65, 972 (1993).11. M. G. Ikonomou, A. T. Blades and P. Kebarle, Anal . Chem. 63,
1989 (1991).12. L. Tang and P. Kebarle, Anal . Chem. 63, 2709 (1991).
( 1998 John Wiley & Sons, Ltd. J. Mass Spectrom. 33, 1232È1236 (1998)