director director polyolefinspolyolefins & pvc& pvc5).pdf · natural gas ethane propane...
TRANSCRIPT

Polyolefins: North America And Polyolefins: North America And The WorldThe World
Nick VafiadisNick VafiadisDirector Director PolyolefinsPolyolefins & PVC& [email protected]@cmaiglobal.com
FPAFPASeptember 24, 2009September 24, 2009Chicago IL U S AChicago IL U S A
Flexible Packaging AssociationFlexible Packaging AssociationSingaporeSingapore ShanghaiShanghai HoustonHouston New YorkNew York LondonLondon DüsseldorfDüsseldorf DubaiDubai
Chicago, IL, U.S.A.Chicago, IL, U.S.A.
EnergyEnergygygy
Flexible Packaging AssociationFlexible Packaging Association
WTI$/BBL
DistillatesCents Per Gallon
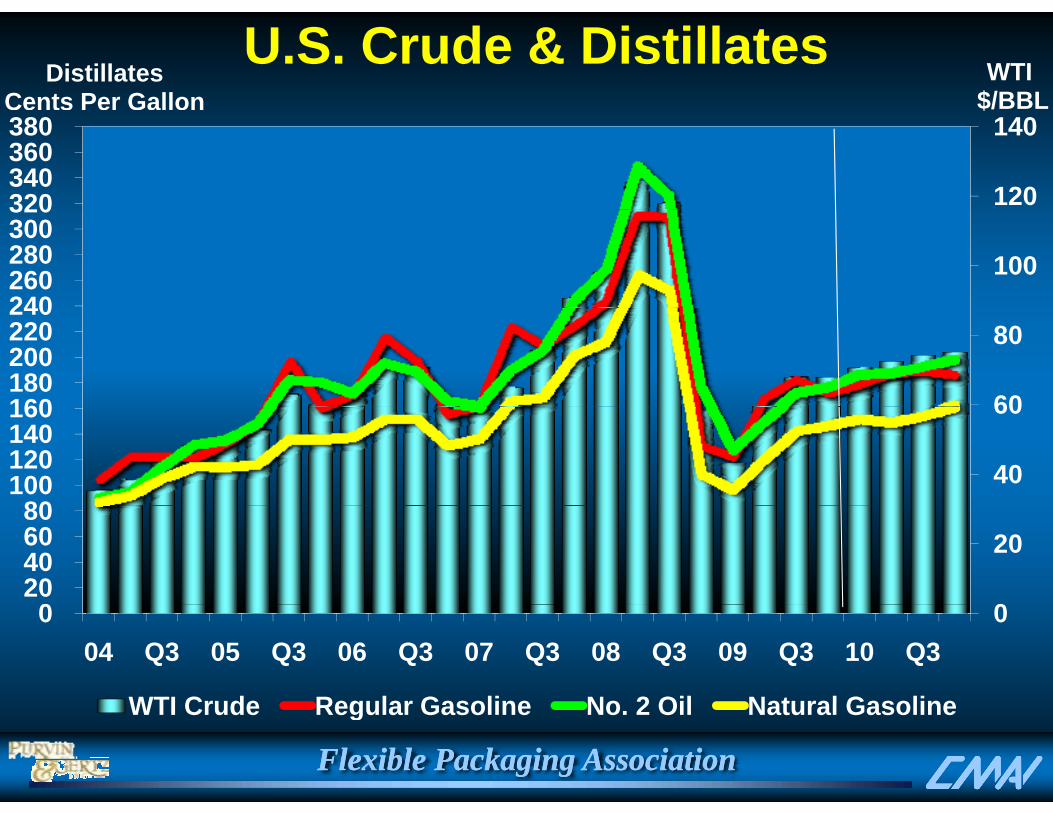
U.S. Crude & Distillates
120
140
320340 360 380
$
100 240260 280 300 320
60
80
160180 200 220 240
40
60
80100 120 140 160
0
20
020 40 60 80
0 0 04 Q3 05 Q3 06 Q3 07 Q3 08 Q3 09 Q3 10 Q3
WTI Crude Regular Gasoline No 2 Oil Natural Gasoline
Flexible Packaging AssociationFlexible Packaging Association
WTI Crude Regular Gasoline No. 2 Oil Natural Gasoline

WTI$/BBL
DistillatesCents Per Gallon
U.S. Crude & Distillates
100
120
260 280 300
$
80
100
200 220 240
60 140 160 180
40
6080
100 120
0
20
020 40 60
0 0 03 04 05 06 07 08 09 10 11 12 13
WTI Crude Regular Gasoline No 2 Oil Natural Gasoline
Flexible Packaging AssociationFlexible Packaging Association
WTI Crude Regular Gasoline No. 2 Oil Natural Gasoline
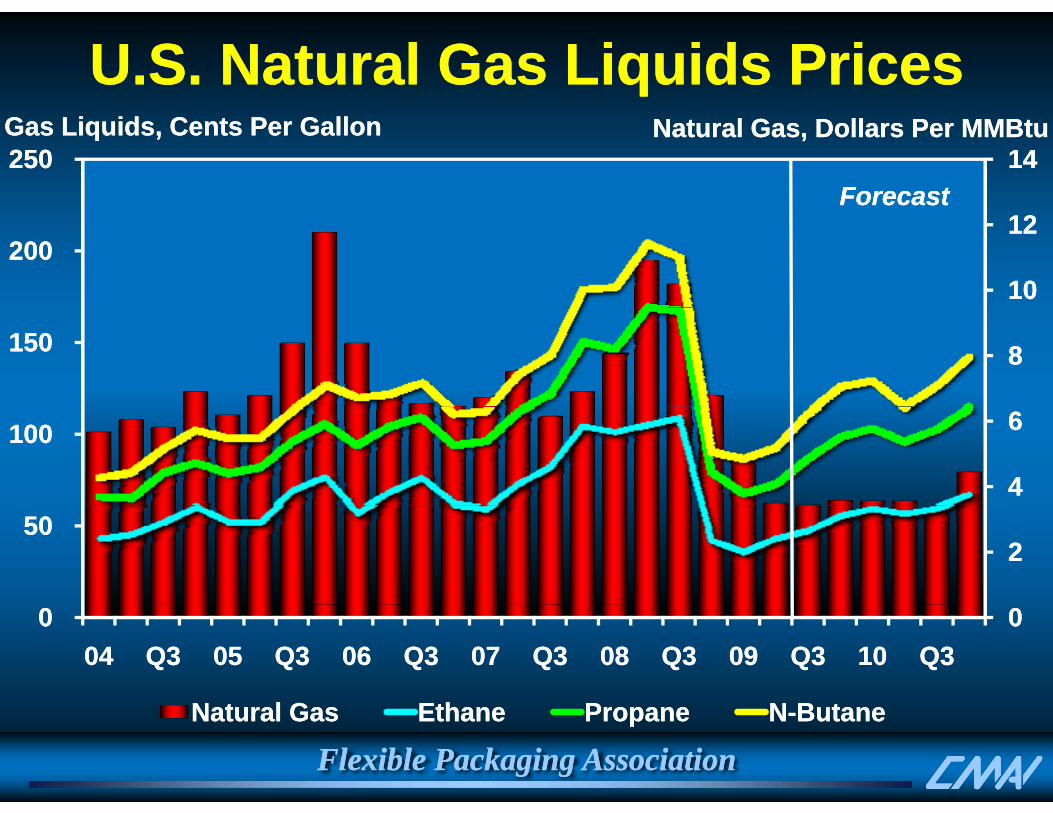
U.S. Natural Gas Liquids PricesU.S. Natural Gas Liquids Prices14 14 250 250
Gas Gas Liquids, Cents Liquids, Cents Per GallonPer Gallon Natural Natural Gas, Dollars Per Gas, Dollars Per MMBtuMMBtu
ForecastForecast
10 10
12 12 200 200
8 8 150 150
4 4
6 6 100 100
2 2 50 50
0 0 0 0 0404 Q3Q3 0505 Q3Q3 0606 Q3Q3 0707 Q3Q3 0808 Q3Q3 0909 Q3Q3 1010 Q3Q3
N t l GN t l G EthEth PP NN B tB t
Flexible Packaging AssociationFlexible Packaging AssociationNatural GasNatural Gas EthaneEthane PropanePropane NN--ButaneButane
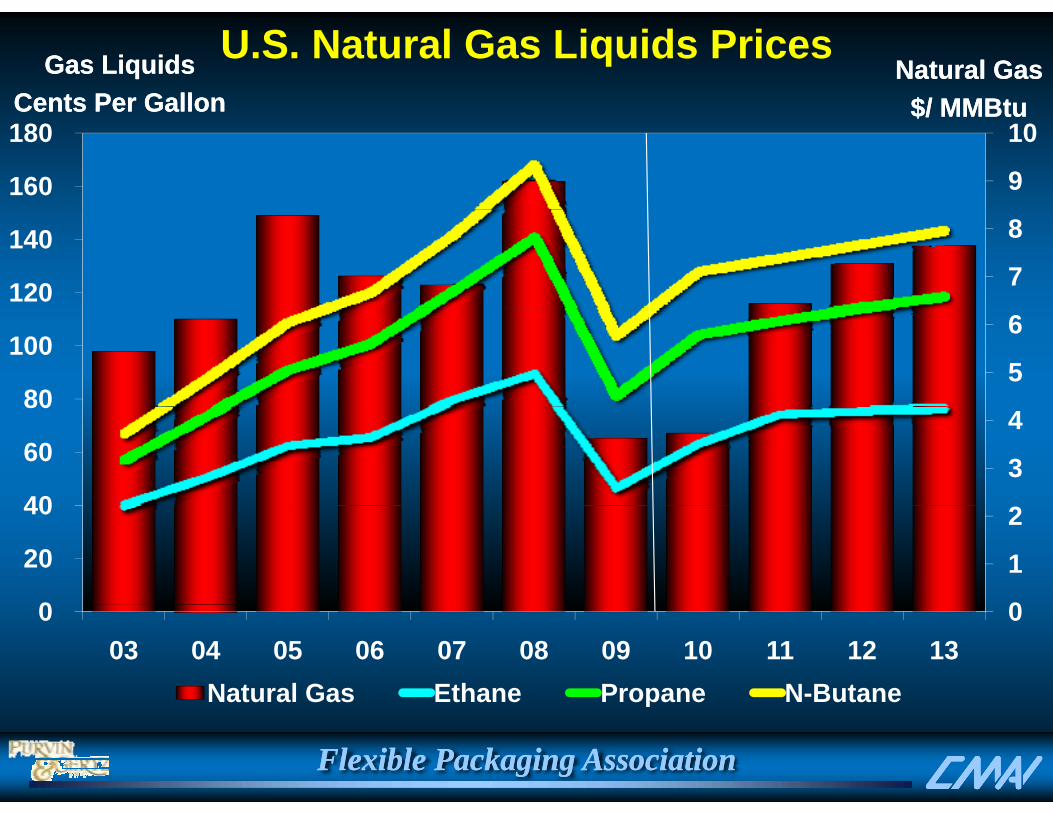
U.S. Natural Gas Liquids PricesGas LiquidsGas LiquidsCents Per GallonCents Per Gallon
Natural GasNatural Gas$/$/ MMBtuMMBtu
9
10
160
180 Cents Per GallonCents Per Gallon $/ $/ MMBtuMMBtu
7
8
120
140
5
6
80
100
3
4
40
60
80
0
1
2
0
20
40
0 0 03 04 05 06 07 08 09 10 11 12 13
Natural Gas Ethane Propane N-Butane
Flexible Packaging AssociationFlexible Packaging Association
p

Gas as % of Crude North America Energy Price Trends
Current $Current $
120%
16
18 BTU Basis$ / MM Btu
80%
100%
12
14
16
60%
80%
8
10
12
40%6
8
20%2
4
0%0 03 04 05 06 07 08 09 10 11 12 13
Crude (WTI) Natural Gas Gas as % of Crude
Flexible Packaging AssociationFlexible Packaging Association
Crude (WTI) Natural Gas Gas as % of Crude
EthyleneEthyleneEthyleneEthylene
Flexible Packaging AssociationFlexible Packaging Association

Basic Ethylene Flow ChartBasic Ethylene Flow Chart
NaphthasNaphthasCrudeCrude
••PropylenePropylene
••••ButadieneButadieneButadieneButadiene
FeedstocksFeedstocks
StSt
Gas OilsGas OilsRefineryRefinery
CrudeCrudeOilOil ••••ButylenesButylenesButylenesButylenes
••BTX BTX BTXBTX (pygas)(pygas)
SteamSteamCrackerCracker EthyleneEthyleneEthaneEthane
PropanePropaneGG ••HeavyHeavy
F i e l dF i e l dCondensatesCondensates
ButanesButanesNaturalNaturalGasGas
GasGasSeparationSeparation
UnitUnit
yyAromaticsAromatics
••MethaneMethane
••HydrogenHydrogeny gy g••Fuel OilFuel Oil
Flexible Packaging AssociationFlexible Packaging Association

United StatesUnited States2008 Ethylene Supply/Demand2008 Ethylene Supply/Demand
EthEth PEPE
y pp yy pp yProduction By FeedstockProduction By Feedstock Demand By EndDemand By End--UseUse
EthaneEthane51%51%
PEPE53%53%
OthersOthersPropanePropane
18%18%ButaneButane3%3%
NaphthaNaphthaGas OilGas Oil5%5%
OthersOthers6%6%
Ethylene Ethylene OxideOxideEDCEDCEBZEBZ
OthersOthers14%14%
3%3%17%17%5%5% 13%13%14%14%6%6%
Domestic Demand = Domestic Demand = 23.7 23.7 Million Metric TonsMillion Metric Tons
Flexible Packaging AssociationFlexible Packaging Association
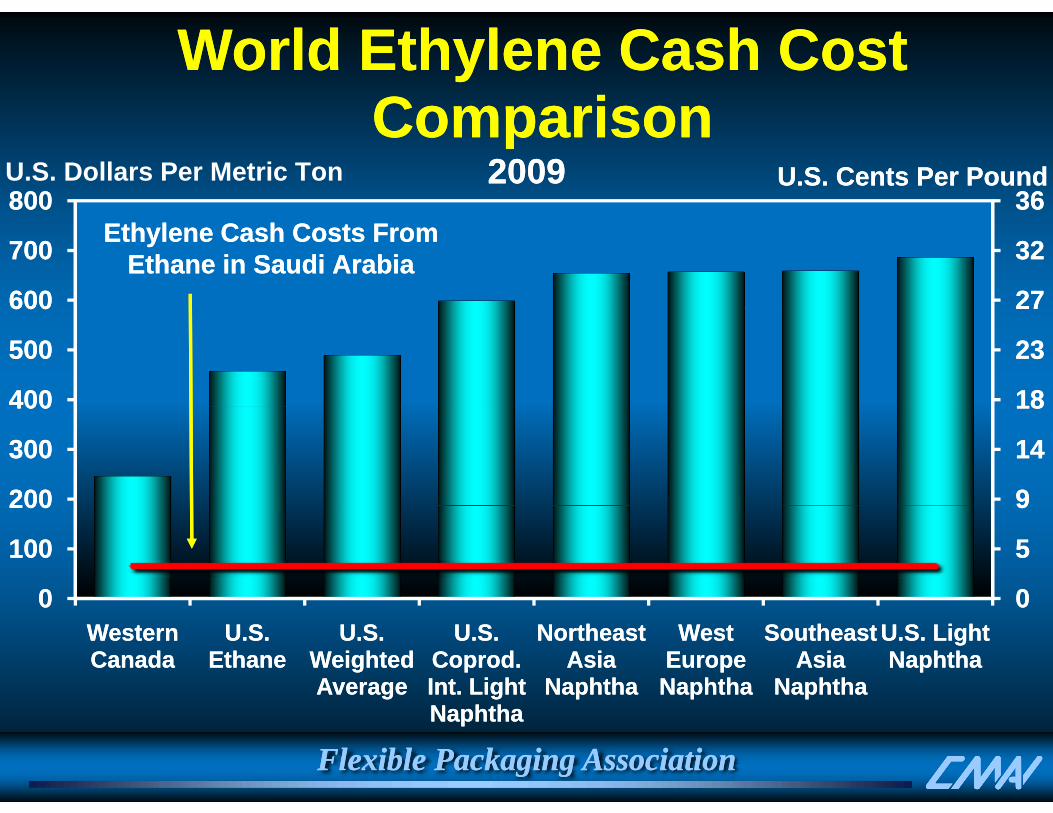
World Ethylene Cash Cost World Ethylene Cash Cost ComparisonComparison
3636800800
ComparisonComparisonU.S. Dollars Per Metric Ton U.S. Cents Per PoundU.S. Cents Per Pound20092009
2727
3232
3636
600600
700700
800800Ethylene Cash Costs From Ethylene Cash Costs From
Ethane in Saudi ArabiaEthane in Saudi Arabia
1818
2323
2727
400400
500500
600600
99
1414
1818
200200
300300
400400
00
55
99
00
100100
200200
0000Western Western CanadaCanada
U.S. U.S. EthaneEthane
U.S. U.S. Weighted Weighted AverageAverage
U.S. U.S. Coprod. Coprod. Int. Light Int. Light
Northeast Northeast Asia Asia
NaphthaNaphtha
West West Europe Europe
NaphthaNaphtha
Southeast Southeast Asia Asia
NaphthaNaphtha
U.S. Light U.S. Light NaphthaNaphtha
Flexible Packaging AssociationFlexible Packaging AssociationNaphthaNaphtha

U.S. Ethane AdvantageCents Per PoundCents Per Pound
1212
1414Cents Per PoundCents Per Pound
ForecastForecast
88
1010
44
66
00
22
44
44
--22
00
--4420032003 20042004 20052005 20062006 20072007 20082008 20092009 20102010 20112011 20122012 20132013
Propane CrackingPropane Cracking Butane CrackingButane Cracking Light Naphtha CrackingLight Naphtha Cracking
Flexible Packaging AssociationFlexible Packaging Association
Propane CrackingPropane Cracking Butane CrackingButane Cracking Light Naphtha CrackingLight Naphtha Cracking
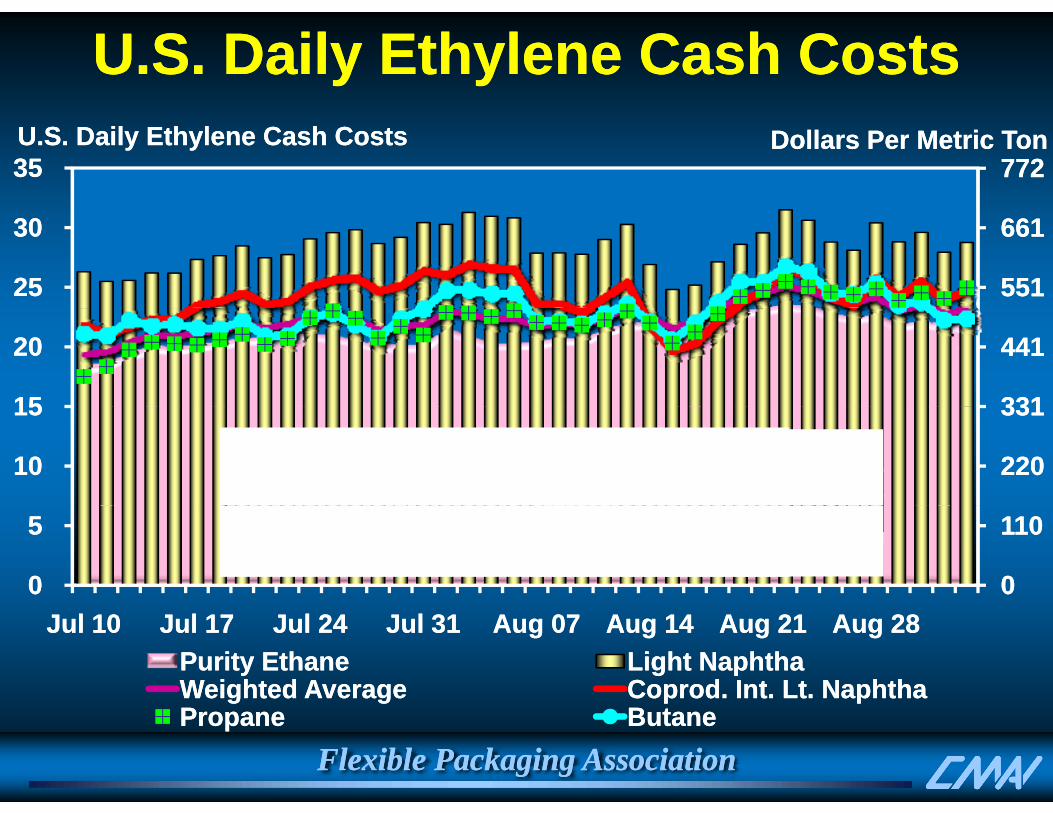
U.S. Daily Ethylene Cash CostsU.S. Daily Ethylene Cash Costs
77277235 35 U.S. Daily Ethylene Cash CostsU.S. Daily Ethylene Cash Costs Dollars Per Metric TonDollars Per Metric Ton
551551
661661
25 25
30 30
331331
441441
1515
20 20
220220
331331
10 10
15 15
00
110110
0 0
5 5
Jul 10Jul 10 Jul 17Jul 17 Jul 24Jul 24 Jul 31Jul 31 Aug 07Aug 07 Aug 14Aug 14 Aug 21Aug 21 Aug 28Aug 28Purity EthanePurity Ethane Light NaphthaLight NaphthaWeighted AverageWeighted Average Coprod. Int. Lt. NaphthaCoprod. Int. Lt. Naphtha
Flexible Packaging AssociationFlexible Packaging Association
g gg g p pp pPropanePropane ButaneButane

Global Ethylene Capacity GrowthGlobal Ethylene Capacity Growth
160160
180180Million Metric Tons
Global ethylene capacity is forecast to Global ethylene capacity is forecast to
120120
140140
160160 approach 180 million metric tons by approach 180 million metric tons by 2015, 2015, with Asia/Pacific (including India) as the with Asia/Pacific (including India) as the largest producing region. largest producing region.
8080
100100
120120
4040
6060
8080
00
2020
4040
009595 9696 9797 9898 9999 0000 0101 0202 0303 0404 0505 0606 0707 0808 0909 1010 1111 1212 1313 1414 1515
North AmericaNorth America West EuropeWest Europe Middle EastMiddle East Asia/PacificAsia/Pacific Rest of WorldRest of World
Flexible Packaging AssociationFlexible Packaging Association
North AmericaNorth America West EuropeWest Europe Middle EastMiddle East Asia/PacificAsia/Pacific Rest of WorldRest of World
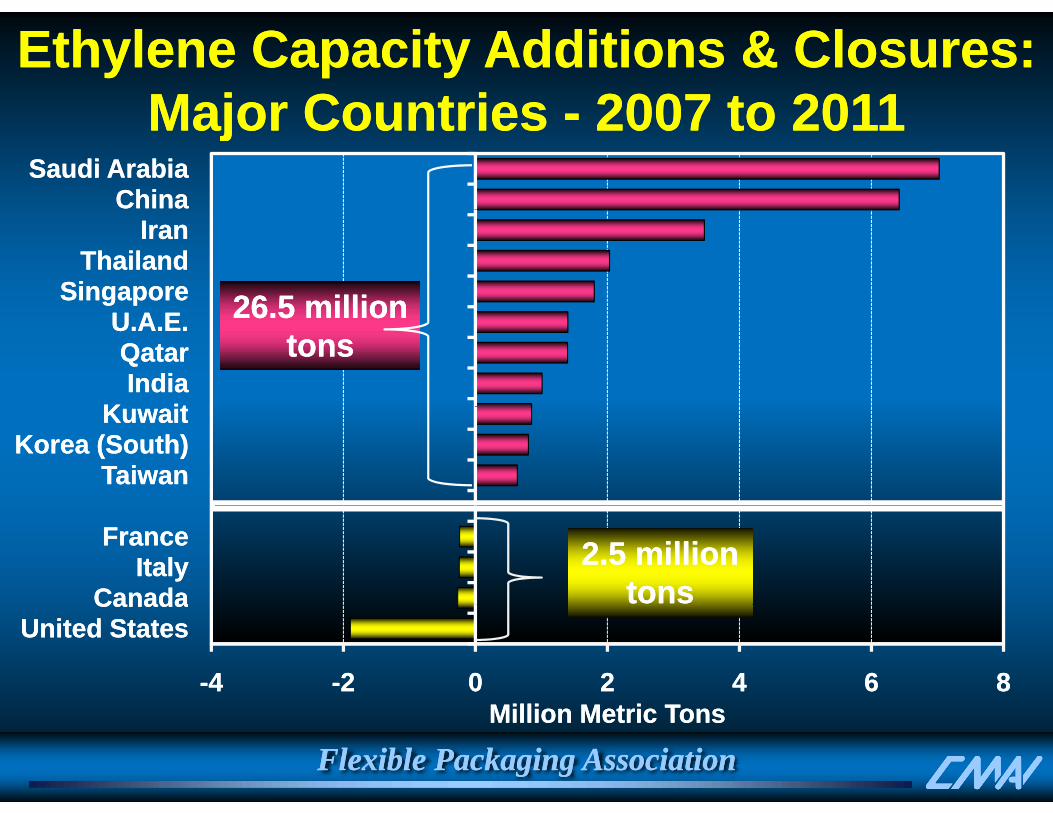
Ethylene Capacity Additions & Closures: Ethylene Capacity Additions & Closures: Major CountriesMajor Countries 2007 to 20112007 to 2011Major Countries Major Countries -- 2007 to 20112007 to 2011
ChinaChinaSaudi ArabiaSaudi Arabia
SingaporeSingaporeThailandThailand
IranIran
26 5 million26 5 million
K itK itIndiaIndiaQatarQatar
U.A.E.U.A.E. 26.5 million 26.5 million tonstons
TaiwanTaiwanKorea (South)Korea (South)
KuwaitKuwait
CanadaCanadaItalyItaly
FranceFrance 2.5 million 2.5 million tonstons
--44 --22 00 22 44 66 88
United StatesUnited StatesCanadaCanada
Flexible Packaging AssociationFlexible Packaging AssociationMillion Metric TonsMillion Metric Tons

Middle East Ethylene Capacity Middle East Ethylene Capacity Additi 2008Additi 2008 20092009Additions 2008Additions 2008--20092009
10,00010,000Ethylene Equivalent, Thousand Metric Tons
ShSh
8,0008,0009,0009,000
10,00010,000
YansabYansabRLOCRLOC
SharqSharq
5 0005 0006,0006,0007,0007,000
TKOCTKOC
PetroPetro--RabighRabigh
YansabYansab
3,0003,0004,0004,0005,0005,000
AryaArya JamJam JCPJCPSEPCSEPC
TKOCTKOC
001,0001,0002,0002,000 SasolSasol
00JanJan--0808 AprApr--0808 JulJul--0808 OctOct--0808 JanJan--0909 AprApr--0909 JulJul--0909 OctOct--0909
N Eth l C itN Eth l C it Eth l C i C itEth l C i C it
Flexible Packaging AssociationFlexible Packaging Association
New Ethylene CapacityNew Ethylene Capacity Ethylene Consuming CapacityEthylene Consuming Capacity
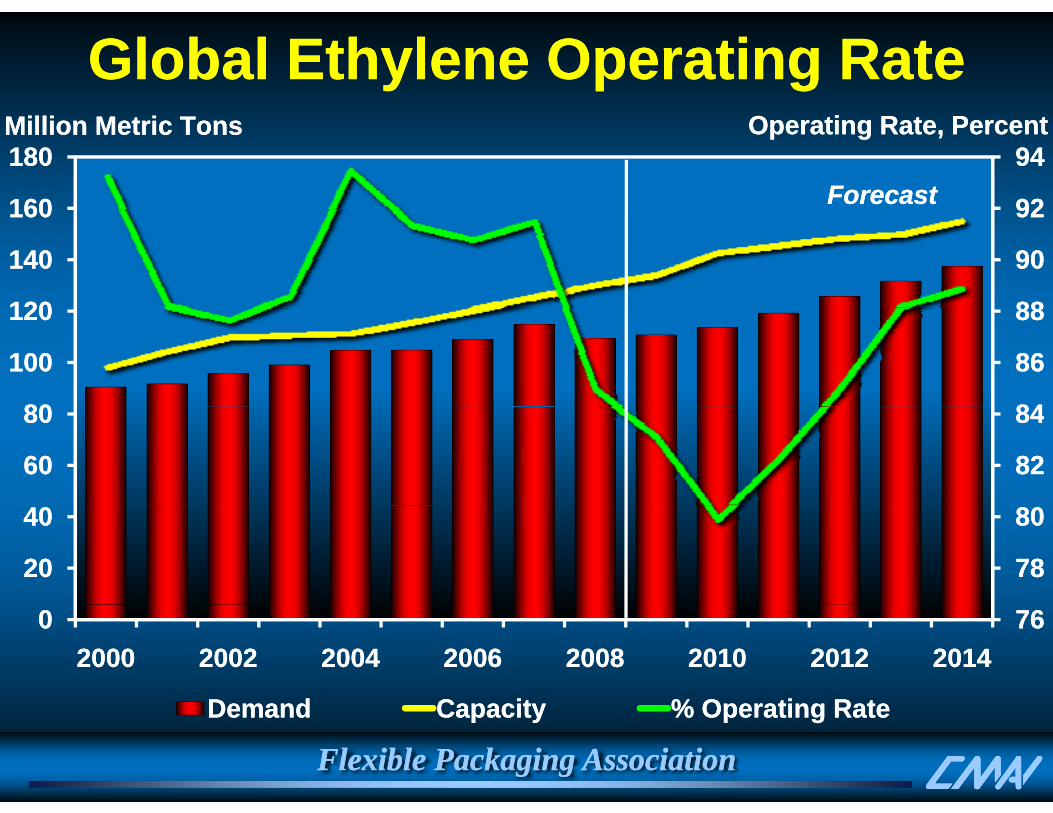
Global Ethylene Operating RateGlobal Ethylene Operating Rate
9292
9494
160160
180180Operating Rate, PercentOperating Rate, PercentMillion Metric TonsMillion Metric Tons
ForecastForecast
8888
9090
9292
120120
140140
160160
8484
8686
8888
8080
100100
120120
8282
8484
6060
8080
7878
8080
2020
4040
76760020002000 20022002 20042004 20062006 20082008 20102010 20122012 20142014
D dD d C itC it % O ti R t% O ti R t
Flexible Packaging AssociationFlexible Packaging AssociationDemandDemand CapacityCapacity % Operating Rate% Operating Rate

Billion PoundsBillion PoundsU.S. Ethylene Supply/Demand OutlookU.S. Ethylene Supply/Demand Outlook
Operating RateOperating Rate
100%100%1616
1717Billion PoundsBillion Pounds
ForecastForecast
Operating RateOperating Rate
90%90%
95%95%
100%100%
1414
1515
1616
85%85%
90%90%
1313
1414
75%75%
80%80%
1111
1212
65%65%
70%70%
99
1010
65%65%990101 Q4Q4 Q3Q3 Q2Q2 0404 Q4Q4 Q3Q3 Q2Q2 0707 Q4Q4 Q3Q3 Q2Q2 1010 Q4Q4
Total DemandTotal Demand Effective Operating RateEffective Operating Rate Nameplate Operating RateNameplate Operating Rate
Flexible Packaging AssociationFlexible Packaging Association
Total DemandTotal Demand Effective Operating RateEffective Operating Rate Nameplate Operating RateNameplate Operating Rate

Dollars Per Metric Ton
Global Monthly Ethylene PricesGlobal Monthly Ethylene Prices
1,8001,800
2,0002,000Dollars Per Metric Ton
ForecastForecast
1,4001,400
1,6001,600
,,
1 0001 000
1,2001,200
1,4001,400
600600
800800
1,0001,000
400400
600600
2002000707 AA JJ OO 0808 AA JJ OO 0909 AA JJ OO 1010 AA JJ OO
U S L B C t t P iU S L B C t t P i WEP C t t P iWEP C t t P i SEA CFR S t P iSEA CFR S t P i
Flexible Packaging AssociationFlexible Packaging AssociationU.S. Large Buyer Contract PriceU.S. Large Buyer Contract Price WEP Contract PriceWEP Contract Price SEA CFR Spot PriceSEA CFR Spot Price
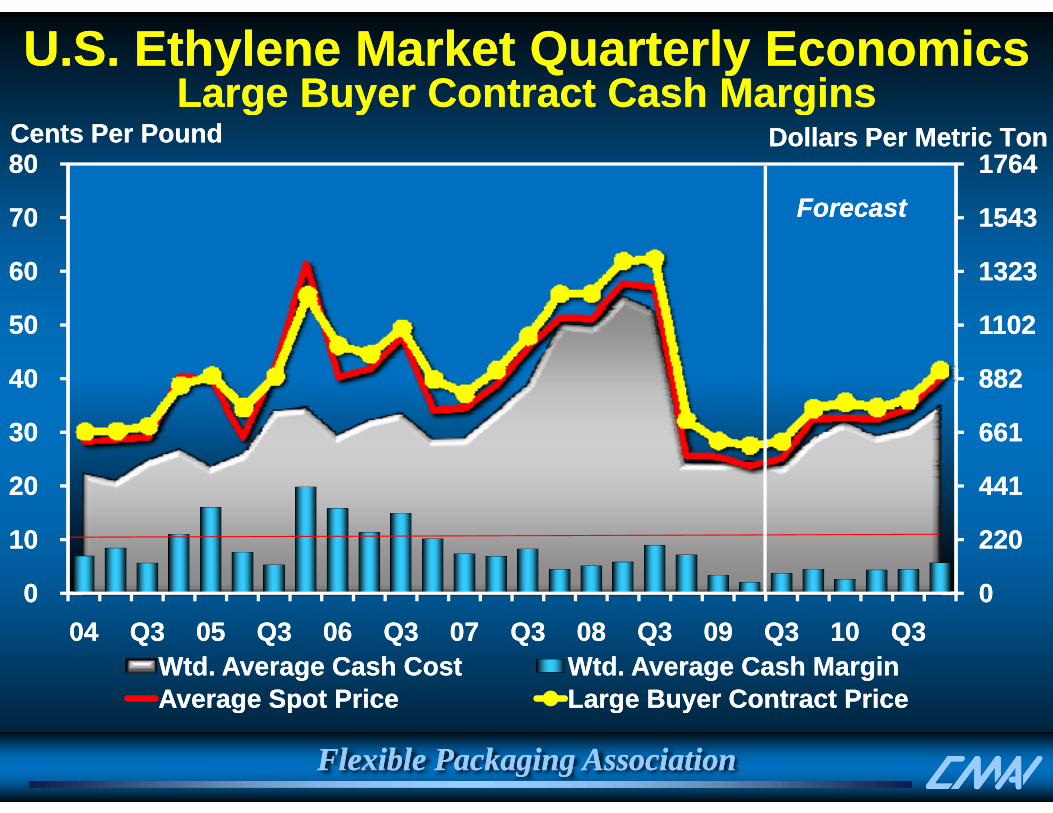
U.S. Ethylene Market Quarterly EconomicsU.S. Ethylene Market Quarterly EconomicsLarge Buyer Contract Cash MarginsLarge Buyer Contract Cash Margins
15431543
1764 1764
7070
80 80 ForecastForecast
Dollars Per Metric TonDollars Per Metric TonCents Per PoundCents Per Poundg y gg y g
1323 1323
1543 1543
60 60
70 70 ForecastForecast
882 882
1102 1102
40 40
50 50
441 441
661 661
20 20
30 30
0 0
220 220
0 0
10 10
0404 Q3Q3 0505 Q3Q3 0606 Q3Q3 0707 Q3Q3 0808 Q3Q3 0909 Q3Q3 1010 Q3Q3Wtd. Average Cash CostWtd. Average Cash Cost Wtd. Average Cash MarginWtd. Average Cash MarginAverage Spot PriceAverage Spot Price Large Buyer Contract PriceLarge Buyer Contract Price
Flexible Packaging AssociationFlexible Packaging Association
Average Spot PriceAverage Spot Price Large Buyer Contract PriceLarge Buyer Contract Price

U.S. Ethylene ConclusionsU.S. Ethylene Conclusions Oversupply and weak demand Oversupply and weak demand
result in long marketresult in long market Oversupply and weak demand Oversupply and weak demand
result in long marketresult in long marketresult in long marketresult in long market Olefins markets clearly in the Olefins markets clearly in the
trough, margins squeezed, prices trough, margins squeezed, prices
result in long marketresult in long market Olefins markets clearly in the Olefins markets clearly in the
trough, margins squeezed, prices trough, margins squeezed, prices trending upwardtrending upward
Heavy feed crackers challenged Heavy feed crackers challenged b d il i t lb d il i t l
trending upwardtrending upward Heavy feed crackers challenged Heavy feed crackers challenged
b d il i t lb d il i t lby crude oil prices vs. natural by crude oil prices vs. natural gasgas
North America ethyleneNorth America ethylene
by crude oil prices vs. natural by crude oil prices vs. natural gasgas
North America ethyleneNorth America ethylene North America ethylene North America ethylene derivative exports supported by derivative exports supported by favorable crudefavorable crude--toto--gas ratiogas ratio
North America ethylene North America ethylene derivative exports supported by derivative exports supported by favorable crudefavorable crude--toto--gas ratiogas ratio
Significant capacity reductions Significant capacity reductions are inevitableare inevitable
Significant capacity reductions Significant capacity reductions are inevitableare inevitable
Flexible Packaging AssociationFlexible Packaging Association
P l th lP l th lPolyethylenePolyethylene
Flexible Packaging AssociationFlexible Packaging Association

Since January of 09Since January of 09•• Several major resin producers were facing economic distress (Dow, LBI, Nova, Several major resin producers were facing economic distress (Dow, LBI, Nova, j p g ( , , ,j p g ( , , ,
IneosIneos etc..) and needed to take corrective action or collapse . They etc..) and needed to take corrective action or collapse . They closed closed plantsplants, , raised pricesraised prices, , controlled inventorycontrolled inventory, and took advantage of a lucrative , and took advantage of a lucrative exportexport market.market.
•• Exports became very attractive because the recession and startExports became very attractive because the recession and start--up problems up problems delayed the impact of new MDE capacity and delayed the impact of new MDE capacity and opened the window opened the window for for competitively produced US exports. competitively produced US exports.
•• A very favorable A very favorable crude oil to nat. gascrude oil to nat. gas price ratio developed leaving US price ratio developed leaving US d ll iti d t l l b l k t A f M h USd ll iti d t l l b l k t A f M h USproducers well positioned to supply global markets. As of March, US producers well positioned to supply global markets. As of March, US
producers have been exporting record volumes to China.producers have been exporting record volumes to China.
E b k d d h d f biE b k d d h d f bi b d ib d i•• Export netbacks exceeded the returns generated from bigExport netbacks exceeded the returns generated from big--buyer domestic buyer domestic sales Some producers shipping nearly 40 % of production overseas.sales Some producers shipping nearly 40 % of production overseas.
•• The strong export market allowed producers to keep inventories low, and The strong export market allowed producers to keep inventories low, and effective operating rates high despite a very weak domestic market. As a effective operating rates high despite a very weak domestic market. As a result they have been able raise prices (13 result they have been able raise prices (13 cppcpp since Jan for PE) and improve since Jan for PE) and improve
i Th t d lik l di t i t t ii Th t d lik l di t i t t i
Flexible Packaging AssociationFlexible Packaging Associationmargins. They turned a likely disaster year into a very strong earnings year.margins. They turned a likely disaster year into a very strong earnings year.
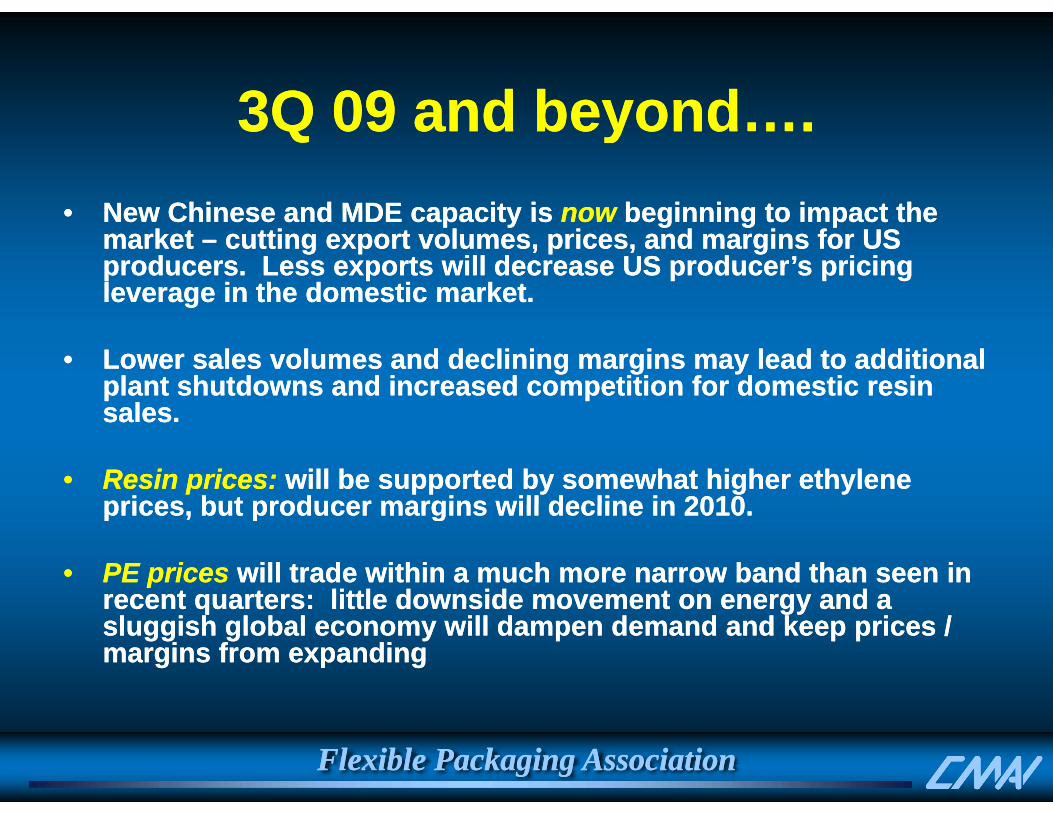
3Q 09 and beyond3Q 09 and beyond3Q 09 and beyond….3Q 09 and beyond….•• New Chinese and MDE capacity isNew Chinese and MDE capacity is nownow beginning to impact thebeginning to impact the•• New Chinese and MDE capacity is New Chinese and MDE capacity is nownow beginning to impact the beginning to impact the
market market –– cutting export volumes, prices, and margins for US cutting export volumes, prices, and margins for US producers. Less exports will decrease US producer’s pricing producers. Less exports will decrease US producer’s pricing leverage in the domestic market. leverage in the domestic market.
•• Lower sales volumes and declining margins may lead to additional Lower sales volumes and declining margins may lead to additional plant shutdowns and increased competition for domestic resin plant shutdowns and increased competition for domestic resin
llsales. sales.
•• Resin prices: Resin prices: will be supported by somewhat higher ethylene will be supported by somewhat higher ethylene prices but producer margins will decline in 2010prices but producer margins will decline in 2010prices, but producer margins will decline in 2010.prices, but producer margins will decline in 2010.
•• PE prices PE prices will trade within a much more narrow band than seen in will trade within a much more narrow band than seen in recent quarters: little downside movement on energy and arecent quarters: little downside movement on energy and arecent quarters: little downside movement on energy and a recent quarters: little downside movement on energy and a sluggish global economy will dampen demand and keep prices / sluggish global economy will dampen demand and keep prices / margins from expandingmargins from expanding
Flexible Packaging AssociationFlexible Packaging Association

3Q and beyond cont3Q and beyond cont3Q and beyond cont…3Q and beyond cont…
•• Resin Imports: Resin Imports: The relative strength of the US cost The relative strength of the US cost position along with the logistics constraints position along with the logistics constraints should minimize imports into the US. should minimize imports into the US.
•• Despite the delays, the new capacity in MDE andDespite the delays, the new capacity in MDE andDespite the delays, the new capacity in MDE and Despite the delays, the new capacity in MDE and China is coming and the industry is approaching China is coming and the industry is approaching record levels of overcapacity.record levels of overcapacity.p yp y
Flexible Packaging AssociationFlexible Packaging Association 2525
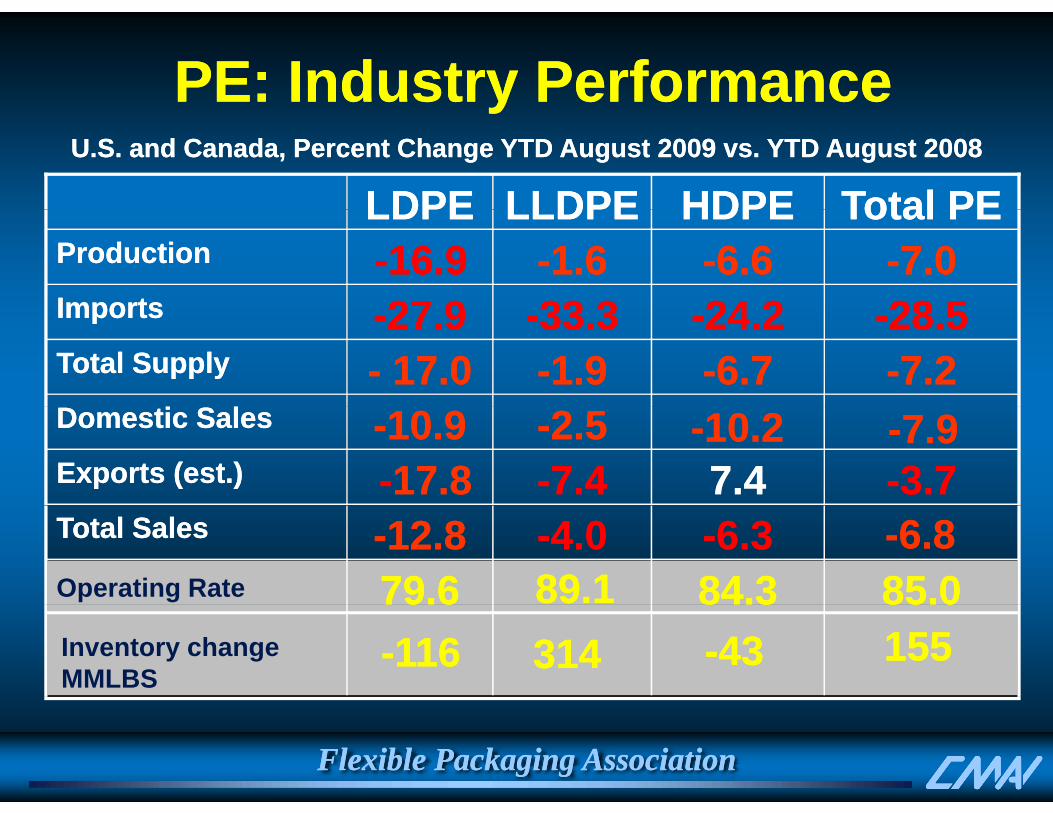
PE: Industry PerformancePE: Industry Performance
Total PETotal PEHDPEHDPELLDPELLDPELDPELDPEU.S. and Canada, Percent Change YTD August 2009 vs. YTD August 2008U.S. and Canada, Percent Change YTD August 2009 vs. YTD August 2008
yy
28 528 524 224 233 333 327 927 9ImportsImports--7.07.0--6.66.6--1.61.6--16.916.9ProductionProduction
Total PETotal PEHDPEHDPELLDPELLDPELDPELDPE
SS--7.27.2--6.76.7--1.91.9-- 17.017.0Total SupplyTotal Supply--28.528.5--24.224.2--33.333.3--27.927.9ImportsImports
--3.73.77.47.4--7.47.4--17.817.8Exports (est.)Exports (est.)--2.52.5--10.910.9Domestic SalesDomestic Sales --10.210.2 --7.97.9
85.085.084.384.389.189.179.679.6Operating Rate
--6.36.3--4.04.0--12.812.8Total SalesTotal Sales --6.86.8
155155--4343314314--116116Inventory change MMLBS
85.085.084.384.379.679.6
Flexible Packaging AssociationFlexible Packaging Association
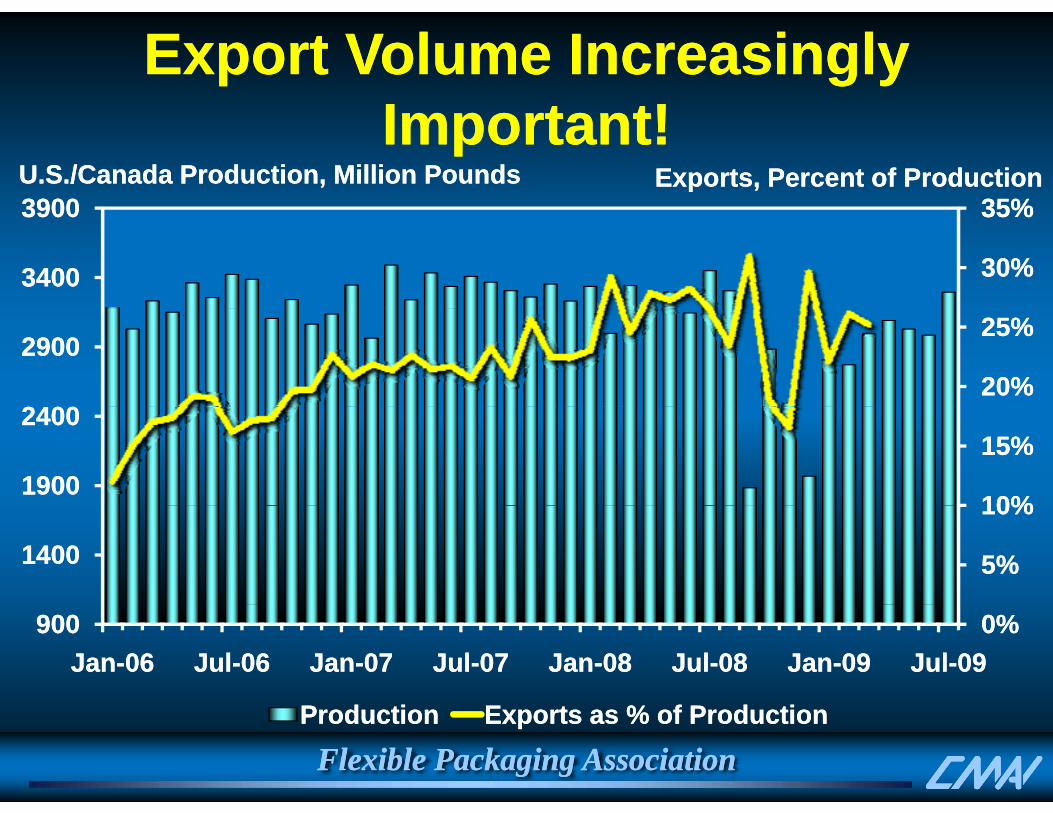
Export Volume Increasingly Export Volume Increasingly I t t!I t t!
35%35%39003900
Important!Important!U.S./Canada ProductionU.S./Canada Production, Million Pounds, Million Pounds Exports, Percent of ProductionExports, Percent of Production
30%30%
35%35%
34003400
39003900
20%20%
25%25%
24002400
29002900
10%10%
15%15%19001900
24002400
5%5%
10%10%
14001400
0%0%900900JanJan--0606 JulJul--0606 JanJan--0707 JulJul--0707 JanJan--0808 JulJul--0808 JanJan--0909 JulJul--0909
Flexible Packaging AssociationFlexible Packaging AssociationProductionProduction Exports as % of ProductionExports as % of Production

U.S. PE ExportsU.S. PE ExportsThousand Metric TonsThousand Metric Tons
450450
500500Thousand Metric TonsThousand Metric Tons
350350
400400
250250
300300
100100
150150
200200
00
5050
100100
000606 MM MM JJ SS NN 0707 MM MM JJ SS NN 0808 MM MM JJ SS NN 0909 MM MM
Total Selected RegionsTotal Selected Regions N AmericaN America S AmericaS America EuropeEurope Far EastFar East OtherOther
Flexible Packaging AssociationFlexible Packaging Association
Total Selected RegionsTotal Selected Regions N.AmericaN.America S.AmericaS.America EuropeEurope Far EastFar East OtherOther

U.S./Canada PE Film Resin Quarterly Demand
35003500
Quarterly DemandMillion PoundsMillion Pounds
ForecastForecast
30003000
25002500
20002000
10001000
15001500
100010000303 Q3Q3 0404 Q3Q3 0505 Q3Q3 0606 Q3Q3 0707 Q3Q3 0808 Q3Q3 0909 Q3Q3 1010 Q3Q3
Film Resin DemandFilm Resin Demand
Flexible Packaging AssociationFlexible Packaging AssociationSource: ACCSource: ACC, Plastics Division; , Plastics Division; Gov’tGov’t Trade DataTrade Data

HDPE Film Resin Demand July YTDHDPE Film Resin Demand July YTDHDPE Film Resin Demand July YTDHDPE Film Resin Demand July YTD
HDPEHDPE Percent ChangePercent ChangeFilm 12 Mils and BelowFilm 12 Mils and Below --2.12.1
Packaging FilmPackaging Film --8.38.3Food Packaging FilmFood Packaging Film --1.31.3NonNon--Food Packaging FilmFood Packaging Film --15.015.0
NonNon--Packaging FilmPackaging Film 0.60.6Retail BagsRetail Bags --2.82.8Trash and Can LinersTrash and Can Liners 10.410.4Other NonOther Non--Packaging FilmPackaging Film --28.028.0
Flexible Packaging AssociationFlexible Packaging AssociationSource: ACCSource: ACC, Plastics Division; , Plastics Division; Gov’tGov’t Trade DataTrade Data

LLDPE Film Resin Demand July YTDLLDPE Film Resin Demand July YTDyy
LLDPELLDPE Percent ChangePercent Change22--7.27.2
--6.86.87 37 3
Film (12 Mils and Below)Film (12 Mils and Below)Packaging FilmPackaging FilmFood Packaging FilmFood Packaging Film --7.37.3
--14.014.0--7 87 8
NonNon--Food Packaging FilmFood Packaging FilmNonNon--Packaging FilmPackaging Film
Food Packaging FilmFood Packaging Film
7.87.8NonNon--Packaging FilmPackaging Film
Flexible Packaging AssociationFlexible Packaging AssociationSource: ACCSource: ACC, Plastics Division; , Plastics Division; Gov’tGov’t Trade DataTrade Data
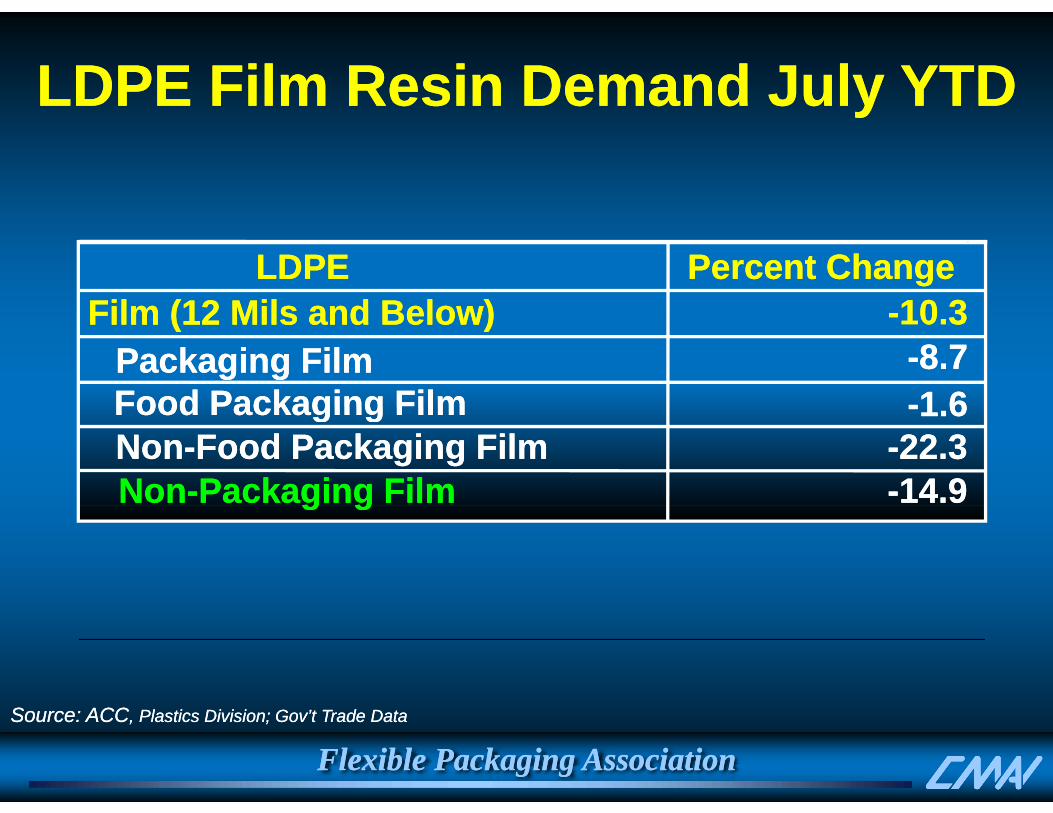
LDPE Film Resin Demand July YTDLDPE Film Resin Demand July YTDyy
LDPELDPE Percent ChangePercent Change10 310 3Film (12 Mils and Below)Film (12 Mils and Below) --10.310.3--8.78.7--1 61 6
Film (12 Mils and Below)Film (12 Mils and Below)Packaging FilmPackaging FilmFoodFood Packaging FilmPackaging Film --1.61.6NonNon--Food Packaging FilmFood Packaging Film --22.322.3NonNon--Packaging FilmPackaging Film --14.914.9
FoodFood Packaging FilmPackaging Film
g gg g
Flexible Packaging AssociationFlexible Packaging AssociationSource: ACCSource: ACC, Plastics Division; , Plastics Division; Gov’tGov’t Trade DataTrade Data
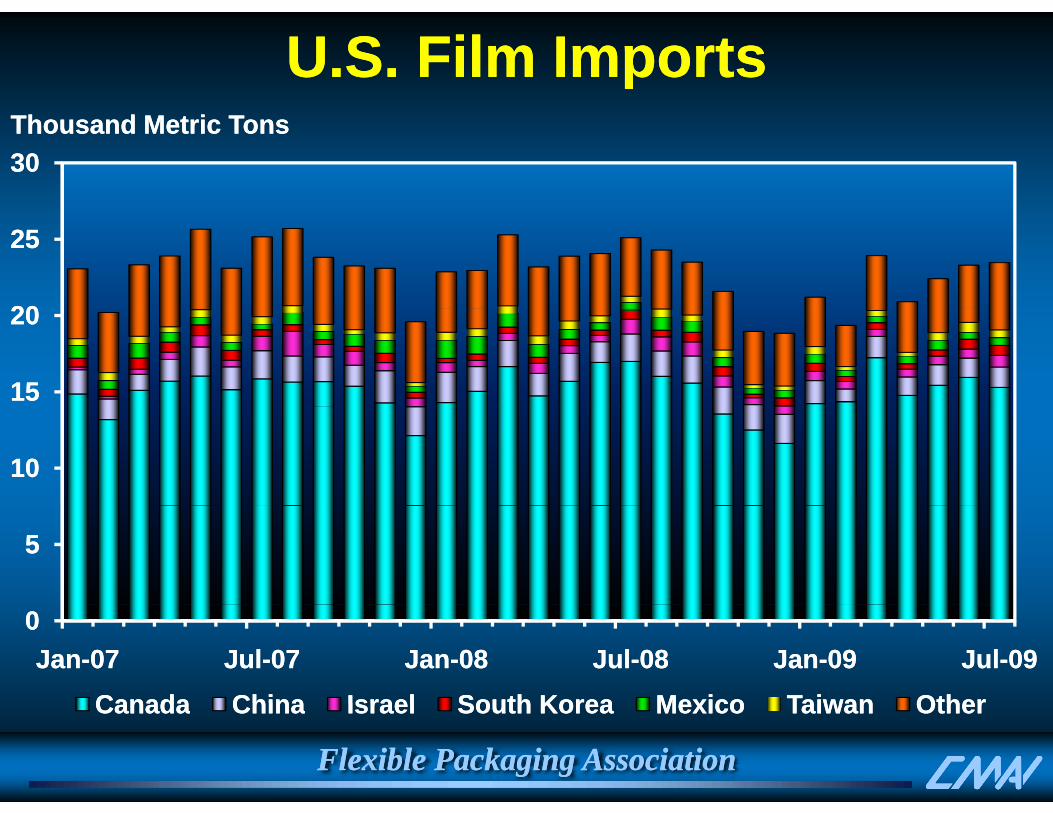
U.S. Film ImportsU.S. Film Imports3030Thousand Metric TonsThousand Metric Tons
2020
2525
1515
2020
1010
55
00JanJan--0707 JulJul--0707 JanJan--0808 JulJul--0808 JanJan--0909 JulJul--0909
CanadaCanada ChinaChina IsraelIsrael South KoreaSouth Korea MexicoMexico TaiwanTaiwan OtherOther
Flexible Packaging AssociationFlexible Packaging Association
CanadaCanada ChinaChina IsraelIsrael South KoreaSouth Korea MexicoMexico TaiwanTaiwan OtherOther
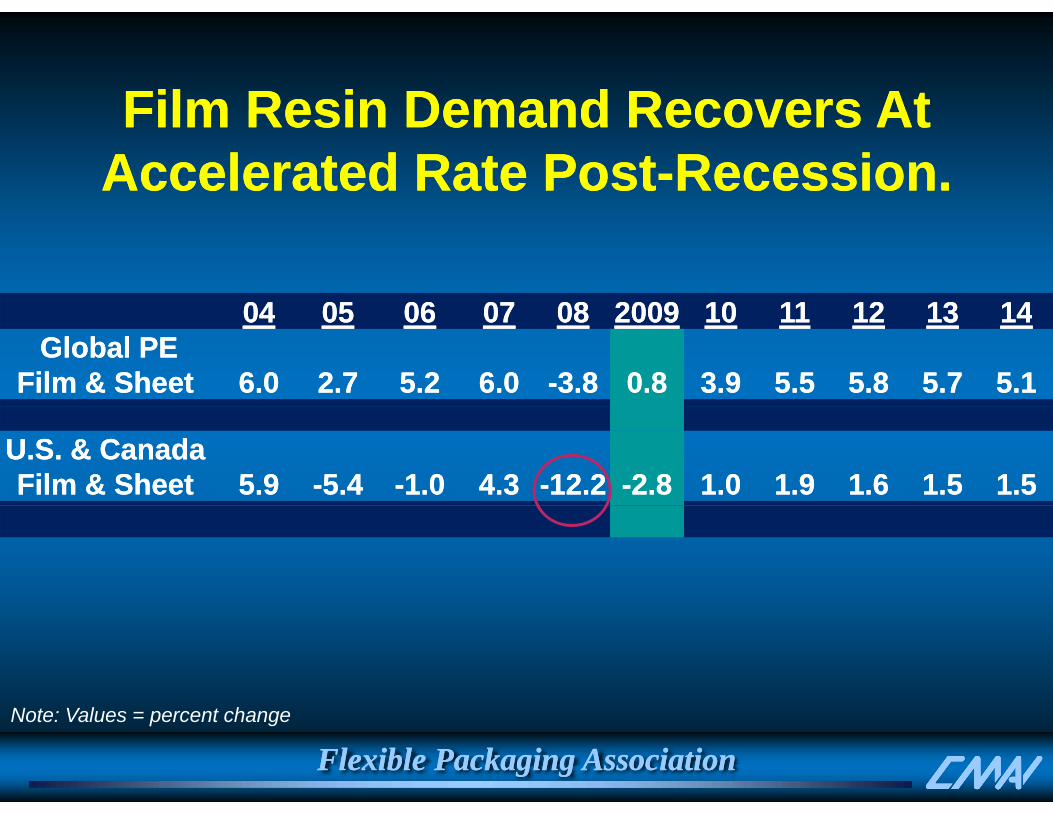
Film Resin Demand Recovers AtFilm Resin Demand Recovers AtFilm Resin Demand Recovers At Film Resin Demand Recovers At Accelerated Rate PostAccelerated Rate Post--Recession.Recession.
0404 0505 0606 0707 0808 20092009 1010 1111 1212 1313 14140404 0505 0606 0707 0808 20092009 1010 1111 1212 1313 1414Global PE Global PE
Film Film & Sheet& Sheet 6.06.0 2.72.7 5.25.2 6.06.0 --3.83.8 0.80.8 3.93.9 5.55.5 5.85.8 5.75.7 5.15.1
U.S. & CanadaU.S. & CanadaFilm & SheetFilm & Sheet 5.95.9 --5.45.4 --1.01.0 4.34.3 --12.212.2 --2.82.8 1.01.0 1.91.9 1.61.6 1.51.5 1.51.5
Flexible Packaging AssociationFlexible Packaging AssociationNote: Values = percent change
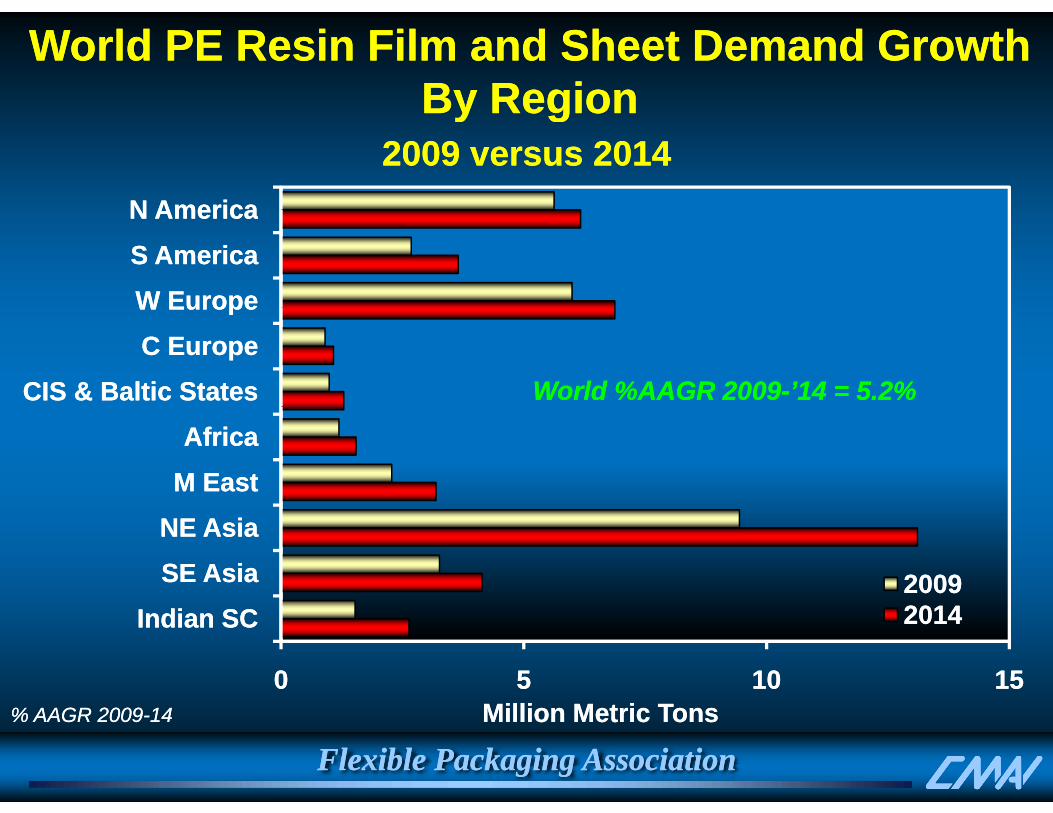
World World PE Resin PE Resin Film and Sheet Demand Film and Sheet Demand Growth Growth ByBy RegionRegion
N AmericaN America
2009 2009 versus versus 20142014By By RegionRegion
W EuropeW EuropeS AmericaS AmericaN AmericaN America
CIS & Baltic StatesCIS & Baltic StatesC EuropeC EuropeW EuropeW Europe
World %AAGR 2009World %AAGR 2009--’14 = 5.2%’14 = 5.2%
M EastM EastAfricaAfrica
SE AsiaSE AsiaNE AsiaNE Asia
20092009
00 55 1010 1515
Indian SCIndian SC 20142014
Flexible Packaging AssociationFlexible Packaging AssociationMillion Metric TonsMillion Metric Tons% AAGR 2009% AAGR 2009--1414

PolyethylenePolyethylene Capacity ChangesCapacity ChangesNAMNAM WEPWEP MDEMDE NEA / SEA / ISCNEA / SEA / ISC Net Net
IncreaseIncreaseCompanyCompany ktakta CompanyCompany ktakta CompanyCompany ktakta CompanyCompany ktaktaCompanyCompany ktakta CompanyCompany ktakta CompanyCompany ktakta CompanyCompany ktakta
1Q-0
9 LBI USA LD (68) SABIC GFR HD x 150 Jam PC IRN HD/LL 300 PT Titan INO HD/LL x 50 Honam KOS LL x 70
502502
9
Dow USA LD (100) SEPC KSA LD 400 Reliance IND HD 90 P t R bi h KSA HD 300
2Q-0
9 Petro-Rabigh KSA HD 300 Laleh IRN LD 300 TKOC KUW HD/LL 225 Arya Sasol IRN HD 300 1515 1515
LBILBI USAUSA HDHD (181)(181) LBILBI FRAFRA LDLD (110)(110) Mehr PC IRN HD 300 Secco CHI HD/LL x 150
3Q-0
9 FPCFPC USAUSA HD xHD x 42 42 SABIC UK LD 400 Petro-Rabigh KSA LL 600 FujianFujian CHICHI HD/LLHD/LL 800 800 Flint HillsFlint Hills USAUSA LLLL (150)(150) YansabYansab KSAKSA LLLL 500 500 DushanziDushanzi CHICHI HDHD 300 300 Flint HillsFlint Hills USAUSA LDLD (194)(194) DushanziDushanzi CHICHI HD/LLHD/LL 600 600
Shenyang ParaffinShenyang Paraffin CHICHI HD/LLHD/LL 120 120 3177 3177 TotalTotal FRAFRA LDLD (230)(230) QatofinQatofin QATQAT LLLL 450450 PanjinPanjin EthEth CHICHI HD/LLHD/LL 300300
4Q-0
9
TotalTotal FRAFRA LDLD (230)(230) QatofinQatofin QATQAT LLLL 450 450 PanjinPanjin Eth.Eth. CHICHI HD/LLHD/LL 300 300 Total Total FRAFRA LDLD (160)(160) Bangkok PEBangkok PE THATHA HDHD 250 250 SABICSABIC NETNET LDLD (120)(120) SHARQSHARQ KSAKSA HDHD 400 400 PTT PTT ChemChem THATHA LLLL 400 400 BorealisBorealis SWESWE HD/LLHD/LL (90)(90) SHARQSHARQ KSAKSA LLLL 400 400 PTT PTT ChemChem THATHA HD xHD x 50 50
Amir Amir KabirKabir IRNIRN LDLD 300 300 1950 1950
1Q-1
0 BorealisBorealis SWESWE LDLD 350350 YansabYansab KSAKSA HDHD 400400 GailGail INDIND LL xLL x 5050LBILBI GFRGFR HDHD 250250 QQ--ChemChem IIII QATQAT HDHD 350 350 Tianjin PCTianjin PC CHICHI HD/LLHD/LL 600600
2000 2000 BorealiBorealiss BELBEL HDHD (200)(200) Indian OilIndian Oil INDIND HDHD 300300
2Q-1
0
ss BELBEL HDHD (200)(200) Indian OilIndian Oil INDIND HDHD 300300Indian OilIndian Oil INDIND HD/LLHD/LL 350350PTT PTT ChemChem THATHA LDLD 300300Baotou Baotou ShenhuaShenhua CHICHI HD/LLHD/LL 300300ZRCCZRCC CHICHI HD/LLHD/LL 450450MOCMOC THATHA LLLL 300300
Flexible Packaging AssociationFlexible Packaging Association
MOCMOC THATHA LLLL 300300TPETPE THATHA HDHD 400400 2200 2200

Still Too Much CapacityStill Too Much Capacity
9595
100100
2020
2424Million Metric TonsMillion Metric Tons Operating Rate, PercentOperating Rate, Percent
9090
9595
1616
2020
8080
8585
88
1212
7070
7575
00
44
6060
6565
--88
--44
19971997 19991999 20012001 20032003 20052005 20072007 20092009 20112011 20132013
Capacity Increase Capacity Increase -- Demand IncreaseDemand Increase Cummulative Delta CapsCummulative Delta Caps--Delta DemDelta DemO ti R tO ti R t
Flexible Packaging AssociationFlexible Packaging AssociationOperating RateOperating Rate

Energy: PE Price DriverEnergy: PE Price Driver25002500140140
U.S. Dollars Per BarrelU.S. Dollars Per Barrel LLDPE, U.S. Dollars Per TonLLDPE, U.S. Dollars Per Ton
ForecastForecast
20002000100100
120120ForecastForecast
15001500
6060
8080
500500
10001000
4040
6060
00
500500
00
2020
JanJan--0707 JulJul--0707 JanJan--0808 JulJul--0808 JanJan--0909 JulJul--0909 JanJan--1010 JulJul--1010
Naphtha SEANaphtha SEA Dubai Crude OilDubai Crude Oil LLDPE CFR ChinaLLDPE CFR ChinaLLDPE NAMLLDPE NAM LLDPE WEPLLDPE WEP
Flexible Packaging AssociationFlexible Packaging AssociationLLDPE NAMLLDPE NAM LLDPE WEPLLDPE WEP
Dollars Per Metric TonDollars Per Metric Ton
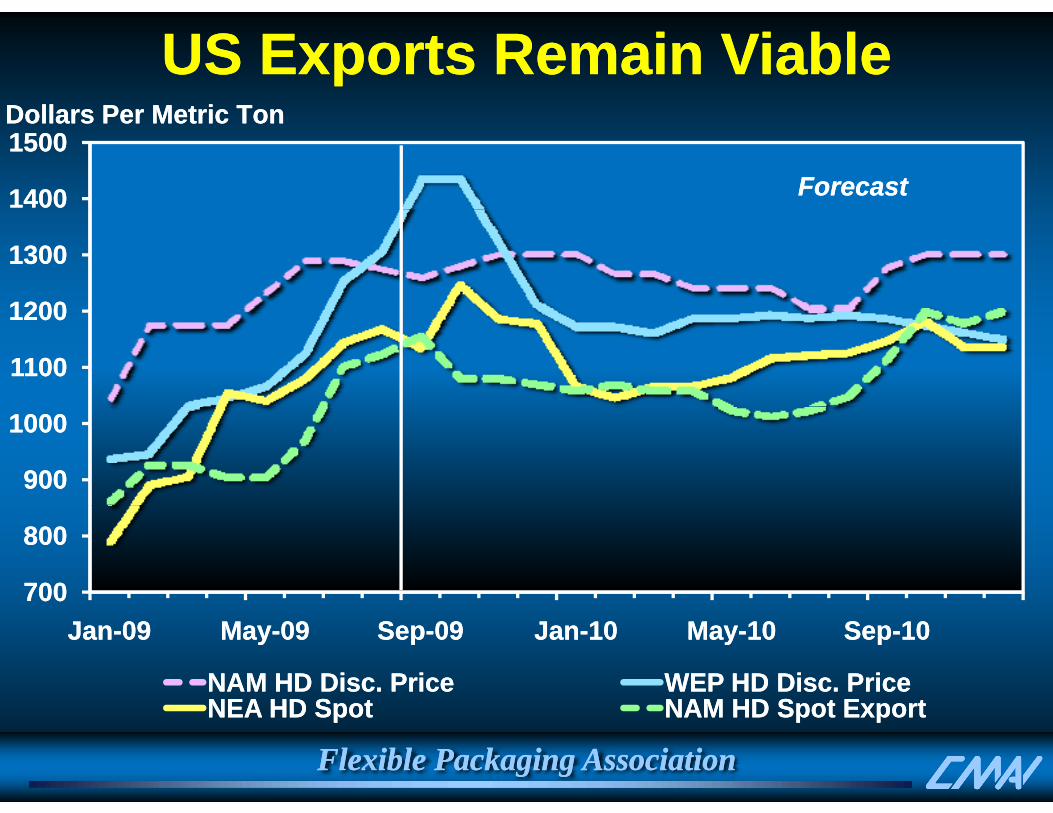
US Exports Remain Viable US Exports Remain Viable
14001400
15001500Dollars Per Metric TonDollars Per Metric Ton
ForecastForecast
12001200
13001300
11001100
12001200
900900
10001000
700700
800800
JanJan--0909 MayMay--0909 SepSep--0909 JanJan--1010 MayMay--1010 SepSep--1010
NAM HD Disc. PriceNAM HD Disc. Price WEP HD Disc. PriceWEP HD Disc. PriceNEA HD S tNEA HD S t NAM HD S t E tNAM HD S t E t
Flexible Packaging AssociationFlexible Packaging Association
NEA HD Spot NEA HD Spot NAM HD Spot ExportNAM HD Spot Export
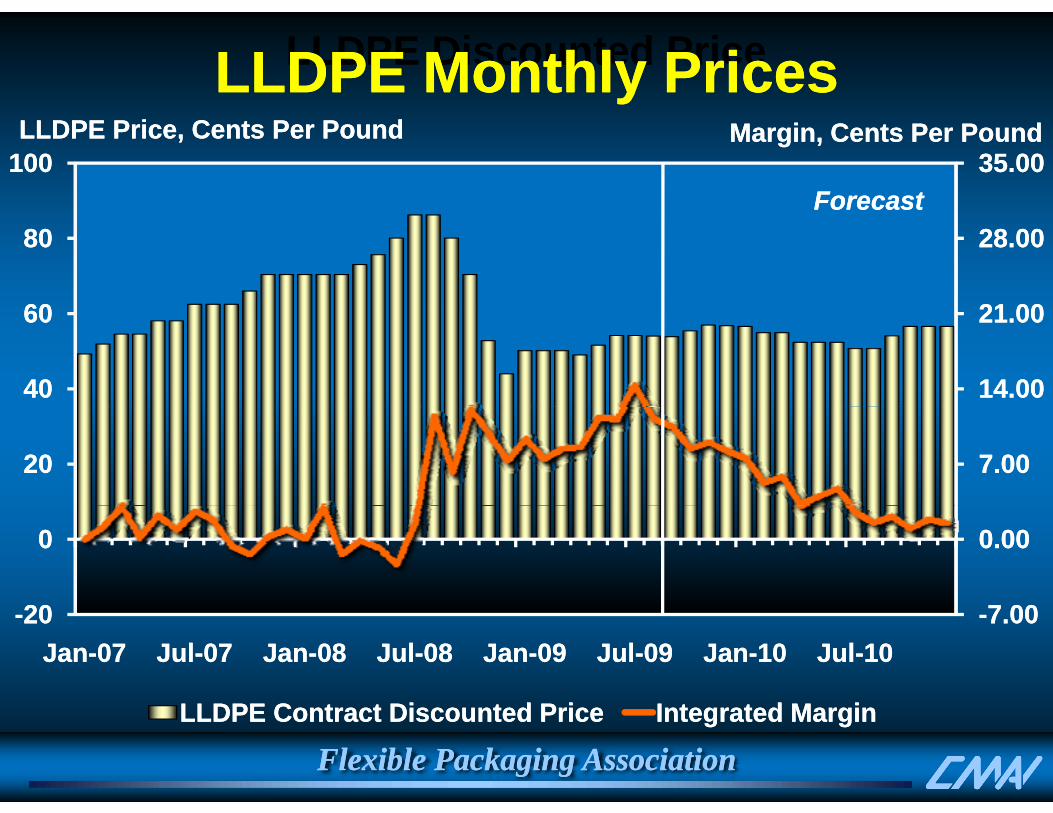
LLDPE Discounted PriceLLDPE Monthly PricesLLDPE Monthly Prices35.0035.00100100
LLDPE Price, CentsLLDPE Price, Cents Per PoundPer Pound Margin,Margin, Cents Per PoundCents Per Pound
ForecastForecast
21 0021 00
28.0028.00
6060
8080ForecastForecast
14.0014.00
21.0021.00
4040
6060
7.007.002020
0.000.0000
--7.007.00--2020JanJan--0707 JulJul--0707 JanJan--0808 JulJul--0808 JanJan--0909 JulJul--0909 JanJan--1010 JulJul--1010
LLDPE C Di d P iLLDPE C Di d P i I d M iI d M i
Flexible Packaging AssociationFlexible Packaging AssociationLLDPE Contract Discounted PriceLLDPE Contract Discounted Price Integrated MarginIntegrated Margin
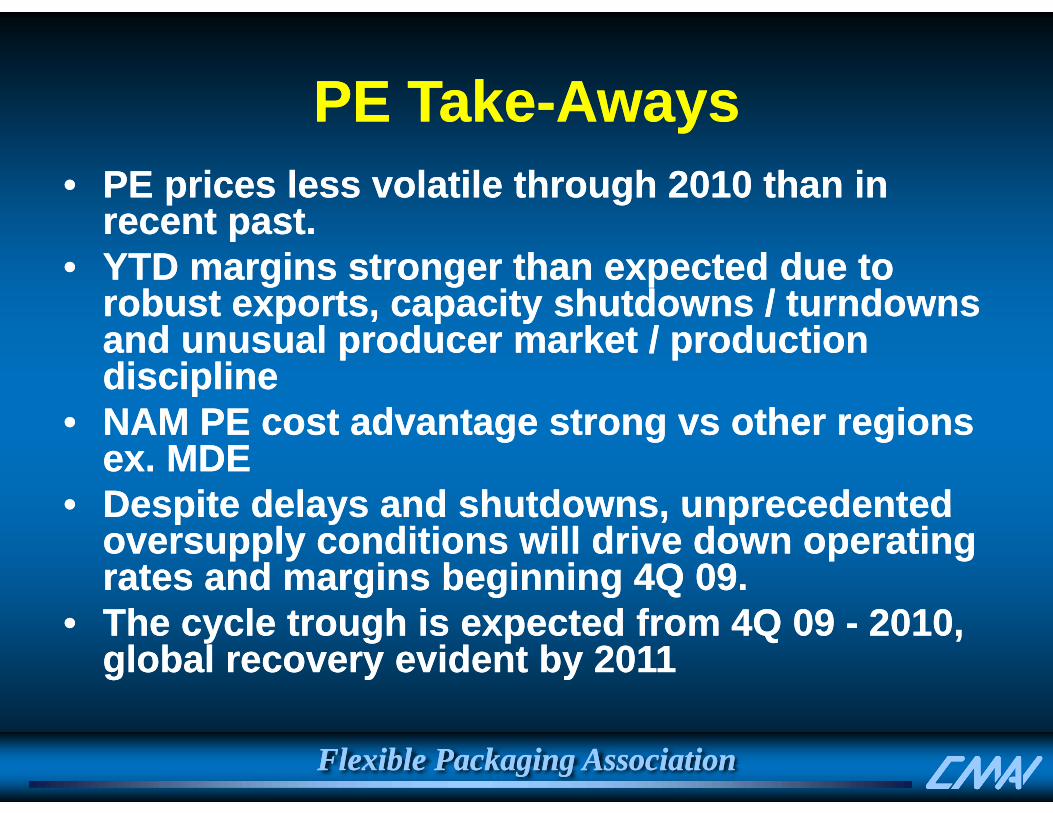
PEPE TakeTake--AwaysAwaysPE PE TakeTake AwaysAways•• PE prices less volatile through 2010 than in PE prices less volatile through 2010 than in
t tt trecent past.recent past.•• YTD margins stronger than expected due to YTD margins stronger than expected due to
robust exports capacity shutdowns / turndownsrobust exports capacity shutdowns / turndownsrobust exports, capacity shutdowns / turndowns robust exports, capacity shutdowns / turndowns and unusual producer market / production and unusual producer market / production disciplinediscipline
•• NAM PE cost advantage strong NAM PE cost advantage strong vsvs other regions other regions ex. MDEex. MDE
•• Despite delays and shutdowns unprecedentedDespite delays and shutdowns unprecedented•• Despite delays and shutdowns, unprecedented Despite delays and shutdowns, unprecedented oversupply conditions will drive down operating oversupply conditions will drive down operating rates and margins beginning 4Q 09.rates and margins beginning 4Q 09.
•• The cycle trough is expected from 4Q 09 The cycle trough is expected from 4Q 09 -- 2010, 2010, global recovery evident by 2011global recovery evident by 2011
Flexible Packaging AssociationFlexible Packaging Association

PROPYLENE & PROPYLENE & POLYPROPYLENEPOLYPROPYLENE
Flexible Packaging AssociationFlexible Packaging Association

Propylene Supply ProfilePropylene Supply ProfileAlkylationMM MotorMotor
FCC U it
Alkylation
Unit
IsobutaneIsobutane
High Octane Alkylate High Octane Alkylate GasolineGasoline
Crude
Motor Motor GasolineGasoline
Motor Motor GasolineGasoline
Unit Other Fuel UsesOther Fuel Uses
Refining IndustryRefining Industry
Gas Gas OilOil
UnitCrude Crude OilOil
Cumene, Oligomers Cumene, Oligomers IsopropanolIsopropanol
Purification Splitter Unit
Chemical IndustryChemical Industry
RG RG Propylene Propylene MarketMarket Polypropylene I j tiI j ti
Steam Cracker orPropane to LPGPropane to LPG
Splitter UnitMarketMarket
NaphthaNaphtha
Polypropylene
Unit
Injection Injection Molding, Molding, Fibers, Fibers, FilmsFilms
Steam Cracker or Olefin Plant
Ethane Ethane PropanePropane Other propylene consumers: acrylonitrile, Other propylene consumers: acrylonitrile,
propylene oxide, acrylic acid, oxopropylene oxide, acrylic acid, oxo--alcoholsalcoholsEthyleneEthylene
Propane Propane DehydroDehydro
Other Technologies PG & CG PG & CG
Propylene Propylene MarketsMarkets
Ethylene Ethylene & Olefins& OlefinsMetathesisMetathesis
Olefin CrackingOlefin Cracking
HSFCCHSFCC
Flexible Packaging AssociationFlexible Packaging Association
MarketsMarketsGasGas--toto--OlefinsOlefins
OthersOthers

U.S. PROPYLENEU.S. PROPYLENECurrent SituationCurrent Situation
Key PointsKey PointsKey PointsKey Points•• Derivative operating rates reduced with weak Derivative operating rates reduced with weak
d dd ddemand.demand.•• Steam cracker production reduced by 1/3 with Steam cracker production reduced by 1/3 with p yp y
move to light move to light feedslatesfeedslates and shutdowns.and shutdowns.•• Refinery production reduced by 8 to 10Refinery production reduced by 8 to 10•• Refinery production reduced by 8 to 10 Refinery production reduced by 8 to 10
percent with lower refinery rates.percent with lower refinery rates.I t i lI t i l•• Inventories lowInventories low
•• Tight supply/demand globallyTight supply/demand globally
Flexible Packaging AssociationFlexible Packaging Association
g pp y g yg pp y g y

Propylene ScarcePropylene Scarce6.06.0U.S. Weekly Propylene (NonU.S. Weekly Propylene (Non--Fuel Use) Ending Stocks, MM BarrelsFuel Use) Ending Stocks, MM Barrels
4 04 0
5.05.0
3.03.0
4.04.0
2.02.0
1.01.0
Source: EIA; Data Through 21Source: EIA; Data Through 21--AugAug--09090.00.0
JanJan FebFeb MarMar AprApr MayMay JunJun JulJul AugAug SepSep OctOct NovNov DecDec
55 Y MINY MIN MAX RMAX R 55 Y MINY MIN 20072007 20082008 20092009
Source: EIA; Data Through 21Source: EIA; Data Through 21 AugAug 0909
Flexible Packaging AssociationFlexible Packaging Association55--Yr MINYr MIN--MAX RangeMAX Range 55--Yr MINYr MIN 20072007 20082008 20092009
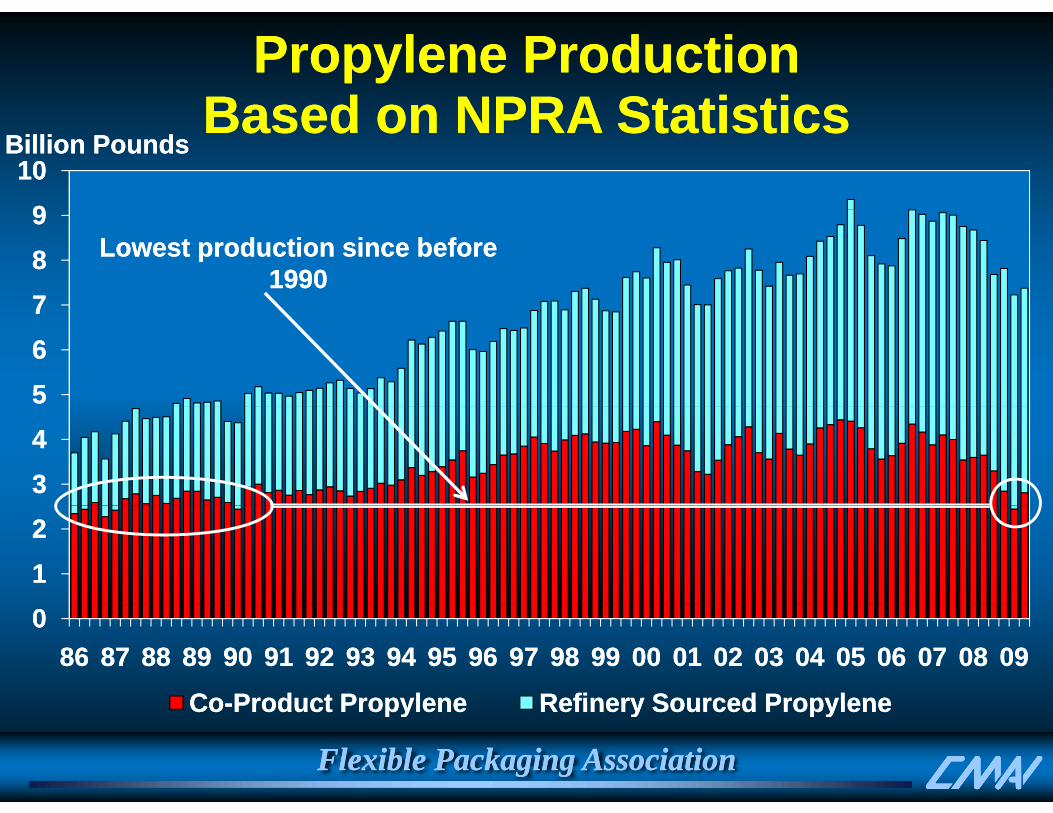
Propylene ProductionPropylene ProductionBased on NPRA StatisticsBased on NPRA Statistics
991010
Billion PoundsBillion PoundsBased on NPRA StatisticsBased on NPRA Statistics
778899
Lowest production since before Lowest production since before 19901990
556677
3344
1122
008686 8787 8888 8989 9090 9191 9292 9393 9494 9595 9696 9797 9898 9999 0000 0101 0202 0303 0404 0505 0606 0707 0808 0909
CoCo Product PropyleneProduct Propylene Refinery Sourced PropyleneRefinery Sourced Propylene
Flexible Packaging AssociationFlexible Packaging Association
CoCo--Product PropyleneProduct Propylene Refinery Sourced PropyleneRefinery Sourced Propylene
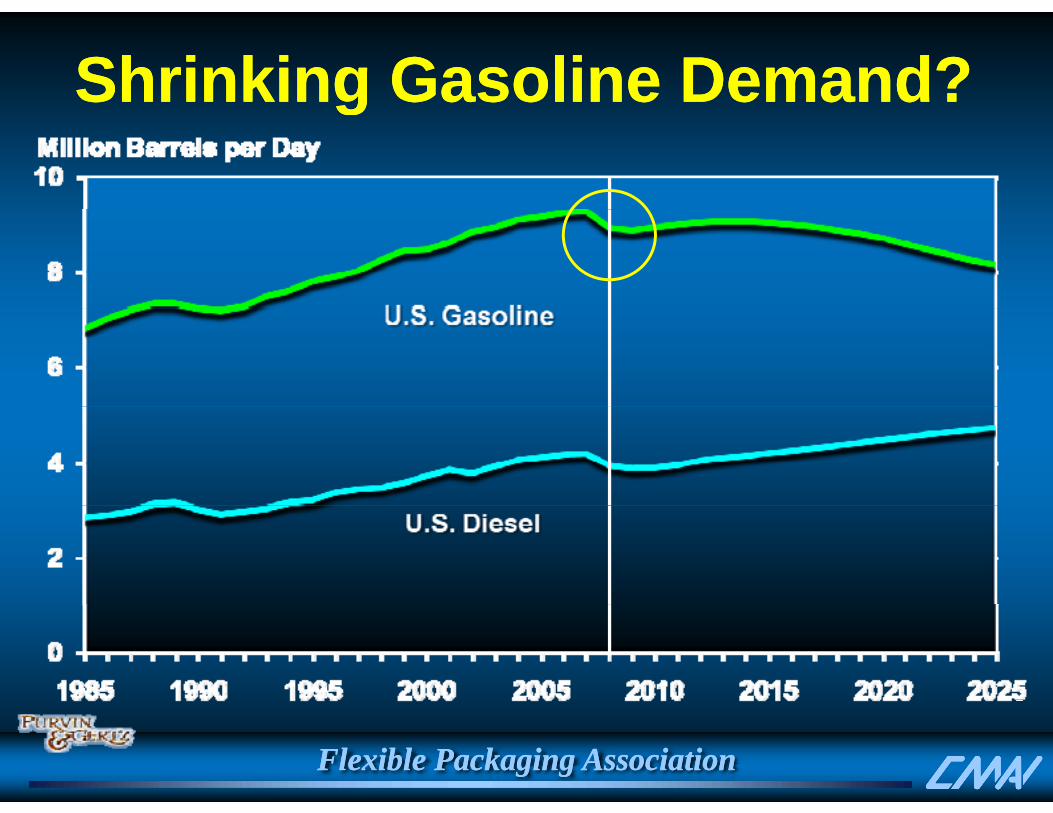
Shrinking Gasoline Demand?Shrinking Gasoline Demand?gg
Flexible Packaging AssociationFlexible Packaging Association
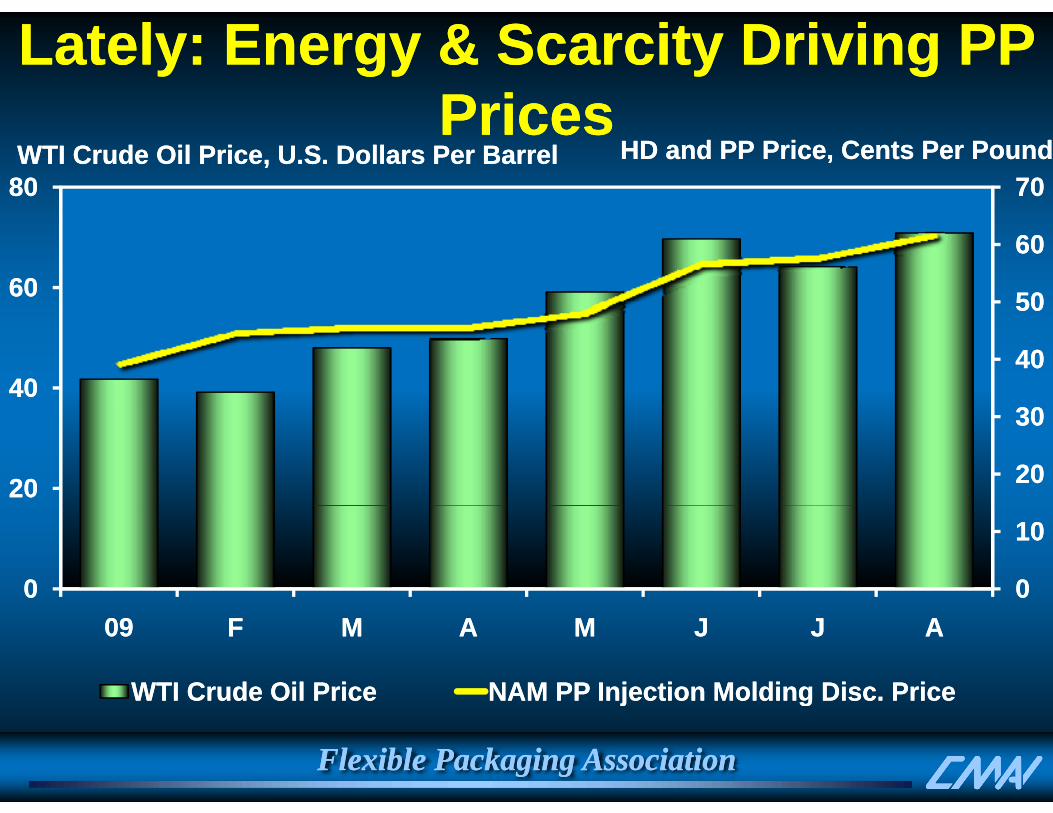
Lately: Energy & Scarcity Driving PP Lately: Energy & Scarcity Driving PP PricesPrices
70708080WTI Crude OilWTI Crude Oil Price,Price, U.SU.S. Dollars . Dollars Per BarrelPer Barrel HD and PP Price, Cents Per PoundHD and PP Price, Cents Per Pound
Prices Prices
5050
60606060
3030
4040
5050
4040
2020
3030
2020
00
1010
000909 FF MM AA MM JJ JJ AA
WTI Crude Oil PriceWTI Crude Oil Price NAM PP Injection Molding Disc. PriceNAM PP Injection Molding Disc. Price
Flexible Packaging AssociationFlexible Packaging Association
j gj g

Exports to Asia Soared…Exports to Asia Soared…120120US PP US PP , , Thousand Metric TonsThousand Metric Tons
pp
100100
6060
8080
4040
00
2020
000606 AA JJ OO 0707 AA JJ OO 0808 AA JJ OO 0909 AA
N AmericaN America S AmericaS America EuropeEuropeOtherOther Far EastFar East
Flexible Packaging AssociationFlexible Packaging Association
N. AmericaN. America S. AmericaS. America EuropeEuropeOtherOther Far EastFar East
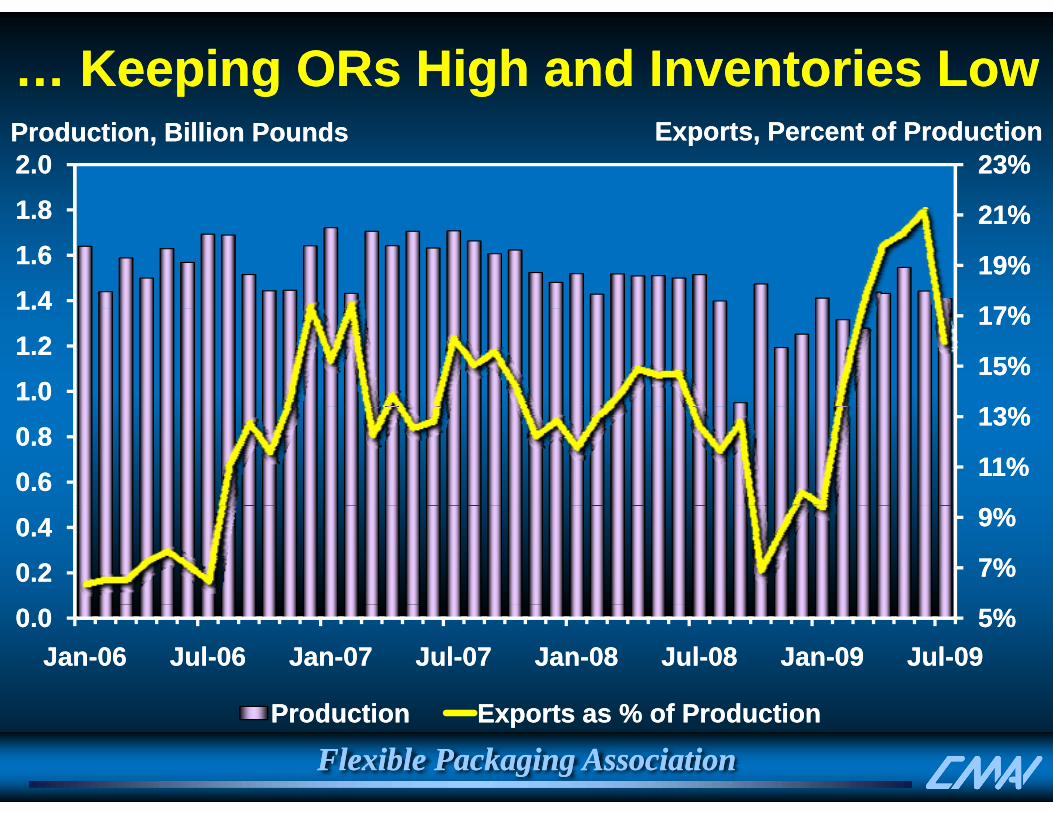
… Keeping ORs High and Inventories Low… Keeping ORs High and Inventories Low
21%21%
23%23%1 81 82.02.0Production, Production, Billion Billion PoundsPounds Exports, Percent of ProductionExports, Percent of Production
17%17%
19%19%
21%21%
1.41.41.61.61.81.8
13%13%
15%15%
17%17%
1.01.01.21.21.41.4
11%11%
13%13%
0.60.60.80.8
7%7%
9%9%
0.20.20.40.4
5%5%0.00.0JanJan--0606 JulJul--0606 JanJan--0707 JulJul--0707 JanJan--0808 JulJul--0808 JanJan--0909 JulJul--0909
Flexible Packaging AssociationFlexible Packaging AssociationProductionProduction Exports as % of ProductionExports as % of Production

PP Demand July YTDPP Demand July YTDPP Demand July YTDPP Demand July YTD
PPPP Percent ChangePercent ChangeFilm 10 Mils and BelowFilm 10 Mils and Below --8.48.4Oriented FilmOriented Film --7.27.2
NonNon--Oriented FilmOriented Film --12.412.4Sheet (Over 10 Mils)Sheet (Over 10 Mils) --2.22.2PackagingPackaging --25.325.3
NonNon--PackagingPackaging --38.338.3
Flexible Packaging AssociationFlexible Packaging AssociationSource: ACCSource: ACC, Plastics Division; , Plastics Division; Gov’tGov’t Trade DataTrade Data
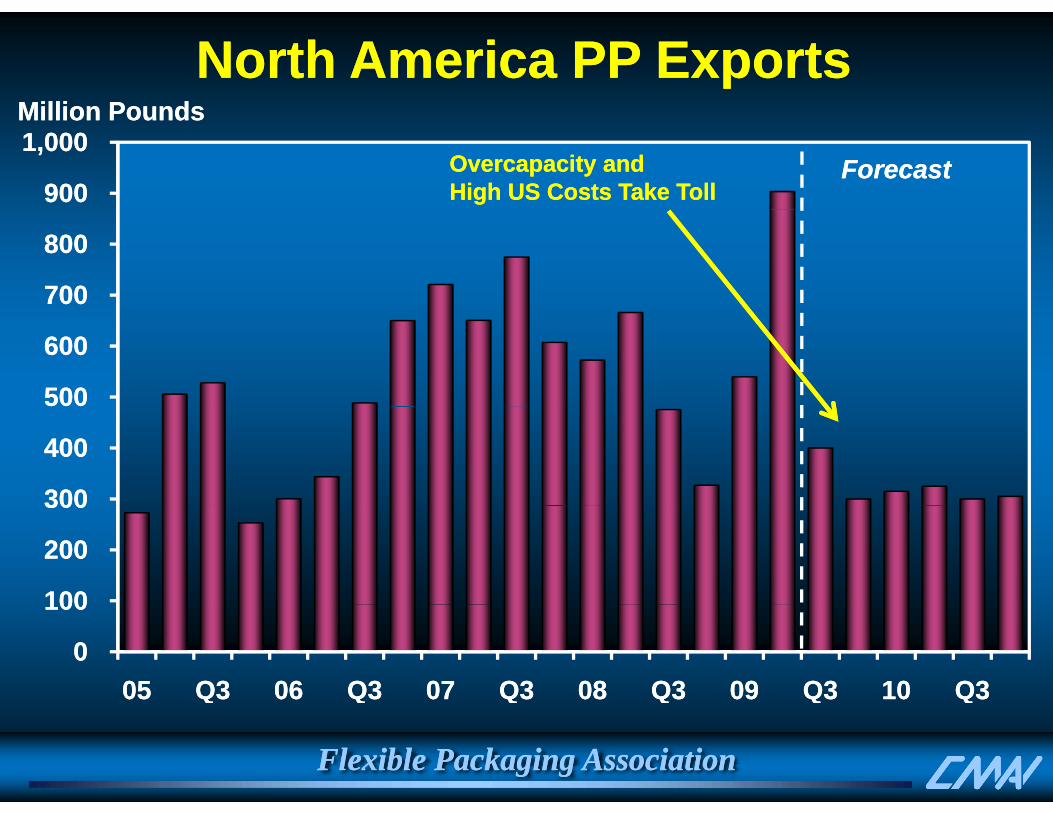
Million PoundsMillion PoundsNorth America PP ExportsNorth America PP Exports
900 900
1,000 1,000 Million PoundsMillion Pounds
ForecastForecastOvercapacityOvercapacity and and High US Costs Take TollHigh US Costs Take Toll
700 700
800 800
500 500
600 600
300300
400 400
100100
200 200
300 300
0 0
100 100
0505 Q3Q3 0606 Q3Q3 0707 Q3Q3 0808 Q3Q3 0909 Q3Q3 1010 Q3Q3
Flexible Packaging AssociationFlexible Packaging Association
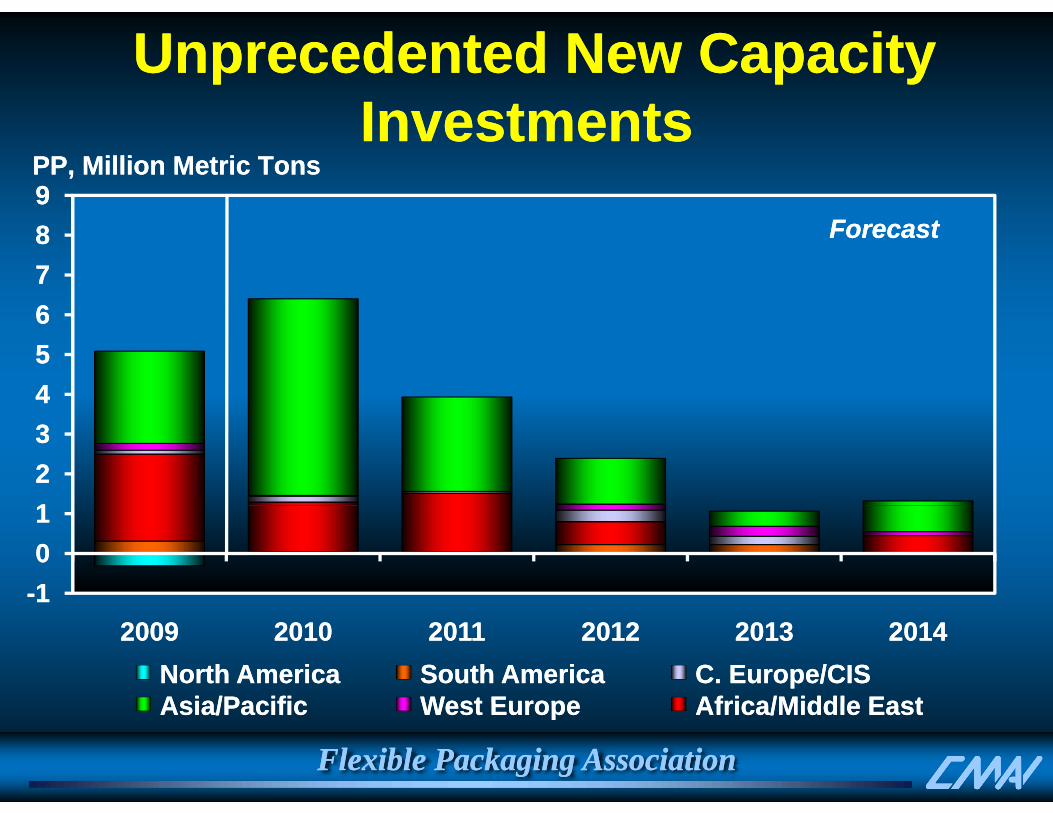
Unprecedented New Capacity Unprecedented New Capacity I t tI t tInvestmentsInvestments
99PP, Million Metric TonsPP, Million Metric Tons
667788 ForecastForecast
445566
112233
--110011
20092009 20102010 20112011 20122012 20132013 20142014North AmericaNorth America South AmericaSouth AmericaAsia/PacificAsia/Pacific West EuropeWest Europe
C. Europe/CISC. Europe/CISAfrica/Middle EastAfrica/Middle East
Flexible Packaging AssociationFlexible Packaging Association
Asia/PacificAsia/Pacific West EuropeWest Europe Africa/Middle EastAfrica/Middle East
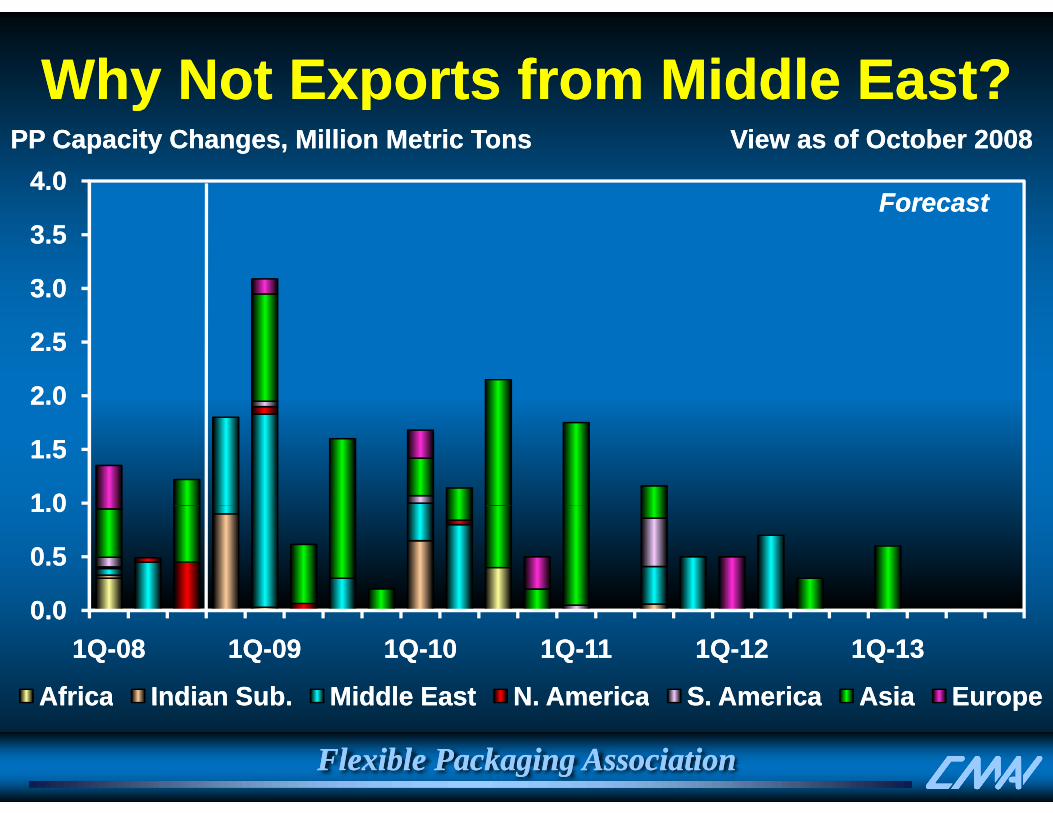
Why Not Exports from Middle East?Why Not Exports from Middle East?yy4.04.0
View as of October 2008View as of October 2008PP Capacity Changes, Million Metric TonsPP Capacity Changes, Million Metric Tons
ForecastForecast
3.03.0
3.53.5ForecastForecast
2.02.0
2.52.5
1 01 0
1.51.5
0 00 0
0.50.5
1.01.0
0.00.01Q1Q--0808 1Q1Q--0909 1Q1Q--1010 1Q1Q--1111 1Q1Q--1212 1Q1Q--1313
AfricaAfrica Indian Sub.Indian Sub. Middle EastMiddle East N. AmericaN. America S. AmericaS. America AsiaAsia EuropeEurope
Flexible Packaging AssociationFlexible Packaging Association
AfricaAfrica Indian Sub.Indian Sub. Middle EastMiddle East N. AmericaN. America S. AmericaS. America AsiaAsia EuropeEurope
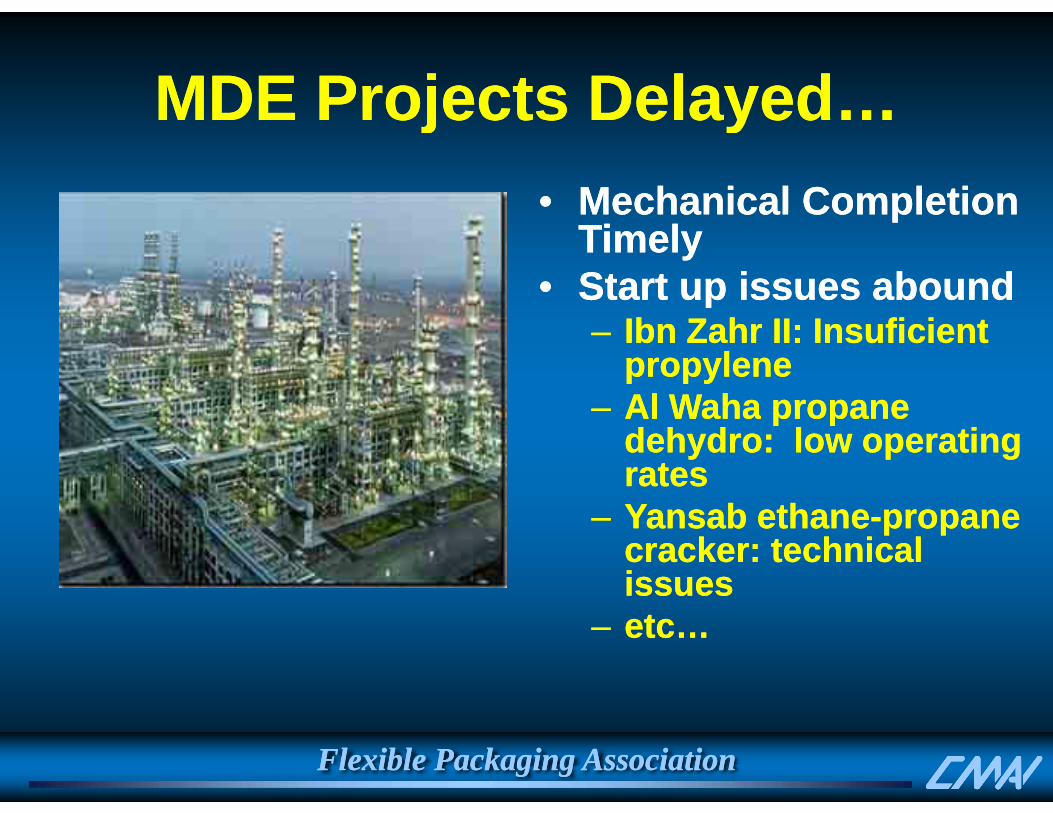
MDE Projects DelayedMDE Projects DelayedMDE Projects Delayed…MDE Projects Delayed…•• Mechanical CompletionMechanical CompletionMechanical Completion Mechanical Completion
TimelyTimely•• Start up issues aboundStart up issues abound
–– IbnIbn ZahrZahr II: II: InsuficientInsuficientpropylenepropyleneAlAl WahaWaha propanepropane–– Al Al WahaWaha propane propane dehydrodehydro: low operating : low operating ratesratesY bY b thth–– YansabYansab ethaneethane--propane propane cracker: technical cracker: technical issuesissues
–– etc…etc…
Flexible Packaging AssociationFlexible Packaging Association

Projects Very Delayed…Projects Very Delayed…
4.04.0PP Capacity Changes, MillionPP Capacity Changes, Million Metric Metric TonsTons View as of July 2009View as of July 2009
ForecastForecast
3.03.0
3.53.5
2.02.0
2.52.5
1 01 0
1.51.5
0 00 0
0.50.5
1.01.0
0.00.01Q1Q--20082008 1Q1Q--20092009 1Q1Q--20102010 1Q1Q--20112011 1Q1Q--20122012 1Q1Q--20132013
AfricaAfrica EuropeEurope Indian Sub.Indian Sub. Middle EastMiddle East N. AmericaN. America AsiaAsia S. AmericaS. America
Flexible Packaging AssociationFlexible Packaging Association
AfricaAfrica EuropeEurope Indian Sub.Indian Sub. Middle EastMiddle East N. AmericaN. America AsiaAsia S. AmericaS. America

Investment Investment ExcessExcess
Demand Demand DropDrop Oversupply!Oversupply!++ ==
1001001818PP, Million PP, Million Metric TonsMetric Tons Operating Rate, PercentOperating Rate, Percent
ExcessExcess DropDrop pp ypp y
9595
100100
1212141416161818
ForecastForecast
8585
9090
6688
10101212
8080224466
7070
7575
--44--2200
20042004 20062006 20082008 20102010 20122012 20142014
Capacity Increase Capacity Increase -- Demand IncreaseDemand Increase Cummulative Delta CapsCummulative Delta Caps--Delta DemDelta DemO ti R tO ti R t
Flexible Packaging AssociationFlexible Packaging AssociationOperating RateOperating Rate

Pricing and Margins to Slide•• Producers had Producers had
b bl t f llb bl t f llPrice, Cents Per PoundPrice, Cents Per Pound Margin, Cents Per PoundMargin, Cents Per Pound
99
1212
9090
120120 been able to follow been able to follow propylene price propylene price increases; tightincreases; tight
ForecastForecast
66
99
6060
9090 increases; tight increases; tight supply and exports supply and exports helpedhelped
33
66
3030
6060 •• As overAs over--supply supply ensues and ensues and exports declineexports decline
00
33
00
3030 exports decline, exports decline, will become difficult will become difficult to push cost to push cost
JanJan--0707 OctOct--0707 JulJul--0808 AprApr--0909 JanJan--1010 OctOct--1010 increasesincreasesCash Margin PP Discounted Price Cash Costs
Flexible Packaging AssociationFlexible Packaging Association

North America Moving to Top of PP North America Moving to Top of PP Price ChainPrice Chain
18001800Dollars Per Metric TonDollars Per Metric Ton
Price ChainPrice Chain
16001600
18001800ForecastForecast
12001200
14001400
10001000
12001200
600600
800800
JanJan--0909 MayMay--0909 SepSep--0909 JanJan--1010 MayMay--1010 SepSep--1010NAM PP Disc. PriceNAM PP Disc. Price WEP PP Disc. PriceWEP PP Disc. PriceNEA PP SpotNEA PP Spot NAM PP Spot ExportNAM PP Spot Export
Flexible Packaging AssociationFlexible Packaging Association
NEA PP Spot NEA PP Spot NAM PP Spot ExportNAM PP Spot Export
PolypropylenePolypropylene ConclusionsConclusionsPolypropylene Polypropylene -- ConclusionsConclusions•• PP price climb seems to be reaching a PP price climb seems to be reaching a p gp g
tipping point.tipping point.•• Overcapacity looming; effects areOvercapacity looming; effects are•• Overcapacity looming; effects are Overcapacity looming; effects are
different depending on the geographydifferent depending on the geographyD d d d t b i b lD d d d t b i b l•• Demand recovery needed to bring balance Demand recovery needed to bring balance to the marketto the market
•• Prices in North America to remain Prices in North America to remain elevated elevated
•• Polypropylene Polypropylene –– no longer cheap?no longer cheap?
Flexible Packaging AssociationFlexible Packaging Association