disability in the arab region - united nations economic ... · pdf filedisability in the arab...
TRANSCRIPT

DISABILITY IN THE ARAB REGIONAN OVERVIEW
League of Arab States

DISABILITY IN THE ARAB REGIONAN OVERVIEW
2014
Economic and Social Commission of Western Asia (ESCWA)League of Arab States
Distr.LIMITEDE/ESCWA/SDD/2014/Technical Paper.130 April 2014ORIGINAL: ENGLISH
Note: This document has been reproduced without formal editing. The views expressed in this paperare those of the authors and do not necessarily reflect the views of the United Nations Secretariat.
14-00125


PREFACE
One measure of civilization is how well
we treat the most vulnerable members of
our society.
Dr. William H. Foege, Senior Fellow, Bill and Melinda Gates Foundation
Disability is an intrinsic aspect of the human condition and most people will experience disability at some point in their lives. Globally, one billion people—or 15 per cent of the world population—are estimated to be living with disability. By contrast, Arab countries report comparatively low prevalence of disability, ranging from 0.4 to 4.9 per cent of the population, which evidences widespread differ-ences and difficulties in data collection, research and analysis.
In response to this and on the occasion of the conclusion of the Arab Decade for Persons with Disabilities (2004-2013), adopted during the Arab Summit in 2004, the Economic and Social Commission for Western Asia (ESCWA) together with the League of Arab States collected baseline information on disability in the Arab region. The results of this baseline study are presented in the following report, making it the first publication to bring together statistical data on the situation of persons with disabilities and information on the institutional and legal frameworks on disability for all 22 Arab countries.
The present report is divided into two sections. The first part summarizes a selected number of regional trends related to disability, including disability prevalence, institutional and legal frameworks on disability, and access to education and employ-ment. The second part, which represents the core of this report, presents a compilation of statistical data on persons with disabilities and qualitative information on institutional and legal frameworks.
This report was written by Alexandra Heinsjo-Jackson, Associate Social Affairs Officer, Inclusive Social Development Section, and Lubna Ismail, Research Assistant, Inclusive Social Development Section, under the supervision of Gisela Nauk, Chief, Inclusive Social Development Section, Social Development Division, and the overall guidance of Frederico Neto, Director, Social Development Division, ESCWA. The report was reviewed by Mr. Tarek El-Nabulsi, Head of Coordination and Follow up for Social Development and Policies Division, Technical Secretariat of the Council of Arab Social Affairs Ministers, League of Arab States. The ESCWA team and the League of Arab States are grateful to the national statistical offices and government focal points who collected complex information across institutional boundaries within their respective countries. In addition, the participants of the Conference on the Arab Decade for Persons with Disabilities and Beyond held in Cairo on 30-31 October 2013 provided important insights and inputs to the present report. This study also benefited from substantial contributions from Katharine Brooks and Sarah Slan, as well as comments and support from Aiko Akiyama, Diane Alméras, Eva Maria Bille, Nadine Chalak, Nawaf Kabbara, Marwan Khawaja, Salwa Mohamed, Chol O Han, Matthew Perkins, Juraj Riecan, Tanja Sejersen and Zeina Sinno. The team also gratefully acknowledges the Social Development Division in the Economic and Social Commission for Asia and the Pacific (ESCAP), in particular its publication Disability at a Glance 2012: Strengthening the Evidence Base in Asia and the Pacific, which provided inspiration for the structure and content of the present report.
The views expressed in this report are those of the authors and do not necessarily reflect the views of the United Nations. Feedback from readers is welcome and suggestions may be sent to [email protected].

ABBREVIATIONS 05
LIST OF FIGURES & TABLES 05
1
2
3
INTRODUCTION 07
DISABILITY PREVALENCE RATES: A CHALLENGE OF DEFINITION AND MEASUREMENT 09
BREAKING THE CYCLE OF EXCLUSION: ACCESS TO EMPLOYMENT AND EDUCATION 15
CONCLUDING REMARKS 21
MAPPING THE INSTITUTIONAL AND LEGAL FRAMEWORKS IN THE ARAB REGION 13
DISABILITY IN THE ARAB REGION: SELECTED REGIONAL TRENDS
COUNTRY PROFILES 23
REFERENCES 112
SOURCES OF NATIONAL STATISTICAL DATA 114

10 Figure 1. Disability prevalence in the Arab region (% of total population)
18 Figure 2. Distribution of persons with disabilities and total population (15+ years) by economic activity for selected Arab countries
19 Figure 3. Differentials in illiteracy for persons with disabilities and total populations (10+ years) according to educational attainment data for selected Arab countries
20 Figure 4. Employment ratios for persons with disabilities and total populations (15+ years) for selected Arab countries
11 Table 1. Classifications of disabilities related to mobility and movement-related body structures in the Arab region
12 Table 2. List of ICF categories (one-level classification)
14 Table 3. Overarching institutional and legal frameworks for disability in the Arab region
16 Table 4. National employment quotas for persons with disabilities in the Arab region
20 Table 5. Employment rates of persons with disabilities and total populations (15+ years) by sex for selected Arab countries
LIST OF FIGURES & TABLES
CBD Currently being developed
CRPD Convention on the Rights of Persons with Disabilities
ECLAC United Nations Economic Commission for Latin America and the Caribbean
ESCAP United Nations Economic and Social Commission for Asia and the Pacific
ESCWA United Nations Economic and Social Commission for Western Asia
GNI Gross national income
HDI Human Development Index
ICF International Classification of Functioning, Disability and Health
OECD Organization for Economic Co-operation and Development
PPP Purchasing power parity
UN United Nations
UNDP United Nations Development Programme
UNICEF United Nations Children’s Fund
WHO World Health Organization
– Indicates that the item is not applicable
.. Indicates that data is not available
N No
Y Yes
ABBREVIATIONS

06

07
The Arab region is understood in this report to be comprised of the following countries: Algeria, Bahrain, the Comoros, Djibouti,
Egypt, Iraq, Jordan, Kuwait, Lebanon, Libya, Mauritania, Morocco, Oman, Palestine,
Qatar, Saudi Arabia, Somalia, the Sudan, the Syrian Arab
Republic, Tunisia, the United Arab Emirates and Yemen.
UN, 2014.
1
2
Disability is a complex and evolving concept. Historically, it has been viewed from a medical perspective, whereby it was understood as a deviation from an imagined human norm. Accord-ing to this medical model, disability was defined exclusively according to a person’s impairments and the focus lay on preventing, treating and managing these impairments. Over recent years, and prompted largely by the self-organization of persons with disabilities, this medical model has gradually given way to new understandings of dis-ability. Today, disability is considered to be part of the human condition rather than a deviation from the norm, and a result of the interaction between persons with particular mental, health or other conditions and their environment, rather than a product of their impairments alone. According to this latter approach, interventions should focus not only on people’s impairments but also on dismantling the attitudinal, environmental and other barriers that hinder persons with disabilities from fully participating in society.
This evolution in the understanding of disability has driven substantial policy change over recent years. At the regional level, Arab countries1 declared the Arab Decade for Persons with Disabilities (2004-2013) at the 2004 Arab Summit in Tunis. This decade marked a milestone for the Arab world, as it established for the first time a set of regionally agreed principles and objectives
to guide national efforts on disability. Two years later, the United Nations Convention on the Rights of Persons with Disabilities (CRPD) formalized the new concept of disability and now provides States Parties with a comprehensive framework for protecting, promoting and advancing the rights of persons with disabilities. As of April 2014, the CRPD had at the global level 158 signatories and 145 ratifications and accessions.2
Together, all of these developments have had significant implications for Arab countries. Governments have devised new laws, strate-gies and policies in order to reflect changing conceptualizations of disability and to implement the provisions of the CRPD and the Arab Decade for Persons with Disabilities. And while significant progress has been made in this regard, it is clear that governments have also faced a number of implementation challenges. Measures to ensure accessibility of the built environment and equal access to services, for example, can at times require substantial expertise and financial resources, an issue that is made all the more complex in a region where several countries face severe capacity constraints. Defining disability is a particularly challenging task for governments, as it means casting an evolving concept into legal language, which must be both precise and inclusive in order to design appropriate policy approaches and to determine eligibility for disability-related support. Furthermore, reliable and comparable data on disability—a prerequisite for the formulation, implementation, monitoring and evaluation of evidence-based policies—is limited in the Arab region.
It is in this context that ESCWA and the League of Arab States conducted this baseline study on disability in the Arab region. The study included two parallel data collection processes, which were conducted between May and September 2013.
[D]isability is an evolving concept and …
results from the interaction between persons
with impairments and attitudinal and
environmental barriers that hinders their
full and effective participation in society on
an equal basis with others.
UN Convention on the Rights of Persons with Disabilities (Preamble, paragraph (e))
1 INTRODUCTION

08
Firstly, quantitative data on persons with dis-abilities was collected from national census and household survey data for a range of indicators, including disability prevalence, age distribution, marital status, geographical location, educational attainment and economic activity. For compara-tive purposes, data was also collected wherever possible on the total population for the same indicators and from the same statistical source. This data was then sent to focal points in national statistical offices for verification. Secondly, designated government focal points worked with the team to collect information on the institutional and legal infrastructures on disability in Arab countries. In total, ESCWA and the League of Arab States received responses from 19 out of 22 Arab countries for the data verification process and from 16 countries for the legal and institutional survey. The results of these two data collection processes are presented in a set of country profiles, which form Section III of this report.

09
DISABILITY PREVALENCE RATES: A CHALLENGE OF DEFINITION AND MEASUREMENT
WHO and World Bank, 2011, pp. 22-23; ESCAP, 2012, pp. 11-13.
3
WHO and ESCAP, 2008, p. 35; ESCAP, 2012, p. 12.
4
Nineteen countries responded to the data verification process
conducted by ESCWA. One country reported that data on persons with disabilities was
not currently available.
5
WHO and World Bank, 2011, p. 44.
7
See e.g. World Bank, 2005, p. 10.8
ECLAC, 2012, p. 184.6
2 DISABILITY IN THE ARAB REGION: SELECTED REGIONAL TRENDS
Measuring disability prevalence is a complex challenge, especially in developing countries. Results depend to a large extent on the method of data collection as well as on the definition of disability that is applied. Surveys (especially dedicated surveys) often provide more detailed data on persons with disabilities as they allow for the inclusion of more numerous and more in-depth questions. In addition, as they often use nuanced questions and broad definitions of disability that focus on a wide range of limita-tions and restrictions, such surveys also tend to generate higher and more accurate disability prevalence rates.3 Population censuses are also commonly used for collecting disability-related data. The advantages of censuses are that they cover entire populations and are conducted at regular intervals, and thus allow for the monitor-ing of trends over time. However, as censuses only include a limited number of questions on disability and are often based on more narrow interpretations of disability, they tend to produce lower prevalence rates that only reflect a sub-population of persons with more severe impairments.4
Given the widespread use of censuses for mea-suring disability in the Arab world, these trends – along with other factors such as the presence of social stigma, which may discourage people from reporting disabilities – may help to explain the remarkably low disability prevalence found in Arab countries. According to available data, disability prevalence ranges from 0.4 per cent in Qatar to 4.9 per cent in the Sudan (see Figure 1). Of the 18 countries for which data is available,5 15 report disability prevalence under 3 per cent
and half report rates under 2 per cent. Such figures contrast sharply with those of other regions as well as with global averages. In Latin America and the Caribbean, for example, average disability prevalence is estimated at 12.4 and 5.4 per cent respectively,6 whereas the World Health Organization (WHO) and World Bank estimate that approximately 15 per cent of the world population lives with disability.7 More-over, disability prevalence in Arab countries is remarkably low given the widespread occur-rence of risk factors and disability causes in the region, including consanguinity, communicable and chronic diseases, road traffic accidents and armed conflict.8

10
WHO, 2001, p. 3.
Figure 1. Disability prevalence in the Arab region (% of total population)
SUDANPALESTINE
OMANa
LIBYAa
BAHRAINa
IRAQALGERIA
MOROCCOLEBANON
YEMENJORDAN
SYRIAN ARAB REPUBLICTUNISIAKUWAIT
UNITED ARAB EMIRATESSAUDI ARABIAa
EGYPTQATAR
4.94.6
3.22.92.9
2.82.5
2.32.0
1.91.9
1.41.3
1.10.8
0.4
0.80.7
0 1 2 3 4 5 6
9
Ibid., p. 8.10
Thus, existing disability prevalence rates in Arab countries must be taken with a grain of salt. Reli-ability and comparability of data across countries is limited not only by the use of varying data collection methods, but also, especially, by the use of different definitions of disability. Even where countries use the same general method of data collection, cross-country comparisons are highly challenging due to a lack of coherence in typologies and classi-fications of disability. In other words, comparability of data is limited in the Arab region since countries use different categories and terminology to describe different types of disabilities. In order to illustrate this issue, Table 1 presents the classifications that a number of Arab countries use to describe dis-abilities related to mobility and movement-related body structures. The list shows that few countries use the same terminology when collecting data on types of disability, with some countries focusing on people’s impairments (such as ‘paralysis’ or ‘loss of leg’) and others basing their classifications on limitations and difficulties in functioning (such as ‘difficulty in movement’ or ‘difficulty in walking’).
The International Classification of Functioning, Disability and Health (ICF) represents the central framework for promoting coherent and accurate terminology and classifications related to disabil-ity. Developed by WHO, the ICF is a classification system that provides common, standard and comprehensive language to describe health and health-related conditions.9 Under this framework, disability is understood according to two main components: (i) impairments in body functions (such as seeing and hearing) and in body struc-tures (such as the structure of the eyes and ears); as well as (ii) activity limitations and participation restrictions (such as dressing and eating). More-over, the ICF defines a set of contextual factors (such as physical geography and societal atti-tudes), which interact with the above components and serve to impact—positively or negatively—on a person’s functioning and disability.10 Table 2 provides a list of categories according to the different components of the ICF.
SOURCES: ESCWA, based on data verified by national statistical offices from the following sources: Algeria: Office National des Statistiques et al. (2006); Bahrain: Central Informatics Organization (2010b); Egypt: Central Agency for Public Mobilization and Statistics (2006); Iraq: Central Organization for Statistics and Information Technology et al. (2007); Jordan: Department of Statistics (2010); Kuwait: Central Statistical Bureau (2011); Lebanon: Central Administration of Statistics et al. (2004); Libya: Pan Arab Project for Family Health and the National Centre for Infectious and Chronic Disease Control (2007); Morocco: Haut-Commissariat au Plan (2004); Oman: National Center for Statistics and Information (2010); Palestine: Palestinian Central Bureau of Statistics (2007); Qatar: Qatar Statistics Authority (2010); Saudi Arabia: Central Department of Statistics and Information (2004); Sudan: Central Bureau of Statistics (2008); Syrian Arab Republic: Central Bureau of Statistics (2007); Tunisia: National Institute of Statistics (2009); United Arab Emirates: National Bureau of Statistics (2005); Yemen: Central Statistical Organization (2004).
NOTE: a Data pertains to nationals only

11
BAHRAIN Physical/locomotor difficulty
EGYPT Infantile paralysis
Loss of one/both legs
Loss of one/both hands
Total/partial paralysis
IRAQ Limp/walking disability/locomotor disability
JORDAN Locomotor
KUWAIT Difficulty in body movement
Difficulty in movement
Difficulty in grasping and moving objects
LEBANON Locomotor disability
LIBYA Movement
MOROCCO Locomotor
OMAN Movement of the upper body
Walking/climbing up steps
PALESTINE Movement
QATAR Movement
SAUDI ARABIA Paralysis
SUDAN Limited use of hand
Limited use of leg
Loss of hand
Loss of leg
SYRIAN ARAB REPUBLIC Physical disability
TUNISIA Physical disability
UNITED ARAB EMIRATES Difficulties in body movement
Locomotor and movement difficulties
Difficulties in grasping and holding objects
YEMEN Difficulty in grasping objects
Difficulty in walking
Difficulty in movement
SOURCES: Bahrain: Central Informatics Organization (2010b); Egypt: Central Agency for Public Mobilization and Statistics (2006); Iraq: Central Organization for Statistics and Information Technology et al. (2007); Jordan: Department of Statistics (2010); Kuwait: Central Statistical Bureau (2011); Lebanon: Central Administration of Statistics et al. (2004); Libya: Pan Arab Project for Family Health and the National Centre for Infectious and Chronic Disease Control (2007); Morocco: Haut-Commissariat au Plan (2004); Oman: National Center for Statistics and Information (2010); Palestine: Palestinian Central Bureau of Statistics (2007); Qatar: Qatar Statistics Authority (2010); Saudi Arabia: Central Department of Statistics and Information (2004); Sudan: Central Bureau of Statistics (2008); Syrian Arab Republic: Central Bureau of Statistics (2007); Tunisia: National Institute of Statistics (2009); United Arab Emirates: National Bureau of Statistics (2005); Yemen: Central Statistical Organization (2004).
NOTE: These classifications are taken from the official data sources and thus may not reflect UN terminology.
Table 1. Classifications of disabilities related to mobility and movement-related body structures in the Arab region

12
Table 2. List of ICF categories (one-level classification)
SOURCE: WHO (2001).
BODY FUNCTIONS Mental functions
Sensory functions & pain
Voice & speech functions
Functions of the cardiovascular, haematological, immunological & respiratory systems
Functions of the digestive, metabolic & endocrine systems
Genitourinary & reproductive functions
Neuromusculoskeletal & movement-related functions
Functions of the skin & related structures
BODY STRUCTURES Structures of the nervous system
The eye, ear & related structures
Structures involved in voice & speech
Structures of the cardiovascular, immunological & respiratory systems
Structures related to the digestive, metabolic & endocrine systems
Structures related to the genitourinary & reproductive systems
Structures related to movement
Skin & related structures
ACTIVITIES & PARTICIPATION
Learning & applying knowledge
General tasks & demands
Communication
Mobility
Self-care
Domestic life
Interpersonal interactions & relationships
Major life areas
Community, social & civic life
ENVIRONMENTAL FACTORS
Products & technology
Natural environment & human-made changes to environment
Support & relationships
Attitudes
Services, systems & policies

13
The Arab countries that have signed the CRPD as of April
2014 are: Algeria, Bahrain, the Comoros, Egypt, Jordan,
Lebanon, Libya, Morocco, Oman, Qatar, the Sudan, the Syrian Arab
Republic, Tunisia, the United Arab Emirates and Yemen. The
Arab countries that have ratified or acceded to the CRPD as of
April 2014 are: Algeria, Bahrain, Djibouti, Egypt, Iraq, Jordan,
Kuwait, Mauritania, Morocco, Oman, Palestine, Qatar, Saudi Arabia, the Sudan, the Syrian
Arab Republic, Tunisia, the United Arab Emirates and Yemen.
11
The Arab countries that have signed the Optional Protocol as of April 2014 are: Algeria,
Jordan, Lebanon, Qatar, Tunisia, the United Arab Emirates and
Yemen. The Arab countries that have ratified or acceded to the
Optional Protocol as of April 2014 are: Djibouti, Mauritania,
Morocco, Saudi Arabia, the Sudan, the Syrian Arab Republic,
Tunisia and Yemen.
12
Significant developments have taken place over recent years with regards to the institutional and legal frameworks on disability in Arab countries. The signature and ratification status of the CRPD is high in the region; 15 countries have signed and 18 have ratified or acceded to the CRPD since it was opened for signature in 2007.11 Moreover, seven Arab countries have signed and eight have ratified or acceded to the Optional Protocol,12 which allows individuals or groups to submit complaints regarding breaches of CRPD provisions by States Parties. While collective efforts will be required to sustain this momentum, such trends reflect the strong and growing political commitment of Arab governments to better protect and promote the rights of persons with disabilities.
Regarding the implementation of the CRPD and Optional Protocol, it is worth noting that most countries in the Arab region have established national coordination mechanisms on dis-ability, mainly in the form of national disability councils. In many of these cases, persons with disabilities are directly involved in the mecha-nism, which represents a significant trend given the critical importance of actively involv-
ing persons with disabilities in policy- and decision-making processes. A majority of Arab countries have also established focal points for disability-related matters in line ministries and other governmental institutions. On the level of national legal frameworks, most Arab countries have included articles on disability in their constitutions. Moreover, comprehensive disability laws exist in most of the region, with Iraq as the most recent country to adopt a new law on disability in September 2013. Half of Arab countries report that they have or are developing a national strategy or plan on disability (see Table 3).
In sum, overarching institutional and legisla-tive frameworks on disability have expanded significantly in the Arab region over recent years. While further research is needed into the content, implementation and effectiveness of these institutions and laws, their establishment nevertheless represents an important develop-ment in national efforts to protect and promote the rights of persons with disabilities.
MAPPING THE INSTITUTIONAL AND LEGAL FRAMEWORKS IN THE ARAB REGION
[P]ersons with disabilities should have
the opportunity to be actively involved in
decision-making processes about policies
and programmes, including those directly
concerning them.
UN Convention on the Rights of Persons with Disabilities (Preamble, paragraph (o))

14
National coordination
mechanism
for disabilityin the governm
ent
Direct involvem
ent of persons w
ith disabilitiesin the m
echanism
Focal point(s) for disability in line m
inistries or othergovernm
ental institutions
Articles on disabilityincluded in the constitution
Overarching or general
disability law
National disability
strategy or plan
Table 3. Overarching institutional and legal frameworks for disability in the Arab region
SOURCE: ESCWA, based on data collected from government focal points through the ESCWA Questionnaire on the Implementation of the Convention on the Rights of Persons with Disabilities and the Arab Decade for Persons with Disabilities (2013).
ABBREVIATIONS: Y, Yes; N, No; –, Not applicable; CBD, Currently being developed.
ALGERIA Y Y .. Y Y ..
BAHRAIN Y Y Y Y Y Y
COMOROS .. .. .. .. .. ..
DJIBOUTI .. .. .. .. .. ..
EGYPT Y Y Y Y Y N
IRAQ N – Y Y Y N
JORDAN Y Y Y Y Y Y
KUWAIT Y N Y Y Y ..
LEBANON Y Y N N Y CBD
LIBYA .. .. .. .. .. ..
MAURITANIA .. .. .. .. .. ..
MOROCCO Y Y CBD Y Y Y
OMAN Y Y Y Y Y CBD
PALESTINE Y Y Y Y Y Y
QATAR N – Y N Y Y
SAUDI ARABIA Y Y Y Y Y Y
SOMALIA .. .. .. .. .. ..
SUDAN Y Y Y Y Y Y
SYRIAN ARAB REPUBLIC .. .. .. .. .. ..
TUNISIA Y Y Y CBD Y Y
UNITED ARAB EMIRATES N – Y N Y N
YEMEN Y Y Y Y Y CBD

15
BREAKING THE CYCLE OF EXCLUSION: ACCESS TO EMPLOYMENT AND EDUCATION
OECD, 2010, p. 51.
For more information on the relationship between
poverty and disability, see e.g. Braithwaite and Mont, 2008;
Elwan, 1999; ESCWA, 2013; ESCWA, 2010a; Groce et al.,
2011; Mitra et al., 2011; WHO and World Bank, 2011.
15
13
See also ESCWA, 2010b.14
Poverty and disability are often inextricably linked to form a mutually reinforcing cycle of vulnerability. People living in poverty are more likely to have or to incur disabilities as they have limited access to quality health care and are more exposed to risk factors such as malnutrition and poor sanitation. At the same time, persons with disabilities often face substantial barriers in finding employment and accessing education, which in turn increases their vulnerability.13
While data on income levels among persons with disabilities is scant in the region, available data on economic activity and educational attainment can provide important insight into the scale of deprivation experienced by persons with disabilities in Arab countries. Moreover, it is crucial to study these trends as access to employment and education also represent fundamental human rights, which are key to enabling equal participation of persons with disabilities in social and economic life.
It is clear that governments have made significant steps to develop their legislative frameworks regarding access to labour mar-kets and education. National laws on employ-ment for persons with disabilities, for example, are prevalent throughout the Arab region and are reported in a vast majority of countries. In addition, a large number of Arab countries have also instituted employment quotas for persons with disabilities, mainly in the public sector, but also, increasingly, in the private sector (see Table 4).14
However, when looking at the impact of these institutional and legal reforms on economic activity and employment rates, the picture becomes far more mixed.
High disparities in economic activity and employment rates can be found when compar-ing data on persons with disabilities with data on total populations (see Figure 2). In almost all countries where data is readily available, persons with disabilities report substantially lower levels of employment than their peers without disabilities. In some cases, employ-ment rates for persons with disabilities are half or even one third that of the total population. Good practices in other countries demonstrate that these rates are far from what is achiev-able; Germany, Iceland, Luxembourg, Mexico and Sweden report employment rates for persons with disabilities of at least two thirds that of their total populations.15
The trends found in Arab countries concur with findings in scholarly research from other regions. A recent study by the Organization for Economic Co-operation and Development (OECD) finds that employment rates are significantly lower for persons with disabilities than for the total population in a number of
States Parties recognize the right of
persons with disabilities to work, on an equal
basis with others; this includes the right
to the opportunity to gain a living by work
freely chosen or accepted in a labour market
and work environment that is open, inclusive
and accessible to persons with disabilities.
UN Convention on the Rights of Persons with Disabilities (Article 27, paragraph 1)

16
ALGERIA One per cent for each employerSOURCE: Law No. 02-09 on the Protection and Promotion of Persons with Disabilities (2002), Chapter 3, Article 27
BAHRAIN Two per cent for employers that employ 50 people or morea
SOURCE: Law No. 74 on the Welfare, Rehabilitation and Employment of Persons with Disabilities (2006), Article 11
COMOROS ..
DJIBOUTI ..
EGYPT Five per cent for employers that employ 50 people or moreSOURCE: Law No. 39 on the Rehabilitation of Disabled Persons (1975), amended by Law No. 49 (1982), Chapter 1, Article 9
IRAQ Five per cent for the public sector; one person with disability for mixed sector companies that employ 30 to 60 people; at least three per centfor mixed sector companies that employ over 60 peopleSOURCE: Law No. 38 on the Welfare of Persons with Disabilities and Special Needs (2013), Article 16
JORDAN One person with disability for public and private entities that employ between 25 and 50 people; four per cent for public and private entitiesthat employ more than 50 peopleSOURCE: Law No. 31 on the Rights of Disabled Persons (2007), Article 4/3
KUWAIT Four per cent of all Kuwaiti national employees for public, private andoil entities that employ at least 50 Kuwaiti nationalsSOURCE: Law No. 8 on the Rights of Persons with Disabilities (2010), Chapter 4, Article 14
LEBANON Three per cent for the public sector; one person with disability for private companies that employ 30 to 60 people; three per cent forprivate companies that employ over 60 peopleSOURCE: Law No. 220 on the Rights of Persons with Disabilities (2000), Section 8, Articles 73-74
LIBYA ..
MAURITANIA ..
MOROCCO Seven per cent for the public sectorSOURCE: Prime Ministerial Decision No. 3.130.00 on Determining the Number of Posts Allocated to Disabled Persons and the Percentage of those Posts in State Departments and other Relevant Bodies (2000), Article 2
Table 4. National employment quotas for persons with disabilities in the Arab region

17
SOURCE: ESCWA, based on data collected from government focal points through the ESCWA Questionnaire on the Implementation of the Convention on the Rights of Persons with Disabilities and the Arab Decade for Persons with Disabilities (2013).
NOTES: a according to the questionnaire response from the government focal point, this quota will be replaced by other measures; b according to the questionnaire response from the government focal point, a new quota is currently being developed; c according to the questionnaire response from the government focal point, the Emirate of Abu Dhabi has introduced a 2 per cent quota for local public institutions.
OMAN No specific quota is defined, but the law stipulates that public and private companies that employ 50 people or more must allocate a percentage of posts to persons with disabilities, which is determinedaccording to the number of vacant postsSOURCE: Sultanate Decree No. 63 on the Law on Care and Rehabilitation of the Disabled (2008), Section 2, Article 9; Sultanate Decree No. 35 on the Labour Law (2003), Article 17
PALESTINE Five per cent for government and non-government organizationsSOURCE: Law No. 4 Concerning the Rights of the Disabled (1999), Chapter 2, Article 10, 4c
QATAR At least two per cent for the public sector; at least two per cent with a minimum of one person with disability for private sector employersthat employ 25 people or moreb
SOURCE: Law No. 2 on Persons with Disabilities (2004), Article 5
SAUDI ARABIA Four per cent for companies that employ 25 people or moreSOURCE: Royal Decree No. M/51, Labour Law (2005) Section 2, Chapter 2, Article 28
SOMALIA ..
SUDAN Two per cent for government entitiesSOURCE: National Civil Service Law (2007), Section 4, Article 24/7
SYRIAN ARABREPUBLIC
Two per cent for the public sectorSOURCE: Labour Law No. 17 (2010), Article 136
TUNISIA One per cent of posts for the public sector; one per cent for public andprivate institutions that employ 100 people or moreSOURCE: Directive No. 83 on the Advancement and Protection of Persons with Disabilities (2005), Articles 29-30
UNITED ARABEMIRATES
No specific quota is defined, but the law stipulates that a number of posts are reserved for the disabled in the civil service, which isdetermined by the Civil Service Boardc
SOURCE: Civil Service Law No. 21 (2001)
YEMEN Five per cent of total vacancies in public and private sectorsSOURCE: Prime Ministerial Decision No. 284 (2002) on the Executive Rules of Law No. 61 on the Care and Rehabilitation of the Disabled (1999)
Table 4 (cont’d). National employment quotas for persons with disabilities in the Arab region

18
OECD countries such as Ireland, Poland and the United States of America, and that these employment gaps tend to be higher for per-sons with certain types of disabilities, such as those with mental health conditions.16 Another study of employment rates for persons with disabilities in 15 developing countries comes to similar conclusions.17 More specifically, it finds that employment rates are significantly lower for persons with disabilities in nine countries, with the largest gaps being reported for per-sons with multiple disabilities.
Similarly, while laws and regulations on education for persons with disabilities are widespread in the Arab region, available data suggests that these frameworks have limited impact on the ground. For those Arab countries where comparable data on educational attain-ment is available, the proportion of persons who are considered illiterate is substantially higher for persons with disabilities than for total populations (see Figure 3). Moreover, educational attainment rates, especially at secondary and tertiary levels, tend to be significantly lower for persons with disabilities than for total populations.
These trends in educational attainment data also accord with previous findings by scholars and international organizations. In its research on the Middle East and North Africa, for example, the World Bank finds that education systems “continue to exclude the majority of the disabled school-aged population at the primary
Figure 2. Distribution of persons with disabilities and total population (15+ years) by economic activity for selected Arab countries (%)
SOURCES: ESCWA, based on data verified by national statistical offices from the following sources: Egypt: Central Agency for Public Mobilization and Statistics (2006); Jordan: Department of Statistics (2010); Kuwait: Central Statistical Bureau (2011); Oman: National Center for Statistics and Information (2010); Palestine: Palestinian Central Bureau of Statistics (2007); Qatar: Qatar Statistics Authority (2010).
NOTES: a data pertains to nationals only; b data pertains to persons aged 10 years and above.
LEGEND:
Total population
Employed
Employed
Unemployed
Unemployed
Not economically active
Not economically active
Not specified
Not specified
Persons with disabilities
EGYPT21.1 40.03.8 4.375.1 55.7
25.5 86.60.8 0.473.6 13.0QATAR
16.1 36.61.7 4.482.2 59.0JORDAN
35.8 73.25.1 2.759.1 24.1KUWAIT
14.9 35.34.5 11.480.5 53.3OMANa
16.6 24.96.1 7.577.1 67.30.2 0.3PALESTINEb
Persons with disabilities (%) Total population (%)
Ibid., pp. 50-51.
Mizunoya and Mitra, 2013.
16
17
States Parties shall ensure that
...children with disabilities are not excluded
from free and compulsory primary
education, or from secondary education, on
the basis of disability.
UN Convention on the Rights of Persons with Disabilities (Article 24, paragraph 2)

19
level and almost the entirety of this population at the university level”.18 Similarly, the United Nations Children’s Fund (UNICEF) concludes that although in principle all children have the same right to an education, children with dis-abilities are often denied this right in practice.19
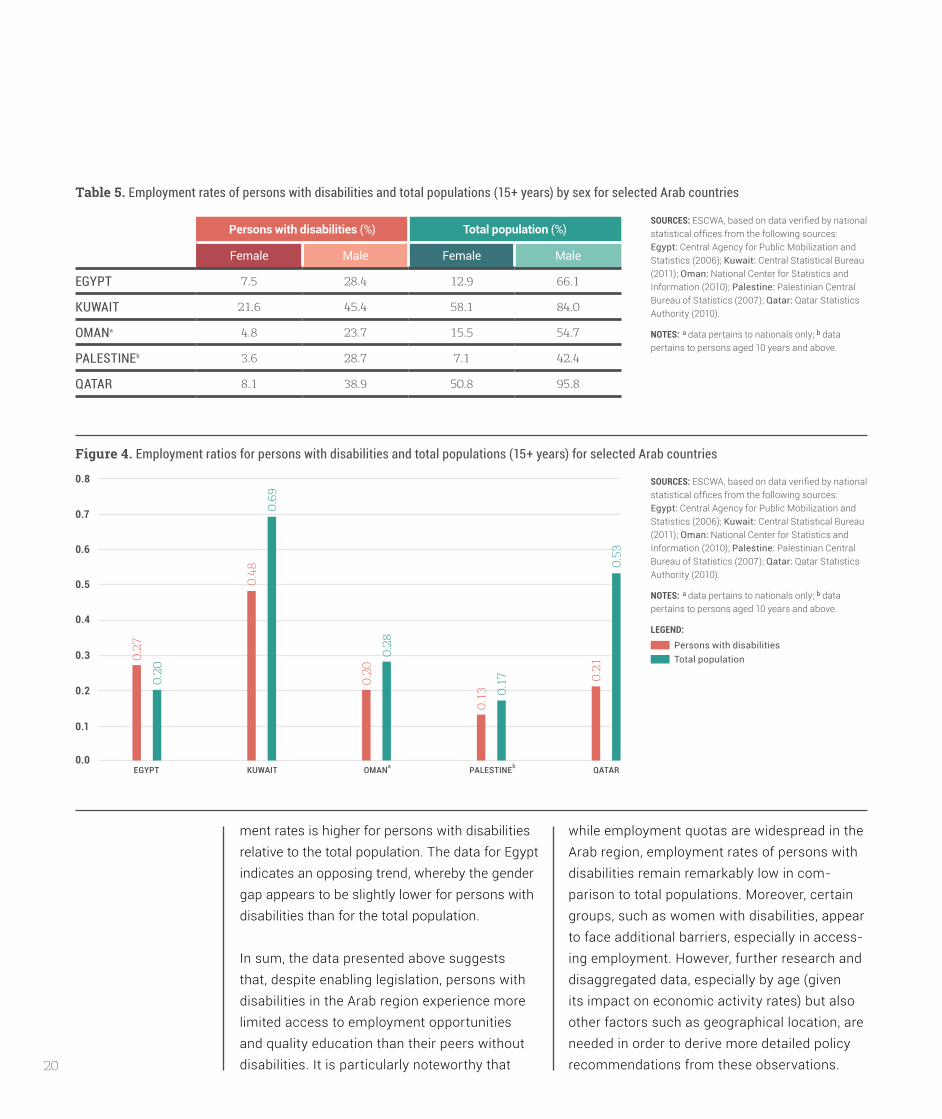
Gender gaps are very visible in the available data on economic activity and educational attainment. Table 5 presents employment rates for persons with disabilities and total popula-tions disaggregated by sex for those Arab countries where comparable data is available. According to this table, gender gaps in employ-ment rates exist both for persons with dis-abilities and total populations. The magnitude of this gap varies among countries, with some reporting employment rates that are three to four times higher for men than for women.
Since employment rates for women are also rather low among total populations, the addi-tional disadvantage experienced by women as a result of their disability can be visualized by
calculating employment ratios. Employment ratios for the same five countries are presented in Figure 4. Employment ratios are a helpful tool for exploring the extent to which persons with disabilities are integrated into the labour market relative to total populations.20 The ratios below have been calculated for persons with disabilities by dividing the employment rate of women with disabilities by that of men with disabilities. Similarly for the total population, the ratios have been calculated by dividing the overall employment rate for women by the overall employment rate for men. A ratio close to one indicates that there is relative parity between men and women in accessing employ-ment, while a ratio close to zero suggests that women have very limited access to employment opportunities relative to men.
For four out of the five countries presented, employment ratios are lower for persons with disabilities than for total populations. In other words, the data for Kuwait, Oman, Palestine and Qatar suggests that the gender gap in employ-
World Bank, 2005, p. ii.18
UNICEF, 2013, p. 27.
See e.g. Mizunoya and Mitra, 2013; WHO and World Bank,
2011, p. 236.
19
20
Figure 3. Differentials in illiteracy for persons with disabilities and total populations (10+ years) according to educational attainment data for selected Arab countries (%)
SOURCES: ESCWA, based on data verified by national statistical offices from the following sources: Egypt: Central Agency for Public Mobilization and Statistics (2006); Iraq: Central Organization for Statistics and Information Technology et al. (2007); Kuwait: Central Statistical Bureau (2011); Oman: National Center for Statistics and Information (2010); Palestine: Palestinian Central Bureau of Statistics (2007); Qatar: Qatar Statistics Authority (2010).
NOTES: a percentages for Iraq are calculated as follows: for persons with disabilities - total number of persons with disabilities (6+ years) classified as illiterate divided by the total number of persons with disabilities (all ages); for total population - total number of persons (6+ years) classified as illiterate divided by the total population (all ages); and b data pertains to nationals only and to persons aged 15+ years.
LEGEND:
PALESTINEOMANbKUWAITIRAQaEGYPT QATAR0
10
20
30
40
50
60
70
61.3
29.6
51.2
17.7
8.5
20.5
14.1
56.4
5.6
33.4
3.6
26.4
Persons with disabilitiesTotal population
20
ment rates is higher for persons with disabilities relative to the total population. The data for Egypt indicates an opposing trend, whereby the gender gap appears to be slightly lower for persons with disabilities than for the total population.
In sum, the data presented above suggests that, despite enabling legislation, persons with disabilities in the Arab region experience more limited access to employment opportunities and quality education than their peers without disabilities. It is particularly noteworthy that
while employment quotas are widespread in the Arab region, employment rates of persons with disabilities remain remarkably low in com-parison to total populations. Moreover, certain groups, such as women with disabilities, appear to face additional barriers, especially in access-ing employment. However, further research and disaggregated data, especially by age (given its impact on economic activity rates) but also other factors such as geographical location, are needed in order to derive more detailed policy recommendations from these observations.
Table 5. Employment rates of persons with disabilities and total populations (15+ years) by sex for selected Arab countries
SOURCES: ESCWA, based on data verified by national statistical offices from the following sources: Egypt: Central Agency for Public Mobilization and Statistics (2006); Kuwait: Central Statistical Bureau (2011); Oman: National Center for Statistics and Information (2010); Palestine: Palestinian Central Bureau of Statistics (2007); Qatar: Qatar Statistics Authority (2010).
NOTES: a data pertains to nationals only; b data pertains to persons aged 10 years and above.
Persons with disabilities (%) Total population (%)
Female Male Female Male
EGYPT 7.5 28.4 12.9 66.1
KUWAIT 21.6 45.4 58.1 84.0
OMANa 4.8 23.7 15.5 54.7
PALESTINEb 3.6 28.7 7.1 42.4
QATAR 8.1 38.9 50.8 95.8
Figure 4. Employment ratios for persons with disabilities and total populations (15+ years) for selected Arab countries
SOURCES: ESCWA, based on data verified by national statistical offices from the following sources: Egypt: Central Agency for Public Mobilization and Statistics (2006); Kuwait: Central Statistical Bureau (2011); Oman: National Center for Statistics and Information (2010); Palestine: Palestinian Central Bureau of Statistics (2007); Qatar: Qatar Statistics Authority (2010).
NOTES: a data pertains to nationals only; b data pertains to persons aged 10 years and above.
LEGEND:
0.0
0.1
0.2
0.3
0.4
0.5
0.6
0.7
0.8
EGYPT
0.27
0.20
KUWAIT
0.48
0.69
OMANa
0.20
0.28
PALESTINEb
0.13 0.
17
QATAR
0.21
0.53
Persons with disabilitiesTotal population

21
CONCLUDING REMARKSThis summary has served to highlight a number of key trends with regards to disability in the Arab region. For one, disability prevalence rates vary widely across Arab countries, but overall are remarkably low especially in comparison to global and other regional averages. These remarkable regional variations in disability prevalence merit further analysis, especially as a number of countries that use the short set of questions developed by the Washington Group on Disability Statistics21 report relatively low disability prevalence. Secondly, significant steps have been taken to strengthen national institutions and laws related to disability, which are now widely established throughout the region. However, despite these developments, available data also indicates that persons with disabilities, and especially women with disabili-ties, continue to experience marginalization and more limited opportunities in accessing decent work opportunities and quality education in comparison to their peers without disabilities.
What are the policy implications of these findings? Firstly, further efforts are needed to promote reliability and comparability of disability-related data in the Arab region. In par-ticular, countries should further harmonize and strengthen their data collection methodologies, especially censuses, with the aim of producing more accurate, detailed and comparable data on persons with disabilities. This should include the adoption of standard questions such as the short set of questions developed by the Washington Group on Disability Statistics, and ensuring that censuses and surveys are com-plemented by effective communication strate-gies that raise awareness and combat the social stigma that discourages people from reporting their disabilities. Countries should also work
towards aligning their definitions of disability—including classifications of disability types—with internationally agreed guidelines and standards, such as the CRPD and the ICF. Secondly, gov-ernments should continue their efforts to har-monize domestic legislation with the CRPD, and ensure that these laws are effectively enforced. Finally, further efforts are needed to ensure the full inclusion of persons with disabilities in labour markets and education systems, while giving particular attention to groups at risk of heightened discrimination and access barriers, including women with disabilities. To this end, governments must among other things ensure the effective implementation of employment quotas and anti-discrimination laws, which should be coupled with adequate enforcement mechanisms, including appropriate sanctions and incentive schemes.
While this study has focused on particular dimensions of inclusion, such as employ-ment and education, it is also crucial that these efforts be framed within a system-wide approach aimed at protecting and promoting the full spectrum of human rights enshrined in the CRPD and the Universal Declaration of Human Rights. In other words, specific mea-sures to promote inclusion and accessibility in for example schools and the workplace, should take place as part of a wider, holistic and rights-based framework for disability that is applied across government institutions, including such issues as access to the justice system and broader aspects of social safety nets, such as child protective services.
Furthermore, additional focus on the imple-mentation and impact of laws and policies is also necessary. The results of this study show that institutions and laws on disability have expanded substantially over recent years.
Available from http://www.cdc.gov/nchs/data/washington_group/WG_Short_
Measure_on_Disability.pdf (accessed 12 December 2013).
21

22
However, beyond the political intentions and provisions reflected in the legal and institutional frameworks of Arab countries, it is also crucial to monitor their impact on the ground. While available disability-related data help us to dis-cern certain general trends, they are neverthe-less insufficient indicators of policy impact and social change from a bottom-up perspective. As such, the development of adequate indica-tors of policy impact and the strengthening of monitoring and evaluation mechanisms are primary tasks that deserve priority attention in the region’s continued efforts on disability.
It is today widely recognized that the inclusion of persons with disabilities represents a key component for the success of development objectives, including the Millennium Develop-ment Goals and the post-2015 development agenda. Failure to do so means that large seg-ments of the population, all with vast potential, are effectively excluded from contributing to the socio-economic development of their societies. Looking forward, governments and other stake-holders should build on current momentum and strengthen their efforts to ensure that persons with disabilities have the opportunities and support needed in order to realize their rights to participate in and contribute to society on an equal basis with others.

23
3 COUNTRY PROFILES
EXPLANATORY NOTEThe following country profiles have been compiled based on data collected by ESCWA and the League of Arab States between May and September 2013. Data on persons with disabilities was collected for a range of selected quantitative indicators from national censuses and household survey data. Com-parable data on the total population was also collected wherever possible for indicators related to geographical location, marital status, educational attainment and economic activity. Data was then sent to designated focal points in the national statistical offices of all 22 Arab countries for verification. Additional data was collected from the same year as the source for the data on persons with disabilities for the following socio-economic indicators: Human Development Index (HDI), life expectancy at birth and gross national income (GNI).22 Qualitative information on institutions and laws (presented on the second page of each country profile) was collected through a questionnaire,23 which ESCWA and the League of Arab States distributed to their respective government focal points.
The main purpose of the country profiles is to present a picture of the situation of persons with disabilities, not in isolation, but in the context of the societies in which they live. As such, comparability of data between persons with disabilities and total populations rep-resented a key priority during the study. In order to facilitate such comparability, certain statistical principles had to be observed during the data collection process.
Firstly, in cases where competing sources of quantitative data and conflicting information were encountered, ESCWA selected the source
that (i) provides the most comprehensive data on the set of selected quantitative indicators; and (ii) includes the most recent data on both persons with disabilities and the total popula-tion. In some countries, the only source that provides comparable data on both persons with disabilities and the total population may date from several years back. While more recent data on disability may be available for some countries, ESCWA selected this data in order to better reflect the situation of persons with disabilities in their societies.
Secondly, in those limited cases where data on persons with disabilities and total populations were not available from the same source, tables on total populations were left blank. In other words, data on total populations in these cases may be available from other sources, but has been omitted from this study as it would be of limited use for comparative purposes. In only one case, Syria, did we choose to present data on both persons with disabilities and on the total population even though they do not stem from the same source, and readers should be aware of their limited comparability. In addition, no data was available for four countries (the Comoros, Djibouti, Mauritania and Somalia), and therefore these country profiles are also presented as blank.
Finally, it is important to note that the terminology and categories presented in the country profiles have been taken directly from official country data sources and as such do not necessarily reflect recommended UN terminology, as enshrined in, for example, the ICF (see Table 2).
GNI is calculated in per capita terms, in 2005 international dollars at purchasing power
parity (PPP).
The format of this questionnaire was adapted
from a questionnaire developed by the Economic Commission
for Latin American and the Caribbean (ECLAC) Sub-
Regional Headquarters for the Caribbean (see Ebbeson et al.,
2011, pp. 60-72).
22
23

24
Cause of disability/difficulty (%)
Congenital/hereditary Birth/labour relatedInfectious/viral diseasePsychological/physical violenceOld ageAccidentOtherNot specified
Female
..
..
..
..
..
..
..
..
Male
..
..
..
..
..
..
..
..
Total
28.52.0
14.27.9
12.516.712.75.6
SOCIO-ECONOMIC INDICATORS HDI Life expectancy at birth GNI per capita
0.685 72.0 6,927
Type of disability/difficulty (%)
Disability prevalence (%)
TotalMaleFemale
Age-specific disability prevalence (%)
0-14 15-24 25-44 45-64 65+
MaleTotal
Female
Age distribution of persons with disabilities (%)
Male
Total
Female0-14 15-24 25-44 45-64 65+
Persons with disabilities1 Total population1
Male .. (50.4%)
Female .. (49.6%)
..
Male.. (77.8%)
Female .. (22.2%)
..
ALGERIA 2006
Female
1.1
Male
3.9
Total
2.5
SOURCE: UNDP
..
..
..
..
..
..
..
..
..
..
..
..
..
..
..
.. .. .. .. .. .. .. .. .. .. .. .. .. .. ..
..
....
..
....
..
....
..
..
..
.... .. ..
..
..
ON THE SELECTION OF DATASET AND YEAR, PLEASE SEE PAGE 23

25
BY EDUCATIONAL ATTAINMENT
Total population (%)Age: 6+ years
Persons with disabilities (%)
MaleTotal
FemaleMaleTotal
Female
BY ECONOMIC ACTIVITY
Persons with disabilities (%) Total population (%)
PRE-SCHOOL 0.1 | 0.2 | 0.2
PRIMARY 36.9 | 35.5 | 36.1
INTERMEDIATE 32.1 | 37.8 | 35.2
SECONDARY 21.5 | 19.0 | 20.1
UNIVERSITY 9.4 | 7.6 | 8.4
Female Female
Male Male
Total Total
.. | .. | ..
.. | .. | ..
.. | .. | ..
.. | .. | ..
.. | .. | ..
.. | .. | ..
.. ..
.. ..
.. ..
ALG
ERIA

26
BY GEOGRAPHIC LOCATION
Persons with disabilities (%)
Total population (%)
Total
Total
URBAN55.8
RURAL44.2
BY MARITAL STATUS
Persons with disabilities (%)
43.847.0
2.07.1
0.9
52.945.8
0.4
NEVER MARRIEDMARRIEDDIVORCEDWIDOWED
NEVER MARRIEDMARRIEDDIVORCEDWIDOWED
NEVER MARRIEDMARRIEDDIVORCEDWIDOWED
Female
Male
Total
Female
Male
Total48.4
46.41.2
4.0
Total population (%)Age: 15+ years
All data categories are as provided by Algeria.
Office National des Statistiques et al. (2006).
SOURCE Data on the total number of persons with disabilities and total number of population is not available in the source.
Data on the sample size is available from the indicated source.
1
FOOTNOTE
URBAN53.4
RURAL46.6
..
..
..
..
..
..
..
..
..
..
..
..
Total
Total population (%)
Female
Female
Male
Male Total
..
..
..
..
..
..
..
..
ALG
ERIA

27
CONVENTION
Signed SignedRatified/acceded
OPTIONAL PROTOCOL
National institutional framework for disability/persons with disabilities
National definition of disability/persons with disabilities
National legislative framework for disability/persons with disabilities (year of adoption)
ADDITIONAL MECHANISMS
Ratified/acceded
NATIONAL COORDINATION MECHANISM
Signature/ratification of the Convention on the Rights of Persons with Disabilities & its optional protocol
SOURCE: ESCWA, based on data collected from government focal points through the ESCWA Questionnaire on the Implementation of the Convention on the Rights of Persons with Disabilities and the Arab Decade for Persons with Disabilities (2013).
SOURCE: UN (2014).
30.3.2007 30.3.20074.12.2009
Every person, regardless of age and sex, who suffers from one or more than one disability—congenital or hereditary or acquired—that impairs his ability to do one or more of the basic daily personal and social functions as a result of injury to their mental and/or locomotor and/or sensory functions.(Law No. 02-09 on the Protection and Promotion of Persons with Disabilities, 2002)
No
NameNational Council for Persons with Disabilities
Year established2006
ChairMinister of National Solidarity or his representative
Persons with disabilities represented?Yes
..
Articles on disability included in the constitution?
Yes
General/overarching national disability law
Law No. 02-09 on the Protection and Promotion of Persons with Disabilities (2002)
National disability strategy/plan
..
ALG
ERIA

28
Cause of disability/difficulty (%)
SOCIO-ECONOMIC INDICATORS HDI Life expectancy at birth GNI per capita
0.794 74.9 19,137
Type of disability/difficulty (%)
Disability prevalence (%)
TotalMaleFemale
Age-specific disability prevalence (%)
Age distribution of persons with disabilities (%)
Persons with disabilities2 Total population
Male 287,239 (50.5%)
Female281,160 (49.5%)
Male.. (52.0%)
Female .. (48.0%)
..
BAHRAIN 20101
Female
2.8
Male
3.0
Total
2.9
SOURCE: UNDP
568,399
0-9
1.6
1.9
1.8
10-24
2.0 2.6
2.3
25-39
2.1 2.8
2.5
40-64
3.6
3.6
3.6
65+
14.1
10.4 12
.4
MaleTotal
Female
Cause of disability/difficulty (%)
AccidentDiseaseSince birthHereditaryOther
Female
5.441.026.410.716.6
Male
12.131.732.18.3
15.8
Total
8.936.129.39.5
16.2
PHYSICAL/LOCOMOTOR DIFFICULTY
VISUAL
SPEECH DIFFICULTY
HEARING
30.7
17.4
4.2
6.414.6
10.4
16.3
MENTAL DIFFICULTY
MULTIPLE DIFFICULTIES
OTHER
Age distribution of persons with disabilities (%)
Male
Total
Female0-14 15-24 25-44 45-64 65+
..
..
..
..
..
..
..
..
..
..
..
..
..
..
..
ON THE SELECTION OF DATASET AND YEAR, PLEASE SEE PAGE 23

29
Total population (%)Age: 10+ years
Persons with disabilities (%)Age: 10+ years
MaleTotal
Female
Total
MaleTotal
Female ILLITERATE/READ ONLY/READ & WRITE 43.8 | 27.9 | 35.7
BELOW SECONDARY 20.5 | 28.6 | 24.6SECONDARY OR HIGHER
35.8 | 43.5 | 39.7
ILLITERATE/READ ONLY 9.3 | 3.2 | 6.3
READ & WRITE 11.4 | 9.7 | 10.6
PRIMARY 8.2 | 12.5 | 10.4
PREPARATORY 18.5 | 22.6 | 20.6
SECONDARY 35.4 | 37.5 | 36.5
BACHELOR 8.1 | 6.0 | 7.0
HIGHER DIPLOMA0.5 | 0.5 | 0.5
MASTER0.5 | 0.7 | 0.6
DOCTORATE0.1 | 0.2 | 0.1
POST-SECONDARY/DIPLOMA 7.9 | 7.1 | 7.5
Male
FemaleWORKING UNEMPLOYED29.3 2.9
UNABLE TO WORK
RETIRED
RETIRED
RETIRED
0.2
1.2
5.6
3.5
STUDENT HOMEMAKER
65+ YEARS & NOT WORKING
65+ YEARS & NOT WORKING
65+ YEARS & NOT WORKING
24.3 40.4
0.3
1.3
0.8
OTHERS
OTHERS
OTHERS
1.4
9.1
5.3
UNEMPLOYED1.3
UNABLE TO WORK0.3
STUDENT HOMEMAKER20.5 0.0
TotalIN LABOR FORCE OUT OF LABOR FORCE35.1 64.9
Persons with disabilities (%)Age: 15+ years
Total population (%)Age: 15+ years
WORKING61.9
WORKING45.7
Female
Male
..
..
UNEMPLOYED2.1
UNABLE TO WORK0.3
STUDENT HOMEMAKER22.4 20.1
BY EDUCATIONAL ATTAINMENT
BY ECONOMIC ACTIVITY
BAH
RA
IN

30
Persons with disabilities (%)
Persons with disabilities (%)Age: 15+ years
33.456.4
3.86.4
0.5
40.057.4
2.0
NEVER MARRIEDMARRIEDDIVORCEDWIDOWED
NEVER MARRIEDMARRIEDDIVORCEDWIDOWED
NEVER MARRIEDMARRIEDDIVORCEDWIDOWED
Female
Male
TotalNEVER MARRIEDMARRIEDDIVORCEDWIDOWED
Female
Male
Total36.747.4
56.938.32.93.53.510.8
Total population (%)Age: 15+ years
All data categories are as provided by Bahrain.
Data on persons with disabilities is from Central Informatics Organization (2010b); data on total population is from Central Informatics Organization (2010a).
SOURCES All data pertains to nationals only.Data on the total number of persons with
disabilities is not available in the source. Data on the sample size is available from the indicated source.
1
2
FOOTNOTES
Total population (%)
..
..
..
..
..
..
..
..
TotalFemale
Female
Male
Male Total
.. ..
.. ..
..
..
.. ..
.. ..
..
..
BY GEOGRAPHIC LOCATION
BY MARITAL STATUS
BAH
RA
IN

31
CONVENTION
Signed SignedRatified/acceded
OPTIONAL PROTOCOL
National institutional framework for disability/persons with disabilities
National definition of disability/persons with disabilities
National legislative framework for disability/persons with disabilities (year of adoption)
ADDITIONAL MECHANISMS
Ratified/acceded
NATIONAL COORDINATION MECHANISM
Signature/ratification of the Convention on the Rights of Persons with Disabilities & its optional protocol
SOURCE: ESCWA, based on data collected from government focal points through the ESCWA Questionnaire on the Implementation of the Convention on the Rights of Persons with Disabilities and the Arab Decade for Persons with Disabilities (2013).
SOURCE: UN (2014).
25.6.2007 No22.9.2011
A disabled person is a person who suffers from a shortage of physical or sensory or mental capacities as a result of illness or accident or congenital or hereditary factors that led to a total or partial inability to work or to continue working or to progress in their career, and weakened their capacity to perform other basic functions in life, and the person needs care and rehabilitation in order to be integrated or reintegrated into society.(Law No. 74 on the Welfare, Rehabilitation and Employment of Persons with Disabilities, 2006)
FOOTNOTE:1 The law is currently being amended.
No
NameHigh Commission for the Welfare of Persons with Disabilities
Year established2007
ChairMinister of Social Development
Persons with disabilities represented?Yes
System of focal points for disability related matters in line ministries or other governmental institutions
Articles on disability included in the constitution?
Yes
General/overarching national disability law
Law No. 74 on the Welfare, Rehabilitation and Employment of Persons with Disabilities (2006)1
National disability strategy/plan
National Strategy for Persons with Disabilities and Its Implementation Plan (2012-2016)
BAH
RA
IN

32
Cause of disability/difficulty (%)
SOCIO-ECONOMIC INDICATORS1 HDI Life expectancy at birth GNI per capita
0.429 61.5 986
Type of disability/difficulty (%)
Disability prevalence (%)
Age-specific disability prevalence (%)
Age distribution of persons with disabilities (%)
Persons with disabilities Total population
Male ..
Female ..
Male..
Female ..
..
COMOROS
Female Male Total
SOURCE: UNDP
..
Cause of disability/difficulty (%)
..
..
..
..
Female
..
..
..
..
Male
..
..
..
..
Total
..
..
..
..
Age distribution of persons with disabilities (%)
Male
Total
Female0-14 15-24 25-44 45-64 65+
..
..
..
..
..
..
..
..
..
..
..
..
..
..
..
0-14 15-24 25-44 45-64 65+
MaleTotal
Female
.. .. .. .. .. .. .. .. .. .. .. .. .. .. ..TotalMaleFemale
..
....
..
....
..
....
..
..
..
.... .. ..
..
..
.. .. ..
33
BY EDUCATIONAL ATTAINMENT
Total population (%)Persons with disabilities (%)
BY ECONOMIC ACTIVITY
Total Total
Persons with disabilities (%) Total population (%)
Female Female
Male Male
.. ..
.. ..
MaleTotal
FemaleMaleTotal
Female .. | .. | ..
.. | .. | ..
.. | .. | ..
.. | .. | ..
.. | .. | ..
.. | .. | ..
.. | .. | ..
.. | .. | ..
.. | .. | ..
.. | .. | ..
.. | .. | ..
.. | .. | ..
.. ..CO
MO
RO
S

34
BY GEOGRAPHIC LOCATION
Persons with disabilities (%)
BY MARITAL STATUS
Persons with disabilities (%)
Female
Total
Female
Male Male
Total
Total population (%)
Data for these three indicators is from 2012.1
FOOTNOTE
..
..
..
..
..
..
..
..
..
..
..
..
..
..
..
..
..
..
..
..
..
..
..
..
Total
Total population (%)
Female
Female
Male
Male Total
.. ..
.. ..
..
..
.. ..
.. ..
..
..
COM
OR
OS

35
CONVENTION
Signed SignedRatified/acceded
OPTIONAL PROTOCOL
National institutional framework for disability/persons with disabilities
National definition of disability/persons with disabilities
National legislative framework for disability/persons with disabilities (year of adoption)
ADDITIONAL MECHANISMS
Ratified/acceded
NATIONAL COORDINATION MECHANISM
Signature/ratification of the Convention on the Rights of Persons with Disabilities & its optional protocol
SOURCE: ..
SOURCE: UN (2014).
26.9.2007 NoNo No
Name..
Year established..
Chair..
Persons with disabilities represented?..
..
Articles on disability included in the constitution?
..
General/overarching national disability law
..
National disability strategy/plan
..
..
COM
OR
OS

36
Cause of disability/difficulty (%)
SOCIO-ECONOMIC INDICATORS1 HDI Life expectancy at birth GNI per capita
0.445 58.3 2,350
Type of disability/difficulty (%)
Disability prevalence (%)
Age-specific disability prevalence (%)
Age distribution of persons with disabilities (%)
Persons with disabilities Total population
Male ..
Female ..
Male..
Female ..
..
DJIBOUTI
Female Male Total
SOURCE: UNDP
..
Cause of disability/difficulty (%)
..
..
..
..
Female
..
..
..
..
Male
..
..
..
..
Total
..
..
..
..
Age distribution of persons with disabilities (%)
Male
Total
Female0-14 15-24 25-44 45-64 65+
..
..
..
..
..
..
..
..
..
..
..
..
..
..
..
0-14 15-24 25-44 45-64 65+
MaleTotal
Female
.. .. .. .. .. .. .. .. .. .. .. .. .. .. ..TotalMaleFemale
..
....
..
....
..
....
..
..
..
.... .. ..
..
..
.. .. ..

37
BY EDUCATIONAL ATTAINMENT
Total population (%)Persons with disabilities (%)
BY ECONOMIC ACTIVITY
Total Total
Persons with disabilities (%) Total population (%)
Female Female
Male Male
.. ..
.. ..
MaleTotal
FemaleMaleTotal
Female .. | .. | ..
.. | .. | ..
.. | .. | ..
.. | .. | ..
.. | .. | ..
.. | .. | ..
.. | .. | ..
.. | .. | ..
.. | .. | ..
.. | .. | ..
.. | .. | ..
.. | .. | ..
.. ..D
JIBO
UTI

38
BY GEOGRAPHIC LOCATION
Persons with disabilities (%)Total
BY MARITAL STATUS
Persons with disabilities (%)
Female
Total
Female
Male Male
Total
Total population (%)
1
FOOTNOTE
Total population (%)
Female
Female
Male
Male Total
.. ..
.. ..
..
..
.. ..
.. ..
..
..
..
..
..
..
..
..
..
..
..
..
..
..
..
..
..
..
..
..
..
..
..
..
..
..
Data for these three indicators is from 2012.
DJI
BOU
TI

39
CONVENTION
Signed SignedRatified/acceded
OPTIONAL PROTOCOL
National institutional framework for disability/persons with disabilities
National definition of disability/persons with disabilities
National legislative framework for disability/persons with disabilities (year of adoption)
ADDITIONAL MECHANISMS
Ratified/acceded
NATIONAL COORDINATION MECHANISM
Signature/ratification of the Convention on the Rights of Persons with Disabilities & its optional protocol
SOURCE: ..
Name..
Year established..
Chair..
Persons with disabilities represented?..
..
Articles on disability included in the constitution?
..
General/overarching national disability law
..
National disability strategy/plan
..
..
SOURCE: UN (2014).
No No18.6.2012 18.6.2012
DJI
BOU
TI

40
..
MUTE
OTHER DISABILITY
BLIND
ONE-EYED
DEAF
DEAF & MUTE
MENTALLY RETARDED
LOST ONE/BOTH HANDS
LOST ONE/BOTH LEGS
INFANTILE PARALYSIS
TOTAL/PARTIAL PARALYSIS
23.2
8.0
2.9
4.33.0
2.4
5.8
6.6
21.9
22.4
2.6
3.5
4.04.0
4.0
10.0
8.9
9.3
17.7
18.3
16.7
14.6
14.9
14.8
13.1
3.72.3
3.01.1
4.62.1
13.213.1
SOCIO-ECONOMIC INDICATORS HDI Life expectancy at birth GNI per capita
0.633 71.9 4,737
Age-specific disability prevalence (%)
Age distribution of persons with disabilities (%)1
SOURCE: UNDP
0-14 15-24 25-44 45-64 65+
MaleTotal
Female
.. .. .. .. .. .. .. .. .. .. .. .. .. .. ..
EGYPT 2006
Disability prevalence (%)Female Male Total
0.5 0.8 0.7
Persons with disabilities Total population
Male 37,219,056 (51.1%)
Female 35,578,975 (48.9%)
72,798,031
Male305,216 (64.2%)
Female 170,360 (35.8%)
475,576
Cause of disability/difficulty (%)
CongenitalBirth-related conditionsEpidemic diseaseOther diseasesPhysical/psychological abuseInjury/accidentOld ageOther
Female
54.65.86.66.81.67.2
13.63.7
Male
50.45.26.87.02.0
17.67.14.1
Total
51.95.46.86.91.8
13.99.43.9
Type of disability/difficulty (%)TotalMaleFemale
Male
Total
Female0-14
17.2
14.0
15.1
15-24
22.3
21.6
21.9
25-44
26.3
31.6
29.7
45-64
17.7
22.0
20.5
65+
16.5
10.8
12.8
ON THE SELECTION OF DATASET AND YEAR, PLEASE SEE PAGE 23
41
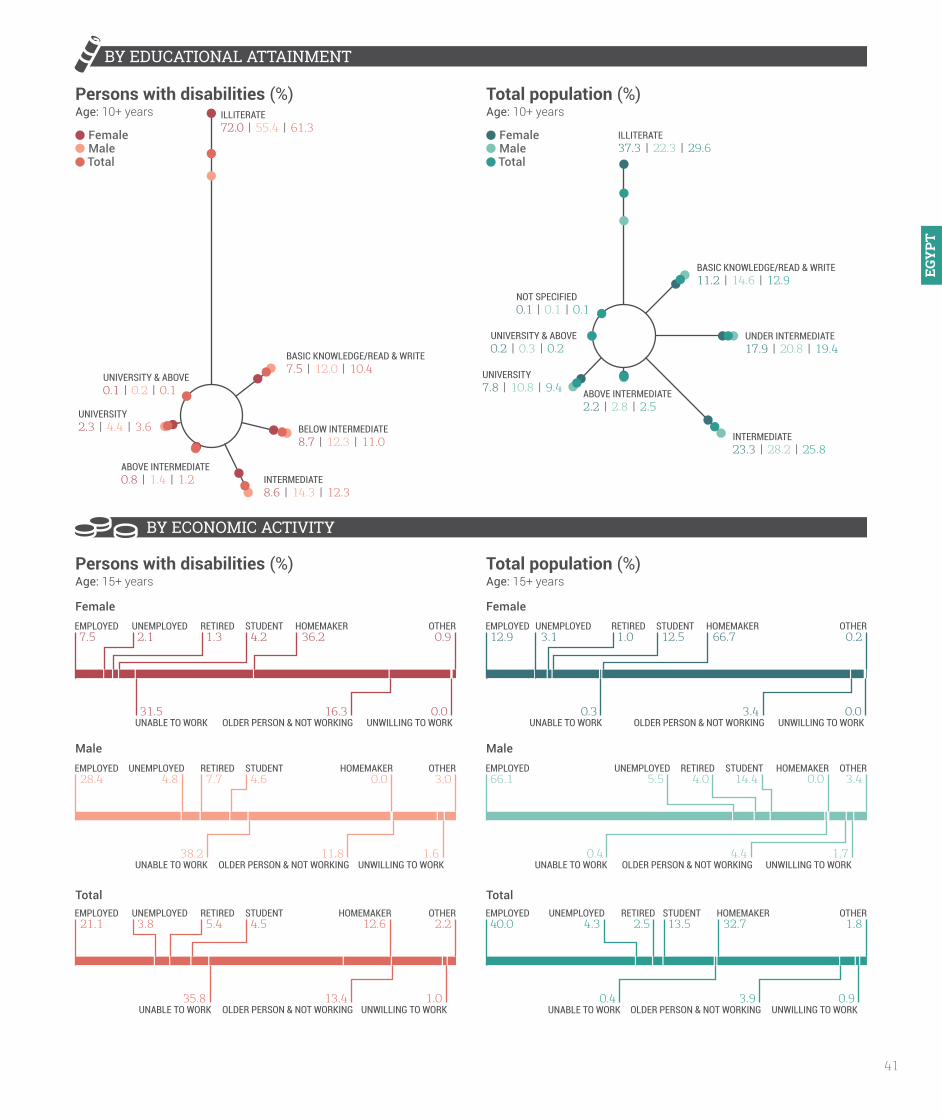
BY EDUCATIONAL ATTAINMENT
Total population (%)Age: 10+ years
Persons with disabilities (%)Age: 10+ years
BY ECONOMIC ACTIVITY
Total
Female Female
Male
MaleTotal
FemaleMaleTotal
Female
ILLITERATE72.0 | 55.4 | 61.3
BASIC KNOWLEDGE/READ & WRITE7.5 | 12.0 | 10.4
BELOW INTERMEDIATE8.7 | 12.3 | 11.0
ABOVE INTERMEDIATE0.8 | 1.4 | 1.2
UNIVERSITY2.3 | 4.4 | 3.6
UNIVERSITY & ABOVE0.1 | 0.2 | 0.1
INTERMEDIATE8.6 | 14.3 | 12.3
ILLITERATE 37.3 | 22.3 | 29.6
BASIC KNOWLEDGE/READ & WRITE11.2 | 14.6 | 12.9
UNDER INTERMEDIATE17.9 | 20.8 | 19.4
ABOVE INTERMEDIATE2.2 | 2.8 | 2.5
UNIVERSITY7.8 | 10.8 | 9.4
UNIVERSITY & ABOVE0.2 | 0.3 | 0.2
NOT SPECIFIED0.1 | 0.1 | 0.1
INTERMEDIATE23.3 | 28.2 | 25.8
Persons with disabilities (%)Age: 15+ years
Total population (%)Age: 15+ years
Male
EMPLOYED
EMPLOYED
UNEMPLOYED
UNEMPLOYED
7.5
28.4
2.1
4.8
STUDENT
STUDENT
HOMEMAKER
HOMEMAKER
4.2
4.6
36.2
0.0
RETIRED
RETIRED
UNABLE TO WORK
UNABLE TO WORK
OLDER PERSON & NOT WORKING
OLDER PERSON & NOT WORKING
1.3
7.7
31.5
38.2
16.3
11.8
OTHER
OTHER
0.9
3.0
Total
UNWILLING TO WORK
UNWILLING TO WORK
0.0
1.6
EMPLOYED UNEMPLOYED21.1 3.8
STUDENT HOMEMAKER4.5 12.6
RETIRED
UNABLE TO WORK OLDER PERSON & NOT WORKING
5.4
35.8 13.4
OTHER2.2
UNWILLING TO WORK1.0
EMPLOYED UNEMPLOYED12.9 3.1
STUDENT HOMEMAKER12.5 66.7
RETIRED
UNABLE TO WORK OLDER PERSON & NOT WORKING
1.0
0.3 3.4
OTHER0.2
UNWILLING TO WORK0.0
EMPLOYED UNEMPLOYED40.0 4.3
STUDENT HOMEMAKER13.5 32.7
RETIRED
UNABLE TO WORK OLDER PERSON & NOT WORKING
2.5
0.4 3.9
OTHER1.8
UNWILLING TO WORK0.9
EMPLOYED UNEMPLOYED66.1 5.5
STUDENT HOMEMAKER14.4 0.0
RETIRED
UNABLE TO WORK OLDER PERSON & NOT WORKING
4.0
0.4 4.4
OTHER3.4
UNWILLING TO WORK1.7
EGY
PT
42
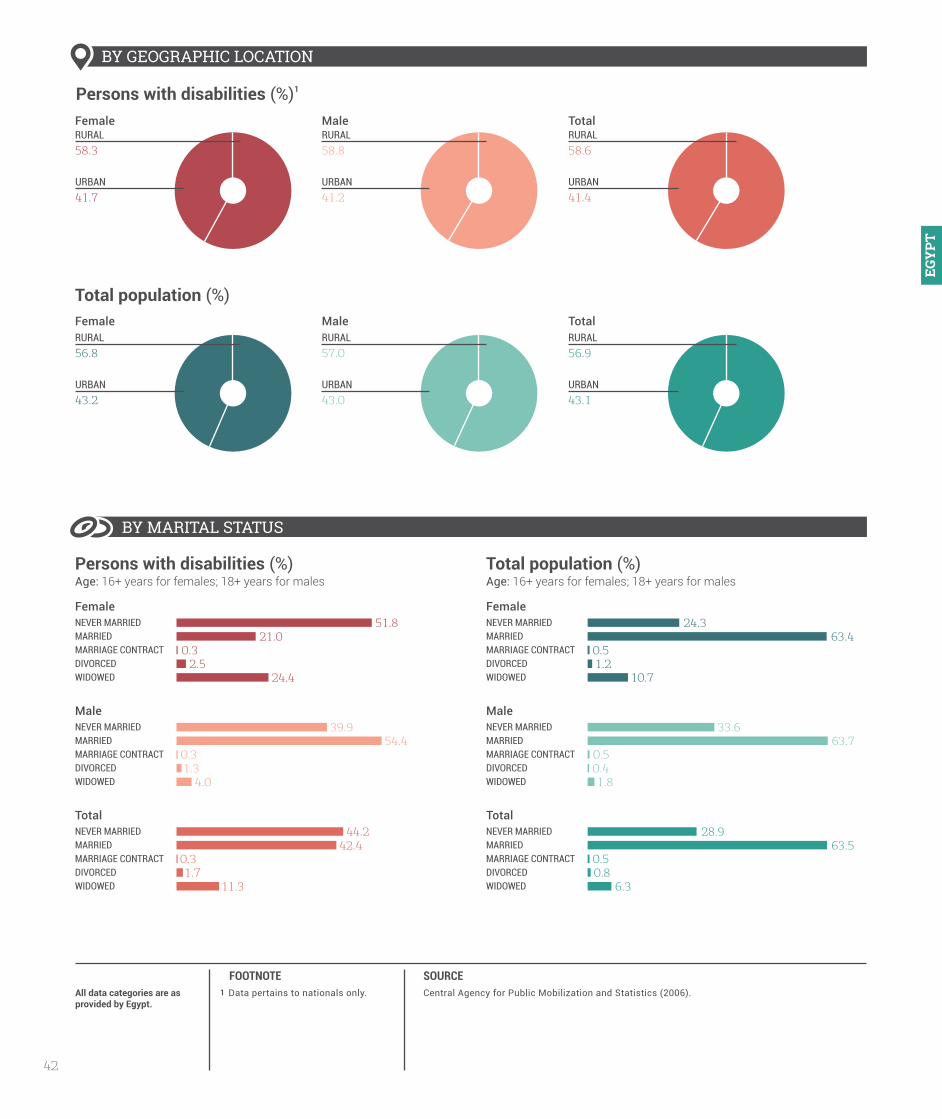
BY GEOGRAPHIC LOCATION
Total
BY MARITAL STATUS
Persons with disabilities (%)Age: 16+ years for females; 18+ years for males
Female Female
Total population (%)Age: 16+ years for females; 18+ years for males
Female
Female
Male
Male Total
RURAL58.3
RURAL58.8
URBAN41.4
URBAN41.2
URBAN41.7
RURAL58.6
RURAL56.8
RURAL57.0
URBAN43.1
URBAN43.0
URBAN43.2
RURAL56.9
NEVER MARRIED NEVER MARRIEDMARRIED MARRIEDMARRIAGE CONTRACT MARRIAGE CONTRACTDIVORCED DIVORCEDWIDOWED WIDOWED
NEVER MARRIEDMARRIEDMARRIAGE CONTRACTDIVORCEDWIDOWED
NEVER MARRIEDMARRIEDMARRIAGE CONTRACTDIVORCEDWIDOWED
NEVER MARRIEDMARRIEDMARRIAGE CONTRACTDIVORCEDWIDOWED
NEVER MARRIEDMARRIEDMARRIAGE CONTRACTDIVORCEDWIDOWED
51.8 24.321.0 63.4
0.3 0.52.5 1.2
24.4 10.7
Male Male39.9 33.6
54.4 63.70.3 0.51.3 0.4
4.0 1.8
Total Total44.2 28.9
42.4 63.50.3 0.51.7 0.8
11.3 6.3
All data categories are as provided by Egypt.
Central Agency for Public Mobilization and Statistics (2006).
SOURCE Data pertains to nationals only.1
FOOTNOTE
Total population (%)
Persons with disabilities (%)1
EGY
PT

43
Every person who has a decreased capability or who is unable to rely on themselves to work, or to assume or maintain a job, or to perform other tasks due to bodily, mental, or sensory deficiencies, or due to congenital disabilities. (Law No. 39 on Rehabilitation of the Disabled amended by Law No. 49, 1982)
CONVENTION
Signed SignedRatified/acceded
OPTIONAL PROTOCOL
National institutional framework for disability/persons with disabilities
National definition of disability/persons with disabilities
National legislative framework for disability/persons with disabilities (year of adoption)
ADDITIONAL MECHANISMS
Ratified/acceded
NATIONAL COORDINATION MECHANISM
Signature/ratification of the Convention on the Rights of Persons with Disabilities & its optional protocol
SOURCE: ESCWA, based on data collected from government focal points through the ESCWA Questionnaire on the Implementation of the Convention on the Rights of Persons with Disabilities and the Arab Decade for Persons with Disabilities (2013).
SOURCE: UN (2014).
4.4.2007 No14.4.2008 No
NameNational Council on Disability Affairs
Year established2012
ChairPrime Minister
Persons with disabilities represented?Yes
System of focal points for disability related matters in ministries or other governmental institutions
Articles on disability included in the constitution?
Yes
General/overarching national disability law
Law No. 39 on Rehabilitation of the Disabled (1975) amended by Law No. 49 (1982)
National disability strategy/plan
No
EGY
PT

44
BLINDNESS
DEAFNESS
MUTENESS/SPEECH DISABILITY
LIMP/WALKING DISABILITY/LOCOMOTOR DISABILITY
MENTAL RETARDATION
MULTIPLE DISABILITIES
OTHER
7.3
3.1
8.0
44.9
14.6
6.0
16.1
17.0
14.9
6.55.2
13.116.9
46.5
42.5
7.78.4
2.5 4.0
6.7
8.2
SOCIO-ECONOMIC INDICATORS HDI Life expectancy at birth GNI per capita
0.567 67.8 2,853
Age-specific disability prevalence (%)
Age distribution of persons with disabilities (%)
SOURCE: UNDP
IRAQ 2007
Disability prevalence (%)Female Male Total
2.3 3.4 2.8
Persons with disabilities Total population
Male 15,122,429 (50.2%)
Female 14,974,571 (49.8%)
30,097,000
Male511,451 (59.7%)
Female 344,935 (40.3%)
856,386
Type of disability/difficulty (%)TotalMaleFemale
Male
Total
Female
Cause of disability/difficulty (%)
Since birthWork-related accidentWork-related diseaseChemical strike/depleted uraniumLand minesArmed civil unrestWarNon work-related diseaseTraffic accidentOther
Female
51.01.61.00.40.20.62.7
18.22.7
21.5
Male
42.25.01.80.01.82.8
16.311.35.9
12.8
Total
45.63.71.50.21.12.0
11.014.04.7
16.2
0-9
1.3
1.4
1.3
10-19
2.1
2.3
2.2
20-39
1.5 3.
7
2.6
40-59
2.8 6.
3
4.5
60+
11.0
11.6
11.3
MaleTotal
Female
0-9
14.6
11.6
12.8
10-19
21.1
15.9
18.0
20-39
20.9
33.5
28.4
40-59
16.8
22.8
20.4
60+
26.5
16.2
20.4
ON THE SELECTION OF DATASET AND YEAR, PLEASE SEE PAGE 23

45
BY EDUCATIONAL ATTAINMENT
Total population (%)Persons with disabilities (%)
MaleTotal
FemaleMaleTotal
Female ILLITERATE66.0 | 41.3 | 51.2
READ ONLY2.8 | 3.7 | 3.3
READ & WRITE9.0 | 15.6 | 12.9
PRIMARY8.6 | 19.8 | 15.3
INTERMEDIATE2.1 | 6.4 | 4.7
SECONDARY/VOCATIONAL0.7 | 3.7 | 2.5
TECHNICAL DIPLOMA1.1 | 1.6 | 1.4
BACHELOR & ABOVE0.6 | 1.7 | 1.3
OTHER0.1 | 0.1 | 0.1
NOT SPECIFIED0.4 | 0.2 | 0.3
UNDER 6 YEARS OF AGE8.7 | 5.9 | 7.0
ILLITERATE 23.3 | 12.1 | 17.7
READ ONLY 6.2 | 7.1 | 6.7
READ & WRITE 17.0 | 17.2 | 17.1
PRIMARY 20.7 | 21.5 | 21.1
INTERMEDIATE 7.0 | 9.8 | 8.4
SECONDARY/VOCATIONAL 3.7 | 6.3 | 5.0
TECHNICAL DIPLOMA 2.8 | 3.8 | 3.3
BACHELOR & ABOVE 2.3 | 4.0 | 3.2
OTHER 0.0 | 0.0 | 0.0
NOT SPECIFIED 0.3 | 0.2 | 0.2
UNDER 6 YEARS OF AGE 16.7 | 17.9 | 17.3
BY ECONOMIC ACTIVITY
Female Female
Persons with disabilities (%) Total population (%)
WORKING
WORKING
WORKING
UNEMPLOYED
UNEMPLOYED
UNEMPLOYED
4.3
39.0
21.7
1.0
5.6
3.3
STUDENT
STUDENT
STUDENT
NOT WORKING BECAUSE OF SECURITY SITUATION
NOT WORKING BECAUSE OF SECURITY SITUATION
NOT WORKING BECAUSE OF SECURITY SITUATION
20.2
25.5
22.9
0.1
0.8
0.4
HOMEMAKER
HOMEMAKER
HOMEMAKER
TOO YOUNG TO WORK
TOO YOUNG TO WORK
TOO YOUNG TO WORK
UNABLE/DISABLED
UNABLE/DISABLED
UNABLE/DISABLED
46.0
0.0
22.9
2.6
2.8
2.7
1.2
1.4
1.3
UNDER 6 YEARS OF AGE
UNDER 6 YEARS OF AGE
UNDER 6 YEARS OF AGE
OTHER
OTHER
OTHER
RETIRED
RETIRED
RETIRED
16.7
17.9
17.3
7.6
4.1
5.9
0.2
2.8
1.5
Total Total
Male Male
..
..
..IR
AQ

46
BY GEOGRAPHIC LOCATION
Total
BY MARITAL STATUS
Persons with disabilities (%)Age: 12+ years
Total population (%)Age: 12+ years
Total population (%)
Female
Female
Male
Male Total
RURAL26.0
RURAL27.5
URBAN29.3
URBAN45.2
URBAN32.3
RURAL26.9
RURAL29.3
RURAL28.9
URBAN29.4
URBAN29.4
URBAN29.4
RURAL29.1
Female FemaleNEVER MARRIED NEVER MARRIEDMARRIED MARRIEDDIVORCED/SEPARATED DIVORCED/SEPARATEDWIDOWED WIDOWED
48.1 37.822.8 52.3
1.9 1.227.2 8.7
Persons with disabilities (%)
NEVER MARRIED NEVER MARRIEDMARRIED MARRIEDDIVORCED/SEPARATED DIVORCED/SEPARATEDWIDOWED WIDOWED
37.4 46.758.5 52.0
0.7 0.33.4 0.9
NEVER MARRIED NEVER MARRIEDMARRIED MARRIEDDIVORCED/SEPARATED DIVORCED/SEPARATEDWIDOWED WIDOWED
41.6 52.244.5 42.2
1.2 0.712.7 4.9
Total Total
Male Male
GOVERNORATE CAPITAL41.8
GOVERNORATE CAPITAL27.3
GOVERNORATE CAPITAL43.8
GOVERNORATE CAPITAL41.4
GOVERNORATE CAPITAL41.7
GOVERNORATE CAPITAL41.5
All data categories are as provided by Iraq.
Central Organization for Statistics and Information Technology (2007).
SOURCE
IRA
Q

47
CONVENTION
Signed SignedRatified/acceded
OPTIONAL PROTOCOL
National institutional framework for disability/persons with disabilities
National definition of disability/persons with disabilities
National legislative framework for disability/persons with disabilities (year of adoption)
ADDITIONAL MECHANISMS
Ratified/acceded
NATIONAL COORDINATION MECHANISM
Signature/ratification of the Convention on the Rights of Persons with Disabilities & its optional protocol
SOURCE: ESCWA, based on data collected from government focal points through the ESCWA Questionnaire on the Implementation of the Convention on the Rights of Persons with Disabilities and the Arab Decade for Persons with Disabilities (2013).
SOURCE: UN (2014).
No No20.3.2013
Disability: any restriction or inability to interact with the environment within the limits of what is considered normal due to an impairment or deficiency. Persons with disabilities: every person who has lost their ability, totally or partially, to participate in community life on the same basis as others, as a result of a physical or mental or sensory impairment that has led to an inability to perform certain functions. (Law No. 38 on the Welfare of Persons with Disabilities and Special Needs, 2013)
No
System of focal points for disability related matters in line ministries or other governmental institutions
Articles on disability included in the constitution?
Yes
General/overarching national disability law
Law No. 38 on the Welfare of Persons with Disabilities and Special Needs (2013)
National disability strategy/plan
No
Name-
Year established-
Chair-
Persons with disabilities represented?-
IRA
Q

48
SOCIO-ECONOMIC INDICATORS HDI Life expectancy at birth GNI per capita
0.699 73.3 5,235
Age-specific disability prevalence (%)
Age distribution of persons with disabilities (%)
SOURCE: UNDP
JORDAN 2010
Disability prevalence (%)Female Male Total
1.6 2.2 1.9
Persons with disabilities1 Total population1
Male .. (51.2%)
Female .. (48.8%)
..
Male.. (59.1%)
Female .. (41.0%)
..
Type of disability/difficulty (%)TotalMaleFemale
Cause of disability/difficulty (%)
MaleTotal
Female
Male
Total
Female0-14 15-24 25-44 45-64 65+
..
..
..
..
..
..
..
..
..
..
..
..
..
..
..
0-14
1.2
.. ..
15-24
1.6
.. ..
25-39
1.6
.. ..
40-54
2.4
.. ..
..
..
..
..
Female
..
..
..
..
Male
..
..
..
..
Total
..
..
..
..
55-64
3.0
.. ..
65+
9.6
.. ..
MENTAL
LOCOMOTOR
AUTISM
CEREBRAL PALSY
HEARING
LEARNING DIFFICULTIES
HEARING LOSS
SPEECH & LANGUAGE
DEAF & BLIND
PSYCHOLOGICAL DISORDERS
VISUAL
BRAIN INJURIES
LOSS OF VISION
PHYSICAL & HEALTH
MULTIPLE DISABILITIES
6.1
9.2
7.9
18.2
16.6
17.3
5.95.75.8
3.82.9
1.52.1
5.8
5.3
5.5
3.5
3.3
3.4
3.63.0
4.85.4
5.2
3.3 4.9 4.3
16.2
16.5
15.9
15.5
8.1
11.2 8.2
8.6
7.6
6.6
5.2
2.93.2
4.64.3
0.90.0
0.5
ON THE SELECTION OF DATASET AND YEAR, PLEASE SEE PAGE 23

49
BY EDUCATIONAL ATTAINMENT
MaleTotal
FemaleILLITERATE/READ ONLY/READ & WRITE40.0 | 32.0 | 35.3
BELOW SECONDARY43.5 | 47.3 | 45.7
SECONDARY8.5 | 10.7 | 9.8
INTERMEDIATE DIPLOMA3.8 | 3.9 | 3.9
BACHELOR & ABOVE4.2 | 6.1 | 5.3
ILLITERATE/READ ONLY/READ & WRITE .. | .. | 11.0 BELOW SECONDARY
.. | .. | 49.3
SECONDARY .. | .. | 17.8
INTERMEDIATE DIPLOMA .. | .. | 8.1
BACHELOR & ABOVE .. | .. | 13.8
BY ECONOMIC ACTIVITY
Female Female
Persons with disabilities (%)Age: 15+ years
Total population (%)Age: 15+ years
EMPLOYED UNEMPLOYED36.6 4.4
NOT ECONOMICALLY ACTIVE59.0
Total Total
Male Male
..
..EMPLOYED UNEMPLOYED4.8 0.9
STUDENT HOMEMAKER5.3 66.0
HAS INCOME0.5
OTHER0.0
DISABLED22.6
EMPLOYED
EMPLOYED
UNEMPLOYED
UNEMPLOYED
23.8
16.1
2.2
1.7
STUDENT
STUDENT
HOMEMAKER
HOMEMAKER
7.3
6.5
0.2
26.7
OTHER
OTHER
3.5
2.1
DISABLED50.7
DISABLED39.4
HAS INCOME
HAS INCOME
12.3
7.5
Total population (%)Age: 10+ years
Persons with disabilities (%)Age: 10+ years
MaleTotal
Female
JOR
DAN

50
BY GEOGRAPHIC LOCATION
Total
BY MARITAL STATUS
Persons with disabilities (%)2
Age: 15+ yearsTotal population (%)2
Age: 15+ years
Total population (%)
Female
Female
Male
Male Total
RURAL14.2
RURAL17.4
URBAN84.0
URBAN82.6
URBAN85.8
RURAL16.1
URBAN82.8
RURAL17.2
Female FemaleNEVER MARRIEDHAS BEEN MARRIED
HAS BEEN MARRIED
40.559.5
Persons with disabilities (%)
NEVER MARRIED 41.358.7
NEVER MARRIEDHAS BEEN MARRIED
41.059.0
TotalNEVER MARRIEDHAS BEEN MARRIED
40.359.7
Total
Male Male
..
..
..
..
..
..
..
..
All data categories are as provided by Jordan.
Department of Statistics of Jordan (2010).
SOURCE Data on the total number of persons with disabilities and total number of population is not available in the source. Data on the sample size is available from the indicated source.
The category “has been married” includes those who are divorced, separated, married and widowed.
1 2
FOOTNOTES
JOR
DAN

51
CONVENTION
Signed SignedRatified/acceded
OPTIONAL PROTOCOL
National institutional framework for disability/persons with disabilities
National definition of disability/persons with disabilities
National legislative framework for disability/persons with disabilities (year of adoption)
ADDITIONAL MECHANISMS
Ratified/acceded
NATIONAL COORDINATION MECHANISM
Signature/ratification of the Convention on the Rights of Persons with Disabilities & its optional protocol
SOURCE: ESCWA, based on data collected from government focal points through the ESCWA Questionnaire on the Implementation of the Convention on the Rights of Persons with Disabilities and the Arab Decade for Persons with Disabilities (2013).
SOURCE: UN (2014).
30.3.2007 30.3.2007 31.3.2008
The disabled signifies every person suffering from a permanent partial or total impairment affecting any of their senses, or their physical, psychological or mental capabilities, to an extent that it undermines their ability to learn, work, or be rehabilitated, and in a way that renders them unable to meet their normal day-to-day requirements under conditions similar to those of non-disabled persons. (Law No. 31 on the Rights of Persons with Disabilities, 2007)
FOOTNOTE:1 The law is currently being amended.
No
NameHigher Council for the Affairs of Persons with Disabilities
Year established2007
ChairPrince Raad Bin Zaid Al Moazzam
Persons with disabilities represented?Yes
System of focal points for disability related matters in line ministries or other governmental institutions
National Centre for Human Rights
Jordanian Coalition for Persons with Disabilities
Articles on disability included in the constitution?
Yes
General/overarching national disability law
Law No. 31 on the Rights of Persons with Disabilities (2007)1
National disability strategy/plan
National Strategy for Persons with Disabilities (2007)
JOR
DAN

52
SOCIO-ECONOMIC INDICATORS HDI Life expectancy at birth GNI per capita
0.788 74.6 51,026
Age-specific disability prevalence (%)
Age distribution of persons with disabilities (%)
SOURCE: UNDP
KUWAIT 20111
Disability prevalence (%)Female Male Total
1.0 1.2 1.1
Persons with disabilities Total population
Male 1,738,372 (56.7%)
Female 1,327,478 (43.3%)
Male20,090 (59.1%)
Female 13,876 (40.9%)
Type of disability/difficulty (%)2
TotalMaleFemale
Male
Total
Female
3,065,85033,966
0-14
0.9
1.2
1.0
15-24
0.9
1.3
1.1
25-44
0.6
0.7
0.7
45-64
1.6
1.6
1.6
65+
9.6
8.0 8.8
MaleTotal
Female
Cause of disability/difficulty (%)
During birthDiseaseHereditaryWork-related accidentRoad traffic accidentsOther accidents
Female
39.539.86.35.71.77.1
Male
39.433.16.67.84.58.6
Total
39.535.96.56.93.37.9
25-44
24.1
30.9
28.1
15-24
14.6
14.8
14.7
45-64
20.5
21.7
21.2
65+
18.9
11.6
14.6
0-14
21.8
20.9
21.3
VISION DIFFICULTY
SPEECH DIFFICULTY
DIFFICULTY IN MOVEMENT
DIFFICULTY IN BODY MOVEMENT
DIFFICULTY IN GRASPING & MOVING OBJECTS
DIFFICULTY IN LEARNING ABILITY
DIFFICULTY IN THE ABILITY TO CONTROL ONE’S BEHAVIOUR
DIFFICULTY IN SELF-CARE
OTHER DIFFICULTIES
HEARING DIFFICULTIES
21.8
24.8
23.6
6.36.6
6.4
4.45.65.1
19.9
17.4
18.5
10.2
7.9
8.83.5
10.7
11.8
11.4
2.12.31.9
3.5
17.1
16.8
17.5
3.23.8
3.6
3.6
ON THE SELECTION OF DATASET AND YEAR, PLEASE SEE PAGE 23

53
BY EDUCATIONAL ATTAINMENT
BY ECONOMIC ACTIVITY
Female Female
Persons with disabilities (%)Age: 15+ years
Total population (%)3
Age: 15+ years
Total Total
Male Male
EMPLOYED EMPLOYED
EMPLOYED EMPLOYED
EMPLOYED EMPLOYED
UNEMPLOYED UNEMPLOYED
UNEMPLOYED UNEMPLOYED
UNEMPLOYED UNEMPLOYED
UNABLE TO WORK UNABLE TO WORK
UNABLE TO WORK UNABLE TO WORK
UNABLE TO WORK UNABLE TO WORK
21.6 58.1
45.4 84.0
35.8 73.2
4.2 3.0
5.7 2.5
5.1 2.7
12.0 0.2
12.2 0.2
12.2 0.2
STUDENT STUDENT
STUDENT STUDENT
STUDENT STUDENT
HOMEMAKER HOMEMAKER
HOMEMAKER HOMEMAKER
HOMEMAKER HOMEMAKER
10.3 11.9
10.0 8.6
10.1 10.0
26.9 21.8
0.0 0.0
10.9 9.1
HAS INCOME
HAS INCOME HAS INCOME
8.1
14.2 3.3
OTHERS OTHERS
OTHERS OTHERS
OTHERS OTHERS
16.7 1.3
12.5 1.3
14.2 1.3
HAS INCOME11.7
HAS INCOME3.5
HAS INCOME3.6
ILLITERATE10.1 | 7.3 | 8.5 READ & WRITE
19.6 | 17.9 | 18.6
PRIMARY CERTIFICATE19.9 | 18.6 | 19.1
INTERMEDIATE CERTIFICATE12.9 | 18.0 | 15.8
POST-SECONDARY/PRE-UNIVERSITY CERTIFICATE7.2 | 6.2 | 6.6
UNIVERSITY DEGREE14.9 | 13.6 | 14.2
POST-GRADUATE (HIGHER DIPLOMA/MASTER)1.4 | 2.0 | 1.7
SECONDARY CERTIFICATE/EQUIVALENT14.1 | 16.4 | 15.4
ILLITERATE28.5 | 15.0 | 20.5
READ & WRITE14.7 | 13.2 | 13.8
PRIMARY CERTIFICATE13.5 | 13.7 | 13.6
INTERMEDIATE CERTIFICATE15.7 | 22.5 | 19.7
SECONDARY CERTIFICATE/EQUIVALENT11.4 | 15.5 | 13.9
POST-SECONDARY/PRE-UNIVERSITY CERTIFICATE5.9 | 6.6 | 6.3
UNIVERSITY DEGREE9.1 | 11.5 | 10.6
POST-GRADUATE (HIGHER DIPLOMA/MASTER)1.1 | 2.0 | 1.7
MaleTotal
Female
Total population (%)Age: 10+ years
Persons with disabilities (%)Age: 10+ years
MaleTotal
Female
KU
WA
IT

54
BY GEOGRAPHIC LOCATION
Total
BY MARITAL STATUS
Persons with disabilities (%)Age: 15+ years
Total population (%)Age: 15+ years
Total population (%)
Female
Female
Male
Male Total
RURAL0.0
RURAL0.0
URBAN100.0
URBAN100.0
URBAN100.0
RURAL0.0
URBAN100.0
URBAN100.0
URBAN100.0
RURAL0.0
RURAL0.0
RURAL0.0
Female Female
Persons with disabilities (%)
All data categories are as provided by Kuwait.
Central Statistics Bureau (2011).
SOURCE All data pertains to total population (both national and non-national).In this graph, “movement” refers to
“walking, standing”; “body movement” refers to “bending, kneeling”; “learning ability” refers to “mental difficulties,
mental retardation”; “behaviour” refers to “psychological, emotional” and “self-care” refers to “bathing, dressing, eating”.The category “others” includes persons aged 65 years and above and not employed.
1
32
FOOTNOTES
NEVER MARRIED NEVER MARRIEDMARRIED MARRIEDDIVORCED DIVORCEDWIDOWED WIDOWED
NEVER MARRIEDMARRIEDDIVORCEDWIDOWED
NEVER MARRIEDMARRIEDDIVORCEDWIDOWED
NEVER MARRIEDMARRIEDDIVORCEDWIDOWED
NEVER MARRIEDMARRIEDDIVORCEDWIDOWED
33.0 33.639.7 59.7
5.4 2.921.9 3.8
Male Male33.6 32.5
61.5 66.32.4 0.82.5 0.4
Total Total33.4 33.0
52.7 63.53.6 1.7
10.4 1.8
KU
WA
IT

55
CONVENTION
Signed SignedRatified/acceded
OPTIONAL PROTOCOL
National institutional framework for disability/persons with disabilities
National definition of disability/persons with disabilities
National legislative framework for disability/persons with disabilities (year of adoption)
ADDITIONAL MECHANISMS
Ratified/acceded
NATIONAL COORDINATION MECHANISM
Signature/ratification of the Convention on the Rights of Persons with Disabilities & its optional protocol
SOURCE: ESCWA, based on data collected from government focal points through the ESCWA Questionnaire on the Implementation of the Convention on the Rights of Persons with Disabilities and the Arab Decade for Persons with Disabilities (2013).
SOURCE: UN (2014).
No No22.8.2013
Everyone who suffers from permanent total or partial disorders leading to deficiencies in their physical, mental, or sensory abilities, which prevent them from securing the necessities of life or participating fully and effectively in society on an equal basis with others. (Law No. 8 on the Rights of Disabled Persons, 2010)
No
NameManagement of the Welfare of the Disabled / General Authority for Persons with Disabilities
Year established2010
Chair..
Persons with disabilities represented?No
System of focal points for disability related matters in line ministries or other governmental institutions
Articles on disability included in the constitution?
Yes
General/overarching national disability law
Law No. 8 on the Rights of Disabled Persons (2010)
National disability strategy/plan
..
KU
WA
IT

56
SOCIO-ECONOMIC INDICATORS1 HDI Life expectancy at birth GNI per capita
0.714 71.5 9,510
Age-specific disability prevalence (%)
Age distribution of persons with disabilities (%)
SOURCE: UNDP
LEBANON 2004
Disability prevalence (%)Female Male Total
.. .. 2.0
Persons with disabilities Total population
Male 1,868,322 (49.8%)
Female 1,886,712 (50.2%)
Male47,293 (64.0%)
Female 26,603 (36.0%)
Type of disability/difficulty (%)2
TotalMaleFemale
Male
Total
Female
3,755,03473,896
0-14
1.1
15-24
1.3
25-64
2.0
65+
5.6
MaleTotal
Female
.. .. .. .. .. .. .. ..
Cause of disability/difficulty (%)
CongenitalBirth-related conditionsEpidemic diseaseOther types of diseasePsychological/physical abuseOld ageInjury/accidentWarOtherNot specified
Female
..
..
..
..
..
..
..
..
..
..
Male
..
..
..
..
..
..
..
..
..
..
Total
30.75.14.3
12.70.9
16.517.77.92.71.6
LOCOMOTOR DISABILITY
SPEECH/HEARING DISABILITY
VISUAL DISABILITY
MENTAL DISABILITY
17.5
59.9
22.416.4
22.3
25-64
46.3
15-24
13.0
65+
27.3
0-14
13.4
..
..
..
..
..
..
..
..
ON THE SELECTION OF DATASET AND YEAR, PLEASE SEE PAGE 23
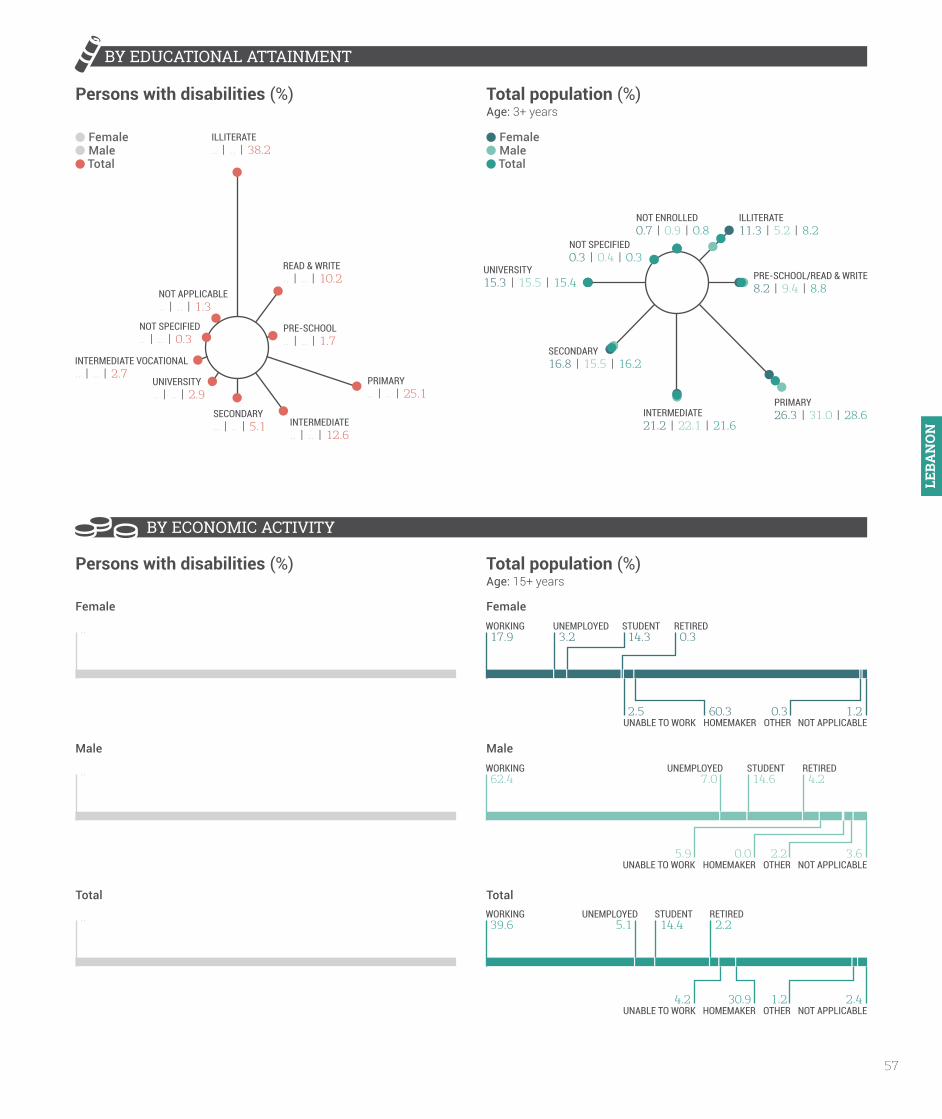
57
BY EDUCATIONAL ATTAINMENT
Total population (%)Age: 3+ years
Persons with disabilities (%)
MaleTotal
FemaleMaleTotal
Female
BY ECONOMIC ACTIVITY
Female Female
Persons with disabilities (%) Total population (%)Age: 15+ years
Total Total
Male Male
WORKING
WORKING
WORKING
UNEMPLOYED
UNEMPLOYED
UNEMPLOYED
17.9
62.4
39.6
3.2
7.0
5.1
UNABLE TO WORK
UNABLE TO WORK
UNABLE TO WORK
HOMEMAKER
HOMEMAKER
HOMEMAKER
OTHER
OTHER
OTHER
2.5
5.9
4.2
60.3
0.0
30.9
0.3
2.2
1.2
NOT APPLICABLE
NOT APPLICABLE
NOT APPLICABLE
1.2
3.6
2.4
STUDENT
STUDENT
STUDENT
14.3
14.6
14.4
RETIRED
RETIRED
0.3
4.2
RETIRED2.2
NOT ENROLLED0.7 | 0.9 | 0.8
ILLITERATE11.3 | 5.2 | 8.2
PRE-SCHOOL/READ & WRITE8.2 | 9.4 | 8.8
PRIMARY26.3 | 31.0 | 28.6INTERMEDIATE
21.2 | 22.1 | 21.6
SECONDARY16.8 | 15.5 | 16.2
UNIVERSITY15.3 | 15.5 | 15.4
NOT SPECIFIED0.3 | 0.4 | 0.3
ILLITERATE.. | .. | 38.2
READ & WRITE.. | .. | 10.2
PRE-SCHOOL.. | .. | 1.7
PRIMARY.. | .. | 25.1
INTERMEDIATE.. | .. | 12.6
SECONDARY.. | .. | 5.1
UNIVERSITY.. | .. | 2.9
NOT SPECIFIED.. | .. | 0.3
NOT APPLICABLE.. | .. | 1.3
INTERMEDIATE VOCATIONAL.. | .. | 2.7
..
..
..LE
BAN
ON

58
BY GEOGRAPHIC LOCATION
BY MARITAL STATUS
Persons with disabilities (%)Age: 15+ years
Total population (%)Age: 15+ years
Female Female
Persons with disabilities (%)
All data categories are as provided by Lebanon.
Central Administration of Statistics et al. (2004).
SOURCE Data for these three indicators is from 2005.Persons may report more than one type of disability. For this indicator, persons are counted in each of the relevant categories. For example, persons who report two types of disability are
counted twice. Therefore, the sum of the percentages exceeds 100. The percentages have been calculated as follows: Number of persons with disabilities counted in each category/total number of persons with disabilities.
1
2
FOOTNOTES
NEVER MARRIEDMARRIEDDIVORCED/SEPARATEDWIDOWED
NEVER MARRIEDMARRIEDDIVORCED/SEPARATEDWIDOWED
NEVER MARRIEDMARRIEDDIVORCED/SEPARATEDWIDOWED
NEVER MARRIEDMARRIEDDIVORCED/SEPARATEDWIDOWED
36.952.5
1.39.3
MaleMale44.1
53.80.51.5
Total Total50.6 40.4
37.7 53.11.6 0.9
10.1 5.5
Total population (%)
TotalFemale
Female
Male
Male Total
.. ..
.. ..
..
..
.. ..
.. ..
..
..
..
..
..
..
..
..
..
..
LEBA
NO
N

59
CONVENTION
Signed SignedRatified/acceded
OPTIONAL PROTOCOL
National institutional framework for disability/persons with disabilities
National definition of disability/persons with disabilities
National legislative framework for disability/persons with disabilities (year of adoption)
ADDITIONAL MECHANISMS
Ratified/acceded
NATIONAL COORDINATION MECHANISM
Signature/ratification of the Convention on the Rights of Persons with Disabilities & its optional protocol
SOURCE: ESCWA, based on data collected from government focal points through the ESCWA Questionnaire on the Implementation of the Convention on the Rights of Persons with Disabilities and the Arab Decade for Persons with Disabilities (2013).
SOURCE: UN (2014).
14.6.2007 14.6.2007No
A disabled person is a person who has a decreased ability or has become unable to perform one or more important daily activities, or to attend to their personal needs on their own, or to participate in social activities on an equal basis with others, or to lead a normal personal and social life according to the current standards of the society, due to a loss or functional impairment, be it physical, sensory or mental, total or partial, permanent or temporary, resulting from a congenital disorder, an acquired condition, or a medical condition that lasted beyond normal medical expectations.(Law No. 220 on the Rights of Disabled Persons, 2000)
No
NameNational Committee for the Affairs of the Disabled
Year established1993
ChairMinister of Social Affairs
Persons with disabilities represented?Yes
..
Articles on disability included in the constitution?
No
General/overarching national disability law
Law No. 220 on the Rights of Disabled Persons (2000)
National disability strategy/plan
CBD
LEBA
NO
N

60
SOCIO-ECONOMIC INDICATORS HDI Life expectancy at birth GNI per capita
0.760 73.9 15,552
Age-specific disability prevalence (%)
Age distribution of persons with disabilities (%)
SOURCE: UNDP
LIBYA 20071
Disability prevalence (%)Female Male Total
2.9
Total population2
Male .. (50.3%)
Female .. (49.7%)
Type of disability/difficulty (%)3
TotalMaleFemale
Male
Total
Female
..
Cause of disability/difficulty (%)
CongenitalBirth-related conditionsEpidemic diseaseOther diseasePhysical/psychological abuseOld ageInjury/accidentEvil eye/magicOtherNot known
Female
23.113.02.6
19.90.8
13.915.41.35.44.6
Male
23.610.13.1
14.41.76.8
29.51.25.14.3
Total
23.411.42.9
16.71.39.8
23.51.35.24.4
Persons with disabilities
Male..
Female ..
..
0-14 15-24 25-44 45-64 65+
MaleTotal
Female
.. .. .. .. .. .. .. .. .. .. .. .. .. .. ..
2.5 3.3
25-44
23.5
32.5
28.7
15-24
15.8
19.6
18.0
45-64
17.5
12.6
14.7
65+
23.7
17.8
20.3
0-14
19.4
17.5
18.3
SIGHT
HEARING
UNDERSTANDING & COMMUNICATINGMOVEMENT
SELF CARE
SOCIALIZING WITH PEOPLE
14.7
14.117.916.3
22.5
31.4
13.9 15.4 14.8
48.4
48.3
26.3
28.5
24.7
19.7
9.7
11.8
48.2
ON THE SELECTION OF DATASET AND YEAR, PLEASE SEE PAGE 23

61
BY EDUCATIONAL ATTAINMENT
Total population (%)Age: 10+ years
Persons with disabilities (%)Age: 10+ years
MaleTotal
Female
BY ECONOMIC ACTIVITY
Female Female
Persons with disabilities (%) Total population (%)
Total
Male
ILLITERATE17.5 | 7.0 | 12.2
READ/WRITE21.8 | 23.3 | 22.6
BASIC22.7 | 27.6 | 25.2
SECONDARY OR EQUIVALENT25.1 | 28.7 | 26.9
UNIVERSITY & ABOVE12.8 | 13.3 | 13.1
NOT KNOWN/NOT SPECIFIED0.1 | 0.1 | 0.0
.. ..
.. ..
.. ..
MaleTotal
Female ILLITERATE54.8 | 28.8 | 39.7
READ/WRITE17.2 | 26.7 | 22.7
BASIC11.8 | 21.8 | 17.6
UNIVERSITY & ABOVE3.9 | 5.3 | 4.7
NOT KNOWN/NOT SPECIFIED0.6 | 0.5 | 0.5
SECONDARY OR EQUIVALENT11.6 | 16.9 | 14.7
LIBY
A

62
BY GEOGRAPHIC LOCATION
BY MARITAL STATUS
Persons with disabilities (%)Age: 15+ years
Total population (%)Age: 15+ years
Female Female
Persons with disabilities (%)
All data categories are as provided by Libya.
Pan Arab Project for Family Health and the National Centre for Infectious and Chronic Disease Control (2007).
SOURCE FOOTNOTES
SINGLE SINGLEMARRIED MARRIEDDIVORCED DIVORCEDWIDOWED WIDOWED
51.740.1
1.36.7
Male59.6
39.40.20.7
Total Total48.8 55.5
38.6 39.81.4 0.8
11.3 3.7
Total population (%)
TotalFemale
Female
Male
Male Total
.. ..
.. ..
..
..
.. ..
.. ..
..
..
SINGLE SINGLEMARRIED MARRIEDDIVORCED DIVORCEDWIDOWED WIDOWED
SINGLE SINGLEMARRIED MARRIEDDIVORCED DIVORCEDWIDOWED WIDOWED
44.929.3
1.923.9
Male51.6
45.31.02.1
All data pertains to nationals only.Data on the total population is not available in the source. Data on the sample size is available from the indicated source.Persons may report more than one type of disability. For this indicator, persons are counted in each of the relevant categories,
e.g. persons who report two types of disability are counted twice. The sum of the percentages therefore exceeds 100. The percentages are calculated as follows: Number of persons with disabilities counted in each category/total number of persons with disabilities.
1
2
3
LIBY
A

63
CONVENTION
Signed SignedRatified/acceded
OPTIONAL PROTOCOL
National institutional framework for disability/persons with disabilities
National definition of disability/persons with disabilities
National legislative framework for disability/persons with disabilities (year of adoption)
ADDITIONAL MECHANISMS
Ratified/acceded
NATIONAL COORDINATION MECHANISM
Signature/ratification of the Convention on the Rights of Persons with Disabilities & its optional protocol
SOURCE: ..
SOURCE: UN (2014).
1.5.2008 NoNo
..
No
Name..
Year established..
Chair..
Persons with disabilities represented?..
..
Articles on disability included in the constitution?
..
General/overarching national disability law
..
National disability strategy/plan
..
LIBY
A

64
Cause of disability/difficulty (%)
SOCIO-ECONOMIC INDICATORS1 HDI Life expectancy at birth GNI per capita
0.467 58.9 2,174
Type of disability/difficulty (%)
Disability prevalence (%)
Age-specific disability prevalence (%)
Age distribution of persons with disabilities (%)
Persons with disabilities Total population
Male ..
Female ..
Male..
Female ..
..
MAURITANIA
Female Male Total
SOURCE: UNDP
..
Cause of disability/difficulty (%)
..
..
..
..
Female
..
..
..
..
Male
..
..
..
..
Total
..
..
..
..
Age distribution of persons with disabilities (%)
Male
Total
Female0-14 15-24 25-44 45-64 65+
..
..
..
..
..
..
..
..
..
..
..
..
..
..
..
0-14 15-24 25-44 45-64 65+
MaleTotal
Female
.. .. .. .. .. .. .. .. .. .. .. .. .. .. ..TotalMaleFemale
..
....
..
....
..
....
..
..
..
.... .. ..
..
..
.. .. ..

65
BY EDUCATIONAL ATTAINMENT
Total population (%)Persons with disabilities (%)
BY ECONOMIC ACTIVITY
Total Total
Persons with disabilities (%) Total population (%)
Female Female
Male Male
.. ..
.. ..
MaleTotal
FemaleMaleTotal
Female .. | .. | ..
.. | .. | ..
.. | .. | ..
.. | .. | ..
.. | .. | ..
.. | .. | ..
.. | .. | ..
.. | .. | ..
.. | .. | ..
.. | .. | ..
.. | .. | ..
.. | .. | ..
.. ..M
AU
RIT
AN
IA

66
BY GEOGRAPHIC LOCATION
Persons with disabilities (%)Total
BY MARITAL STATUS
Persons with disabilities (%)
Female
Total
Female
Male Male
Total
Total population (%)
Data for these three indicators is from 2012.1
FOOTNOTE
Total population (%)
Female
Female
Male
Male Total
.. ..
.. ..
..
..
.. ..
.. ..
..
..
..
..
..
..
..
..
..
..
..
..
..
..
..
..
..
..
..
..
..
..
..
..
..
..
MA
UR
ITA
NIA

67
CONVENTION
Signed SignedRatified/acceded
OPTIONAL PROTOCOL
National institutional framework for disability/persons with disabilities
National definition of disability/persons with disabilities
National legislative framework for disability/persons with disabilities (year of adoption)
ADDITIONAL MECHANISMS
Ratified/acceded
NATIONAL COORDINATION MECHANISM
Signature/ratification of the Convention on the Rights of Persons with Disabilities & its optional protocol
SOURCE: ..
SOURCE: UN (2014).
No No3.4.2012
..
3.4.2012
Name..
Year established..
Chair..
Persons with disabilities represented?..
..
Articles on disability included in the constitution?
..
General/overarching national disability law
..
National disability strategy/plan
..
MA
UR
ITA
NIA

68
SOCIO-ECONOMIC INDICATORS1 HDI Life expectancy at birth GNI per capita
0.558 70.4 3,460
Age-specific disability prevalence (%)
Age distribution of persons with disabilities (%)
SOURCE: UNDP
MOROCCO 2004
Female Male
Total population
Type of disability/difficulty (%)TotalMaleFemale
Male
Total
Female
Cause of disability/difficulty (%)
Persons with disabilities
0-14 15-24 25-44 45-64 65+
2.0 2.6
LOCOMOTOR
CHRONICSENSORY
MENTAL
27.5
28.724.9
18.8
Male 14,640,662 (49.3%)
Female 15,039,407 (50.7%)
Male383,038 (56.3%)
Female 297,500 (43.7%)
29,680,069680,5382.3
0.7
0.9
0.8
1.0
1.6
1.3
1.5 2.
6
2.0 3.
4 4.3
3.8
11.1
11.6
11.4
MaleTotal
Female
..
..
..
..
Female
..
..
..
..
Male
..
..
..
..
Total
..
..
..
..
0-14
10.8
11.4
11.1
15-24
10.7
12.8
11.9
25-44
22.0
27.9
25.4
45-64
24.3
23.7
23.9
65+
32.0
24.1
27.5
Disability prevalence (%)2
Total
ON THE SELECTION OF DATASET AND YEAR, PLEASE SEE PAGE 23

69
BY EDUCATIONAL ATTAINMENT
Total population (%)Age: 10+ years
Persons with disabilities (%)Age: 10+ years
MaleTotal
Female
BY ECONOMIC ACTIVITY
Female Female
Persons with disabilities (%)3
Age: 15+ yearsTotal population (%)Age: 15+ years
Total Total
Male Male
MaleTotal
Female
PRE-SCHOOL.. | .. | 14.6
BASIC 1 & 2.. | .. | 68.5
SECONDARY.. | .. | 11.6
UNIVERSITY & ABOVE.. | .. | 5.3
PRE-SCHOOL.. | .. | 4.7
PRIMARY.. | .. | 46.9
PREPARATORY.. | .. | 24.5
SECONDARY.. | .. | 15.2
UNIVERSITY & ABOVE.. | .. | 8.7
WORKING
WORKING
WORKING
UNEMPLOYED
UNEMPLOYED
UNEMPLOYED
HOMEMAKER
HOMEMAKER
HOMEMAKER
5.0
19.3
13.1
2.0
5.0
3.7
19.5
0.0
8.5
RETIRED
RETIRED
RETIRED
TOO YOUNG TO WORK
TOO YOUNG TO WORK
TOO YOUNG TO WORK
WAGE EARNER
WAGE EARNER
WAGE EARNER
0.7
5.6
3.5
3.7
3.6
3.7
0.2
0.5
0.3
STUDENT
STUDENT
STUDENT
3.5
4.6
4.1
OTHERS
OTHERS
OTHERS
15.7
8.6
11.6
ECONOMICALLY ACTIVE17.6
NOT ECONOMICALLY ACTIVE82.4
ECONOMICALLY ACTIVE54.7
NOT ECONOMICALLY ACTIVE45.3
ECONOMICALLY ACTIVE35.9
NOT ECONOMICALLY ACTIVE64.1
UNABLE TO WORK
UNABLE TO WORK
UNABLE TO WORK
49.8
52.8
51.5
MO
RO
CCO

70
BY GEOGRAPHIC LOCATION
BY MARITAL STATUS
Persons with disabilities (%)Age: 15+ years
Total population (%)Age: 15+ years
Female Female
Persons with disabilities (%)
All data categories are as provided by Morocco.
Haut-Commissariat Au Plan (2004); Ministry of Solidarity, Women, Family and Social Development (2006).
SOURCES FOOTNOTES
NEVER MARRIEDMARRIEDDIVORCED/SEPARATEDWIDOWED
NEVER MARRIEDMARRIEDDIVORCED/SEPARATEDWIDOWED
NEVER MARRIEDMARRIEDDIVORCED/SEPARATEDWIDOWED
42.845.8
8.72.7
Male53.5
45.10.70.6
Total Total36.6 48.0
42.7 45.517.5 4.8
3.2 1.7
Total population (%)
TotalFemale
Female
Male
Male Total
32.227.8
35.34.7
Male40.0
54.13.8
2.0
Data for these three indicators is from 2005.The prevalence rate for persons with disabilities is 5.1 per cent according to the National Survey on Disability (Ministry of Solidarity, Women, Family and Social Development (2006)).
Employed persons are aged 7 years and above.
1
2
3
RURAL40.7
RURAL44.9
URBAN56.9
URBAN55.1
URBAN59.3
RURAL43.1
URBAN55.1
URBAN54.8
URBAN55.3
RURAL44.9
RURAL45.2
RURAL44.7
NEVER MARRIEDMARRIEDDIVORCED/SEPARATEDWIDOWED
NEVER MARRIEDMARRIEDDIVORCED/SEPARATEDWIDOWED
NEVER MARRIEDMARRIEDDIVORCED/SEPARATEDWIDOWED
MO
RO
CCO

71
CONVENTION
Signed SignedRatified/acceded
OPTIONAL PROTOCOL
National institutional framework for disability/persons with disabilities
National legislative framework for disability/persons with disabilities (year of adoption)
ADDITIONAL MECHANISMS
Ratified/acceded
NATIONAL COORDINATION MECHANISM
Signature/ratification of the Convention on the Rights of Persons with Disabilities & its optional protocol
SOURCE: ESCWA, based on data collected from government focal points through the ESCWA Questionnaire on the Implementation of the Convention on the Rights of Persons with Disabilities and the Arab Decade for Persons with Disabilities (2013).
SOURCE: UN (2014).
30.3.2007 No8.4.2009
National definition of disability/persons with disabilitiesAccording to this law, the disabled signifies every person who is in a state of disability or permanent
or temporary hindrance, resulting from a lack or inability that prevents them from performing life functions irrespective of whether the person was born with a disability or became disabled later in life. (Social Welfare Act for Disabled People, 1993)1
FOOTNOTES:1 A new law on the promotion of the rights of persons with disabilities which includes a
new definition of persons with disabilities is pending ratification.
2 Morocco also has an overarching law for persons with visual impairments (Social Welfare Act for Blind and People with Difficulty in Seeing (1982)).
3 A new national disability strategy is currently being developed.
8.4.2009
NameDirectorate of the Advancement of the Rights of Persons with Disability Status, Ministry of Solidarity, Women, Family and Social Development
Year established1994
ChairMinister of Solidarity and Women, Family and Social Development
Persons with disabilities represented?Yes
CBD
Articles on disability included in the constitution?
Yes
General/overarching national disability law
Social Welfare Act for Disabled People (1993)2
National disability strategy/plan
National Strategy for the Prevention of Disability (2008)3
MO
RO
CCO

72
SOCIO-ECONOMIC INDICATORS HDI Life expectancy at birth GNI per capita
0.728 72.8 23,219
Age-specific disability prevalence (%)
Age distribution of persons with disabilities (%)
SOURCE: UNDP
OMAN 20101
Disability prevalence (%)Female Male Total
Total population
Type of disability/difficulty (%)
Male
Total
Female
Cause of disability/difficulty (%)
Persons with disabilities
0-14 15-24 25-44 45-64 65+
3.0 3.4Male 990,590 (50.6%)
Female 966,746 (49.4%)
Male33,787 (54.1%)
Female 28,719 (45.9%)
1,957,33662,5063.2
1.0
1.2
1.1 1.8 2.1
2.0
1.9 2.
8
2.4
7.3 8.4
7.8
28.0
27.0
27.5
MaleTotal
Female
0-14
11.2
12.5
11.9
15-24
14.9
15.4
15.2
25-44
17.5
22.4
20.2
45-64
23.6
21.7
22.5
65+
32.7
28.1
30.2
CongenitalDiseaseRoad traffic accidentWork-related accidentOld ageOther causes
Female
29.428.52.10.7
35.34.0
Male
33.127.67.12.6
25.54.1
Total
31.428.04.81.7
30.04.1
TotalMaleFemale
SEEING, EVEN WITH GLASSES
HEARING, EVEN WITH HEARING AID
WALKING/CLIMBING UP STEPS
REMEMBERING OR CONCENTRATING
SELF-CARE
COMMUNICATING IN NORMAL LANGUAGE
MOVEMENT OF THE UPPER BODY
33.1
7.3
29.37.6
12.7
4.7 5.7 5.2
5.26.5
5.9
11.8
12.2
9.7
8.7
24.7
26.8
7.17.2
34.6
33.9
ON THE SELECTION OF DATASET AND YEAR, PLEASE SEE PAGE 23

73
BY EDUCATIONAL ATTAINMENT
Total population (%)Age: 15+ years
Persons with disabilities (%)Age: 15+ years
MaleTotal
Female
BY ECONOMIC ACTIVITY
Female Female
Persons with disabilities (%)Age: 15+ years
Total population (%)Age: 15+ years
Total Total
Male Male
MaleTotal
Female
WORKING WORKING
WORKING
WORKING
WORKING
WORKING
UNEMPLOYED UNEMPLOYED
UNEMPLOYED
UNEMPLOYED
UNEMPLOYED
UNEMPLOYED
HOMEMAKER HOMEMAKER
HOMEMAKER
HOMEMAKER
HOMEMAKER
HOMEMAKER
4.8 15.5
54.7
35.3
23.7
14.9
2.7 9.7
13.0
11.4
6.1
4.5
39.6 50.3
0.7
25.3
0.9
18.8
STUDENT STUDENT
STUDENT
STUDENT
STUDENT
STUDENT
5.6 19.6
20.3
20.0
5.3
5.4
SELF-SUFFICIENT SELF-SUFFICIENT
SELF-SUFFICIENT
SELF-SUFFICIENT
SELF-SUFFICIENT
SELF-SUFFICIENT
1.5 0.6
5.5
3.0
12.8
7.6
UNABLE TO WORK UNABLE TO WORK
UNABLE TO WORK
UNABLE TO WORK
UNABLE TO WORK
UNABLE TO WORK
45.8 4.3
5.8
5.0
51.1
48.7
ILLITERATE19.4 | 8.9 | 14.1
READ & WRITE7.0 | 7.2 | 7.1
PRIMARY10.5 | 12.4 | 11.4
PREPARATORY15.8 | 19.8 | 17.8
SECONDARY33.6 | 37.5 | 35.6
DIPLOMA5.8 | 5.9 | 5.8
UNIVERSITY7.5 | 7.0 | 7.3
MASTER0.4 | 1.0 | 0.7
DOCTORATE0.1 | 0.2 | 0.1
ILLITERATE68.5 | 46.0 | 56.4
READ & WRITE8.3 | 17.2 | 13.1
PRE-SECONDARY11.2 | 19.8 | 15.8
SECONDARY8.8 | 12.3 | 10.6
DIPLOMA1.6 | 2.2 | 1.9
UNIVERSITY1.6 | 2.1 | 1.8
MASTER0.1 | 0.4 | 0.2
DOCTORATE0.0 | 0.1 | 0.1
OM
AN

74
BY GEOGRAPHIC LOCATION
BY MARITAL STATUS
Persons with disabilities (%)Age: 15+ years
Total population (%)Age: 15+ years
Female Female
Persons with disabilities (%)
All data categories are as provided by Oman.
National Centre for Statistics and Information (2010).
SOURCE FOOTNOTE
NEVER MARRIEDMARRIEDDIVORCEDWIDOWED
NEVER MARRIEDMARRIEDDIVORCEDWIDOWED
NEVER MARRIEDMARRIEDDIVORCEDWIDOWED
39.550.7
2.77.0
Male49.249.0
1.10.7
Total Total29.4 44.4
47.8 49.84.5 1.9
18.3 3.9
Total population (%)
TotalFemale
Female
Male
Male Total
26.533.9
5.933.7
Male31.9
59.93.2
5.0
All data pertains to nationals only.1
RURAL30.9
RURAL31.4
URBAN68.8
URBAN68.6
URBAN69.1
RURAL31.2
URBAN70.7
URBAN70.8
URBAN70.6
RURAL29.3
RURAL29.2
RURAL29.4
NEVER MARRIEDMARRIEDDIVORCEDWIDOWED
NEVER MARRIEDMARRIEDDIVORCEDWIDOWED
NEVER MARRIEDMARRIEDDIVORCEDWIDOWED
OM
AN

75
SOURCE: ESCWA, based on data collected from government focal points through the ESCWA Questionnaire on the Implementation of the Convention on the Rights of Persons with Disabilities and the Arab Decade for Persons with Disabilities (2013).
SOURCES: UN (2014); Sultanate Decree No. 121 on Oman’s ratification of the International Convention on the Rights of Persons with Disabilities (2008).
17.3.2008 No5.11.2008
The person who suffers from a deficiency in some of their sensory, physical or mental capacities, be it congenital, or the result of a hereditary factor, disease or accident, which limits their ability to perform their natural role in life in comparison to those of the same age, and which results in the need for special care and rehabilitation in order to assume their role in life. (Sultanate Decree No. 63 on the Law on Care and Rehabilitation of the Disabled, 2008)
CONVENTION
Signed SignedRatified/acceded
OPTIONAL PROTOCOL
National institutional framework for disability/persons with disabilities
National definition of disability/persons with disabilities
National legislative framework for disability/persons with disabilities (year of adoption)
ADDITIONAL MECHANISMS
Ratified/acceded
NATIONAL COORDINATION MECHANISM
Signature/ratification of the Convention on the Rights of Persons with Disabilities & its optional protocol
No
NameNational Committee for the Welfare of the Disabled
Year established2008
ChairMinister of Social Development
Persons with disabilities represented?Yes
System of focal points for disability related matters in line ministries or other governmental institutions
National Committee for the Welfare of the Disabled
Articles on disability included in the constitution?
Yes
General/overarching national disability law
Sultanate Decree No. 63 on the Law on Care and Rehabilitation of the Disabled (2008)
National disability strategy/plan
CBD
OM
AN

76
SOCIO-ECONOMIC INDICATORS1 HDI Life expectancy at birth GNI per capita
0.662 72.1 2,630
Age-specific disability prevalence (%)
Age distribution of persons with disabilities (%)
SOURCE: UNDP
PALESTINE 2007
Female Male
Total population
Type of disability/difficulty (%)3
Male
Total
Female
Cause of disability/difficulty (%)
Persons with disabilities
0-14 15-24 25-44 45-64 65+
4.5 4.8Male 1,743,523 (50.8%)
Female 1,691,447 (49.2%)
Male82,981 (52.1%)
Female 76,236 (47.9%)
3,434,970159,2174.6
1.8 2.2
2.0
2.2 3.4
2.8
2.9 4.
5
3.7
12.5
12.1
12.3
41.5
38.0 40
.0MaleTotal
Female
TotalMaleFemale
SIGHT
HEARING
MOVEMENT
COMMUNICATION
UNDERSTANDING & COGNITION
..
..
..
..
Female
..
..
..
..
Male
..
..
..
..
Total
..
..
..
..
0-14
16.5
19.7
18.1
15-24
10.3
15.1
12.8
25-44
14.8
22.4
18.8
45-64
25.3
22.8
24.0
65+
33.0
20.0
26.2 56.9
26.825.2
26.0
42.1
36.1
38.9
13.9 15.2 14.6
13.8
15.6
14.7
51.6
54.1
Disability prevalence (%)2
Total
ON THE SELECTION OF DATASET AND YEAR, PLEASE SEE PAGE 23

77
BY EDUCATIONAL ATTAINMENT
Total population (%)Age: 10+ years
Persons with disabilities (%)Age: 10+ years
MaleTotal
Female
BY ECONOMIC ACTIVITY
Female Female
Persons with disabilities (%)Age: 10+ years
Total population (%)Age: 10+ years
Total Total
Male Male
MaleTotal
Female
EMPLOYED EMPLOYED
EMPLOYED EMPLOYED
EMPLOYED EMPLOYED
UNEMPLOYED UNEMPLOYED
UNEMPLOYED UNEMPLOYED
UNEMPLOYED UNEMPLOYED
STUDYING/TRAINING STUDYING/TRAINING
STUDYING/TRAINING STUDYING/TRAINING
STUDYING/TRAINING STUDYING/TRAINING
3.6 7.1
28.7 42.4
16.6 24.9
1.0 1.9
10.9 13.0
6.1 7.5
12.4 36.9
14.9 36.0
13.7 36.4
DISABILITY/OLD AGE/DISEASE DISABILITY/OLD AGE/DISEASE
DISABILITY/OLD AGE/DISEASE DISABILITY/OLD AGE/DISEASE
DISABILITY/OLD AGE/DISEASE DISABILITY/OLD AGE/DISEASE
43.9 5.4
39.2 5.6
41.5 5.5
HOMEMAKER HOMEMAKER
HOMEMAKER HOMEMAKER
HOMEMAKER HOMEMAKER
HAS INCOME/RETIRED HAS INCOME/RETIRED
HAS INCOME/RETIRED HAS INCOME/RETIRED
HAS INCOME/RETIRED HAS INCOME/RETIRED
36.3 47.4
0.2 0.1
17.6 23.5
1.0 0.3
3.2 1.1
2.1 0.7
NOT SPECIFIED NOT SPECIFIED
NOT SPECIFIED NOT SPECIFIED
NOT SPECIFIED NOT SPECIFIED
OTHERS OTHERS
OTHERS OTHERS
OTHERS OTHERS
0.1 0.2
0.3 0.4
0.2 0.3
1.6 0.8
2.6 1.5
2.1 1.1
ILLITERATE8.4 | 2.8 | 5.6
READ & WRITE12.7 | 13.3 | 13.0
PRIMARY22.9 | 24.9 | 23.9
PREPARATORY27.1 | 28.0 | 27.6
SECONDARY18.2 | 17.6 | 17.9
INTERMEDIATE DIPLOMA3.9 | 3.9 | 3.9
BACHELOR6.5 | 8.1 | 7.3
HIGHER DIPLOMA0.1 | 0.2 | 0.1
MASTER0.2 | 0.9 | 0.6
DOCTORATE0.0 | 0.3 | 0.2
NOT SPECIFIED0.1 | 0.1 | 0.1
ILLITERATE48.3 | 19.5 | 33.4
READ & WRITE14.5 | 19.9 | 17.3
PRIMARY15.3 | 23.0 | 19.3
PREPARATORY12.0 | 19.1 | 15.6
SECONDARY6.3 | 10.5 | 8.4
INTERMEDIATE DIPLOMA1.8 | 3.3 | 2.6
BACHELOR1.6 | 4.0 | 2.8
HIGHER DIPLOMA0.0 | 0.1 | 0.1
MASTER0.1 | 0.4 | 0.2
DOCTORATE0.0 | 0.1 | 0.1
NOT SPECIFIED0.2 | 0.1 | 0.2
PALE
STIN
E

78
BY GEOGRAPHIC LOCATION
BY MARITAL STATUS
Persons with disabilities (%)Age: 12+ years
Total population (%)Age: 12+ years
Persons with disabilities (%)
All data categories are as provided by Palestine.
Total population (%)
TotalFemale
Female
Male
Male Total
RURAL21.0
RURAL19.7
CAMPS13.6
CAMPS13.0
CAMPS13.3
RURAL20.3
URBAN65.5
URBAN67.3
URBAN66.4
RURAL18.3
RURAL18.3
RURAL18.3
CAMPS9.8
CAMPS10.0
CAMPS9.9
URBAN71.9
URBAN71.7
URBAN71.8
SINGLEMARRIEDDIVORCEDSEPARATEDWIDOWED WIDOWEDNOT SPECIFIED NOT SPECIFIED
Female26.7
39.9
29.80.5
2.2
0.9
SINGLEMARRIEDDIVORCEDSEPARATED
Female39.4
53.5
5.50.21.1
0.4
SINGLEMARRIEDDIVORCEDSEPARATEDWIDOWED WIDOWEDNOT SPECIFIED NOT SPECIFIED
Male29.0
66.5
3.30.20.6
0.4
SINGLEMARRIEDDIVORCEDSEPARATED
Male
0.0
47.851.0
0.50.4
SINGLEMARRIEDDIVORCEDSEPARATEDWIDOWED WIDOWEDNOT SPECIFIED NOT SPECIFIED
Total27.9
53.6
16.10.31.4
0.7
SINGLEMARRIEDDIVORCEDSEPARATED
Total43.6
52.2
3.00.10.6
0.4
Palestinian Central Bureau of Statistics (2007); Palestinian Central Bureau of Statistics and Ministry of Social Affairs (2011).
SOURCES FOOTNOTESData on HDI is from 2010. Data on life expectancy and GNI is from 2007.The prevalence rate of persons with disabilities is 2.7 per cent according to the Disability Survey (Palestinian Central Bureau of Statistics and Ministry of Social Affairs (2011)).Persons may report more than one type of disability. For this indicator, persons are
counted in each of the relevant categories, e.g. persons who report two types of disability are counted twice. The sum of the percentages therefore exceeds 100. The percentages are calculated as follows: Number of persons with disabilities counted in each category/total number of persons with disabilities.
1
2
3
PALE
STIN
E
0.2

79
CONVENTION
Signed SignedRatified/acceded
OPTIONAL PROTOCOL
National institutional framework for disability/persons with disabilities
National definition of disability/persons with disabilities
National legislative framework for disability/persons with disabilities (year of adoption)
ADDITIONAL MECHANISMS
Ratified/acceded
NATIONAL COORDINATION MECHANISM
Signature/ratification of the Convention on the Rights of Persons with Disabilities & its optional protocol
SOURCE: ESCWA, based on data collected from government focal points through the ESCWA Questionnaire on the Implementation of the Convention on the Rights of Persons with Disabilities and the Arab Decade for Persons with Disabilities (2013).
SOURCE: UN (2014).
No No2.4.2014
..
No
NameSupreme Council for the Affairs of Persons with Disabilities
Year established2004
ChairMinister of Social Affairs
Persons with disabilities represented?Yes
System of focal points for disability related matters in line ministries or other governmental institutions
General Union of the Disabled
Articles on disability included in the constitution?
Yes
General/overarching national disability law
Law No. 4 on the Rights of the Disabled (1999)
National disability strategy/plan
National Strategic Plan for the Disability Sector (2012)
PALE
STIN
E

80
SOCIO-ECONOMIC INDICATORS HDI Life expectancy at birth GNI per capita
0.827 78.2 77,269
Age-specific disability prevalence (%)
Age distribution of persons with disabilities (%)
SOURCE: UNDP
QATAR 20101
Disability prevalence (%)Female Male Total
Total population
Type of disability/difficulty (%)2
Male
Total
Female
Cause of disability/difficulty (%)
Persons with disabilities
0-14 15-24 25-44 45-64 65+
0.8 0.3Male 1,284,739 (75.6%)
Female 414,696 (24.4%)
Male4,300 (56.3%)
Female 3,343 (43.7%)
1,699,4357,6430.4
0.6
0.7
0.6
0.6
0.3
0.4
0.3
0.1
0.2 1.9
0.6
0.8
14.4
12.2
13.1
MaleTotal
Female
TotalMaleFemale
SIGHT
HEARING
SPEECH
MOVEMENT
REMEMBERING
SELF CARE
OTHER
..
..
..
..
Female
..
..
..
..
Male
..
..
..
..
Total
..
..
..
..
0-14
19.7
19.2
19.4
15-24
10.9
13.0
12.1
25-44
18.5
20.3
19.5
45-64
26.5
24.4
25.3
65+
24.3
23.1
23.6
30.8
32.4
31.7
18.323.021.0
35.9
42.0
39.3
48.2
41.7
44.532.9
27.1
29.6
33.728.6
30.8
12.1
16.3
14.5
ON THE SELECTION OF DATASET AND YEAR, PLEASE SEE PAGE 23

81
BY EDUCATIONAL ATTAINMENT
Total population (%)Age: 10+ years
Persons with disabilities (%)Age: 10+ years
MaleTotal
Female
BY ECONOMIC ACTIVITY
Female Female
Persons with disabilities (%)Age: 15+ years
Total population (%)Age: 15+ years
Total Total
Male Male
MaleTotal
Female
EMPLOYED
EMPLOYED
EMPLOYED
UNEMPLOYED
UNEMPLOYED
UNEMPLOYED
HOMEMAKER
HOMEMAKER
HOMEMAKER
RETIRED
RETIRED
RETIRED
8.1
38.9
25.5
1.3
0.5
0.8
51.5
0.0
22.4
0.0
7.3
4.2
STUDENT
STUDENT
STUDENT
7.3
8.0
7.7
UNABLE TO WORK
UNABLE TO WORK
UNABLE TO WORK
24.2
37.4
31.6
OTHER
OTHER
OTHER
NOT SEEKING WORK
NOT SEEKING WORK
NOT SEEKING WORK
1.5
2.2
1.9
6.1
5.7
5.9
ILLITERATE33.4 | 20.9 | 26.4
READ & WRITE21.3 | 26.5 | 24.2
PRIMARY12.0 | 13.4 | 12.8
PREPARATORY7.0 | 9.1 | 8.2
VOCATIONAL TRAINING0.2 | 1.4 | 0.9
SECONDARY10.3 | 12.1 | 11.3
POST-SECONDARY DIPLOMA3.2 | 4.0 | 3.7
UNIVERSITY & ABOVE11.6 | 11.3 | 11.5
OTHER1.0 | 1.1 | 1.0
OTHER0.0 | 0.0 | 0.0
READ & WRITE19.7 | 25.1 | 24.0
ILLITERATE4.2 | 3.4 | 3.6
PRIMARY15.3 | 24.8 | 22.8
PREPARATORY12.6 | 11.8 | 11.9
VOCATIONAL TRAINING0.1 | 1.9 | 1.5
SECONDARY20.5 | 18.8 | 19.2
POST-SECONDARY DIPLOMA3.5 | 2.7 | 2.8
UNIVERSITY & ABOVE24.0 | 11.5 | 14.2
EMPLOYED95.8
UNABLE TO WORK0.3
HOMEMAKERSTUDENT2.9 0.0
RETIRED0.5
UNEMPLOYED0.1
OTHER0.1
NOT SEEKING WORK0.2
EMPLOYED50.8
UNABLE TO WORK0.6
HOMEMAKERSTUDENT11.1 33.9
RETIRED0.9
UNEMPLOYED1.4
OTHER0.3
NOT SEEKING WORK1.1
EMPLOYED86.6
UNABLE TO WORK0.3
HOMEMAKERSTUDENT4.6 7.0
RETIRED0.6
UNEMPLOYED0.4
OTHER0.2
NOT SEEKING WORK0.4
QAT
AR

82
BY GEOGRAPHIC LOCATION
BY MARITAL STATUS
Persons with disabilities (%)Age: 15+ years
Total population (%)Age: 15+ years
All data categories are as provided by Qatar.
Qatar Statistics Authority (2010).
SOURCE FOOTNOTESAll data pertains to total population (both national and non-national).Persons may report more than one type of disability. For this indicator, persons are counted in each of the relevant categories, e.g. persons who report two types of
disability are counted twice. The sum of the percentages therefore exceeds 100. The percentages are calculated as follows: Number of persons with disabilities counted in each category / total number of persons with disabilities.
1
2
Persons with disabilities (%)Total
Total population (%)
Female
Female
Male
Male Total
.. ..
.. ..
..
..
.. ..
.. ..
..
..
Female FemaleSINGLEMARRIEDDIVORCEDWIDOWED
SINGLEMARRIEDDIVORCEDWIDOWED
SINGLEMARRIEDDIVORCEDWIDOWED
29.865.4
1.92.8
Male31.4
67.50.60.5
Total Total26.4 31.1
60.6 67.01.8 0.9
11.3 1.0
23.551.8
2.522.3
Male28.6
67.41.3
2.7
SINGLEMARRIEDDIVORCEDWIDOWED
SINGLEMARRIEDDIVORCEDWIDOWED
SINGLEMARRIEDDIVORCEDWIDOWED
QAT
AR

83
CONVENTION
Signed SignedRatified/acceded
OPTIONAL PROTOCOL
National institutional framework for disability/persons with disabilities
National definition of disability/persons with disabilities
National legislative framework for disability/persons with disabilities (year of adoption)
ADDITIONAL MECHANISMS
Ratified/acceded
NATIONAL COORDINATION MECHANISM
Signature/ratification of the Convention on the Rights of Persons with Disabilities & its optional protocol
SOURCE: ESCWA, based on data collected from government focal points through the ESCWA Questionnaire on the Implementation of the Convention on the Rights of Persons with Disabilities and the Arab Decade for Persons with Disabilities (2013).
SOURCE: UN (2014).
9.7.2007 9.7.200713.5.2008
Every person who is permanently incapacitated in whole or in part in any of their senses or physical, psychological or mental abilities, to the extent that his/her capacity for learning, rehabilitation or work is limited. (Law No. 2 on Persons with Special Needs, 2004)
FOOTNOTES:1 A new law is currently being developed.
2 These strategies broadly address vulnerable groups.
No
Name-
Year established-
Chair-
Persons with disabilities represented?-
System of focal points for disability related matters in line ministries or other governmental institutions
Articles on disability included in the constitution?
No
General/overarching national disability law
Law No. 2 on Persons with Special Needs (2004)1
National disability strategy/plan
Social Protection Sector Strategy; Family Cohesion Strategy (2011)2
QAT
AR

84
SOCIO-ECONOMIC INDICATORS2 HDI Life expectancy at birth GNI per capita
0.748 72.5 20,780
Age-specific disability prevalence (%)
Age distribution of persons with disabilities (%)
SOURCE: UNDP
Female Male
Total population
Type of disability/difficulty (%)
Male
Total
Female
Cause of disability/difficulty (%)
Persons with disabilities
0-14 15-24 25-44 45-64 65+
0.5 1.0Male 8,287,370 (50.1%)
Female 8,239,970 (49.9%)
Male80,567 (64.7%)
Female 44,029 (35.3%)
16,527,340124,5960.8
0.3
0.4
0.4
0.5
0.6
0.6
0.6
1.5
1.1
0.6 1.6
1.1 2.
1 3.2
2.7
MaleTotal
Female
TotalMaleFemale
BLIND
DEAF
DEAF & MUTE
LOSS OF ORGAN
MENTAL RETARDATION
PARALYSIS
OTHER
..
..
..
..
Female
..
..
..
..
Male
..
..
..
..
Total
..
..
..
..
12.1
14.5
13.6
2.5
13.7
14.3
14.11.8
22.1
18.5
23.9
23.9
24.3
24.2
23.823.8
19.82.62.3
2.02.2
SAUDI ARABIA 20041
0-14
23.7
18.1
20.1
15-24
20.3
13.3
15.8
25-44
31.5
41.1
37.7
45-64
11.0
15.6
14.0
65+
13.4
11.8
12.4
Disability prevalence (%)3
Total
ON THE SELECTION OF DATASET AND YEAR, PLEASE SEE PAGE 23

85
BY EDUCATIONAL ATTAINMENT
Total population (%)Age: 10+ years
Persons with disabilities (%)
MaleTotal
Female
BY ECONOMIC ACTIVITY
Female
Persons with disabilities (%) Total population (%)Age: 15+ years
Total
Male
ILLITERATE21.2 | 8.2 | 14.7
READ & WRITE15.4 | 13.9 | 14.7
PRIMARY19.8 | 23.0 | 21.4
INTERMEDIATE16.4 | 22.4 | 19.4
SECONDARY OR EQUIVALENT15.4 | 18.6 | 17.0
UNIVERSITY8.8 | 9.5 | 9.1
MASTER/HIGHER DIPLOMA0.1 | 0.7 | 0.4
DOCTORATE0.1 | 0.3 | 0.2
PRE-UNIVERSITY DIPLOMA2.7 | 3.5 | 3.1
EMPLOYED
EMPLOYED
EMPLOYED
9.3
56.7
33.2
HOMEMAKER
HOMEMAKER
HOMEMAKER
STUDENT22.8
STUDENT
STUDENT
24.2
23.5
61.6
0.0
30.5
RETIRED0.4
RETIRED
RETIRED
8.3
4.4
UNEMPLOYED
UNEMPLOYED
UNEMPLOYED
3.9
7.4
5.7
OTHER2.0
OTHER
OTHER
3.4
2.7
MaleTotal
Female .. | .. | ..
.. | .. | ..
.. | .. | ..
.. | .. | ..
.. | .. | ..
.. | .. | ..
Total
Female
Male
..
..
..SA
UD
I AR
ABI
A

86
BY GEOGRAPHIC LOCATION
BY MARITAL STATUS
Persons with disabilities (%)Age: 15+ years
Total population (%)Age: 15+ years
Persons with disabilities (%)Total
Total population (%)
Female
Female
Male
Male Total
.. ..
.. ..
..
..
.. ..
.. ..
..
..
Female FemaleNEVER MARRIEDMARRIEDDIVORCEDWIDOWED
NEVER MARRIEDMARRIEDDIVORCEDWIDOWED
NEVER MARRIEDMARRIEDDIVORCEDWIDOWED
31.861.0
1.65.5
Male39.8
59.20.60.4
Total Total38.0 35.9
54.6 60.11.9 1.1
5.6 2.9
45.338.6
3.013.0
Male34.1
62.91.21.7
NEVER MARRIEDMARRIEDDIVORCEDWIDOWED
NEVER MARRIEDMARRIEDDIVORCEDWIDOWED
NEVER MARRIEDMARRIEDDIVORCEDWIDOWED
SAU
DI A
RA
BIA
All data categories are as provided by Saudi Arabia.
Central Department of Statistics and Information (2004); Central Department of Statistics and Information (2007).
SOURCES FOOTNOTESAll data pertains to nationals only.Data for these three indicators is from 2005.The prevalence rate of persons with disabilities is 0.8 per cent according to the Demographic Survey (Central Department of Statistics and Information (2007)).
1
2
3

87
CONVENTION
Signed SignedRatified/acceded
OPTIONAL PROTOCOL
National institutional framework for disability/persons with disabilities
National definition of disability/persons with disabilities
National legislative framework for disability/persons with disabilities (year of adoption)
ADDITIONAL MECHANISMS
Ratified/acceded
NATIONAL COORDINATION MECHANISM
Signature/ratification of the Convention on the Rights of Persons with Disabilities & its optional protocol
SOURCE: ESCWA, based on data collected from government focal points through the ESCWA Questionnaire on the Implementation of the Convention on the Rights of Persons with Disabilities and the Arab Decade for Persons with Disabilities (2013).
SOURCE: UN (2014).
No No24.6.2008
Every person with a constant total or partial disability in their physical or sensory or mental or communicative or learning or psychological capabilities, to the extent that it reduces the possibility of them meeting their normal needs under conditions similar to those of non-disabled persons. (Code for the Welfare of the Disabled, 2000)
FOOTNOTE:1 National Youth Strategy (2010) and National Strategy for the Employment of Persons
with Disabilities (2011).
24.6.2008
NameCommittee for the Coordination of Services for Persons with Disabilities
Year established1979
ChairAssistant Deputy Minister for Social Welfare
Persons with disabilities represented?Yes
System of focal points for disability related matters in line ministries or other governmental institutions
Committee for the implementation of the Convention of the Rights of Persons with Disabilities
Committee for the implementation of the Arab Decade
Higher Council for the Affairs of the Disabled
Unit for Persons with Disabilities, Human Rights Commission
Articles on disability included in the constitution?
Yes
General/overarching national disability law
The Basic List of Rehabilitation Programs for the Disabled (1979); Code for the Welfare of the Disabled (2000)
National disability strategy/plan
Sectoral strategies1
SAU
DI A
RA
BIA

88
Cause of disability/difficulty (%)
SOCIO-ECONOMIC INDICATORS1 HDI Life expectancy at birth GNI per capita
.. 51.5 ..
Type of disability/difficulty (%)
Disability prevalence (%)
Age-specific disability prevalence (%)
Age distribution of persons with disabilities (%)
Persons with disabilities Total population
Male ..
Female ..
Male..
Female ..
..
SOMALIA
Female Male Total
SOURCE: UNDP
..
Cause of disability/difficulty (%)
..
..
..
..
Female
..
..
..
..
Male
..
..
..
..
Total
..
..
..
..
Age distribution of persons with disabilities (%)
Male
Total
Female0-14 15-24 25-44 45-64 65+
..
..
..
..
..
..
..
..
..
..
..
..
..
..
..
0-14 15-24 25-44 45-64 65+
MaleTotal
Female
.. .. .. .. .. .. .. .. .. .. .. .. .. .. ..TotalMaleFemale
..
....
..
....
..
....
..
..
..
.... .. ..
..
..
.. .. ..

89
BY EDUCATIONAL ATTAINMENT
Total population (%)Persons with disabilities (%)
BY ECONOMIC ACTIVITY
Total Total
Persons with disabilities (%) Total population (%)
Female Female
Male Male
.. ..
.. ..
MaleTotal
FemaleMaleTotal
Female .. | .. | ..
.. | .. | ..
.. | .. | ..
.. | .. | ..
.. | .. | ..
.. | .. | ..
.. | .. | ..
.. | .. | ..
.. | .. | ..
.. | .. | ..
.. | .. | ..
.. | .. | ..
.. ..SO
MA
LIA
90
BY GEOGRAPHIC LOCATION
Persons with disabilities (%)Total
BY MARITAL STATUS
Persons with disabilities (%)
Female
Total
Female
Male Male
Total
Total population (%)
Data for these three indicators is from 2012.1
FOOTNOTE
Total population (%)
Female
Female
Male
Male Total
.. ..
.. ..
..
..
.. ..
.. ..
..
..
..
..
..
..
..
..
..
..
..
..
..
..
..
..
..
..
..
..
..
..
..
..
..
..
SOM
ALI
A

91
CONVENTION
Signed SignedRatified/acceded
OPTIONAL PROTOCOL
National institutional framework for disability/persons with disabilities
National definition of disability/persons with disabilities
National legislative framework for disability/persons with disabilities (year of adoption)
ADDITIONAL MECHANISMS
Ratified/acceded
NATIONAL COORDINATION MECHANISM
Signature/ratification of the Convention on the Rights of Persons with Disabilities & its optional protocol
SOURCE: ..
SOURCE: UN (2014).
No NoNo No
Name..
Year established..
Chair..
Persons with disabilities represented?..
..
Articles on disability included in the constitution?
..
General/overarching national disability law
..
National disability strategy/plan
..
..
SOM
ALI
A

92
LIMITED USE OF LEG
LIMITED USE OF HAND
LOSS OF LEG
LOSS OF HAND
HEARING DIFFICULTY
DEAF
VISUAL DIFFICULTY
BLIND
SPEECH DIFFICULTY
MUTE
MENTAL DIFFICULTY
17.7
18.6
18.1
2.93.7
3.35.46.05.7
1.2
13.8
12.6
13.23.4
3.4
3.4
32.6
30.5
31.5
5.34.7
5.0
3.7 4.2 4.0
2.22.5
2.4
24.3
24.0
24.2
1.51.4
SOCIO-ECONOMIC INDICATORS HDI Life expectancy at birth GNI per capita
0.405 60.5 1,796
Age-specific disability prevalence (%)
Age distribution of persons with disabilities (%)
SOURCE: UNDP
SUDAN 20081
Disability prevalence (%)Female Male Total
Total population
Type of disability/difficulty (%)2
Male
Total
Female
Cause of disability/difficulty (%)
Persons with disabilities
0-14 15-24 25-44 45-64 65+
4.7 5.0Male 19,321,971 (50.6%)
Female 18,882,989 (49.4%)
Male968,086 (52.2%)
Female 886,899 (47.8%)
38,204,9601,854,9854.9
2.3
2.4
2.4 3.0
3.4
3.2 4.3 4.9
4.6
12.1
10.8
11.4
31.0
29.4
30.1
MaleTotal
Female
TotalMaleFemale
..
..
..
..
Female
..
..
..
..
Male
..
..
..
..
Total
..
..
..
..
0-14
20.1
21.6
20.9
15-24
13.0
12.8
12.9
25-44
23.8
22.1
22.9
45-64
23.3
21.4
22.3
65+
19.9
22.2
21.1
ON THE SELECTION OF DATASET AND YEAR, PLEASE SEE PAGE 23

93
BY EDUCATIONAL ATTAINMENT
BY ECONOMIC ACTIVITY
Female Female
Persons with disabilities (%)2
Age: 10+ yearsTotal population (%)Age: 10+ years
Total Total
Male Male
WORKING WORKING
WORKING WORKING
WORKING WORKING
UNEMPLOYED UNEMPLOYED
UNEMPLOYED UNEMPLOYED
UNEMPLOYED UNEMPLOYED
25.4 4.7
48.6 44.0
37.4 26.9
5.0 24.7
7.3 13.9
6.2 16.8
NOT SPECIFIED
NOT SPECIFIED
NOT SPECIFIED
NOT ECONOMICALLY ACTIVE NOT ECONOMICALLY ACTIVE
NOT ECONOMICALLY ACTIVE NOT ECONOMICALLY ACTIVE
NOT ECONOMICALLY ACTIVE NOT ECONOMICALLY ACTIVE
7.1
5.3
6.1
75.6 70.6
51.1 42.1
62.9 56.3
Total population (%)Age: 6+ years
Persons with disabilities (%)Age: 6+ years
MaleTotal
FemaleMaleTotal
Female
NO QUALIFICATION 8.7 | 8.0 | 8.3
BELOW PRIMARY 43.8 | 41.7 | 42.6
PRIMARY 14.9 | 14.8 | 14.8
INTERMEDIATE 4.5 | 5.1 | 4.9
SECONDARY 13.1 | 12.7 | 12.8
DIPLOMA/POST-SECONDARY 0.9 | 1.2 | 1.1UNIVERSITY/
FIRST DEGREE 5.0 | 4.5 | 4.7
DIPLOMA/HIGHER STUDIES 0.3 | 0.3 | 0.3
MASTER 0.2 | 0.3 | 0.2
DOCTORATE 0.1 | 0.1 | 0.1
KHALWA 4.5 | 7.5 | 6.2
NOT SPECIFIED 4.2 | 3.8 | 4.0
NO QUALIFICATION 48.1 | 38.9 | 42.2
PRIMARY 22.1 | 24.5 | 23.7
SECONDARY 12.8 | 11.3 | 11.8
ABOVE SECONDARY 6.1 | 6.5 | 6.3
KHALWA 6.0 | 15.0 | 11.8
NOT SPECIFIED 4.8 | 3.9 | 4.2
SUDA
N

94
BY GEOGRAPHIC LOCATION
BY MARITAL STATUS
Persons with disabilities (%)Age: 12+ years
Total population (%)Age: 12+ years
All data categories are as provided by Sudan.
Central Bureau of Statistics (2008).
SOURCE FOOTNOTESThe data includes data on South Sudan, as it has been obtained from a census conducted before partition.Persons may report more than one type of disability. For this indicator, persons are counted in each of the relevant categories, e.g. persons who report two types of
disability are counted twice. The sum of the percentages therefore exceeds 100. The percentages are calculated as follows: Number of persons with disabilities counted in each category / total number of persons with disabilities.
1
2
Persons with disabilities (%)
Total population (%)
Female
Female
Male
Male
TotalRURAL68.0
URBAN25.7
NOMADIC6.3
RURAL65.5
URBAN26.9
NOMADIC7.6
RURAL66.7
URBAN26.3
NOMADIC7.0
TotalRURAL63.9
URBAN29.4
NOMADIC6.7
RURAL61.9
URBAN30.2
NOMADIC7.9
RURAL62.9
URBAN29.8
NOMADIC7.3
Female FemaleNEVER MARRIEDMARRIEDDIVORCEDWIDOWEDNOT SPECIFIED
NEVER MARRIEDMARRIEDDIVORCEDWIDOWEDNOT SPECIFIED
NEVER MARRIEDMARRIEDDIVORCEDWIDOWEDNOT SPECIFIED
18.353.7
4.219.5
4.2
Male Male26.1
62.82.3
3.55.3
Total Total22.3 37.1
58.4 50.43.2 1.5
11.3 3.14.8 8.0
..
..
..
..
..
..
..
..
..
..
NEVER MARRIEDMARRIEDDIVORCEDWIDOWEDNOT SPECIFIED
SUDA
N

95
CONVENTION
Signed SignedRatified/acceded
OPTIONAL PROTOCOL
National institutional framework for disability/persons with disabilities
National definition of disability/persons with disabilities
National legislative framework for disability/persons with disabilities (year of adoption)
ADDITIONAL MECHANISMS
Ratified/acceded
NATIONAL COORDINATION MECHANISM
Signature/ratification of the Convention on the Rights of Persons with Disabilities & its optional protocol
SOURCE: ESCWA, based on data collected from government focal points through the ESCWA Questionnaire on the Implementation of the Convention on the Rights of Persons with Disabilities and the Arab Decade for Persons with Disabilities (2013).
SOURCE: UN (2014).
30.3.2007 No24.4.2009
..
24.4.2009
NameNational Council for the Disabled
Year established2010
ChairMinister of Welfare and Social Security
Persons with disabilities represented?Yes
System of focal points for disability related matters in line ministries or other governmental institutions
National Authority for Prosthetics
Articles on disability included in the constitution?
Yes
General/overarching national disability law
National Law for the Disabled (2009)
National disability strategy/plan
National Council for the Disabled, Five Year Plan (2012-2016) SU
DAN

96
PHYSICAL DISABILITY
VISUAL DISABILITY
HEARING DISABILITY
SPEECH DISABILITY
PSYCHOLOGICAL DISABILITY
MULTIPLE DISABILITIES
NOT SPECIFIED
MENTAL DISABILITY
39.0
46.2
43.6
10.0
5.4
6.9
5.9
6.2
23.7
19.4
20.9
2.3
12.69.7
10.7 0.10.0
0.3
2.8 2.6
4.74.9
11.310.8
Age-specific disability prevalence (%)
Age distribution of persons with disabilities (%)
Disability prevalence (%)Female Male Total
Type of disability/difficulty (%)
Male
Total
Female
Cause of disability/difficulty (%)
1.1 1.8 1.4
TotalMaleFemale
SOCIO-ECONOMIC INDICATORS HDI Life expectancy at birth GNI per capita
0.623 75.3 4,331SOURCE: UNDP
SYRIAN ARAB REPUBLIC 2007
0-14 15-24 25-44 45-64 65+
MaleTotal
Female
.. .. .. .. .. .. .. .. .. .. .. .. .. .. ..0-14
26.7
22.5
24.0
15-24
24.2
23.6
23.8
25-44
22.9
24.2
23.7
45-64
10.9
14.4
13.1
65+
15.3
15.2
15.3
CongenitalDiseaseAccidentOld ageOther causes
Female
54.126.16.6
10.23.0
Male
46.427.614.49.32.3
Total
49.127.011.69.72.6
ON THE SELECTION OF DATASET AND YEAR, PLEASE SEE PAGE 23
Total population1Persons with disabilities
Male 10,794,000 (51.1%)
Female 10,330,000 (48.9%)
Male179,144 (64.2%)
Female 99,855 (35.8%)
21,124,000278,999

97
BY EDUCATIONAL ATTAINMENT
BY ECONOMIC ACTIVITY
Female Female
Persons with disabilities (%)Age: 15+ years
Total population (%)1
Age: 15+ years
Total Total
Male Male
WORKING EMPLOYED
WORKING EMPLOYED
WORKING EMPLOYED
UNEMPLOYED UNEMPLOYED
UNEMPLOYED UNEMPLOYED
UNEMPLOYED UNEMPLOYED
3.9 9.1
24.4 65.5
17.0 36.9
6.2 5.3
1.3 7.6
3.1 6.5
NOT ECONOMICALLY ACTIVE NOT ECONOMICALLY ACTIVE
NOT ECONOMICALLY ACTIVE NOT ECONOMICALLY ACTIVE
NOT ECONOMICALLY ACTIVE NOT ECONOMICALLY ACTIVE
90.0 85.6
74.3 26.9
79.9 56.6
Total population (%)1
Age: 15+ yearsPersons with disabilities (%)Age: 10+ years
MaleTotal
FemaleMaleTotal
Female
ILLITERATE 6.1 | 18.1 | 12.0
READ & WRITE 18.0 | 17.5 | 17.8
PRIMARY 26.7 | 22.6 | 24.7
PREPARATORY 21.0 | 18.6 | 19.8
SECONDARY 15.1 | 13.2 | 14.2
INTERMEDIATE INSTITUTE 6.1 | 5.9 | 6.0
UNIVERSITY DEGREE & ABOVE 7.0 | 4.1 | 5.6
NOT SPECIFIED 0.0 | 0.0 | 0.0
ILLITERATE 60.1 | 41.2 | 47.8
READ & WRITE 14.9 | 18.7 | 17.4
PRIMARY 15.1 | 25.9 | 22.1
PREPARATORY 5.9 | 9.4 | 8.2SECONDARY
1.9 | 3.4 | 2.9
INTERMEDIATE INSTITUTE 1.3 | 0.8 | 1.0
UNIVERSITY DEGREE 0.8 | 0.4 | 0.5
NOT SPECIFIED 0.0 | 0.1 | 0.1
SYR
IAN
AR
AB
REP
UBL
IC

98
BY GEOGRAPHIC LOCATION
BY MARITAL STATUS
Persons with disabilities (%)Age: 15+ years
Total population (%)1
Age: 15+ years
All data categories are as provided by the Syrian Arab Republic.
Data on persons with disabilities is from Central Bureau of Statistics (2007); data on the total population is from Central Bureau of Statistics (2011a) and Central Bureau of Statistics (2011b).
SOURCES FOOTNOTEData on the total population is from different sources than the data on persons with disabilities, which limits comparability between the two. Data for the indicators “total population by sex” and “total population by geographical location” is from the Statistical Yearbook (Central Bureau of
Statistics (2011a)); data for the indicators “total population by marital status”, “total population by educational attainment” and “total population by economic activity” is from the Labour Force Survey (Central Bureau of Statistics (2011b)).
1
Persons with disabilities (%)
Total population (%)1
Female
Female
Male
Male
Total
Total
RURAL51.4
RURAL53.7
URBAN47.1
URBAN46.3
URBAN48.6
RURAL52.9
URBAN53.5
URBAN53.7
URBAN53.3
RURAL46.5
RURAL46.3
RURAL46.7
Female FemaleNEVER MARRIEDMARRIEDDIVORCEDWIDOWED
NEVER MARRIEDMARRIEDDIVORCEDWIDOWED
NEVER MARRIEDMARRIEDDIVORCEDWIDOWED
42.456.7
0.20.7
Male32.8
61.00.8
5.4
Total Total52.9 37.6
38.0 58.80.9 0.5
8.1 3.0
63.817.3
1.117.8
Male47.1
49.00.8
3.1
NEVER MARRIEDMARRIEDDIVORCEDWIDOWED
NEVER MARRIEDMARRIEDDIVORCEDWIDOWED
NEVER MARRIEDMARRIEDDIVORCEDWIDOWED
SYR
IAN
AR
AB
REP
UBL
IC

99
CONVENTION
Signed SignedRatified/acceded
OPTIONAL PROTOCOL
National institutional framework for disability/persons with disabilities
National definition of disability/persons with disabilities
National legislative framework for disability/persons with disabilities (year of adoption)
ADDITIONAL MECHANISMS
Ratified/acceded
NATIONAL COORDINATION MECHANISM
Signature/ratification of the Convention on the Rights of Persons with Disabilities & its optional protocol
SOURCE: ..
SOURCE: UN (2014).
30.3.2007 No10.7.2009
..
10.7.2009
Name..
Year established..
Chair..
Persons with disabilities represented?..
..
Articles on disability included in the constitution?
..
General/overarching national disability law
..
National disability strategy/plan
..
SYR
IAN
AR
AB
REP
UBL
IC

100
PHYSICAL DISABILITY
34.3
38.0
36.7
29.528.5
28.9
9.110.5
10.0
5.8
4.7
5.1
5.6
4.1
4.74.8 3.0 3.7
6.35.6
5.8
4.6
5.5
5.2
Age-specific disability prevalence (%)
Age distribution of persons with disabilities (%)
Disability prevalence (%)Female Male Total
Total population
Type of disability/difficulty (%)
Male
Total
Female
Persons with disabilities
1.0 1.7Male 5,214,445 (50.0%)
Female 5,206,006 (50.0%)
Male89,156 (63.7%)
Female 50,870 (36.3%)
10,420,451140,0261.3
TotalMaleFemale
SOCIO-ECONOMIC INDICATORS HDI Life expectancy at birth GNI per capita
0.705 74.2 7,920SOURCE: UNDP
TUNISIA 2009
0-14 15-24 25-44 45-64 65+
0.5
0.6
0.6
1.0
1.5
1.3
1.0 2.1
1.5
1.1 2.2
1.6
2.1 3.
4
2.7
MaleTotal
Female
0-14
12.4
9.0
10.2
15-24
18.6
17.9
18.2
25-44
33.2
36.2
35.1
45-64
21.1
23.1
22.4
65+
14.7
13.8
14.1
Cause of disability/difficulty (%)
Since birthChronic diseaseOccupational diseaseWork-related accidentRoad traffic accidentHome accidentOther accidentOld ageOther causesNot specified
Female
57.324.20.41.11.84.12.84.73.40.2
Male
48.324.81.76.14.73.14.32.74.10.2
Total
51.624.61.24.33.73.53.83.53.80.2
VISUAL DISABILITY
HEARING DISABILITY
SPEECH DISABILITY
SPEECH & HEARING DISABILITY
MULTIPLE DISABILITIES
MENTAL DISABILITY
MENTAL ILLNESS
ON THE SELECTION OF DATASET AND YEAR, PLEASE SEE PAGE 23

101
BY EDUCATIONAL ATTAINMENT
BY ECONOMIC ACTIVITY
Female
Persons with disabilities (%) Total population (%)Age: 15+ years
Total
Male
EMPLOYED
EMPLOYED
EMPLOYED
UNEMPLOYED
UNEMPLOYED
UNEMPLOYED
20.1
61.0
40.3
4.7
7.7
6.2
NOT ECONOMICALLY ACTIVE
NOT ECONOMICALLY ACTIVE
NOT ECONOMICALLY ACTIVE
75.2
31.3
53.5
Total population (%)Age: 10+ years
Persons with disabilities (%)
MaleTotal
Female NONE 26.6 | 12.2 | 19.4
PRIMARY 30.9 | 36.1 | 33.5
SECONDARY 32.2 | 40.0 | 36.1
HIGHER EDUCATION 10.0 | 11.5 | 10.8
NOT SPECIFIED 0.2 | 0.2 | 0.2
MaleTotal
Female .. | .. | ..
.. | .. | ..
.. | .. | ..
.. | .. | ..
.. | .. | ..
.. | .. | ..
Total
Female
Male
..
..
..TU
NIS
IA

102
BY GEOGRAPHIC LOCATION
BY MARITAL STATUS
Persons with disabilities (%) Total population (%)Age: 15+ years
All data categories are as provided by Tunisia.
SOURCE National Institute of Statistics (2009).
Persons with disabilities (%)
Total population (%)
Female
Female
Male
Male
Total
Total
RURAL41.7
RURAL41.7
URBAN58.3
URBAN58.3
URBAN58.3
RURAL41.7
URBAN65.9
RURAL34.1
FemaleSINGLEMARRIEDDIVORCEDWIDOWED
SINGLEMARRIEDDIVORCEDWIDOWED
SINGLEMARRIEDDIVORCEDWIDOWED
37.353.9
1.27.6
Male46.4
51.80.41.3
Total41.8
52.90.8
4.5
..
..
..
..
Female
Male
Total
..
..
..
..
..
..
..
..
..
..
..
..
TUN
ISIA

103
CONVENTION
Signed SignedRatified/acceded
OPTIONAL PROTOCOL
National institutional framework for disability/persons with disabilities
National definition of disability/persons with disabilities
National legislative framework for disability/persons with disabilities (year of adoption)
ADDITIONAL MECHANISMS
Ratified/acceded
NATIONAL COORDINATION MECHANISM
Signature/ratification of the Convention on the Rights of Persons with Disabilities & its optional protocol
SOURCE: ESCWA, based on data collected from government focal points through the ESCWA Questionnaire on the Implementation of the Convention on the Rights of Persons with Disabilities and the Arab Decade for Persons with Disabilities (2013).
SOURCE: UN (2014).
30.3.2007 30.3.20072.4.2008
A disabled person is defined as every person who was born with or subsequently acquired a permanent reduction in their physical or mental or sensory capabilities and qualifications, which restricts their capacity to perform one or more essential daily activities of a personal or social nature, and decreases their chances of inclusion in society. (Directive No. 83 on the Advancement and Protection of Disabled Persons, 2005)
FOOTNOTE:1 National Plan for the Prevention of Disability, National Strategy for Inclusion of Disabled
Persons in Schools, National Plan for the Employment of the Disabled and National Plan for Space Modification.
2.4.2008
NameHigher Council for Social Development and for the Welfare of Disabled Persons
Year established2010
ChairPrime Minister
Persons with disabilities represented?Yes
System of focal points for disability related matters in line ministries or other governmental institutions
The Higher Committee for Human Rights and Basic Freedoms
Articles on disability included in the constitution?
CBD
General/overarching national disability law
Directive No. 83 on the Advancement and Protection of Disabled Persons (2005)
National disability strategy/plan
Sectoral strategies1
TUN
ISIA

104
5.1
3.3
32.3
4.1
8.414.0
1.921.2
9.7 0.0
DIFFICULTIES IN BODY MOVEMENT
DIFFICULTIES IN GRASPING & HOLDING OBJECTS
VISUAL DIFFICULTIES
SPEECH DIFFICULTIES
OTHER DIFFICULTIES
NOT SPECIFIED
LEARNING DIFFICULTIES
LOCOMOTOR & MOVEMENTDIFFICULTIESHEARING
DIFFICULTIES
DIFFICULTIES IN PERSONAL CARE
Age-specific disability prevalence (%)
Age distribution of persons with disabilities (%)
Disability prevalence (%)Female Male Total
Total population
Type of disability/difficulty (%)
Cause of disability/difficulty (%)
Persons with disabilities
.. ..Male 2,806,141 (68.3%)
Female 1,300,286 (31.7%)
Male..
Female ..
4,106,42734,4800.8
TotalMaleFemale
SOCIO-ECONOMIC INDICATORS HDI Life expectancy at birth GNI per capita
0.831 75.5 67,920SOURCE: UNDP
UNITED ARAB EMIRATES 20051
0-14 15-24 25-44 45-64 65+
MaleTotal
Female
.. .. .. .. .. .. .. .. .. .. .. .. .. .. ..
Male
Total
Female0-14 15-24 25-44 45-64 65+
..
..
..
..
..
..
..
..
..
..
..
..
..
..
..
..
..
..
..
Female
..
..
..
..
Male
..
..
..
..
Total
..
..
..
..
ON THE SELECTION OF DATASET AND YEAR, PLEASE SEE PAGE 23

105
BY EDUCATIONAL ATTAINMENT
BY ECONOMIC ACTIVITY
Persons with disabilities (%) Total population (%)
Total population (%)Age: 10+ years
MaleTotal
Female ILLITERATE 7.6 | 10.0 | 9.3
READ & WRITE 11.1 | 15.0 | 13.9
PRIMARY13.1 | 15.3 | 14.6
PREPARATORY15.5 | 18.7 | 17.8
SECONDARY30.2 | 24.2 | 25.9
BELOW UNIVERSITY4.7 | 3.7 | 4.0
UNIVERSITY16.0 | 11.5 | 12.8
ABOVE UNIVERSITY1.6 | 1.5 | 1.5
NOT SPECIFIED0.2 | 0.1 | 0.1
MaleTotal
Female .. | .. | ..
.. | .. | ..
.. | .. | ..
.. | .. | ..
.. | .. | ..
.. | .. | ..
Persons with disabilities (%)
Total Total
Female Female
Male Male
.. ..
.. ..
.. ..U
NIT
ED A
RA
B EM
IRAT
ES

106
BY GEOGRAPHIC LOCATION
BY MARITAL STATUS
All data categories are as provided by the United Arab Emirates.
National Bureau of Statistics (2005).
SOURCE FOOTNOTEAll data pertains to total population (both national and non-national).
1
Persons with disabilities (%)
Total population (%)
Female
Female
Male
Male
Total
Total
URBAN82.4
URBAN83.0
URBAN81.2
RURAL17.6
RURAL17.0
RURAL18.8
.. ..
.. ..
..
..
Persons with disabilities (%)
Female
Total
Female
Male Male
Total
Total population (%)
..
..
..
..
..
..
..
..
..
..
..
..
..
..
..
..
..
..
..
..
..
..
..
..
UN
ITED
AR
AB
EMIR
ATES

107
CONVENTION
Signed SignedRatified/acceded
OPTIONAL PROTOCOL
National institutional framework for disability/persons with disabilities
National definition of disability/persons with disabilities
National legislative framework for disability/persons with disabilities (year of adoption)
ADDITIONAL MECHANISMS
Ratified/acceded
NATIONAL COORDINATION MECHANISM
Signature/ratification of the Convention on the Rights of Persons with Disabilities & its optional protocol
SOURCE: ESCWA, based on data collected from government focal points through the ESCWA Questionnaire on the Implementation of the Convention on the Rights of Persons with Disabilities and the Arab Decade for Persons with Disabilities (2013).
SOURCE: UN (2014).
8.2.2008 12.2.200819.3.2010
Every person with a constant total or partial, permanent or temporary insufficiency or disruption in their physical or sensory or mental or communicative or learning or psychological abilities to the extent that it reduces the possibility of them meeting their normal needs under conditions similar to those of non-disabled persons. (Federal Law No. 29 on the Rights of the Disabled amended by Federal Law No. 14, 2009)
No
Name-
Year established-
Chair-
Persons with disabilities represented?-
System of focal points for disability related matters in line ministries or other governmental institutions
Articles on disability included in the constitution?
No
General/overarching national disability law
Federal Law No. 29 on the Rights of the Disabled (2006) amended by Federal Law No. 14 (2009)
National disability strategy/plan
No
UN
ITED
AR
AB
EMIR
ATES

108
Age-specific disability prevalence (%)
Age distribution of persons with disabilities (%)
Disability prevalence (%)Female Male Total
Total population
Type of disability/difficulty (%)
Cause of disability/difficulty (%)
Persons with disabilities
1.7 2.1Male 10,036,953 (51.0%)
Female 9,648,208 (49.0%)
Male215,503 (56.7%)
Female 164,421 (43.3%)
19,685,161379,9241.9
TotalMaleFemale
SOCIO-ECONOMIC INDICATORS1 HDI Life expectancy at birth GNI per capita
0.428 62.7 2,020SOURCE: UNDP
YEMEN 2004
0-14 15-24 25-44 45-64 65+
MaleTotal
Female
.. .. .. .. .. .. .. .. .. .. .. .. .. .. ..
Male
Total
Female0-14 15-24 25-44 45-64 65+
..
..
..
..
..
..
..
..
..
..
..
..
..
..
..
Congenital (since birth)Work-related accidentAccidentRoad traffic accidentDisease/illnessWeapon-related accidentLand minesOld ageNot specified
Female
25.31.71.78.9
21.90.40.2
36.53.5
Male
27.14.54.6
12.922.52.60.7
21.63.5
Total
26.33.33.4
11.122.21.70.5
28.03.5
21.2
17.4
19.011.6
10.0
4.3
4.2
21.0
21.3
21.17.0
3.8
10.7
15.8
12.9
14.1 0.50.5
0.5
17.3 14.5
5.24.6
6.6
6.83.9
MENTALDIFFICULTIES
4.0
5.04.7
10.7
DIFFICULTY IN MOVEMENT
DIFFICULTY IN WALKING
DIFFICULTY IN GRASPING OBJECTS
VISUAL DIFFICULTY
SPEECH DIFFICULTY
SPEECH & HEARING DIFFICULTY
NOT SPECIFIED
TWO OR MOREDIFFICULTIES
HEARINGDIFFICULTY
ON THE SELECTION OF DATASET AND YEAR, PLEASE SEE PAGE 23

109
BY EDUCATIONAL ATTAINMENT
BY ECONOMIC ACTIVITY
Female
Persons with disabilities (%) Total population (%)Age: 15+ years
Total
Male
EMPLOYED
EMPLOYED
EMPLOYED
UNEMPLOYED
UNEMPLOYED
UNEMPLOYED
5.6
58.7
32.1
3.7
8.8
6.2
NOT SPECIFIEDNOT ECONOMICALLY ACTIVE
NOT SPECIFIEDNOT ECONOMICALLY ACTIVE
NOT SPECIFIEDNOT ECONOMICALLY ACTIVE
2.887.9
1.331.2
2.059.6
Total population (%)Age: 10+ years
Persons with disabilities (%)
MaleTotal
Female ILLITERATE 61.6 | 29.6 | 45.3
READ & WRITE 25.4 | 37.3 | 31.5
PRIMARY 1.8 | 4.4 | 3.1
PREPARATORY/BASIC/UNIFIED4.9 | 12.0 | 8.5
PRE-SECONDARY DIPLOMA 0.1 | 0.6 | 0.4
SECONDARY OR EQUIVALENT3.9 | 10.4 | 7.2
POST-SECONDARY DIPLOMA 0.4 | 1.6 | 1.0
BACHELOR 1.0 | 3.5 | 2.3
NOT SPECIFIED 0.9 | 0.6 | 0.7
DOCTORATE 0.0 | 0.1 | 0.0
MASTER 0.0 | 0.2 | 0.1
POST-GRADUATE DIPLOMA 0.0 | 0.0 | 0.0
Total
Female
Male
..
..
..
.. | .. | ..
.. | .. | ..
.. | .. | ..
.. | .. | ..
.. | .. | ..
.. | .. | ..
MaleTotal
Female
YEM
EN

110
BY GEOGRAPHIC LOCATION
BY MARITAL STATUS
Persons with disabilities (%) Total population (%)Age: 10+ years
All data categories are as provided by Yemen.
Central Statistical Organization (2004).
SOURCE FOOTNOTEData for these three indicators is from 2005.1
Persons with disabilities (%)Female Male Total
Total
RURAL77.9
RURAL74.8
URBAN23.9
URBAN25.2
URBAN22.1
RURAL76.1
URBAN28.6
RURAL71.4
..
..
..
..
Total population (%)
FemaleSINGLEMARRIEDDIVORCEDWIDOWEDNOT SPECIFIED
SINGLEMARRIEDDIVORCEDWIDOWEDNOT SPECIFIED
SINGLEMARRIEDDIVORCEDWIDOWEDNOT SPECIFIED
42.848.8
1.46.3
0.6
Male53.2
44.30.71.20.6
Total48.1
46.51.1
3.70.6
Female
Male
Total
..
..
..
..
..
..
..
..
..
..
..
..
..
..
YEM
EN

111
CONVENTION
Signed SignedRatified/acceded
OPTIONAL PROTOCOL
National institutional framework for disability/persons with disabilities
National definition of disability/persons with disabilities
National legislative framework for disability/persons with disabilities (year of adoption)
ADDITIONAL MECHANISMS
Ratified/acceded
NATIONAL COORDINATION MECHANISM
Signature/ratification of the Convention on the Rights of Persons with Disabilities & its optional protocol
SOURCE: ESCWA, based on data collected from government focal points through the ESCWA Questionnaire on the Implementation of the Convention on the Rights of Persons with Disabilities and the Arab Decade for Persons with Disabilities (2013).
SOURCE: UN (2014).
30.3.2007 11.4.200726.3.2009
A partially, but permanently, disabled person is every individual, male or female, with a permanent disability in one or some body parts, who can rarely work due to their condition. A person with temporary total or partial disability is every individual, male or female, with a disability in one or some body parts that lasts for a temporary period of their life and as a result cannot work outside of the limits of what their disability allows. A person with a permanent total disability is every individual, male or female, with a total disability that causes permanent inability to work. (Law no. 29 on Social Welfare, 2008)
26.3.2009
NameThe Disabled Care and Rehabilitation Fund (DCRF)
Year established2002
ChairExecutive Director of the Fund
Persons with disabilities represented?Yes
System of focal points for disability related matters in line ministries or other governmental institutions
Articles on disability included in the constitution?
Yes
General/overarching national disability law
Law No. 2 on establishing the Disabled Care and Rehabilitation Fund (2002)
National disability strategy/plan
CBD
YEM
EN

112
REFERENCES
Braithwaite, Jeanine and Daniel Mont (2008). Disability and poverty: A Survey of World Bank Poverty Assessments and Implications. Social Protection Discussion Paper No. 0805. Washington DC: World Bank. Available from http://siteresources.worldbank.org/SOCIALPROTECTION/Resources/SP-Discussion-papers/Disability-DP/0805.pdf.
Ebbeson, Louise, and others (2011). An analysis of the status of implementation of the Convention on the Rights of Persons with Disabilities in the Caribbean. Port of Spain: ECLAC Subregional Headquarters for the Caribbean. Available from http://www.eclac.org/publicaciones/xml/4/42324/LCARL.280rev1.pdf.
Economic Commission for Latin America and the Caribbean (2012). Social Panorama of Latin America. Santiago. Available from http://www.cepal.org/publicaciones/xml/8/49398/2012-960-PSI_WEB.pdf.
Economic and Social Commission for Asia and the Pacific (2012). Disability at a Glance 2012: Strengthening the Evidence Base in Asia and the Pacific. Bangkok. Available from http://www.unescap.org/sdd/publications/DG2012/SDD-Disability-Glance-2012.pdf.
Economic and Social Commission for Western Asia (2010a). Follow-up on priority issues in the field of social development in the ESCWA region: Proposed methods to combat poverty among persons with disabilities. Beirut. Available from http://css.escwa.org.lb/sdd/1415/6e.pdf.
__________ (2010b). International and Regional Practices Favouring the Inclusion of Persons with Disabilities in the Labour Market. Beirut. Available from http://www.escwa.un.org/divisions/div_editor/Download.asp?table_name=divisions_other&field_name=ID&FileID=1361.
__________ (2013). Managing Change: Mainstreaming Disability into the Development Process. Beirut. Available from http://www.escwa.un.org/information/pubaction.asp?PubID=1256.
Elwan, Ann (1999). Poverty and Disability: A Survey of the Literature. Social Protection Discussion Paper No. 9932. Washington DC: World Bank. Available from http://www-wds.worldbank.org/servlet/WDSContentServer/IW3P/IB/2000/12/15/000094946_0011210532099/Rendered/PDF/multi_page.pdf.
Groce, Nora, and others (2011). Poverty and Disability: A critical review of the literature in low and middle-income countries. Working Paper Series No. 16. London: University College London and Leonard Cheshire Disability and Inclusive Development Centre. Available from http://www.ucl.ac.uk/lc-ccr/centrepublications/workingpapers/WP16_Poverty_and_Disability_review.pdf.
Mitra, Sophie, and others (2011). Disability and Poverty in Developing Countries: A Snapshot from the World Health Survey. Social Protection Discussion Paper No. 1109. Washington DC: World Bank. Available from http://siteresources.worldbank.org/SOCIALPROTECTION/Resources/SP-Discussion-papers/Disability-DP/1109.pdf.
Mizunoya, Suguru and Sophie Mitra (2013). Is There a Disability Gap in Employment Rates in Developing Countries? World Development, vol. 42, pp. 28-43.
Organization for Economic Co-operation and Development (2010). Sickness, Disability and Work: Breaking the Barriers. Available from http://www.oecd-ilibrary.org/social-issues-migration-health/sickness-disability-and-work-breaking-the-barriers_9789264088856-en.
United Nations (2014). Convention and Optional Protocol Signatures and Ratifications. Available from http://www.un.org/disabilities/countries.asp?navid=12&pid=166 (accessed 5 May 2014).
United Nations Children’s Fund (2013). State of the World’s Children 2013: Children with Disabilities. New York. Available from http://www.unicef.org/sowc2013/files/SWCR2013_ENG_Lo_res_24_Apr_2013.pdf.
United Nations Development Programme. International Human Development Indicators. Available from http://hdrstats.undp.org/en/tables (accessed 29 November 2013).

113
World Bank (2005). A Note on Disability Issues in the Middle East and North Africa. Washington DC. Available from http://siteresources.worldbank.org/DISABILITY/Resources/Regions/MENA/MENADisabilities.doc.
World Health Organization (2001). International classification of functioning, disability and health: ICF. Geneva.
World Health Organization and Economic and Social Commission for Asia and the Pacific (2008). Training Manual on Disability Statistics. Bangkok. Available from http://www.unescap.org/STAT/disability/manual/Training-Manual-Disability-Statistics.pdf.
World Health Organization and World Bank (2011). World report on disability 2011. Geneva. Available from http://whqlibdoc.who.int/publications/2011/9789240685215_eng.pdf.

114
Quantitative data in the report and country profiles was taken from the following sources, which were verified—and in many cases complemented—through email communication with focal points in the respective national statistical offices.
ALGERIAOffice Nationale des Statistiques and others. Enquête nationale à indicateurs multiples (MICS) 2006. Algiers.
BAhRAINCentral Informatics Organization (2010a). Census 2010. Isa Town and Manama.
Central Informatics Organization (2010b). Census 2010– Sample Survey. Isa Town and Manama.
EGYPTCentral Agency for Public Mobilization and Statistics. Population and Housing Census 2006. Cairo.
IRAqCentral Organization for Statistics and Information Technology and others. Iraq Household Socio-Economic Survey (IHSES) 2007. Baghdad.
JORDANDepartment of Statistics. Disability Survey 2010. Amman.
KUwAITCentral Statistical Bureau. Kuwait 2011 General Census. Kuwait City.
LEBANONCentral Administration of Statistics and others. National Survey of Household Living Conditions 2004. Beirut.
LIBYAPan Arab Project for Family Health and the National Centre for Infectious and Chronic Disease Control. National Libyan Family Health Survey 2007. Tripoli.
MOROCCOHaut-Commissariat au Plan. Recensement Général de la Population et de l’Habitat 2004. Rabat.
Ministry of Solidarity, Women, Family and Social Development. National Survey on Disability 2006. Rabat.
OMANNational Center for Statistics and Information. Census 2010. Muscat.
PALESTINEPalestinian Central Bureau of Statistics. Population, Housing and Establishment Census 2007. Ramallah.
Palestinian Central Bureau of Statistics and Ministry of Social Affairs. Disability Survey 2011. Ramallah.
qATARQatar Statistics Authority. Population, Household and Establishment Census 2010. Doha.
SAUDI ARABIACentral Department of Statistics and Information. Population and Housing Census 2004. Riyadh.
Central Department of Statistics and Information. Demographic Survey 2007. Riyadh.
SUDANCentral Bureau of Statistics. Fifth Population and Housing Census 2008. Khartoum.
SOURCES OF NATIONAL STATISTICAL DATA

115
SYRIAN ARAB REPUBLICCentral Bureau of Statistics. Multipurpose Survey 2007. Damascus.
Central Bureau of Statistics (2011a). Statistical Yearbook 2011. Damascus.
Central Bureau of Statistics (2011b). Labour Force Survey 2011. Damascus.
TUNISIANational Institute of Statistics. National Survey on Population and Housing 2009. Tunis.
UNITED ARAB EMIRATESNational Bureau of Statistics. Census 2005. Abu Dhabi.
YEMENCentral Statistical Organization. Population and Housing Census 2004. Sana’a.


United Nations House, Riad El Solh SquareP.O. Box: 11-8575, Beirut, LebanonTel +961 1 981301; Fax +961 1 981510
www.escwa.un.org
Copyright © ESCWA 2014
E/ESCWA/SDD/2014/Technical Paper.1 United Nations Publication
14-00125 – April 2014
Cover & layout design by Nayla Yehia