what is to be blamed for economic stagnation in arab world? a. illarionov, cato institute, institute...
TRANSCRIPT

WHAT IS TO BE BLAMED WHAT IS TO BE BLAMED FOR ECONOMIC STAGNATIONFOR ECONOMIC STAGNATION
IN ARAB WORLD?IN ARAB WORLD?
A. IllarionovA. Illarionov,,
Cato Institute, Institute of Economic AnalysisCato Institute, Institute of Economic Analysis
2nd Economic Freedom of the Arab World Conference2nd Economic Freedom of the Arab World Conference
Dead SeaDead Sea, , Jordan, November 23, 2007Jordan, November 23, 2007
© © Cato InstituteCato Institute, , Institute of Economic AnalysisInstitute of Economic Analysis
www.cato.orgwww.cato.org, , www.cato.ruwww.cato.ru, , www.iea.ruwww.iea.ru

© IEA
Is there any economic stagnation in the Arab World?

© IEA
GDP per capita in Jordan as % of coreGDP per capita in Jordan as % of coreof Western Europe (12 countries), of Western Europe (12 countries), 1182820–2000–2006.6.
Sources: Angus Maddison, 2006; IEA.

© IEA
GDP per capita in 8 Arab countries (Jordan, Iraq, Syria, GDP per capita in 8 Arab countries (Jordan, Iraq, Syria, Lebanon, Palestine, Egypt, Tunisia, Morocco) Lebanon, Palestine, Egypt, Tunisia, Morocco)
as % of World average, as % of World average, 1182820–2000–2006.6.
Sources: Angus Maddison, 2006; IEA.
© IEA
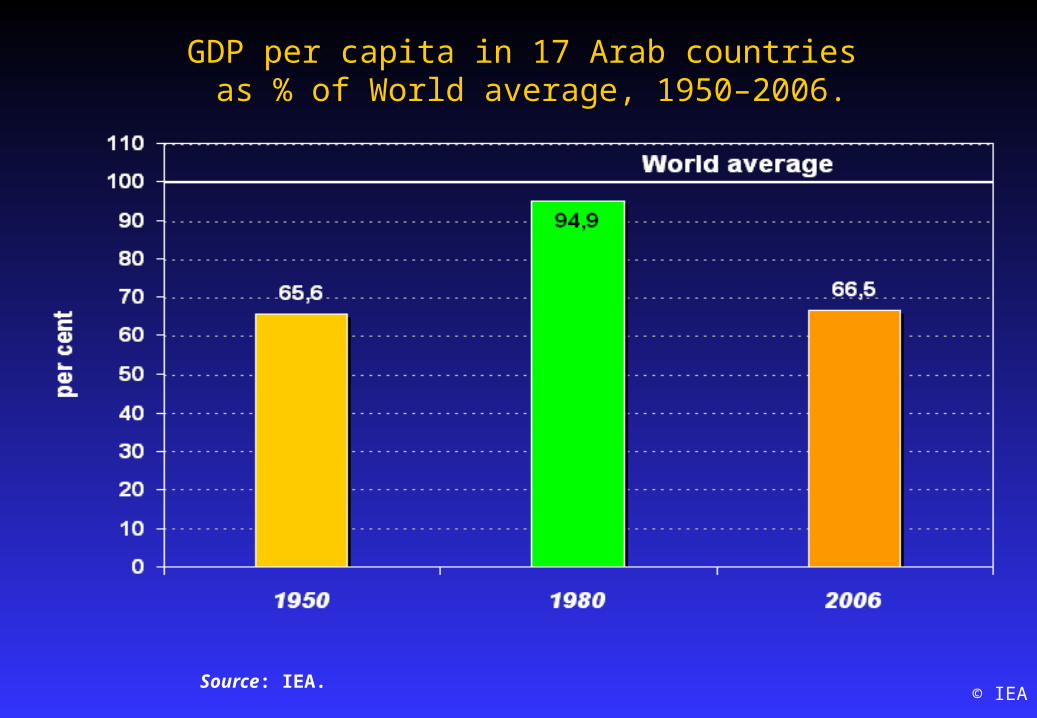
GDP per capita in 17 Arab countries GDP per capita in 17 Arab countries as % of World average, as % of World average, 11950950–200–2006.6.
Source: IEA.
© IEA
There is an economic stagnation in the Arab World.
Arab countries are lagging behind the West and the World.
Why?
© IEA
Existing theories.
Because of:
- Religion (Islam)?
- Ethnicity (Arab nation)?
- Natural resources (oil)?
- Something else?

© IEA
What is to be blamed?
Islam?
© IEA
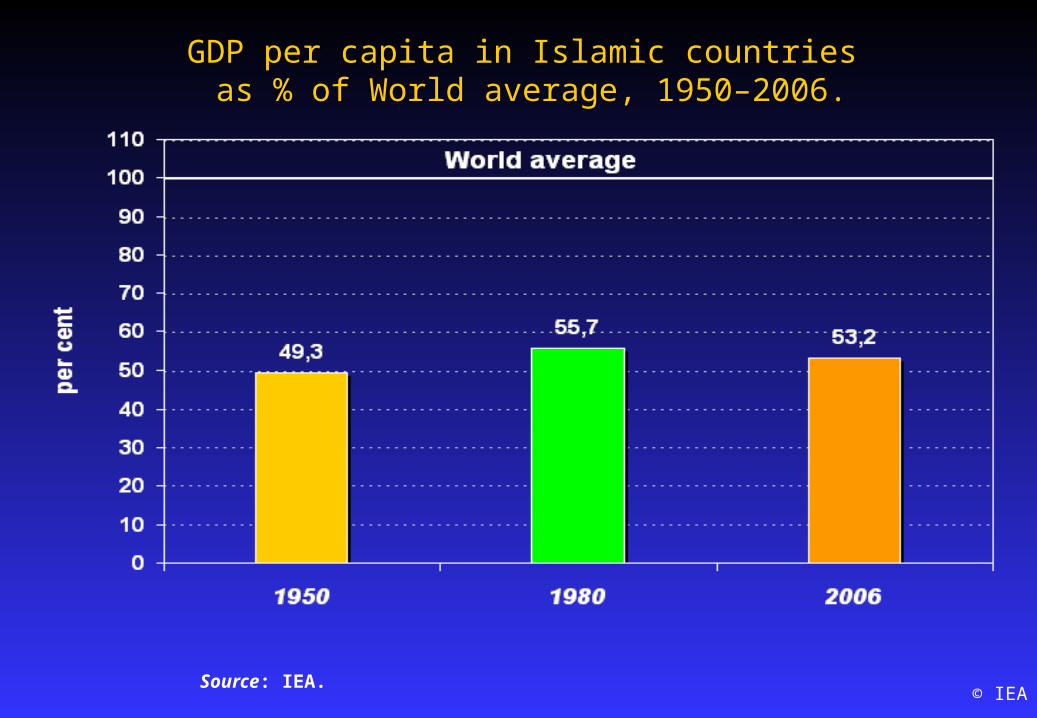
GDP per capita in Islamic countries GDP per capita in Islamic countries as % of World average, as % of World average, 11950950–200–2006.6.
Source: IEA.
© IEA
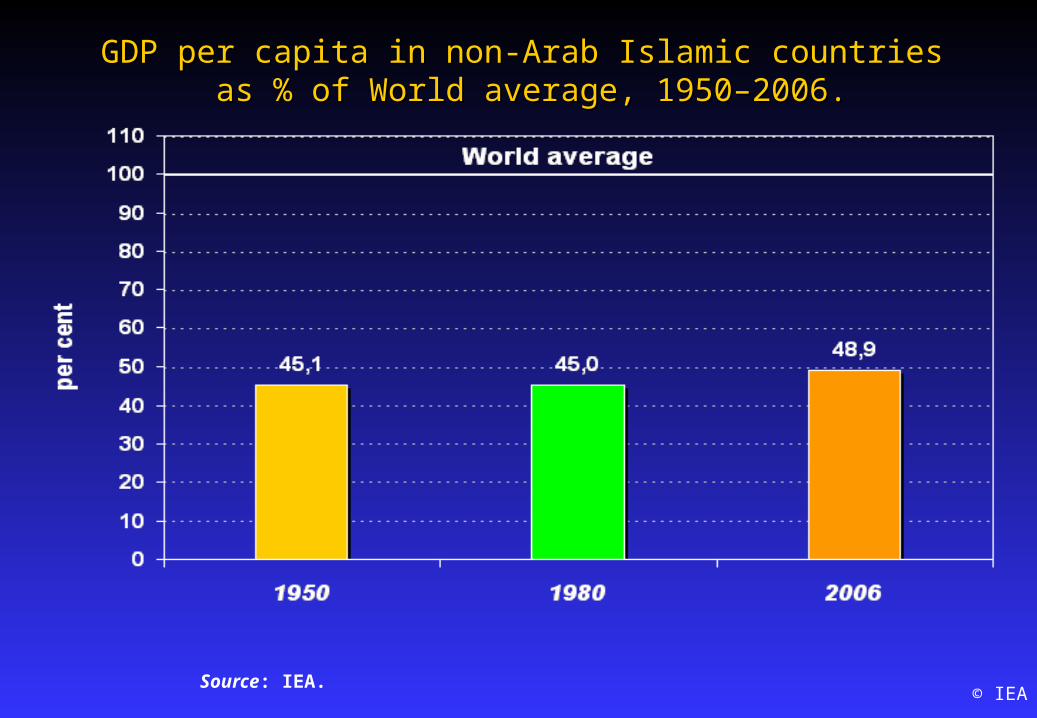
GDP per capita in non-Arab Islamic countries GDP per capita in non-Arab Islamic countries as % of World average, as % of World average, 11950950–200–2006.6.
Source: IEA.
© IEA
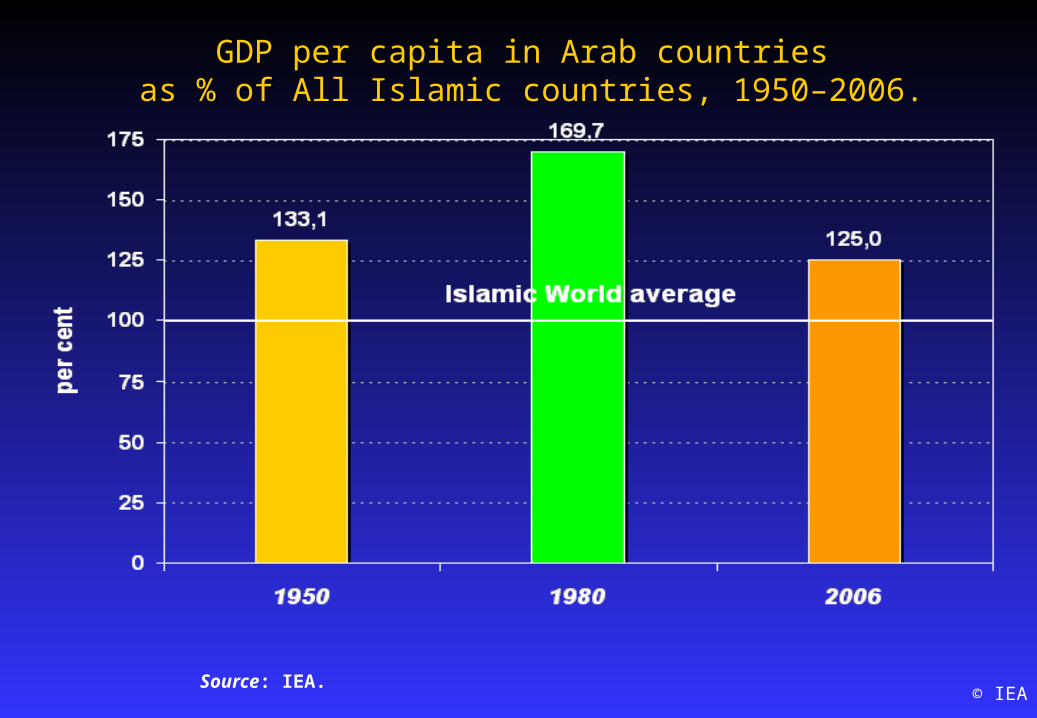
GDP per capita in Arab countries GDP per capita in Arab countries as % of All Islamic countries, as % of All Islamic countries, 11950950–200–2006.6.
Source: IEA.
© IEA
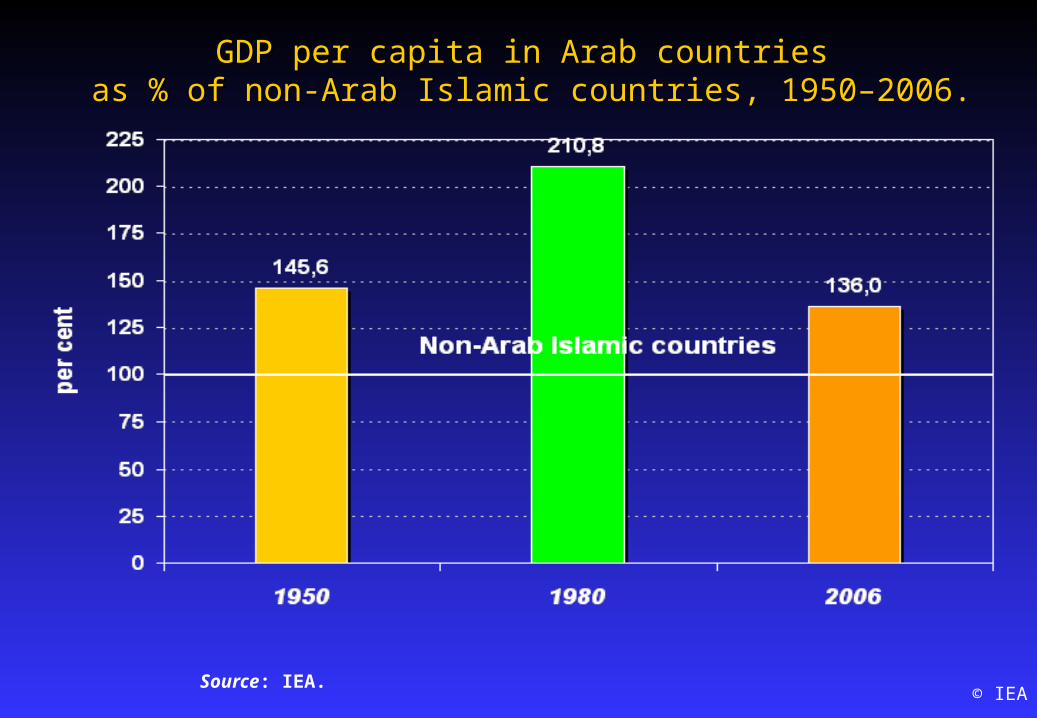
GDP per capita in Arab countries GDP per capita in Arab countries as % of non-Arab Islamic countries, as % of non-Arab Islamic countries, 11950950–200–2006.6.
Source: IEA.

© IEA
What is to be blamed?
Arab ethnicity?
© IEA
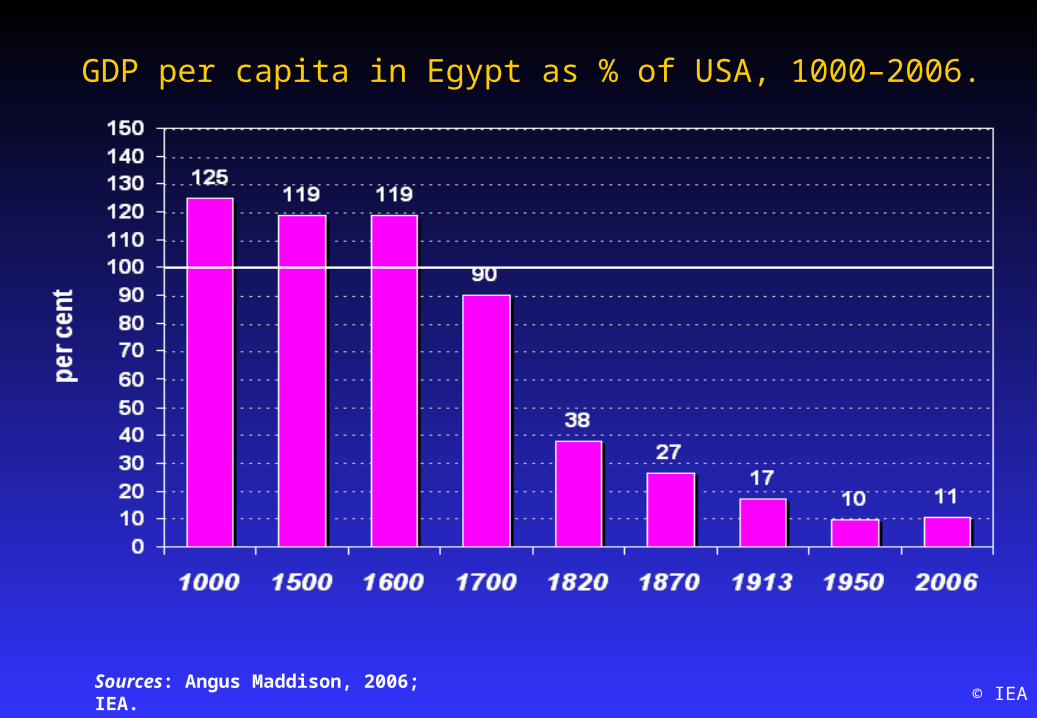
GDP per capita in Egypt as % of USA, GDP per capita in Egypt as % of USA, 110000–20000–2006.6.
Sources: Angus Maddison, 2006; IEA.

© IEA
GDP per capita in 3 Arab countries (Egypt, Iraq and Morocco) GDP per capita in 3 Arab countries (Egypt, Iraq and Morocco) as % of Western Europe, as % of Western Europe, 110000–20000–2006.6.
Sources: Angus Maddison, 2006; IEA.

© IEA
What is to be blamed?
Oil?

© IEA
GDP per capita in Arab countriesGDP per capita in Arab countriesas % of the World average jumped from 66% in 1950 as % of the World average jumped from 66% in 1950
to 95% in 1980 just to fall again to 66% in to 95% in 1980 just to fall again to 66% in 2002006.6.
© IEA
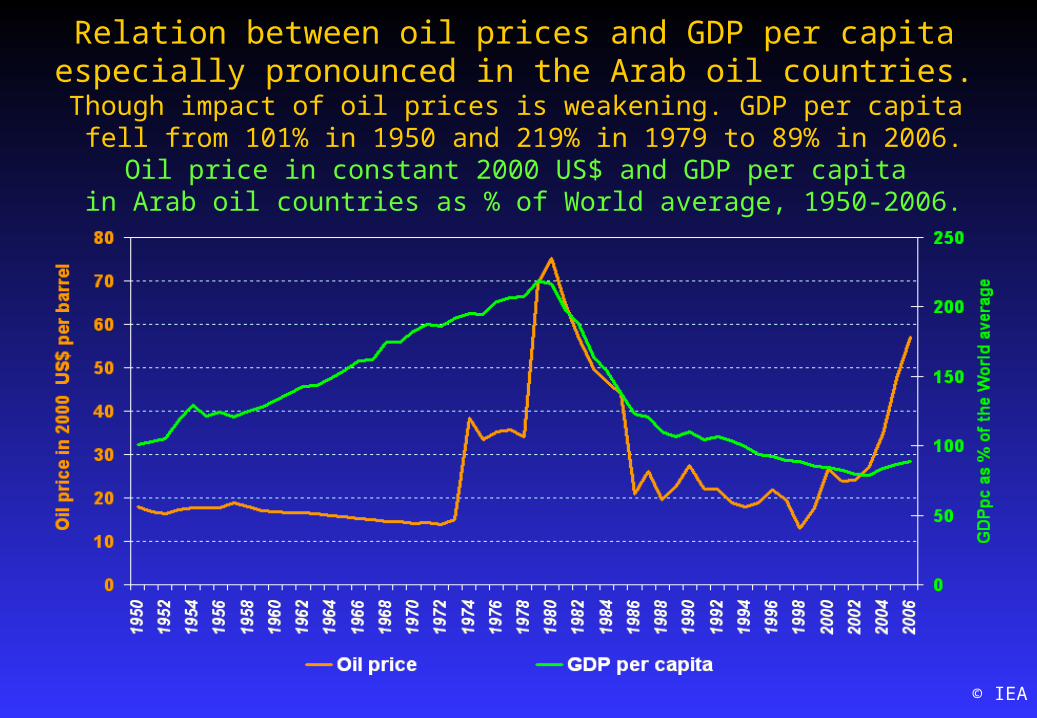
Relation between oil prices and GDP per capita especially pronounced in the Arab oil countries. Though impact of oil prices is weakening. GDP per capita fell from 101% in 1950 and 219% in 1979 to 89% in 2006.
Oil price in constant 2000 US$ and GDP per capita in Arab oil countries as % of World average, 1950-2006.

© IEA
GDP per capita in non-oil Arab countries as % of the World average over the last 30 years
was effectively flat – at level between 16 and 19%.

© IEA
Economic Freedom Index in Arab non-oil countries Economic Freedom Index in Arab non-oil countries as % World average in the last 30 years as % World average in the last 30 years
was effectively flat, was effectively flat, 11975975–200–2005.5.
Sources: Fraser Institute, 2007; IEA.
© IEA
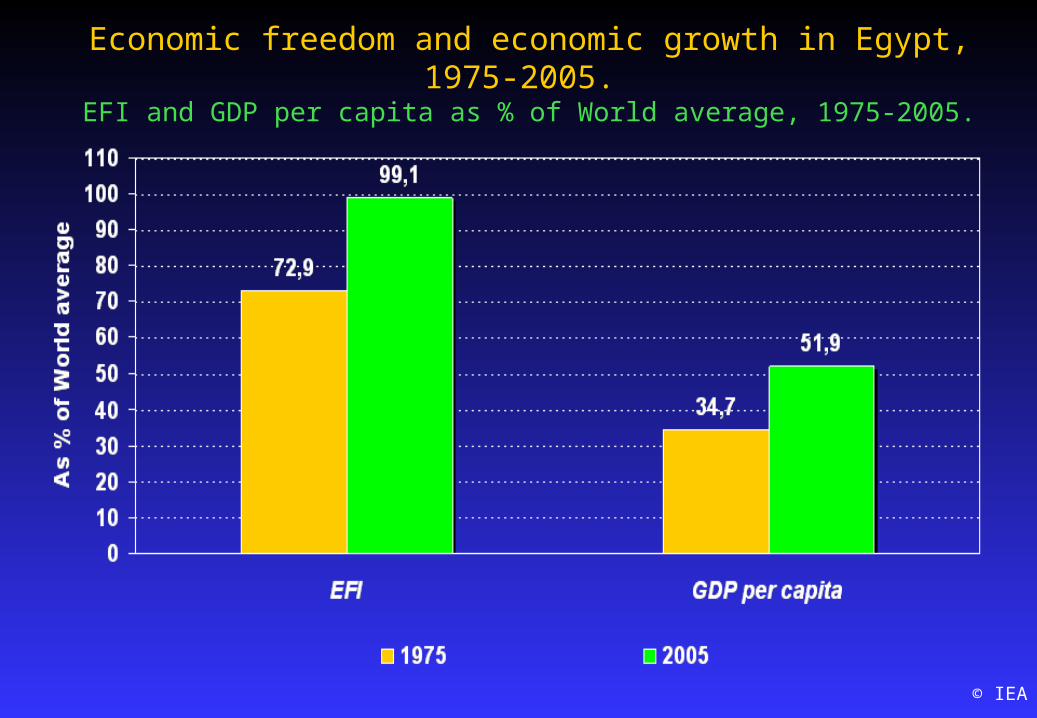
Economic freedom and economic growth in Egypt,1975-2005.
EFI and GDP per capita as % of World average, 1975-2005.

© IEA
Economic freedom and economic growth in Tunisia,1970-2005.
EFI and GDP per capita as % of World average, 1970-2005.
© IEA
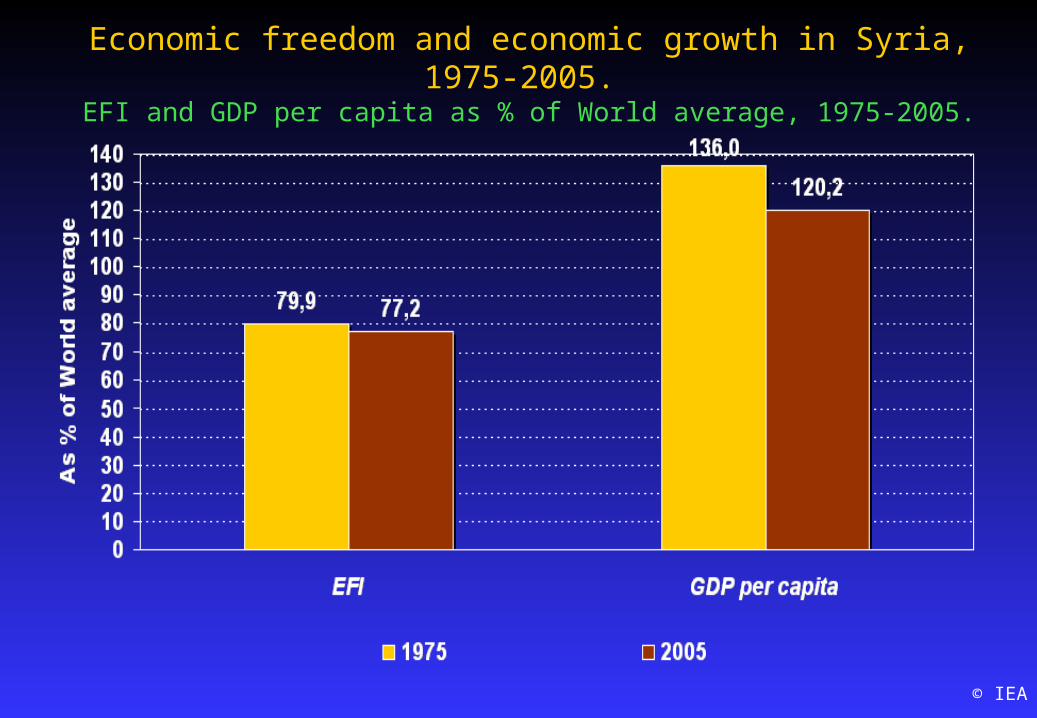
Economic freedom and economic growth in Syria,1975-2005.
EFI and GDP per capita as % of World average, 1975-2005.
© IEA
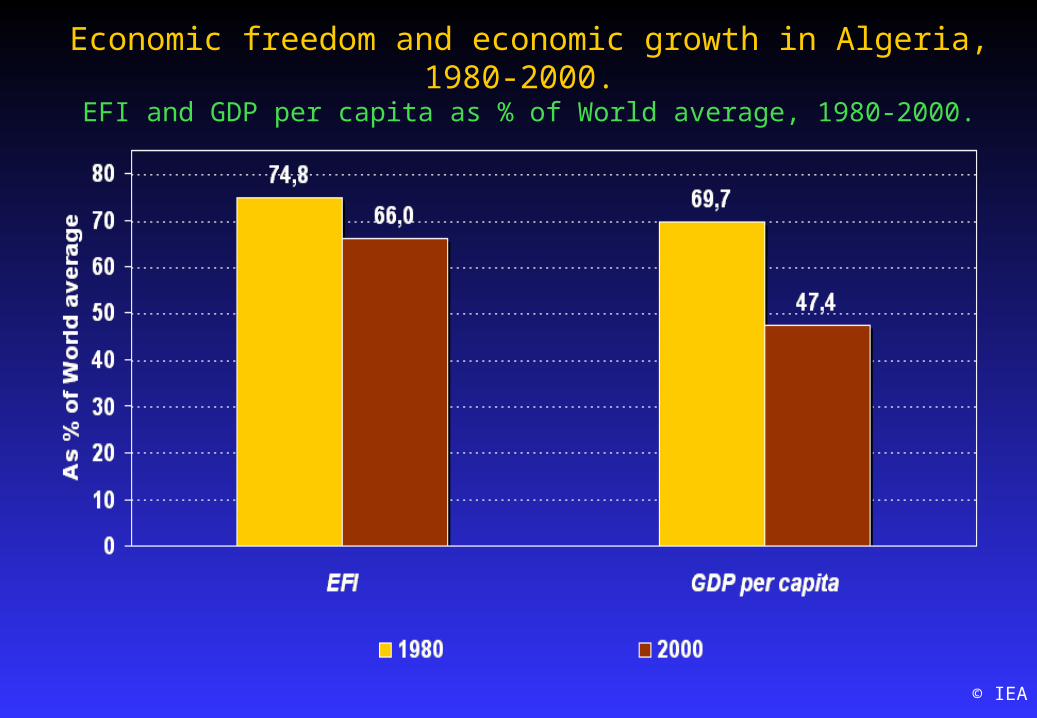
Economic freedom and economic growth in Algeria,1980-2000.
EFI and GDP per capita as % of World average, 1980-2000.
© IEA
What is to be blamed for economic stagnationin the Arab World?
Lagging behind in Economic Freedom and lack in its progress!
WHAT IS TO BE BLAMED WHAT IS TO BE BLAMED FOR ECONOMIC STAGNATIONFOR ECONOMIC STAGNATION
IN ARAB WORLD?IN ARAB WORLD?
A. IllarionovA. Illarionov,,
Cato Institute, Institute of Economic AnalysisCato Institute, Institute of Economic Analysis
2nd Economic Freedom of the Arab World Conference2nd Economic Freedom of the Arab World Conference
Dead SeaDead Sea, , Jordan, November 23, 2007Jordan, November 23, 2007
© © Cato InstituteCato Institute, , Institute of Economic AnalysisInstitute of Economic Analysis
www.cato.orgwww.cato.org, , www.cato.ruwww.cato.ru, , www.iea.ruwww.iea.ru