disciplinary differences in university lecture slides · lecture slides - a corpus-based and...
TRANSCRIPT
Disciplinary differences in university lecture slides
- A corpus-based and multimodal analysis
Zhi Li & Shayna LodgeParagon Tes�ng Enterprises, Inc.
Vancouver, Canada
CAAL/ACLA 2017, Toronto, ON
About Paragon

Study Context
• Lecture slides or PPTs as a multimodal semiotic system
• They can function
– as part of classroom discourse
– as standalone study materials
• Why study lecture slides?

Literature Review
• Previous studies on PPT slides– Effectiveness and design of lecture slides
(Apperson et al., 2008) – Visuals in conference slides (Rowley-
Jolivet, 2004)

Literature Review
• Studies on multimodality– Multimodal analysis of lecture slides (Zhao
& Van Leeuwen, 2014)– Systemic-Functional Linguistics (SFL)-based
analysis (Unsworth, 2006)
• Limited studies on lecture slides for their – linguistic features– visual-text relations– Possible differences in different disciplines

Research Questions
• What are the major linguistic and multimodal characteristics of the university lecture slides?
• Do these characteristics of the slides differ between two broad disciplines (Social Sciences vs. Engineering)?

The Corpus of PPT slides
Discipline N Average word count
Example subjects
Social Sciences 35 1152. (759.1) Sociology, History, Economics, Linguistics, Psychology …
Engineering 35 1446.7 (757.4) Mechanical Engineering, Electric Engineering, Computer Engineering, …
Sources of lecture PPT• Online search on university course websites• Requests from students and faculty members
Inclusion criteria• undergraduate courses in North American universities• non-orientation content• Inclusion of visuals

Linguistic Features
• Phrase-level complexity
– Verb phrases (VP)– Complex nominals (CN)– Coordinate phrases (CP)
L2 Syntactic Complexity Analyzer (L2SCA) Lu & Ai, 2015, http://aihaiyang.com/software/l2sca/

Linguistic Features
• Lexical complexity
– Lexical Density– Lexical Sophistication: lexical
sophistication, verb sophistication– Lexical Variation: Number of different
words (NDW) per 50-word sequences, Corrected type-token ratio (TTR), variation in specific word class (e.g., verb variation)
Lexical Complexity Analyzer (LCA) Lu, 2012, http://aihaiyang.com/software/lca/
Visual Features
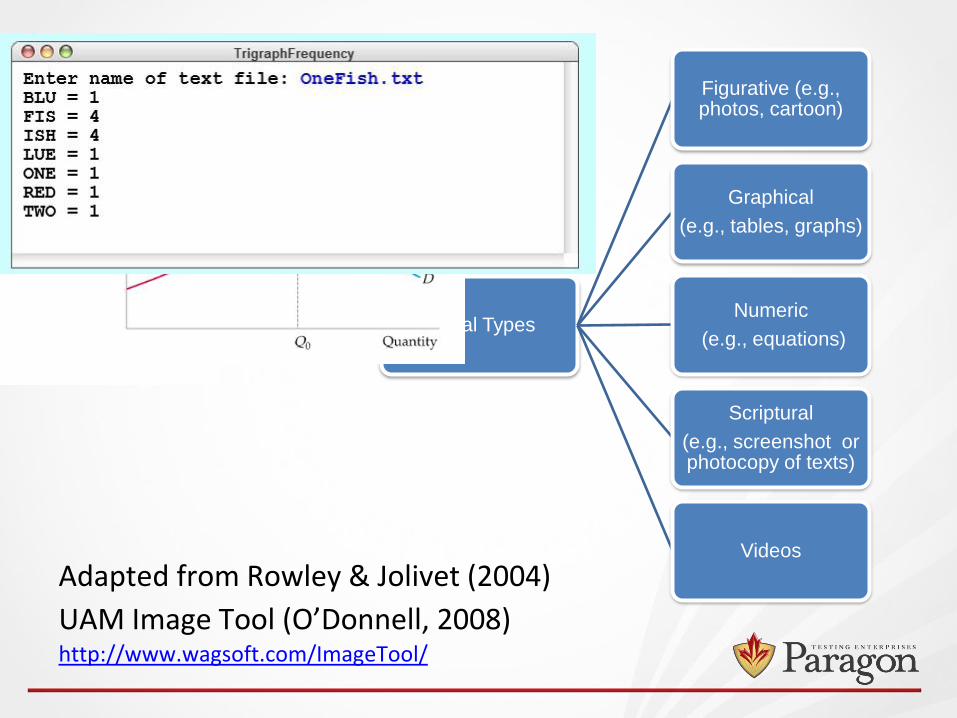
• Visual Types
Adapted from Rowley & Jolivet (2004)
UAM Image Tool (O’Donnell, 2008)http://www.wagsoft.com/ImageTool/
Visual Types
Figurative (e.g., photos, cartoon)
Graphical
(e.g., tables, graphs)
Numeric
(e.g., equations)
Scriptural
(e.g., screenshot or photocopy of texts)
Videos

Visual Features
• Visual-text Relation
– SFL-based
Adapted from Unsworth (2006)
Visual-Text Relation
Concurrence
Redundancy
Exposition
Instantiation
Complementarity
Augmentation
Divergence
Weak or No Relation
Decorative
Emotive
Detached

Data Preparation
• Lecture slides (PPT) txt files for corpus-based analysis
– Automatic calculation of complexity indices
• Lecture slides (PPT) Image files for multimodal analysis
– Manual annotation for visual type and visual-text relations using UAM Image Tool

Data Analysis
• Descriptive statistics
• Normality check
• Mann-Whitney U test (Social Sciences vs. Engineering)

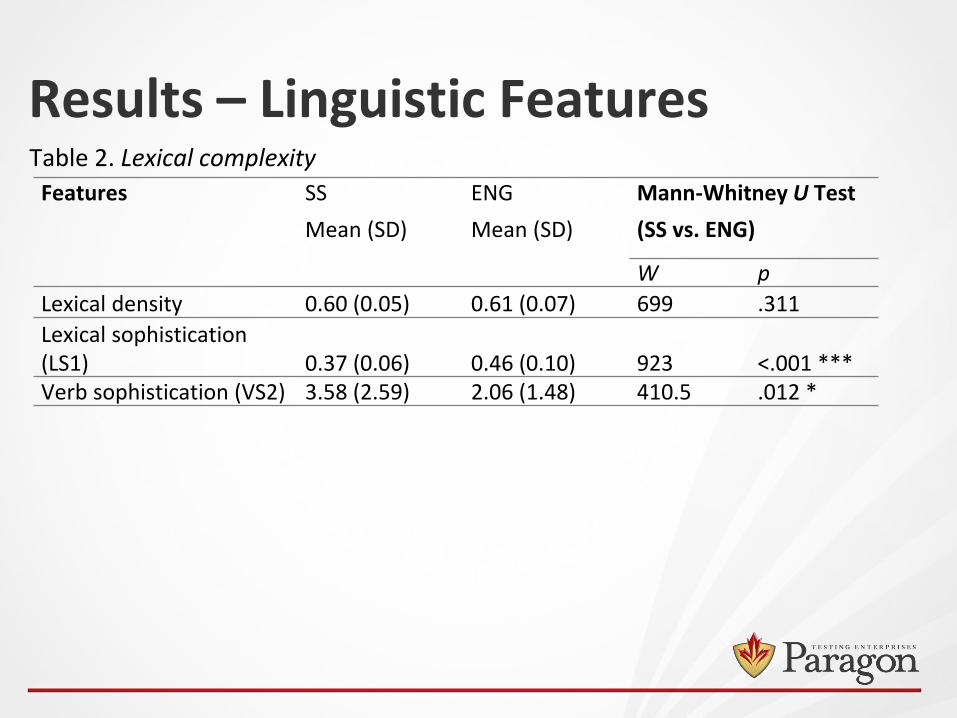
Results – Linguistic Features
Features SS
Mean (SD)
ENG
Mean (SD)
Mann-Whitney U Test
(SS vs. ENG)
W p
# of verb phrases 150.06 (88.64) 116.97 (859.09) 438 .041 *# of coordinate phrases 46.14 (33.15) 20.09 (13.89) 219.5 <.001***# of complex nominals 196.37 (107.7) 126.29 (98.97) 343.5 .002**
Table 2. Phrase-level complexity
Results – Linguistic Features
Features SS
Mean (SD)
ENG
Mean (SD)
Mann-Whitney U Test
(SS vs. ENG)
W p
Lexical density 0.60 (0.05) 0.61 (0.07) 699 .311
Lexical sophistication (LS1) 0.37 (0.06) 0.46 (0.10) 923 <.001 ***Verb sophistication (VS2) 3.58 (2.59) 2.06 (1.48) 410.5 .012 *
Table 2. Lexical complexity

Results – Linguistic Features
Features SS
Mean (SD)
ENG
Mean (SD)
Mann-Whitney U Test
(SS vs. ENG)
W p
# of different words (NDWESZ) 36.74 (2.98) 34.27 (3.17) 347.5 .002 **
Corrected type-token ratio 8.81 (1.60) 7.07 (1.63) 269.5 <.001 ***
Lexical word variation 0.60 (0.11) 0.54 (0.13) 413.5 .012 *
Verb variation (VV2) 0.09 (0.02) 0.07 (0.02) 303 <.001 ***
Noun variation 0.42 (0.11) 0.38 (0.10) 442 .046 *
Adjective variation 0.1 (0.02) 0.08 (0.03) 299.5 <.001 ***
Adverb variation 0.03 (0.01) 0.02 (0.01) 477.5 .097
Modifier variation 0.13 (0.03) 0.1 (0.03) 278 <.001 ***
Lexical variation
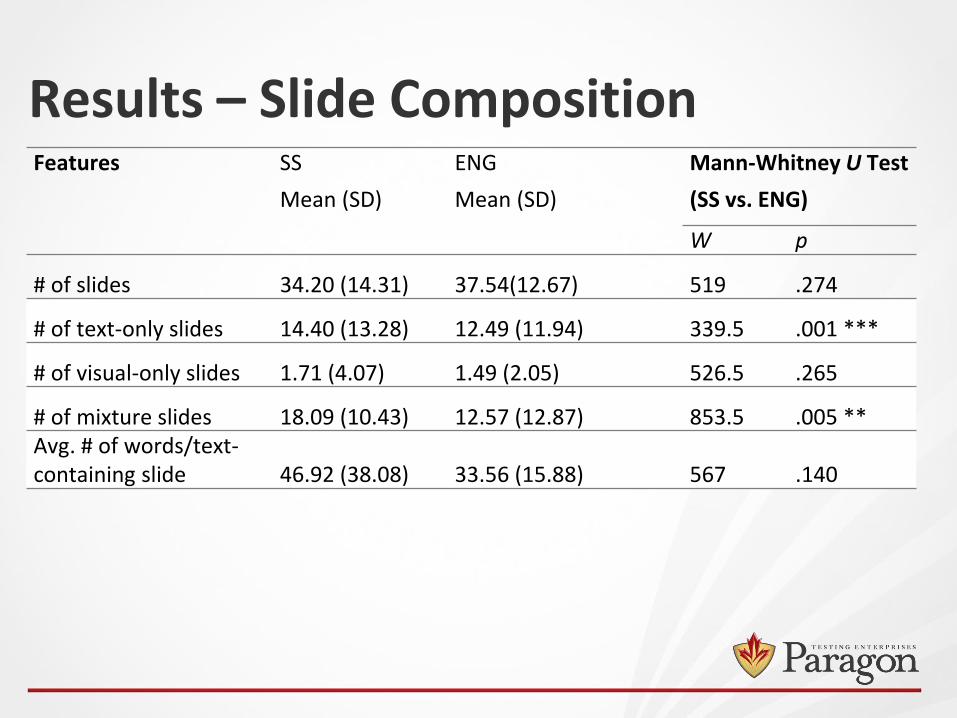
Results – Slide CompositionFeatures SS
Mean (SD)
ENG
Mean (SD)
Mann-Whitney U Test
(SS vs. ENG)
W p
# of slides 34.20 (14.31) 37.54(12.67) 519 .274
# of text-only slides 14.40 (13.28) 12.49 (11.94) 339.5 .001 ***
# of visual-only slides 1.71 (4.07) 1.49 (2.05) 526.5 .265
# of mixture slides 18.09 (10.43) 12.57 (12.87) 853.5 .005 **Avg. # of words/text-containing slide 46.92 (38.08) 33.56 (15.88) 567 .140

Results – Visual Features
Features SS
Mean (SD)
ENG
Mean (SD)
Mann-Whitney U Test
(SS vs. ENG)
W p
Avg. # of Figurative a 0.42 (0.45) 0.38 (0.41) 588 .776
Avg. # of Graphical 0.58 (0.33) 0.69 (0.37) 502.5 .197
Avg. # of Numerical 0.06 (0.19) 0.32 (0.45) 354.5 <.001 ***
Avg. # of Scriptural 0.04 (0.17) 0.05 (0.17) 550.5 .326Percent of visual-containing slides 0.36 (0.27) 0.61 (0.25) 273 <.001 ***Avg. # of visuals/ visual-containing slide 1.04 (0.38) 1.44 (0.44) 273.5 <.001 ***Avg. # of non-numerical visuals/visual-containing slide 1.01 (0.37) 1.13 (0.33) 494.5 .155
Visual types : Averages
a: per visual-containing slide
Results – Visual Features
Features SS
Mean (SD)
ENG
Mean (SD)
Mann-Whitney U Test
(SS vs. ENG)
W p
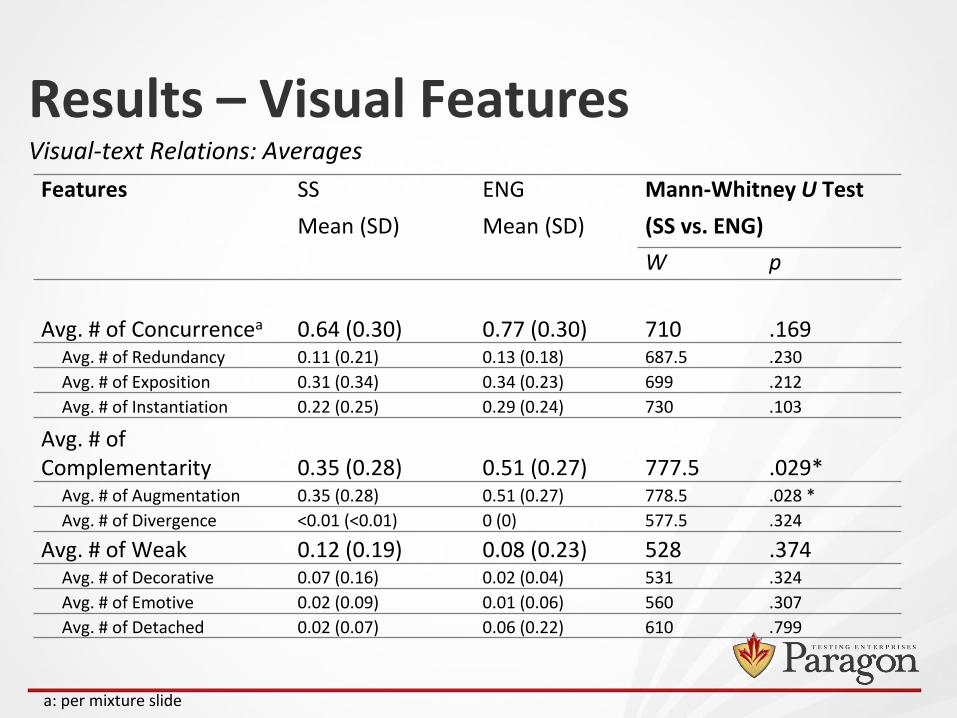
Avg. # of Concurrencea 0.64 (0.30) 0.77 (0.30) 710 .169Avg. # of Redundancy 0.11 (0.21) 0.13 (0.18) 687.5 .230
Avg. # of Exposition 0.31 (0.34) 0.34 (0.23) 699 .212
Avg. # of Instantiation 0.22 (0.25) 0.29 (0.24) 730 .103
Avg. # of Complementarity 0.35 (0.28) 0.51 (0.27) 777.5 .029*
Avg. # of Augmentation 0.35 (0.28) 0.51 (0.27) 778.5 .028 *
Avg. # of Divergence <0.01 (<0.01) 0 (0) 577.5 .324
Avg. # of Weak 0.12 (0.19) 0.08 (0.23) 528 .374Avg. # of Decorative 0.07 (0.16) 0.02 (0.04) 531 .324
Avg. # of Emotive 0.02 (0.09) 0.01 (0.06) 560 .307
Avg. # of Detached 0.02 (0.07) 0.06 (0.22) 610 .799
Visual-text Relations: Averages
a: per mixture slide

Results – Visual Features
Features SS ENG Mann-Whitney U Test
(SS vs. ENG)W p
Percentage a
Concurrence 0.61 (0.31) 0.57 (0.19) 646.5 .540% Redundancy 0.17 (0.27) 0.17 (0.23) 523.5 .477% Exposition 0.47 (0.40) 0.45 (0.30) 570 .931% Instantiation 0.37 (0.35) 0.37 (0.30) 550 .738
Percentage Complementarity 0.29 (0.24) 0.38 (0.17) 468.5 .130
% Augmentation 100 100 408 .258% Divergence 0 0 442 .258
Percentage Weak 0.10 (0.16) 0.05 (0.11) 666 .346% Decorative 0.56 (0.48) 0.45 (0.50) 114.5 .671% Emotive 0.16 (0.36) 0.07 (0.27) 118 .362% Detached 0.28 (0.42) 0.47 (0.50) 87.5 .410
Visual-text Relations : Percentages
a : of total occurrences

Results – Summary
Feature categories # of features investigated
# of distinctive features
Areas of distinction
Syntactic 3 3 VP, CP, CN
Lexical 25 19 Lexical sophistication, lexical variation
General Slide Composition 10 7 # of text-only and mixture slides, percentage of visual-containing slides, # of visuals and words, avg. visuals/slide
Visual type 10 4 # of graphical and numerical
Visual-text relation 33 8 # & Avg. of concurrence and complementarity
Summary of the significant differences between the two broad disciplines

Conclusions
• Differences observed in the linguistic features such as phrase structures and lexical features
• Differences in slide compositions; however, there are no differences in the average number of words and non-numerical visuals
• Similarities in their preference of graphical visuals, followed by figurative visuals; as well as concurrence relations, followed by complementarity relations

Implications
• For EAP pedagogy
• For EAP assessment
Questions & [email protected]
Disciplinary differences in university lecture
slides as a part of classroom discourse
- findings from corpus-based analysis and
multimodal analysis
Special thanks to Johnathan Jones

Selected References• Apperson, J. M., Laws, E. L., & Scepansky, J. A. (2008). An assessment of student preferences for
PowerPoint presentation structure in undergraduate courses. Computers & Education, 50(1), 148–153.
Kress, G., & Van Leeuwen, T. (1996). Reading images: The grammar of visual design. Psychology Press.
• Lim, F. V., & O’Halloran, K. L. (2012). The ideal teacher: An analysis of a teacher-recruitment advertisement.
Semiotica, 1891412, 229–253.
• Lu, X. (2012). The relationship of lexical richness to the quality of ESL Learners’ oral narratives. The Modern
Language Journal, 96(2), 190–208.
• Lu, X., & Ai, H. (2015). Syntactic complexity in college-level English writing: Differences among writers with
diverse L1 backgrounds. Journal of Second Language Writing, 29, 16–27.
• O’Donnell, M. (2008). Demonstration of the UAM CorpusTool for text and image annotation. In Proceedings
of the 46th annual meeting of the Association for computational linguistics on human language technologies:
Demo session (pp. 13–16). Association for Computational Linguistics.
• Royce, T. (2002). Multimodality in the TESOL classroom: Exploring visual-verbal synergy. TESOL Quarterly,
36(2), 191.
• Rowley-Jolivet, E. (2004). Different Visions, Different Visuals: a Social Semiotic Analysis of Field-Specific
Visual Composition in Scientific Conference Presentations. Visual Communication, 3(2), 145–175.
• Thompson, P. (2006). A corpus perspective on the lexis of lectures, with a focus on economics lectures. In K.
Hyland & M. Bondi (Eds.), Academic Discourse Across Disciplines (pp. 253–270). Bern, Switzerland: Peter
Lang.
• Unsworth, L. (2006). Towards a metalanguage for multiliteracies education: Describing the meaning- making
resources of language-image interaction. English Teaching: Practice and Critique, 5(1), 55–76.
• Zhao, S., & van Leeuwen, T. (2014). Understanding semiotic technology in university classrooms: A social
semiotic approach to PowerPoint-assisted cultural studies lectures. Classroom Discourse, 5(1), 71–90.