discovery and characterization of the first low-peaked and
TRANSCRIPT

1
Discovery and Characterization
of the first Low-Peaked and Intermediate-
Peaked BL Lacertae Objects
in the Very High Energy -Ray Regime
Dissertation zur Erlangung
des naturwissenschaftlichen Doktorgrades
der Bayerischen Julius-Maximilian-Universität Würzburg
Karsten Berger
aus
Köthen – Anhalt
Würzburg 2009

2
3
Summary
20 years after the discovery of the Crab Nebula as a source of very high energy -rays,
the number of sources newly discovered above 100 GeV using ground-based Cherenkov
telescopes has considerably grown, at the time of writing of this thesis to a total of 81. The
sources are of different types, including galactic sources such as supernova remnants,
pulsars, binary systems, or so-far unidentified accelerators and extragalactic sources such as
blazars and radio galaxies.
The goal of this thesis work was to search for -ray emission from a particular type of
blazars previously undetected at very high -ray energies, by using the MAGIC telescope.
Those blazars previously detected were all of the same type, the so-called high-peaked BL
Lacertae objects. The sources emit purely non-thermal emission, and exhibit a peak in their
radio-to-X-ray spectral energy distribution at X-ray energies. The entire blazar population
extends from these rare, low-luminosity BL Lacertae objects with peaks at X-ray energies to
the much more numerous, high-luminosity infrared-peaked radio quasars. Indeed, the low-
peaked sources dominate the source counts obtained from space-borne observations at -
ray energies up to 10 GeV. Their spectra observed at lower -ray energies show power-law
extensions to higher energies, although theoretical models suggest them to turn over at
energies below 100 GeV. This opened the quest for MAGIC as the Cherenkov telescope with
the currently lowest energy threshold.
In the framework of this thesis, the search was focused on the prominent sources BL
Lac, W Comae and S5 0716+714, respectively. Two of the sources were unambiguously
discovered at very high energy -rays with the MAGIC telescope, based on the analysis of a
total of about 150 hours worth of data collected between 2005 and 2008. The analysis of
this very large data set required novel techniques for treating the effects of twilight
conditions on the data quality. This was successfully achieved and resulted in a vastly
improved performance of the MAGIC telescope in monitoring campaigns.
The detections of low-peaked and intermediate-peaked BL Lac objects are in line with
theoretical expectations, but push the models based on electron shock acceleration and
inverse-Compton cooling to their limits. The short variability time scales of the order of one
day observed at very high energies show that the -rays originate rather close to the
putative supermassive black holes in the centers of blazars, corresponding to less than 1000
Schwarzschild radii when taking into account relativistic bulk motion.

4

5
Zusammenfassung
20 Jahre nachdem zum ersten Mal hoch energetische -Strahlung aus der Richtung
des Krabbennebels detektiert wurde, ist die Zahl der mit erdgebundenen Tscherenkow
Teleskopen neu entdeckten Quellen oberhalb von 100 GeV erheblich gestiegen, auf
insgesamt 81, zum derzeitigen Stand dieser Arbeit. Die Quellen haben unterschiedliche
Ursprünge, die von galaktischen Objekten, wie z.B. Supernova Überresten, Pulsaren,
Doppelsystemen zu bisher nicht identifizierten Objekten und extragalaktischen Objekten wie
Blazaren und Radio Galaxien reicht.
Das Ziel dieser Arbeit war es nach -Strahlung von einer bestimmten Art von Blazaren
zu suchen, die bisher nicht im Hochenergie Bereich detektiert werden konnten. Für die
Suche werden die Daten des MAGIC Teleskops auf La Palma verwendet, welches das
weltweit größte Teleskop seiner Art ist.
Alle bisher entdeckten Blazare waren vom gleichen Typ, der sogenannten Klasse der
“high-peaked BL Lacertae”. Diese Quellen emittieren nicht thermische Strahlung und zeigen
ein Maximum in der Radio-zu-Röntgen Spektralverteilung bei Röntgenenergien. Die gesamte
Blazar Population reicht von diesen seltenen BL Lacertae Objekten mit niedriger Leuchtkraft
und einem Maximum im Röntgenbereich hin zu den sehr viel zahlreicheren Radio Quasaren
mit hoher Leuchtkraft, deren Maximum der Spektralen Energieverteilung im Infrarotbereich
liegt. Tatsächlich dominieren diese “low-peaked” Quellen die Populationsstudien von
satellitengestützten Gammabeobachtungen im Energiebereich bis zu 10 GeV. Ihre Spektren
im niederenergetischen Gammabereich lassen sich exponentiell bis zu höheren Energien
extrapolieren, ohne dass ein Abbruch erkennbar ist, obwohl theoretische Modelle einen
Wendepunkt unterhalb von 100 GeV erwarten. Darauf begründet wurden Beobachtungen
mit dem MAGIC Tscherenkow Teleskop durchgeführt, welches die derzeit niedrigste
Energieschwelle besitzt.
Im Rahmen dieser Arbeit konzentrierte sich die Suche auf die bekannten Quellen BL
Lac, W Comae und S5 0716+714. Zwei von diesen Quellen wurden eindeutig im
Hochenergetischen Gammabereich mit dem MAGIC Teleskop entdeckt, basierend auf
insgesamt etwa 150 Stunden an Daten, die zwischen 2005 und 2008 gesammelt wurden. Die
Analyse dieses sehr großen Datensatzes benötigte neue Techniken um die Effekte von
Beobachtungen unter Dämmerungsbedingungen auf die Datenqualität untersuchen zu
können. Die erfolgreiche Anwendung sorgte für eine gewaltige Erweiterung der Performanz
des MAGIC Teleskops während Überwachungskampagnen.

6
Die Detektionen der sogenannten “low-peaked” und “intermediate-peaked” Objekte
liegt im Rahmen der theoretischen Erwartungen, jedoch werden Modelle, die auf der
Schockbeschleunigung von Elektronen und die Kühlung durch den umgekehrten Compton
Prozess basieren an ihre Grenzen gebracht. Die beobachtete Kurzzeitvariabilität im
hochenergetischen Gammabereich beträgt etwa einen Tag, was zeigt, dass die
Gammastrahlung relativ nah am vermuteten Supermassiven Schwarzen Loch entsteht,
weniger als 1000 Schwarzschild Radien entfernt, wenn man die Bewegung mit
relativistischen Geschwindigkeiten berücksichtigt.

7
Table of Contents
Summary ............................................................................................................................. 3
Zusammenfassung .............................................................................................................. 5
1. Introduction to Very High Energy Astrophysics ............................................................. 11
1.1. Detection of very high energy gamma rays with Cherenkov telescopes ..................... 11
1.1.1. The Cherenkov Effect .............................................................................................. 11
1.1.2. Air shower development ........................................................................................ 14
1.1.3. The MAGIC telescope as an example of Imaging Atmospheric Cherenkov
Telescopes ......................................................................................................................... 17
1.1.3.1. Telescope layout .............................................................................................. 18
1.1.3.2. Electronic chain ................................................................................................ 21
1.1.3.3. Image cleaning ................................................................................................. 23
1.1.3.4. Image parameterization ................................................................................... 24
1.1.3.5. Energy estimation and calculation of energy spectra ...................................... 30
1.2. An unexpected wealth of sources ................................................................................. 33
1.3. The Crab Nebula as a standard candle .......................................................................... 37
1.4. Extragalactic sources ..................................................................................................... 41
1.4.1. Low peaked BL Lacertae objects ............................................................................. 44
2. Goals of this thesis ....................................................................................................... 45
2.1. Selected IBL/LBL objects ................................................................................................ 49
2.1.1. BL Lacertae .............................................................................................................. 49
2.1.2. W Comae ................................................................................................................. 53
2.1.3. S5 0716+714............................................................................................................ 54
2.2. Twilight observations with the MAGIC telescope ......................................................... 55
2.2.1. General considerations for twilight observations .................................................. 55
2.2.2. Twilight observations of the Crab Nebula .............................................................. 56

8
2.2.3. Introduction of twilight observations into the standard MAGIC observation
schedule ............................................................................................................................ 61
2.2.4. Extension of the MAGIC observation time during strong moon light illumination
.......................................................................................................................................... 63
2.2.5. Summary ................................................................................................................. 64
2.3. Cut optimization ............................................................................................................ 67
3. Observations of low-peaked and intermediate-peaked BL Lacertae objects .................. 69
3.1. BL Lacertae ..................................................................................................................... 69
3.1.1. MAGIC observations of BL Lacertae in 2005 .......................................................... 69
3.1.2. MAGIC observations of BL Lac in 2006 and 2007 ................................................... 75
3.1.3. MAGIC observations during a large scale multiwavelength campaign on BL Lac in
2008 .................................................................................................................................. 77
3.1.4. Optical R-band observations using the KVA and Tuorla telescopes simultaneous to
the MAGIC observations ................................................................................................... 79
3.1.5. Summary ................................................................................................................. 81
3.2. W Comae........................................................................................................................ 83
3.2.1. MAGIC observations of W Comae .......................................................................... 83
3.2.2. VERITAS and AGILE observations of W Comae ....................................................... 85
3.2.3. Summary ................................................................................................................. 87
3.3. S5 0716+714 .................................................................................................................. 89
3.3.1. MAGIC observations in the VHE -ray energy range .............................................. 89
3.3.2. Summary ................................................................................................................. 92
4. Results ......................................................................................................................... 93
4.1. Interpretation of the detection of BL Lac in VHE -rays ................................................ 93
4.2. Modeling of the VHE -ray emission of W Comae ......................................................... 97
4.3. Discussion of the detection of S5 0716 in the VHE -ray regime .................................. 99
4.4. Summary and comparison of the detected LBL/IBL objects with known extragalactic
VHE -ray emitters .............................................................................................................. 103

9
5. Conclusion and outlook .............................................................................................. 109
6. Appendix ................................................................................................................... 113
List of Figures ................................................................................................................. 119
List of Tables .................................................................................................................. 125
Abbreviations ................................................................................................................ 127
References ..................................................................................................................... 129
Publication List .............................................................................................................. 139
Acknowledgements ....................................................................................................... 145

10

11
1. Introduction to Very High Energy
Astrophysics
1.1. Detection of very high energy gamma
rays with Cherenkov telescopes
1.1.1. The Cherenkov Effect
Special Relativity postulates that the speed of light in vacuum is an energy
independent constant that no particle can exceed. In a medium however this speed is
diminished by the refractive index:
n
cvl (1)
Energetic particles can thus move faster than light inside this medium. If they are
charged they induce polarisations in the electron shells of dielectric media, which will start
to emit light along the trajectory of the particle. As long as the particle is moving with light
speed or slower the light waves of neighbouring atoms can interfere with each other and
annihilate. However as soon as the particle is faster than light in the medium the resulting
wave front will not annihilate and form a light cone in the direction of the trajectory of the
particle (figure 1). This effect has been discovered by Pavel Alekseyevich Cherenkov in 1934
[1] and is called “Cherenkov Effect” in honour of his work. Cosmic rays are highly relativistic
and can thus produce Cherenkov light that can be detected from the ground.
Following figure 1 the Cherenkov angle c can be calculated:
)(
1)(cos
ntv
tn
c
C ; c
v (2)
The maximum Cherenkov angle can be calculated by assuming the maximum speed
of the particle (light speed) and the highest refractive index (n=1.00029 at sea level):

12
38.1max (3)
Since Cherenkov light from cosmic rays is typically emitted at a height of 10km and
below (depending on the energy of the primary particle) the angle corresponds to a light
cone of approximately 120m on the ground. The spectrum of the Cherenkov light peaks
around 330nm due to absorption by ozone in the atmosphere below 300nm [2]:
dnch
Ze
dx
dN
n
2
)(
2
222
)(
11
4 (4)

13
Figure 1: Schematic illustration of the Cherenkov Effect. Following the Huygens Principle
Cherenkov light can be described by the superposition of the elementary waves that the particle
emits from every point along its trajectory. The resulting wave front has a cone shape.

14
1.1.2. Air shower development
When the cosmic ray particles hit the earth’s atmosphere the interaction with the
atmospheric molecules produces secondary particles. These secondary particles interact
again with the atmosphere and produce a cascade of particles, a so called “air shower”.
The energy of the primary particle is distributed over the entire shower, which
reaches its maximum when the secondary particles do not have sufficient energy to produce
additional particles. At this moment energy losses due to ionisation become dominant and
the shower dies out. The shower geometry is depending strongly on the primary particle
(figure 2), since it defines the possible interactions with the atmosphere.
Photons can interact with the electrostatic field of the atomic nuclei and produce
electron positron pairs. These electrons and positrons produce two photons via
bremsstrahlung in the Coulombfield of the nuclei after travelling through the mean free path
l. The photons can again produce electron positron pairs and accordingly the cascade is
formed. Once the critical energy of 83MeV [3] is reached the ionisation losses for the
electrons and positrons become dominant, reducing the pair creation and the shower begins
to die out. Some of the secondary particles move faster than the speed of light in the
medium and are thus producing Cherenkov light. The sum of this light can be recorded by
Imaging Atmospheric Cherenkov Telescopes from ground. The photon induced air shower
has a very compact structure that resembles that of a drop. This is due to a low transversal
momentum transfer to the secondary particles and stands in contrast to hadron induced
showers. It should be noted that only 0.1% of the energy of the primary particle is
transformed into Cherenkov light and only primary photons with energies above 5GeV will
produce enough secondary particles for the detection with ground based observatories.
When a high energy proton or ion hits the atmosphere the interaction with the
atmospheric nuclei produces mainly pions (90%), K-mesons and antiprotons. The transversal
momentum of these particles is nearly energy independent at about 0.3GeV/c [3]. The
secondary particles can continue with the hadronic interactions until their energy is below
the required limit for the production of neutral pions of about 1GeV.
The hadron induced air shower can be separated into three sub showers:
electromagnetic, hadronic and muonic. The electromagnetic sub shower is produced by
neutral pions that decay into two photons. These photons interact with the atmosphere in
the same way as primary cosmic ray photons. Showers from neutral pions can thus not be
differentiated from photon induced showers. This is a serious problem for low energy
(E<100GeV) -ray observations with ground based observatories [4].

15
Charged pions have a relatively long life time in the order of 10-8s which allows them
to enter deeper into the atmosphere and interact again with nuclei. Muons and neutrinos
with their respective anti-particles are produced from various decays of the charged pions
and K-mesons:
(5)
(6)
K (7)
0K (8)
Due to the larger transversal momentum of the sub showers the hadron induced air
shower has a larger horizontal extension as a photon shower. Figure 2 shows a direct
comparison of a photon and a proton induced shower with the same primary energy of 100
GeV. Several sub showers are clearly visible in the proton induced shower, while the photon
shower is very homogeneous. This difference can be used in Cherenkov telescopes to
suppress the proton induced showers. Since the detector is usually not positioned directly
below the air shower (as shown in figure 2), the detected images resemble a cut through the
shower. This means for instance that a -ray shower will not be circular but rather elliptical
in shape.
Another possibility to detect cosmic ray particles via Cherenkov light is the detection
of so called “direct Cherenkov light” from the primary particles itself. Photons cannot
produce direct Cherenkov light, since they do not possess a charge. However charged cosmic
rays, especially ionized nuclei, can produce detectable light emission. An example can be
found in [5].
It should be mentioned that cosmic rays can also be detected by other methods. The
secondary particles of the cascade can for instance be detected by scintillators on ground or
fluorescence telescopes. Among many experiments the AUGER South experiment uses this
technique [6].

16
Figure 2: Cherenkov light density on the ground (x and y coordinates are given in m). Top: 100 GeV
gamma-ray primary particle, bottom: 100 GeV proton primary. The colour scale denotes the
number of Cherenkov photons. Only 5% of the Cherenkov photons are shown. The detector is
positioned directly at the centre of the coordinate system. While the gamma-ray shower shows a
very uniform light pool on the ground, the proton shower is fragmented into subshowers. Thanks
to Dorota Sobczynska for the simulations.

17
1.1.3. The MAGIC telescope as an example of
Imaging Atmospheric Cherenkov Telescopes
Currently four major installations of the IACT technique exist: Cangaroo
(Collaboration of Australia and Nippon (Japan) for a Gamma Ray Observatory in the Outback)
telescopes in Australia, H.E.S.S. (High Energy Stereoscopic System) in Namibia, VERITAS (Very
Energetic Radiation Imaging Telescope Array System) in Arizona and MAGIC (Major
Atmospheric Gamma-Ray Imaging Cherenkov) telescope in the Canary Islands. The following
description of the working principle of an IACT uses the MAGIC telescope (figure 3) as an
example [7], [8].
Figure 3: The MAGIC telescope on the canary island of La Palma at the Roque de los Muchachos.
The site is about 2200 m above sea level. The green structure on the left is the camera access
tower. The position of the camera and the reflector dish are highlighted in the figure.

18
1.1.3.1. Telescope layout
The IACT technique is currently the most successful detection method for the ultra
short Cherenkov light pulses. It uses Photon Multiplier Tubes (PMTs) and a large reflector
surface that focuses the Cherenkov light into the camera plane, where the PMTs are
mounted (figure 3). As can be seen in figure 4, the small opening angle of the Cherenkov
light emission leads to a light pool of 120m on the ground level. The total collection area
amounts to 104 m2, since the height of the shower maximum is situated at 10 km above sea
level.
The MAGIC telescope is built of a light weight design to ensure fast movements. This
is required to detect short gamma ray flashes expected from GRBs. The reflector is made of
diamond polished aluminium segments [9]. 236 of these panels form the parabolic mirror
surface. A parabolic mirror is required to study to arrival time information of the Cherenkov
air showers. An automatic mirror control (AMC) is used to adapt the reflector surface such,
that it always focuses the light towards the camera. The frame of the telescope consists of
carbon fibre epoxy tubes with aluminium joints. The total weight of the telescope amounts
to about 60 tons. With a reflector diameter of 17 m it is currently the largest operating
Cherenkov telescope in the world. The camera consists of 577 hemispherical PMTs in a
hexagonal order [8]. Each PMT is equipped with hexagonal Winston Cones in order to
maximize the light collection and the double crossing. While the inner part of the camera
uses smaller (1 inch diameter) PMTs, the outer ring consists of larger PMTs (1.5 inch
diameter). The different sizes have been chosen in order to minimize the costs of the PMTs.
Small pixels are mostly needed for small showers, which will automatically only be detected
within close proximity to the telescope. Due to the geometry of the detection these showers
will be close to the camera centre. The larger the showers are the more distant to the
camera centre they will be. Thus larger pixels in the outer ring of the camera will not
decrease the detection and characterization of the showers much. Note that this applies
only if the -ray source is observed in the centre of the camera. The total FOV of the camera
is about 3.6°.
It should be noted that the acceptance of the PMTs is not perfect for the Cherenkov
spectrum since the peak quantum efficiency (QE) is reached at wave lengths above 400 nm.
Currently used PMTs reach a peak QE of about 30%. Tests have begun to use Hybrid
Photodiodes (HPDs) and Avalanche Photodiodes for the detection of Cherenkov light. First
test results promise an increase in Cherenkov light yield by up to a factor of three [10].
Another way to increase the QE is a special coating on the PMT surface window [11]. Every
increase in QE is effectively enlarging the light collection area of the telescope. Since the

19
reflector surface cannot be built indefinitely large (due to money constraints, weight and
size) this is an important way to lower the threshold of the telescope and increase sensitivity
for far away showers.
The PMT amplifies the signal by creating electron cascades. Since the signal transport
via optical fibres is preferred (no electromagnetic interference, no distortion of the ultra fast
light pulses and less weight) the current has to be converted into light. This is done via
Vertical Cavity Surface Emitting Lasers (VCSELs). Within the receiver board the signal is split
into the high gain, the low gain and a signal path to the major trigger logic.

20
Figure 4: Detection principle of an IACT. Following the result of equation 3 the Cherenkov angle is
in the order of one degree. However since the maximum of a -ray induced air shower is situated
at a height of approximately 8 km (assuming a ground level of 2 km) the covered effective area of
the telescope amounts to 104m2 at zenith.

21
1.1.3.2. Electronic chain
The trigger consists of several levels: Level 0 allows the adjustment of the
discriminator levels for each pixel from a remote PC. This is important since the level of the
Night Sky Background (NSB) is different for extragalactic and galactic as well as moon and
twilight observations. If stars are in the FOV the discriminator thresholds have to be
increased for those pixels that are affected by the star light (otherwise they would cause
accidental triggers). The individual pixel rate can be monitored and adjusted during the
observations using the Individual Pixel Rate Control (IPRC).
The Level 1 trigger uses the coincidence of a signal in several pixels to discard
Cherenkov light from NSB: The light of Cherenkov showers is extending to several
neighbouring pixels, while the NSB is randomly affecting one or two pixels. For this work all
data have been taken with a trigger pattern requiring four neighbouring pixels (“4NN
trigger”) above the threshold set by the Level 0 trigger.
For the high and the low gain the Cherenkov light pulse is stretched to 6 ns mean half
maximum width. The high gain is then amplified by a factor of 10 and the low gain signal is
delayed by 50 ns. Using this method a higher dynamic range can be achieved. A 300 Mhz
FADC continuously digitizes the analogue signal and sends it to the ring buffer which is read
out only if the trigger condition (4NN) is fulfilled. Finally the data are stored to hard disk and
transferred from La Palma to the data centers in Wuerzburg and Barcelona for further
analyses.
In February 2007 a new FADC system has been installed. The goal was to achieve a
better timing resolution of the ultra short Cherenkov light flashes. Since faster FADC boards
are expensive and have high power consumption the new system uses a multiplex solution.
16 channels are read out by the same 2 Ghz FADC channel. Every channel is delayed via
optical fibres by 40 ns with respect to the other channels so that the 16 channels can be read
out one after another. The required time to digitize all 16 channels is thus 640 ns which
correspond to a dead time of approximately 1% for a trigger rate of 1 khz, the maximum
trigger rate achieved by the MAGIC telescope. Since the new FADCs have a wider dynamic
range no high gain is needed. Also the stretching of the Cherenkov light pulse to 6 ns is not
required anymore.
Unfortunately optical splitters had to be introduced in order to split the signal
between the new FADCs and the trigger logic. This reduced the light yield in the trigger logic
by 50% and the thresholds had to be adjusted accordingly.

22
In addition to the trigger logic for cosmic (Air shower induced) events pulse
generators allow to take pedestal events and calibration events. Pedestal events are
artificially triggered such, that no Cherenkov air shower image is recorded in the camera.
These images are needed to determine the noise (intrinsic and electronic) and the baseline
of the data acquisition system. Calibration events trigger dedicated light flashes into the
camera that are used to determine the electronic gain of the system. A PIN diode measures
the light output of the calibration light flashes and a so called “Blind pixel” (a standard PMT
with a filter) allows to count single photoelectrons and determine the absolute intensity of
the calibration flashes [12].

23
1.1.3.3. Image cleaning
Finally the calibrated and pedestal subtracted image has to be cleaned from pixels
that do not belong to the shower. These pixels can have a signal due to light from the Night
Sky Background or an afterpulse from a PMT. The usual cleaning method consists of two
steps: first pixels above the core threshold (in this work 6 phe) that have at least one
neighbour above this threshold are identified. In the second step the boundary pixels of the
core pixels which fulfil a second threshold condition (here: 3 phe) are included in the image.
All other pixels that do not fulfil this condition are deleted. Lowering the thresholds of the
cleaning also lowers the analysis threshold, since only showers with more than 5 pixels are
used for further analysis. Unfortunately it also increases the probability to include noisy
pixels in the shower image which worsens the image quality. To avoid this effect the MAGIC
collaboration uses the arrival time information of each pixel. Cherenkov flashes are
concentrated in a very short (ns) time interval, while the NSB photons arrive at random
times. Accordingly a signal in a core pixel is required to arrive within 1.5 ns of the mean
arrival time of all core pixels. Similarly signals in boundary pixels have to arrive within 4.5 ns
after the arrival time of their neighbouring core pixels. These values have been optimized on
Monte Carlo simulations and real data observations [13]. A more detailed discussion on the
time image cleaning with a comparison to the old cleaning method can be found in [14]. It
should be noted that these values have been optimized for dark night observations. During
moon and twilight the amount of background light increases and thus higher thresholds of
the signal amplitude are required. However studies with moon light [15] and under twilight
conditions (this work) indicate that a moderate increase in background light can still be
compensated with the standard thresholds and time constraints without any sensitivity loss
above the current analysis threshold.
Data taken in 2005 has been analyzed without the usage of the shower timing. In that
case the image cleaning does not include a time constraint for the core and boundary pixels.
Instead the cleaning threshold is raised to 8.5 phe (core pixel) and 4.0 phe (boundary pixel).

24
1.1.3.4. Image parameterization
In order to distinguish -ray induced air showers from the much more frequent
background showers the camera image is parameterized into its shape and direction. This
method has first been introduced by A., M. Hillas and the parameters are called Image
Parameters or “Hillas Paramters” [16], [17]. Figure 5 illustrates how these parameters are
calculated. The main image parameters that have been used in this work are:
Alpha (α): Angle between Dist and Length. It denotes the orientation of the
shower. More specifically it is 0° if the shower points towards the source
position in the camera. Due to this effect it is generally used to show an
excess of -ray events over the isotropically distributed background.
Distance (Dist): Corresponds to the angle between the optical axis of the
telescope and the line between the shower core and the position of the
telescope. Transferred to the camera plane it is the angular distance between
the shower core position and the source position in the camera.
Width: RMS of the shower image amplitude along the minor axis.
Length: RMS of the shower image amplitude along the major axis.
Area: Multiplication of Width times Length times pi.
Size: Sum of the amplitude of all pixels that belong to the shower image.
Concentration: Ratio between a subset of pixels relative to the entire
shower. Most commonly used are the two pixels with the highest signal or the
pixels from the reconstructed centre of gravity of the shower.
Leakage: Showers that are located in the outer part of the camera can be
truncated. This image parameter describes the fraction of the shower that lies
within the last row of camera pixels.
Time Gradient: measures how fast the arrival time changes along the major
image axis [14]. Pixel coordinates are projected to the major axis in order to
reduce the problem to one dimension. The Time Gradient is the slope of the
linear fit of the arrival time versus the space coordinate. The sign is defined
such that a shower that is moving away from the position of the source in the

25
camera has a positive time gradient, otherwise it is negative. It is thus
depending on the position of the source in the camera.
M3Long: Standard deviation of the image amplitude along the major axis of
the shower.
Islands: Number of isolated pixel groups plus the main shower. This is a
measure of the fragmentation of the shower image.
Figure 5: Illustrative demonstration of the calculation of four important Hillas Image Parameters in
a MAGIC-like camera: Alpha (a measure for the shower orientation), Dist (which is related to the
distance of the shower core to the telescope), Width and Length (both are characterizing the shape
of the shower and can be used to discriminate between Hadron and Photon induced showers).
More details on the calculation of the individual parameters can be found in the text.
In a stereo system the intersection of the major axes from both shower images can
be used to reconstruct the position of the shower core relative to the telescope array and
thus also the direction of the shower image. The distance between the reconstructed
shower position in the camera plane and the presumed source position is ν². For the hadron

26
induced background showers the ν² distribution is flat, whereas it rises towards 0° for -ray
events, since -ray induced showers point towards the direction of the source.
The ν² parameter can be estimated with a single telescope using the shape of the
shower, its position in the camera and the time gradient:
)cos(2222 DispDistDispDist (9)
Whereas Disp is defined as:
Length
WidthDisp 1 (10)
The dependencies of the parameter ξ from other image parameters can be estimated
from Monte Carlo -ray events:
2
4103210 log SizekLeakagentTimeGradie (11)
k is zero as long as log10Size<ξ4 and is equal to one for log10Size>=ξ4. The other
coefficients are listed in the table below:
ξ0 ξ1 ξ2 ξ3 ξ4
1.266195 0.100577 1.80309 2.87177 0.61682
Table 1: List of the coefficients of the ξ parameter.
The sign of Disp is depending on the third moment of the shower and the time
gradient. It is positive if the following conditions are fulfilled otherwise it is negative:
07.03LongM (12)
ntTimeGradieDist
2
2.7 (13)
A cut on the ν2 parameter and on the area of the shower is used to suppress the
dominant hadronic background [18]:
)))(log1( 2
31042 cSizeccA (14)
1
2 c (15)

27
The values of the cut parameters c1 to c4 are given in table 2. They are given for two
cases: with and without the usage of the timing information (time image cleaning and
TimeGradient cut).
c1 c2 c3 c4
No timing
(2005)
0.215 0.219084 5.61289 0.0853398
With timing
(since 2006)
0.215 0.215468 5.63973 0.0836169
Table 2: Analysis cut parameters c1 – c4 as given by formulas 14 and 15. The first row shows the cut
values for the analysis of 2005 data that does not include the timing information of the showers,
while the second row shows the values that have been used in 2006 and onward together with the
timing information. The cuts have been optimized on large, low zenith angle (<30°) Crab Nebula
datasets in order to optimize ·log(Excess) of the Crab Nebula.
In addition a cut on Dist versus the time gradient makes use of the dependency on
the impact parameter of both image parameters (equation 13). This dependency is shown in
figures 6 and 7. It can however also be interpreted in a different way (figure 8): Only the
time gradient is used to estimate the core distance of the shower. The Dist parameter
corresponds to the angle under which the shower core is observed. The projection of this
angle to the shower core distance (as implied by the time gradient), allows the estimation of
the height of the shower maximum. Since -ray showers develop within a height profile
around 10km all showers above or below the allowed height region can be rejected.

28
Figure 6: Distance versus Impact Parameter. For a single Cherenkov Telescope the Distance is the
most important image parameter for the reconstruction of the Impact Parameter below 100 m.
Figure 7: Time Gradient versus Impact Parameter. The Time Gradient is especially well suited for
the reconstruction of high Impact Parameters (above 100 m).

29
Figure 8: Explanation of the working principle of the time gradient cut. Every shower is removed
that does not lie within the allowed height region of a -ray shower.
30
1.1.3.5. Energy estimation and calculation of energy
spectra
In order to estimate the energy of a -ray shower the image parameters are
compared with those from simulated -ray showers using the random forest method. The
general procedure is described in [19]. In this work Size, Dist and Leakage have been used for
the energy estimation, following a previous study of the energy dependencies of the image
parameters in [20]. Figure 9 shows the goodness of the energy estimation using this method
(taken from [19]). As expected the relation between estimated and real (MC) energy is linear
and the RMS is small. At lower energies the RMS increases due to smaller shower Sizes and
uncertainties in the reconstruction of the impact parameter and the shower height
maximum.
The reconstructed energy can be used to calculate the spectrum of the -ray source
in the VHE -ray band:
effeff
estexc
TA
ENEN
)()( (16)
Nexc(Eest) denotes the number of -ray excess events with energy Eest. The number of
excess events is calculated by the subtraction of the data taken from the -ray source (so
called “On-data”) and matching data of a sky region without -ray emission (so called “Off-
data”). This way the remaining cosmic ray flux (that survived the -hadron separation) is
subtracted. The effective area (Aeff) is calculated by correcting the number of expected -ray
events within the area A0 with the cut efficiency of the -hadron separation:
)(
)()(
0
0EN
ENAEAeff (17)
Monte Carlo simulated -ray showers are used to determine the area A0 and the cut
efficiency, defined as the ratio of -ray events before and after -hadron separation.
Teff is the “effective on time”, which is the actual duration of the observation
corrected for the dead time, cleaning losses and losses due to -hadron separation.
The final differential energy spectrum is binned in energy. Since the energy
reconstruction is not perfect, some of the events will be shifted into one of the adjacent
bins. The ratio of the number of MC -ray events with estimated energy Eest in a certain
energy bin to the number of MC events with the true energy Etrue in the same energy bin is

31
called “spill over coefficient”. This coefficient is used to correct the differential energy
spectra for events that have been shifted into the wrong energy bin.
Figure 9: The RF-estimated energy versus true MC energy (top) follows a linear relation. The image
at the bottom shows the rms error of the energy estimation versus the estimated energy. Both
images are taken from [19].

32
All data that has been analyzed in this thesis use the same set of quality cuts, even if
it is not mentioned specifically in each analysis:
The shower needs to consist of at least five pixels.
The number of islands must be smaller than three.
The Leakage must be smaller than 0.3.
Additional cuts in Length and Concentration versus Size to remove non
physical images.
All significances given in this work have been calculated with formula 17 of Li and Ma [21]
and all data analyses used the Wuerzburg Mars data analysis package [22], [23]. The
automatic analysis as described in [165] is used for the calibration, image cleaning and image
parameterisation.

33
1.2. An unexpected wealth of sources
More than 100 years ago it was generally believed that the radioactivity measured in
the Earth’s atmosphere (discovered by Henri Becquerel in 1896) is originating mainly from
radioactive elements in the ground or radioactive gases. However in 1912 Victor Hess found
out in a balloon experiment [24] that the radiation rate increases with height. An additional
measurement during a near total solar eclipse ruled out the sun as the source of the
radiation. In 1936 Victor Hess received the Nobel Prize for these discoveries. Ever since then
the quest began to reveal the source(s) of these “cosmic rays”.
Several experiments are currently measuring the cosmic ray spectrum and
composition in different energy regions. These include e.g. the Pierre Auger Observatory
[25], PAMELA [26], HiRes [27], ATIC [28] and many more. As a surprising result of the past
decades of observations, it was found out that the cosmic ray spectrum covers more than
ten orders of magnitude from tens of MeV up to 1020eV [29]. The change of the flux with
energy follows a power law with an energy dependent spectral index [30]. The composition
(though changing with energy) consists mainly of protons (≈90%), helium nuclei (<10%),
ionized heavier elements (<1%) and electrons (<1%). Since all of these particles posses a
charge they are affected by the galactic and extra-galactic magnetic fields. This leads to an
isotropic flux of cosmic rays from every direction in the sky, making it impossible to
determine the source of the charged particles1. Only 0.1%-1% of the cosmic rays consists of
photons with energies greater than 1 MeV. Since photons do not possess a charge they are
not affected by the magnetic fields and are thus believed to hold the key to identify the
cosmic accelerators.
Dark matter is another good candidate for the production of very high energy
photons of cosmic origin. According to recent measurements [31] 23% of the universe is
made of “dark matter”, so called because it cannot be observed in visible light, yet its
gravitational force has a compelling impact on its surroundings [32]. The currently favoured
theoretical explanation arises from extensions of the standard model of particle physics
using Supersymmetry. The lightest stable supersymmetric particle (the Neutralino), being a
weakly interacting massive particle (WIMP), could explain the observed features of dark
matter. Its self annihilation (it is a majorana particle) could create -rays that can have
1 It should be noted that the Pierre Auger Collaboration reported anisotropy of ultra high energy
cosmic rays above 57 EeV correlated with nearby AGN [29] at a chance probability of 99%. However
newer data seems to weaken the correlation (AUGER Coll., RICAP09 conference).

34
energies >100 GeV. The detection of this signature would be an important independent
measurement of the composition and properties of dark matter (for current upper limits see
e.g. [33]). Recent reviews of the dark matter problematic can be found in [34], [35], [36],
[37].
Gamma-ray bursts (GRBs) are the most luminous explosions in the universe. They are
thought to originate from the death of super massive stars in distant galaxies. While prompt
emission is usually detected from 10 keV to 5 MeV, detections above 100 MeV are rare due
to the lack of a proper all sky monitoring instrument. A recent prominent burst above 1 GeV
has been detected by the new Fermi satellite [38]. High energy and very high energy -ray
observations are crucial because they can constrain the source environment and uncover
the origin of the emission. Until today no significant VHE -ray emission has been detected
from GRBs and consequently upper limits have been set (see for instance [39], [40] and
[41]). A recent review of GRBs can be found for instance in [42].
On their way from the source to the observer, the -ray photons may travel great
distances and are thus probes of the structure and the extragalactic background (EBL)
radiation of the universe. Additionally the influence of quantum gravity could cause a delay
of the highest energy photons with respect to the lower energies. While such a delay has
been observed the interpretation as an effect of quantum gravity is still under debate [38],
[43]. The EBL is thought to consist mainly of direct starlight, reprocessed stellar radiation
from dust, emission from active galactic nuclei (AGN) and hot interstellar gas. Since it is
extending mainly from ultraviolet to infrared wavelengths the EBL is difficult to measure due
to the contamination by zodiacal and Galactic light [44]. If the combined photon energy of
the background photon and the -ray is above the pair creation threshold of about 1 MeV,
the -rays will be absorbed and thus the measured source spectrum shows a characteristic
change of the spectral slope above a distance dependent threshold [45], [46]. By searching
for a change in the spectrum of distant -ray sources, the intensity of the EBL can be
constrained (see for instance [47] and [48]).
Finally, the discovery of binary black holes ([49], [50], [51]) through the periodicity of
the observed emission can be used as a test of general relativity.
All of the above mentioned questions are of unique importance to our current and
future understanding of astronomy and physics principles. The IACT technique provides the
most sensitive observations in the VHE -ray regime (as described in chapter 1.1) and is thus
one of the most promising candidate techniques to answer these questions.
A milestone for the field was the start of the operation of the H.E.S.S. and MAGIC
telescopes. The H.E.S.S. array [52] features up until now the highest sensitivity above 150

35
GeV2 (0.7% of the Crab Nebula flux can be detected with 5 significance in 50 hours), while
MAGIC with its large reflector area can reach the previously unexplored energy domain
between 50 – 150 GeV. Both installations have discovered a variety of new sources of
galactic and extragalactic origin. The number of discovered sources has increased
exponentially since 1989 [53]. A recent source count can be found in [54] with a total of 81
sources, 27 extragalactic and 54 galactic.
Between 2004 and 2005 the H.E.S.S. Collaboration conducted a scan of the inner
galactic plane within l= 330° – 30° Galactic longitude. This survey revealed a large number of
sources and was later extended ([55] and references therein). The greatest surprise of the
scan was the discovery of several new source classes. This includes for example the binary
systems with periodic VHE -ray emission ([56], [57] and independent of the scan in [58],
[59]). While additional Pulsar Wind Nebulae (PWN) like the Crab Nebula and Super Nova
Remnants (SNR) had been expected, some of the discovered sources showed no obvious low
energy counterparts. These so called unidentified sources or “Dark Accelerators” have a
share of 50% of the discovered galactic sources. After subtracting all point and extended
sources a diffuse excess along the galactic plane remains.
A full review of Very High Energy -ray Astrophysics and Astroparticle Physics goes far
beyond the scope of this work. Recent discussions of the subject can be found for instance in
[60], [61], [62] and [53].
The two following chapters describe the Crab Nebula, the standard candle of very
high energy -ray astronomy and the extragalactic sources in more detail.
2 The H.E.S.S. Collaboration usually claims an energy threshold of 100 GeV. However after an update
of the mirror reflectivity and the aging of the optical components of the telescope in [63] the energy
scale was increased by 33%. This cannot be neglected for the determination of the energy threshold,
which must naturally rise by the same factor. Additionally no spectral point has ever been published
by the H.E.S.S. Collaboration in the energy range from 100 – 150 GeV.

36

37
1.3. The Crab Nebula as a standard candle
The first source of Very High Energy -rays was found in 1989, around 20 years ago
[64]: the Crab Nebula. It is a supernova remnant of an explosion that occurred in 1054 AD
[65]. The emission of the nebula, which is fed by electrons and positrons from the pulsar
wind, spans a wide energy range from Radio, optical, X-ray until VHE -rays. As can be seen
in figure 10 the extension of the nebula is wavelength dependent. This is easy to understand
since the non-thermal emission of the nebula comes from the electrons and positrons that
move along the magnetic field lines. The observed radiation is simply synchrotron radiation
from these particles. Since they lose energy on their way to the outer end of the nebula, the
highest energies are emitted close to the centre (X-rays, optical emission) and radio emission
is coming from the outer regions of the nebula. The HE and VHE -ray emission however is
the result of an inverse Compton scattering process where the electrons and positrons from
the pulsar wind scatter optical and X-ray photons to the VHE range. The Spectral Energy
Distribution (SED) of the Crab Nebula in the HE and VHE -ray domain is shown in Figure 11.
Until today the Crab Nebula is the standard candle for HE and VHE Observatories on
ground and in orbit due to its strong and steady emission. It is a lucky coincidence that the
source can be observed from both the northern and the southern hemisphere. It can thus be
used for cross calibrations between various instruments. Every new instrument in this
energy range must first measure its sensitivity and energy resolution with the detection of
the Crab Nebula spectrum. Telescopes that use the IACT technique compare their sensitivity
in units of the Crab Nebula flux that can be measured in 50 hours. Correspondingly the flux
of a -ray source is often quoted in units of the Crab Nebula flux above a certain energy
threshold. This method is also used in this thesis in order to compare the measured fluxes of
herein discussed objects between different experiments. It has the advantage that it is free
of systematic errors that can arise from different atmospheric conditions, night sky
background levels, electronic equipment (including trigger and calibration) and light
collection efficiencies of the respective IACT experiments. For this purpose the same analysis
is used on a contemporaneous Crab Nebula test sample and the data of the candidate VHE -
ray emitter. Using the Crab -ray event rate (after background subtraction), the relative flux
of the candidate source can be calculated. With the same method an upper limit can be
converted into Crab Nebula flux units: the calculated excess rate that corresponds to the
respective confidence level is used for the comparison with the Crab Nebula excess rate. If a
contemporaneous Crab Nebula data sample is not available, the long term average excess
rate can be used as an approximation. This is possible, because the signal from the Crab
Nebula that is obtained with the analysis used in this thesis is very stable over long time

38
periods3. The Crab Nebula excess rate changed only after the implementation of a new read
out system in February 2007 (as described in chapter 1.1.3.2) from 5.3 /min to 6.5 /min,
respectively [13].
Figure 10: Composite image of the Crab Nebula from [66]. Optical emission is shown in green and
dark blue, infrared emission in red and X-ray emission in light blue. The black star marks the
position of the Crab Pulsar. White crosses denote the position of the VHE -ray excess at different
energies as measured with the MAGIC telescope (see [66] for details). The white dashed circle
indicates the 95% confidence upper limit on the 39% confinement radius of the -ray emission
above 500 GeV.
3 Karl Mannheim, Jan Carsten Strübig, private communication
39
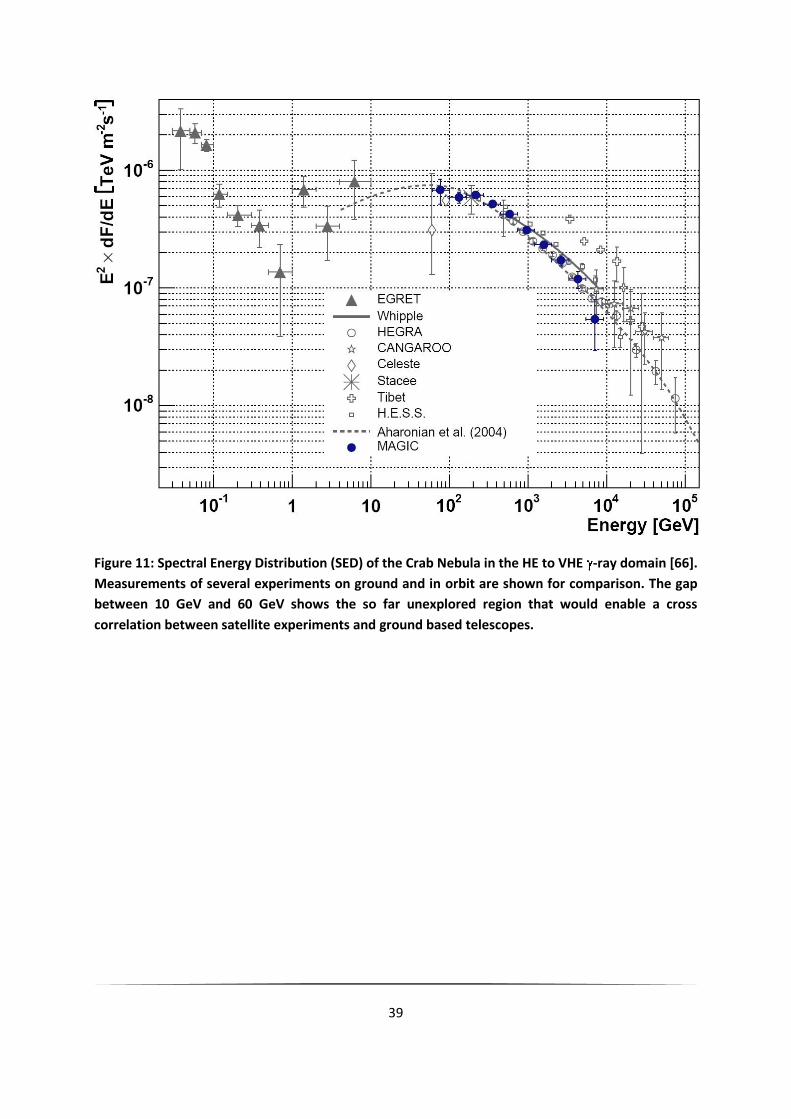
Figure 11: Spectral Energy Distribution (SED) of the Crab Nebula in the HE to VHE -ray domain [66].
Measurements of several experiments on ground and in orbit are shown for comparison. The gap
between 10 GeV and 60 GeV shows the so far unexplored region that would enable a cross
correlation between satellite experiments and ground based telescopes.

40

41
1.4. Extragalactic sources
Markarian 421, the first extragalactic source of VHE -rays, was discovered in 1992
[67]. This bright Active Galactic Nucleus was a surprise to the community, since it showed a
very variable flux that could even exceed the flux of the Crab Nebula several times (see for
instance [68] for recent observations). The corresponding flux doubling times can be as short
as 15 minutes.
Until today all of the discovered extragalactic sources of VHE -ray emission are galaxies
that belong to the class of Active Galactic Nuclei (AGN). A schematic view of an AGN can be
found in [69]. However, only a small subclass of the AGN emits VHE -rays. Active Galactic
Nuclei can be divided into two main categories depending on the dominant emission process
of radiation: thermal or non-thermal [70]. The thermal emission is generated in a disk of
material accreted by a super-massive black hole (108 to 1010 solar masses) while the non-
thermal emission is generated by very energetic particles in a jet of matter that is ejected at
relativistic speeds perpendicular to the accretion disk of the black hole. Some of the non-
thermal AGN have a jet, which is aligned to our line of sight. These so-called “blazars” allow
us to study distinctive features of the emission region close to the central black hole, like the
magnetic field strength, the size of the emission region and the Doppler factor. Blazars are
further divided into Optically Violent Variable (OVV) quasars and “BL Lac objects” (named
after the prototype of these objects: BL Lacertae). BL Lac objects are characterized by
significant optical polarization, rapid flux variability and spectra with a featureless non
thermal continuum. The lack of emission lines complicates the determination of the redshift
of these objects.
The non-thermal emission of the BL Lac objects spans the entire electromagnetic
spectrum of the SED. All currently known BL Lac objects share a characteristic feature in
their SED: A two bump structure, whereas the position of the bumps further distinguishes
the BL Lac objects into the low peaked (LBL) and high peaked (HBL) BL Lac subclasses (figure
12). If the first peak is located at the infrared to optical band these BL Lac objects are named
LBLs, while so called HBLs have their synchrotron (SC) peak at UV to X-ray energies. The
second bump, the Inverse Compton scattering (IC) peak, is located in the energy range of a
few MeV to GeV for the LBLs and GeV to TeV -rays for the HBLs, respectively. The reason
why only the first peak is considered for the classification is rather simple: no sufficiently
complete (in terms of sky coverage and sensitivity) catalogue exists in the HE and VHE -ray
regime to determine the position of the second peak. This is partially due to the gap
between satellite and ground based instruments. It should be noted that the peak position

42
can vary with the brightness of the object, which can further complicate the classification.
The situation will hopefully improve soon with the completion of the all sky scan in HE -ray
regime with the GLAST satellite mission (now renamed to “Fermi”, [71]). Fermi will be an
order of magnitude more sensitive than previous experiments and have a larger energy
range from 20 MeV up to 300 GeV.
Although blazars have been extensively observed in the past, the origin of the energetic
particles emitted in the jet is still not fully understood. The low energy peak is mostly
explained as synchrotron radiation of relativistic electrons. In the Synchrotron Self Compton
(SSC) model the high energy peak is due to inverse Compton scattering of the synchrotron
photons on the same relativistic electrons (see [72] and [73]). Also external photons from
the broad-line emission region or from the accretion disk can be the target photons for IC
scattering (External inverse Compton (EC), [74]). Synchrotron Proton blazar models (SPB,
[75]) assume two electron populations, one insitu accelerated within the jet and a second
one generated by electromagnetic cascades, initiated by primary protons and nuclei, which
have been accelerated to energies >EeV in the jet.
Figure 12: Schematic illustration of the spectral energy distribution of HBL and LBL objects. The
position of the peaks has been highlighted in the energy scale; the flux scale is shown in arbitrary
units.
The table of extragalactic sources in [54] shows a list of all AGN, which have been
detected in VHE gamma rays until today (May 2009). 20 out of the 27 known sources can be
categorized as HBLs (wherein M87 is interpreted as misaligned HBL, see for instance [76] and
references therein) and only one LBL source is currently known: BL Lacertae.

43
BL Lacertae has been discovered with the MAGIC telescope as a result of the work of
this thesis. The observations during the discovery in 2005 and the follow up observations in
2006 and 2007 (with an outlook to 2008) are described in detail in the following chapters.
Some of the BL Lac objects have a peak position that lies between the defined range
of LBLs and HBLs. These BL Lacs are classified as Intermediate BL Lac objects (IBL). Only three
members of this group have been detected at VHE -rays: 3C66A, W Comae and S5
0716+714. The discovery of S5 0716+714 is a part of this work and described in a later
chapter.
Finally, the quasar 3C279 has recently been detected by the MAGIC telescope at a
distance of z=0.536. It is by far the most distant VHE -ray source and can be used to
constrain the Extragalactic Background Light (EBL) [47].

44
1.4.1. Low peaked BL Lacertae objects
While VHE -ray observations have revealed a relatively large number of HBL objects,
no emission from LBL objects has been found until 2005. Source counts measured the ratio
between LBLs and HBLs to be about 6:1 [77]. The detection of 20 HBL sources [54] would
thus translate into 120 LBL sources at the VHE -ray sky. Since LBL objects are also more
luminous [78] than HBL sources, they seem to be a very promising target for VHE -ray
observations. However taking into account, that the second bump of the SED is shifted
towards lower energies, many sources should experience a strong cut-off in the energy
range of IACTs (see figure 12 for illustration). A similar argument applies to IBLs, where the
expected cut-off is shifted slightly towards higher energies. With the operation of the
current generation IACT experiments the energy threshold has been lowered to and below
100 GeV. It is thus feasible, that also LBL and IBL objects can be detected. A detection
enables the investigation of the predicted shape of the spectral energy distribution and a
confirmation of the peak position and the high energy cut-off. Furthermore the modeling of
the SED can help to distinguish between leptonic and hadronic jet compositions and
determine the importance of external radiation fields, the acceleration efficiency and the
strength of the magnetic field. The analysis of the variability of the dataset leads to an
estimate of the variability index of the source as well as an estimate of the size of the
emission region. Finally the investigation of periodic variability of the VHE -ray signal
contributes crucial information to a potential binary black hole system.
Due to these reasons new observations of LBL and IBL objects have been conducted
with the current generation of IACT experiments. The results of these observations are
presented in this thesis work.

45
2. Goals of this thesis
This thesis aims to discover and characterize low peaked and intermediate peaked BL
Lacertae objects in the VHE -ray regime. As has been discussed in chapter 1.4.1 the
observation of LBL objects is rewarding, due to their high population numbers and
luminosity. This thesis aims to study the detection probability of LBL and IBL objects. The
detection will further allow the study of the spectral energy distribution, which will confirm
or disprove the expected cut-off in the VHE -ray regime. Depending on the measured
spectrum, the composition of the jet (hadronic or leptonic) can be studied. The modelling of
the SED will also allow to estimate the physical conditions in the AGN, namely the magnetic
field strength, the strength of external radiation fields and the Doppler factor. Finally an
analysis of the lightcurve allows a study of the variability of the object, which can constrain
the size of the emission region. The percentage that the source has been in an active state
compared to the total observation time allows to estimate the duty cycle of the source,
which is important for future detection probabilities. Finally correlations with other
wavelengths will also be discussed. Should a periodic signal be detected, the periodicity can
be used to estimate the properties of a potential black hole binary system.
For this study the most promising LBL and IBL objects have been selected. The
requirements included a hard spectrum and a high flux as observed by EGRET and/or AGILE
in the HE -ray regime. This selection results in three candidate sources that have been
summarized in table 3. All of the objects are highly variable which is why a range for the flux
and the spectral index are given in the table. Each source is described in more detail in
Chapter 2.1 “Selected IBL/LBL objects”.
Object classification F [10-8ph∙cm-2·s-1] Reference
BL Lacertae LBL 40 – 171 1.7 – 2.3 [90], [91]
W Comae IBL 12 – 34 1.7 [100]
S5-0716 IBL 13 – 53 1.5 – 2.0 [100], [115]
Table 3: Summary of LBL and IBL candidate sources. The classification (LBL or IBL), the fluxes and
spectral indices as measured by EGRET and AGILE are given with the corresponding references.
Due to the expected cut-off in the VHE -ray regime a twofold strategy is adapted:
Long observations with deep exposures are conducted as well as observations triggered by
high activity in other wavelengths, such as X-rays, R-band optical or HE -rays. Evenly space

46
exposures over long time intervals will give an unbiased measurement of the activity of the
source in different flux states. This strategy has been adapted for BL Lacertae, since previous
observations by EGERT (see table 3) indicate the possibility of very strong flares (the highest
flux of all three objects in question has been measured for BL Lacertae). In order to detect
significant flux variability on the time scale of days, observations of up to four hours per
night have been conducted whenever possible. The observations of W Comae and S5-0716
however follow mainly the first strategy that requires a trigger due to a high emission state
at another wavelength.
The VHE -ray observations have been conducted with the MAGIC telescope, while
simultaneous optical measurements have been performed within the Tuorla Blazar optical
monitoring program [79]. The data of this program was also used to trigger MAGIC
observations in case of the detection of a high R-band flux. The properties of the MAGIC
telescope have been described in detail in chapter 1.3.1 and the references therein. Relevant
for this thesis work is especially, that the MAGIC telescope delivers the lowest energy
threshold of all currently operating IACTs and a high sensitivity. It was thus the best suited
experimental setup for the observations.
Additionally the MAGIC telescope has the unique opportunity to conduct
observations under mild moonlight conditions. The duty cycle of a standard IACT experiment
is in the order of 10%, because it cannot operate under moonlight and during bad weather
conditions. This lowers the probability that data can be taken when high source activity has
been detected by another experiment. While moonlight observations can increase the duty
cycle to 12-13%, additional studies have been performed within this thesis work to further
increase the duty cycle of the MAGIC telescope. To achieve this, observations in twilight
(both twilight of the sun and the moon) have been conducted. It has been found, that the
excellent data quality allows the MAGIC telescope to observe under these light conditions,
which considerably increases the duty cycle to up to 15%. The details of this study are
summarized in chapter 2.2 “Twilight observations with the MAGIC telescope”. Accordingly
twilight observations have also been used to extend the observations of the herein discussed
IBL/LBL objects.
This thesis uses the MARS Software analysis package [22], [23] and the automated
analysis [165] in the Wuerzburg datacenter.
All three candidate objects can be observed from La Palma, where the MAGIC
telescope is situated. While BL Lacertae and W Comae can be observed with zenith angles
below 30 degrees (granting the lowest analysis energy threshold possible, around 140 GeV),
S5-0716 can be observed with a minimum zenith angle of 42 degrees, increasing the energy
threshold to ≈230 GeV. Chapter 3 describes the MAGIC observations of all three objects in

47
more detail. Chapter 4 analyses the results of these observations and discusses similarities
between the objects. In Chapter 5 the conclusions are summarized and an outlook is given.

48

49
2.1. Selected IBL/LBL objects
2.1.1. BL Lacertae
BL Lacertae (1ES2200+420) was first discovered as a stellar object in 1929 [80]. It has
been monitored in the optical regime ever since. However due to the fragile nature of the
photographic plates that have been used at that time a large fraction of the data have been
lost. The observed brightness variations reached 5m which corresponds to luminosity
variations of a factor of 100. In 1978 Miller et al. [81] were able to detect the host galaxy of
the AGN for the first time. They determined the redshift to be z=0.0695±0.001. The mass of
the super massive black hole in the center of the host galaxy is estimated to be ≈108 Msun
[82].
As has been mentioned before, BL Lacertae is the prototype of the BL Lacertae (BL
Lac) objects. The first peak of the SED is situated at a frequency of 2.2 1014 Hz [83], which
classifies it as a low peaked BL Lac object. Denn et al. [84] and Tateyama et al. [85] have
analysed the trajectories of components of the jet of BL Lac in order to determine the angle
between the jet and the line of sight. Both have used the helical jet model from Hardee [86]
and preferred adiabatic expansion of the jet. As a result Tateyama et al found 17° for the
angle between the line of sight and the cone axis and 2.6° for the half cone angle. Denn et al.
concluded that the angles are 9° ± 2° and 2.1° ± 0.4° respectively. These values are
consistent with the expectation for a blazer that requires small angles between the observer
and the jet axis.
Several authors have discussed a possible periodicity in the emission of BL Lacertae.
Villata et al. [87] have collected over 30 years of data of the optical and radio emission and
reported a correlation between the optical light curve and the radio hardness ratio with a
delay in the radio emission. Furthermore they claimed evidence for an eight year periodicity
in the radio emission, but found less evidence for a periodic emission in the optical regime.
Stirling et al. [88] have claimed the discovery of a precessing jet nozzle, with a period
of ≈2.3 years. Mutel et al. tried to confirm this discovery with VLBA data from 1998 – 2003
[89]. Although they did find evidence for variability in the dataset, the best periodic fit leads
to a period of 12 years, while 2.3 years are also plausible at lower significance. The authors
conclude that more data is required to discard or confirm the periodicity.

50
As a conclusion periodic emission of BL Lacertae is still under discussion and requires
confirmation at a highly significant level. If the periodicity exists, it could be explained by two
gravitationally bound super-massive black holes in the center of BL Lac, which would also
lead to a periodic behavior in the VHE -ray regime. Figure 13 shows recent optical R-band
monitoring of BL Lac from the Tuorla blazar monitoring program. Strong variability is evident
and an exceptional flare has been detected in 2004.
Figure 13: Results from the optical monitoring of BL Lac from 2003 until 2008. Property of the
Tuorla blazar monitoring program [79]. Except of the 2005 observations the data are not
published. Red points denote the measured optical magnitude of the source in the R-band, while
green points refer to the measured magnitude of the control star used for the calibration.

51
Because of its persistent activity in optical and radio wavelengths, BL Lacertae has
also been observed regularly in the HE -ray regime (E>100 MeV) with the Compton Gamma
Ray Observatory (CGRO). The EGRET (Energetic Gamma Ray Experiment Telescope) detector
aboard CGRO is sensitive to -rays with energies between 30 MeV to 30 GeV. BL Lacertae has
been observed since 1991. However no significant -ray emission could be detected until
1995, when a flux of (4.0 ± 1.2)·10-7 photons cm-2 s-1 above 100 MeV has been measured at a
level of 4.4 . The observations between 1991 and 1995 are summarized in table 1 in [90].
Two of the upper limits are inconsistent with the later detected flux, indicating that BL
Lacertae is at least variable on a yearly time scale. The combined 95% confidence upper limit
above 100 MeV for observations before 1995 is 1.4·10-7 photons cm-2 s-1.
In 1997 BL Lacertae underwent a major optical outburst. Consequently the CGRO was
pointed again towards the direction of BL Lacertae to investigate the HE -ray flux during the
flare. The observations between the 15th and 22nd of July lead to the strongest detection of
-rays until today4 [91]. The optical and HE -ray light curves are shown in [91]. The
comparison seems to indicate that the -ray flare precedes the optical flare by a few hours.
However the sampling of the -ray light curve is much sparser and has larger errors, than the
optical one. Only for the day with the highest flux (on the 19th of July) a sampling with 8 hour
intervals is possible. The other days could not be separated into smaller time intervals. The
authors note, that the sampling of the optical data does not completely rule out the
possibility of a rapid optical flare, occurring during the peak of the -ray flux. A definite
conclusion is thus not possible.
The average E > 100 MeV flux during the 1997 EGRET observations was four times
higher, than during the 1995 observations and the spectrum was significantly harder: a
photon spectral index of 1.68±0.16 was measured in 1997 compared to 2.27±0.30 in 1995.
In 1998 the Crimean Astrophysical Observatory claimed the detected of strong
emission from the direction of BL Lac in the VHE -ray regime above 1 TeV using the GT-48
gamma-ray telescope [80]. The observations were performed from July until August 1998.
24.5 hours of data survived the quality selections at zenith angles below 30°. After -hadron
selection cuts the significance of the signal is 7.2 . The reported integral flux above 1 TeV is
(2.1±0.4)·10-11 photons cm-2s-1. The publication reports significant variability of the signal,
however a measure of this variability is not given. It is further noted, that BL Lac experienced
optical variability between 14.6m and 13.5m during the observations.
4 This includes the HE and VHE -ray regime, since a later detection by MAGIC, described in this work,
reached a level of 5.1 .

52
The result of Neshpor et al. was not believed by the gamma ray astrophysical
community, due to several inconsistencies. The data have been taken in On-Off-Mode.
Without any selection cuts for the background reduction the On- and the Off-data already
show a significant deviation at the 3.5 level. The Crimean group attributes this difference
to the presence of 851 -ray excess events. However after applying a -ray selection to a
source dependent parameter set the difference is reduced to 140 events which should,
following their own monte carlo simulations, translate into a cut efficiency of 21.6%.
Accordingly the total number of -ray events without any cuts should be 648, which is
inconsistent with the previously mentioned 851 recorded -ray events. Furthermore strong
cuts with low -ray cut efficiencies are usually avoided because they can result in the
selection of differences between the monte carlo simulation and real data events. Only
0.85% of the background events survive the selection cuts (259 out of 30340). As previously
mentioned the uncertainty of the measurement is ≥ 200 events and thus the 140 excess
events are compatible with a null detection, despite the claim of a 7.2 signal. Additionally
it is rather suspicious that the Alpha plot of the detection is not shown in the publication.
Private communication revealed a rather broad excess, which is unexpected at these
energies5. The used Alpha cut of 30° is more than seven times broader than the usually used
cut in this energy range.
Furthermore the HEGRA Collaboration took data during the same time period and
reported a seven times lower upper limit in the same energy range [92]. The light curve of
the Crimean observations showed a positive flux throughout the entire observation
campaign except for two days [80]. It is highly unlikely that the flux of BL Lac decreased by a
factor of seven only during observations of the HEGRA telescope, which were recorded a few
hours later during the same day, but never during observations with the GT-48 telescope.
Other VHE -ray observatories have observed BL Lac as well and published only upper
limits. Detailed information on the upper limits can be found in [93], [94] and [95].
5 The shape of the Alpha distribution of -ray events widens towards lower energies (see e.g. [66] and
[14] for a study of the performance in different energy bins). At energies above 1 TeV it is peaking
rather sharp and usually a cut of ≈4° is used.

53
2.1.2. W Comae
W Comae is an intermediate frequency BL Lac object with a redshift of z=0.102. It was
first discovered at radio frequencies by [96] in 1971. W Comae was also detected in the X-ray
band by the Einstein [97] and BeppoSAX [98] satellites and the transition between the first
and the second peak in the SED was determined to occur around 4 keV. A bright optical flare
in 1998 should be noted with variability time scales as short as a few hours [99].
W Comae has always been of interest for VHE -ray observations especially after the
detection by EGRET (published in [100] and [101]) between 100 MeV and 25 GeV with a very
hard spectrum (photon index α = 1.73 ± 0.18) without apparent cut-off. However neither
observations by Whipple [102], [103], STACEE [104] resulted in a significant detection of the
source.
54
2.1.3. S5 0716+714
S5 0716+714 (from now on called 0716) has been discovered as a bright flat-
spectrum radio source with an optical counterpart in 1979 [105]. It was soon classified as a
BL Lac object because of its featureless optical spectrum and high linear polarization [106].
The featureless optical continuum however complicated the determination of the redshift of
the source. Since the nucleus of 0716 is usually very bright in the optical band [107],
attempts to image the host galaxy have failed as well, until recently when a historically low
optical flux has allowed the identification of the host galaxy [108]. The derived redshift z =
0.31 ± 0.08 classifies 0716 as an interesting target for VHE -ray observations by MAGIC,
because the attenuation of VHE -ray photons due to the EBL is still acceptably low [47].
0716 is known for its strong variability both on short (intraday) and long observation time
scales across the entire electromagnetic spectrum [109], [110]. It is until today the only
source that showed correlated variability between the optical and the radio band [111],
[112], suggesting a common origin of both emissions [113]. Finally it should be noted that
0716 belongs to the IBL subclass of BL Lac objects and has been detected several times by
EGRET [114] and AGILE [115] at variable flux levels in the HE -ray regime.

55
2.2. Twilight observations with the MAGIC
telescope
2.2.1. General considerations for twilight
observations
The MAGIC Telescope was designed not only to operate at the lowest energy
threshold possible, but also during conditions with enhanced background noise, namely
moon light conditions. During the work of this thesis tests have been done to assess the
possibility to expand data taking into twilight conditions before and after the usual dark time
observations. Previous studies of moon light observations [116] indicated that observations
in twilight are possible. Such observations have however never been investigated or
scheduled regularly. The usage of the shower timing information is expected to significantly
increase the sensitivity of the observations due to a better NSB discrimination.
Moonlight and twilight of the rising/setting sun can enter the camera from
atmospheric scattering into the line of sight of the telescope. It can also be scattered on
diffuse reflecting parts of the telescope, from ground or by clouds and dust layers in the
atmosphere. E.g. if the ground is covered by snow the NSB light is increased by up to a factor
of 5, which makes observations nearly impossible. The Winston Cones prevent scattered
light from entering the camera PMTs unless the light is coming from a cone between 28° to
60°.
Special safety precautions are necessary in order to prevent damage to PMTs during
moon observations [117]:
No observations during full moon or more than 70% moon illumination.
Angular distance to the moon > 25°.
Angular distance to the moon < 130°.
Average PMT current < 7 µA.
Individual PMT current < 20 A.

56
The limits for the average and individual PMT currents have been taken into account
for the twilight observations. As long as the moon is not present, no angular limits are
needed. Depending on the amount of scattered light the camera can usually be opened 30
minutes before the official dark time begins in the evening. However during the first 10
minutes the accidental rate due to triggers from the NSB is very high. Consequently high
trigger thresholds have to be used for the observations. To avoid oscillations in the data rate
the IPRC does not lower the thresholds automatically during the observations. Thus the
thresholds remain high, although the ambient light is decreasing. Changing the thresholds
requires stopping the observations, reloading the new trigger tables and waiting until the
IPRC has reduced the accidental rate to less than 10% of the total data rate. A lot of
observation time would be lost, if the thresholds need to be reset within twilight.
Additionally test runs have to be taken to ensure the calibration is working properly at the
beginning of every night. To ensure not only save operation, but also reliable data quality
and reasonably low trigger thresholds, the limit to start twilight observations before dark
time has been set to 20 minutes.
The situation is different in the morning, when the sun is slowly rising. Observations
can be started using the dark time trigger thresholds. With the increase of ambient light, the
IPRC increases the thresholds of the individual pixels automatically. This causes a slow rising
of the discriminator thresholds over time. After approximately 30 minutes the accidental
rate starts to rise exponentially since the sun is close to the horizon and the IPRC cannot
change the thresholds fast enough. At this moment the observations are stopped and the
camera is closed.
The total amount of additionally gained observation time is 50 minutes per dark
night. Theoretically 210 hours of twilight can be taken per year. In reality some of this time is
lost due to the repositioning of the telescope, technical problems and bad weather
conditions. Thus about 100-130 hours can be achieved. It should be noted that twilight
observation time is especially valuable in summer, when the dark nights are as short as 7
hours.

57
2.2.2. Twilight observations of the Crab Nebula
In order to calculate the sensitivity of the twilight observations, data of the Crab
Nebula (the standard candle in VHE -ray Astronomy) have been taken in February 2008,
when the Crab Nebula was observable during twilight observation time with zenith angles
below 30 degrees. After quality selection 92.15 minutes of good data have been used (see
table 9 in the Appendix for details).
The mean discriminator threshold and the mean data taking rate for one of the
observation nights are shown in figure 14 and 15. The observations continued into dark time
and can be used to compare dark time and twilight conditions. The shift to dark time
observations can clearly be seen by the reduction in discriminator thresholds and the
increase in data taking rate. However despite the decrease in data rate no worsening of the
sensitivity could be determined with the standard set of – hadron selection cuts and the
standard image cleaning procedure as described in chapter 1.1.3.4. The energy threshold of
the standard cuts is around 190 GeV [13]. Figure 16 shows the ²-distribution of the
surviving events. The Crab Nebula shows a strong detection at the level of 25 standard
deviations above the background. This corresponds to 20.0 h/ . The background rate is
3.40 events per minute, while the excess rate is 7.36 per minute, respectively. It should be
noted that this is amongst the highest gamma rate ever measured for Crab Nebula
observations by the MAGIC telescope above the same energy threshold (including dark
night). It can thus be concluded that no signal events are lost above this threshold with the
standard analysis. A source of 2.18 % of the Crab Nebula flux can be detected within 50
hours. This value is absolutely identical to the one given in [13] for the same energy
threshold. It can thus be concluded, that with the current standard analysis methods used in
this thesis, no sensitivity is lost during twilight observations. As a consequence the twilight
data will be treated the same way as the dark time data in the further analysis.
The reduced data taking rate indicates that 20% of the showers are lost. However
most of these showers are very small (below 100 phe Size) and would be rejected by quality
cuts and gamma – hadron separation cuts. Since this affects hadron and gamma induced
showers in the same way only a minor loss in sensitivity (due to reduced statistics) is
expected. At lower energies the gamma – hadron separation becomes very difficult and only
strong signals can be detected. It is not possible to determine the sensitivity below 100 GeV
with the current dataset due to lack of statistics, but some loss can be expected in this
energy range.

58
Figure 14: Mean discriminator threshold in arbitrary units versus observation time. Twilight
observations were carried out from time index 19:54:00 until 20:09:00. Data taken after 20:10:00
were taken in dark time. As can be seen the thresholds during twilight are stable around 19.
Reloading the thresholds at the beginning of the dark night reduced the thresholds to a value close
to 17.

59
Figure 15: Rate in Hz versus observation time from the same observation night as in figure 14. The
same time limits for twilight and dark time apply. The overall trend of increasing rates with time is
due to a decrease of the zenith angle. During twilight the average rate is reduced by 20%.

60
Figure 16: Twilight observations of the Crab Nebula. A strong signal is detected towards the source.
Since no anti-theta cut was used in the analysis, the -ray events of the Crab Nebula are also visible
in the Off-data in the range of 0.15 deg² to 0.35 deg².
A combination of several effects is responsible for the good sensitivity during twilight
observations. Twilight is concentrated on the horizon close to the position of the sun. Since
most observations are made close to the zenith only few scattered light can be directed into
the camera PMTs. The amount of scattered light is further reduced by the Winston Cones.
Finally the effect of increased background light is reduced with the time image cleaning.
Twilight would raise additional pixels above the image cleaning threshold that do not belong
to the shower image. However the signal in these pixels has a random arrival time, while the
pixels that belong to a shower image are correlated. A time constraint in the image cleaning,
as used in the standard analysis, identifies the pixels that belong to the shower and rejects
most of the background illuminated pixels. This ensures a correct calculation of the image
parameters that are later used for the separation between gamma like and hadron like
events.

61
2.2.3. Introduction of twilight observations into
the standard MAGIC observation schedule
At the beginning twilight observation time was used mostly to monitor bright VHE- -
ray sources, galactic transients, e.g. variable sources. Following the results of this thesis also
standard observations are scheduled in twilight, since no sensitivity is lost above 190 GeV.
This affects mainly galactic sources in the summer, where the observation schedule is rather
tight. The twilight monitoring of the bright sources Markarian 421 and 501 has been very
successful. Already during the first testing period a flare of Markarian 501 has been found at
the level of 1.6 times the flux of the Crab Nebula (figure 17). This clearly proves that flares
can be easily detected during only ten minutes observation in twilight. If a pre-defined flux
threshold is exceeded, the observations are extended into the dark time and other
observatories are alerted of the high flux state. The data can also be used to produce daily
light curves and search for possible periodicities. These periodicities are predicted from black
hole binary models and previous data from the HEGRA experiment already showed
indications for a 23 day periodicity in VHE -rays in Markarian 501 [50]. Such a search is
further encouraged by recent findings in [51]: The active galaxy RE J1034+396 shows a
periodic (period ≈ 1h) behaviour in X-rays at highly significant levels.
The twilight data of Mrk 421 and Mrk 501 as well as 1ES 1959 will be combined with
the monitoring data taken during dark night and will soon be published (after one data
taking cycle of the MAGIC telescope is completed).

62
Figure 17: Result from the Online Analysis program of a twilight observation from Markarian 501
on October 14th. Even with the reduced sensitivity of the Online Analysis the flare is clearly visible
after only 10 minutes of observation time.

63
2.2.4. Extension of the MAGIC observation time
during strong moon light illumination
After successful operations during dusk and dawn for more than 10 months, tests
have begun in July 2008 to operate during conditions with strong moon. When the moon is
illuminated by more than 70%, the PMTs could be damaged. While the moon is rising or
setting, the illumination is reduced. Thus it is feasible to investigate operations in so called
“moon twilight”. For these observations the same safety precautions apply as for
observations in dusk and dawn: the average PMT current should be below 5 µA and single
PMTs should not exceed 20 µA. The observation strategy is also similar: if the moon is rising
after dark time observations, the shifter can use the IPRC to increase the DTs automatically.
Observations starting before dark time require higher discriminator settings, similar to the
ones used during dusk observations. Initial testing showed promising results, but the
sensitivity and energy threshold of the observations cannot be calculated yet, since the Crab
Nebula can only be observed in moon twilight during winter. These observations will be
scheduled after the completion of this thesis. Depending on the phase of the moon, up to
4.5 hours of moon twilight can be taken per period (not accounting for potential losses): 45
minutes during dusk and 20 minutes during dawn. This would amount to more than 50 hours
per year, or 30 hours estimating the same loss rate as in twilight.

64
2.2.5. Summary
Combing twilight and moon twilight, the observation time of the MAGIC telescope
can be increased by more than 160 hours per year. This is equal to an increase of 12% of the
total observation time (a typical MAGIC cycle has 1000 hours dark time and 300 hours moon
time observations). It should however be stressed that twilight observations have identical
sensitivity as dark time observations above 190 GeV and are thus of higher quality than most
of the moon data currently taken.
Additional data could be taken during two more days: on the day before and the day
after standard shift operations. These days are very close to the full moon and no dark time
is available. However during dusk and dawn respectively no moon is present. This is hence
good quality data with dark time sensitivity above 190 GeV. In addition moon twilight can be
taken during these days. The total amount of up until now unused observation time is 115
minutes per period or 23 hours per year (1.8% of the total observation time).
If all accessible observation time (dark, moon and various twilight observations) is
used an average above 1500 hours per year can be achieved. For comparison: the VERITAS
experiment has observed 800 hours in the observation season from 2007 – 2008. 700 hours
of data were taken during dark night and 100 hours during moon light conditions [166].
However about of 200 hours (estimated) of dark time are lost due to a rainy season of two
months in the summer. The increased observation time of MAGIC can thus partially
compensate for a lower sensitivity (the MAGIC sensitivity is about 1.6% of the Crab Nebula
flux in 50 h compared to 1.0 % of the VERITAS array). It should be noted and encouraged
that the VERITAS Observatory can also conduct observations in twilight if the tests during
moonlight have been successfully finished.
Twilight observation time increases the detection possibilities of variable sources
during flaring states (e.g. the IBL/LBL sources discussed in this thesis work) and gamma ray
bursts (GRBs). This is due to the low duty-cycle of the IACTs: Considering only dark time
observations under good weather conditions an IACT can achieve about 10% duty-cycle per
year. However the candidate sources must be observable at low zenith angles to achieve the
lowest possible energy threshold and best sensitivity, which is only possible for a few weeks
each year depending on the position of the source in the sky. Additionally flares and GRBs
are short lived down to only a few minutes ([118], [119]) and must be observed immediately
or within minutes after the initial flaring alert. Several sources have already been observed
during twilight: BL Lacertae in June 2007 during an optical flare (see chapter 3.1 for details),
S5 0716 during high optical and X-ray activity in April 2008 (leading to the discovery of the

65
source in VHE -rays, described in chapter 3.3 of this work), Mrk421 during a phase of high
activity at the beginning of 2008 and M87 during a 13 day flare complex which resulted in
the discovery of day scale variability at a highly significant level [76].
It should be noted that the famous “naked-eye” GRB 080319B (see for instance [120]
and [121]) occurred during twilight and could have been observed by MAGIC. Unfortunately
the automatic GRB notification software was not yet adapted to the new observation
window in twilight. Thus the shift crew operating the telescope in La Palma was not
informed of the GRB and it was consequently not observed. The software has now been
changed to include twilight observation time.
In summary twilight observations do not only increase the observation time of the
MAGIC telescope by about 1/8 of the total observation time, they also increase the
probability to detect transients with unusually high activity including GRBs. The sensitivity
above 190 GeV is identical to the one obtained during dark time observations. Due to its
ongoing success the monitoring program during twilight is continued in the current MAGIC
observation cycle (cycle IV) and twilight data has been used for the observations of two out
of three sources discussed in this thesis work.

66

67
2.3. Cut optimization
The procedure of the -hadron separation is described in chapter 1.1.3.4. The therein
mentioned cuts have been obtained from an optimization on Crab Nebula data, wherein the
quantity ·log(Excess) is maximized using macros from the Mars Software framework [22],
[23]. Since the Crab Nebula is a very strong source, a large number of excess events are
available. For weak sources, such as the IBL/LBL objects discussed in this thesis, the number
of excess events is more than an order of magnitude smaller and thus the signal is
dominated by the number of background events. From experience with the analysis of
different weak sources the cut value of c (the ν2-cut) has been chosen to be 0.18.
The cut values c2 – c4 have not been changed, as long as the zenith angle of the data
is below 35°. For high zenith angle data a contemporaneous dataset with a strong signal has
been used to optimize the values of c2 – c4. The bright AGN Mrk 421 showed high levels of
activity (reaching a level of up to ten times the Crab Nebula flux [122]) in spring 2008. Whilst
MAGIC has recorded only levels between 2 – 4 times of the Crab Nebula flux, this data is still
ideally suited for optimization of -hadron selection cuts. Observations on March 9th and 10th
with zenith angles ranging between 46° to 56° have been used to determine selection cuts
that are more adequate for high zenith angle observations in 2008. Since the zenith angle
range and telescope setup is slightly different for the 2007 observations, a flare of Mrk 501
on October 13th has been selected to optimize -hadron separation cuts for the 2007
observations. The energy threshold increases with the zenith angle. Since IBL/LBL sources
are expected to have a steep spectrum, the lowest possible energy threshold is preferred.
Accordingly the cuts have been optimized with emphasis on the low Sizes (and
correspondingly lower energies). Due to the strong -ray signal in the 2008 data sample an
independent optimization for Sizes between 100 – 200 phe and 200 – 400 phe was possible.
The resulting cut values show a significant difference. Accordingly the high zenith angle data
from 2008 has been separated into two Size ranges (100 – 200 phe and >400 phe), which are
combined after the respective cuts have been applied. A summary of the derived cuts can be
found in table 14 in the Appendix.

68

69
3. Observations of low-peaked and
intermediate-peaked BL Lacertae objects
3.1. BL Lacertae
3.1.1. MAGIC observations of BL Lacertae in 2005
Compared to previous observations of BL Lac the MAGIC observations feature a
lower energy threshold with high sensitivity. These features are critical for BL Lac due to the
lower peak frequency of LBLs and the according shift of the spectral energy distribution
towards lower energies.
The first BL Lac observation campaign started in August 2005 and ended in December
20056. All data have been taken in On-mode with zenith angles below 30° in order to ensure
the lowest possible analysis threshold. In total 22.2 hours have been collected, which are
reduced to 17.8 hours after quality selection. The data reduction excluded sequences with
anomalously low trigger rates due to bad weather conditions and data with technical
problems.
Additionally Off-data runs were taken with similar observation conditions and zenith
angle distribution. The Off-data runs have been shared between different On-mode
observations in order to ensure sufficient Off-data statistics. For the analysis of the BL Lac
campaign 57.2 hours of Off-data with sufficient quality have been selected.
In order to check the stability of the analysis results, the data have been analyzed by
four independent analyzers (see for instance [123] and [124]). The main analyses have been
performed by [124] (which was finally published in [125]) and as part of this work. All four
analyses resulted in the detection of a signal of BL Lacertae, consistent within statistical
6 A minor amount of data (≈30 minutes) was taken in 2004 during a major optical flare. However the
telescope was still in its commissioning phase and unfortunately these data could not be calibrated
properly. It is thus not used for the analysis.

70
errors. The following chapter demonstrates the consistency between the cross check result
from this thesis (referred to as “analysis A”) and the published result (“analysis B”). It should
be noted that both analysis use different analysis methods for gamma hadron separation
and signal detection: analysis A uses the standard Hillas parameter cuts and the
reconstructed ν2 Parameter, while analysis B uses the Random Forrest regression method
and the Alpha Parameter. This increases the independence of the results. The analysis used
for this work is described in detail in chapter 1.1.3.4 of this thesis and the references therein.
The published analysis is described in the published letter itself [125] and the references
therein7.
Figure 18 shows the significance of the detection for both analyses. It is expected that
the standard Hillas analysis has about 15-20% less sensitivity than the Random Forrest
analysis. Thus the resulting significance of 4.2 of analysis A is in good agreement with the
corresponding result of 5.1 of analysis B. In chapter 1.1.3.4 a description is given how the
significance of a VHE -ray source is calculated in this work.
Sky maps were produced to confirm that the position of the excess is coinciding with
the expected position of BL Lac. The results are shown in figure 19. Both sky maps are
smoothed with the -ray point spread function of 0.1°. The excess is centred at the catalogue
position of BL Lac and its extension is fully compatible with the expectation of a point source.
Finally differential energy spectra were produced from the energy distribution of the
excess events of both analyses. Analysis A and B used the same method, which is described
in chapter 1.1.3.5 of this thesis. The corresponding spectra are shown in figure 20. Despite
the lower significance of the detection with analysis A, both spectra agree well within
statistical errors. A simple power law fit can describe the reconstructed spectrum reasonably
well. The corresponding fit parameters are given in figure 20. Due to the relatively steep
slope, the systematic errors are estimated to be ≈50% for the absolute flux level and 0.2 for
the spectral index.
In summary the results of both analyses agree within statistical uncertainties despite
the fact that they are using a different software package and independent analysis methods.
Accordingly these results have been published in [125] and were accepted within the -ray
astrophysical community as the first detection of BL Lac in the VHE -ray regime. As
discussed in chapter 2.1.1. a prior detection claim by the Crimean Observatory has not been
confirmed. Since this puts similar detection claims of other low peaked BL Lac objects by the
7 The data have been analyzed before the time image cleaning and the Time Gradient have been
introduced to the analysis. Thus higher cleaning levels (chapter 1.1.3.3) have been used: 8.5/4.0 phe
for analysis A and 10.0/5.0 phe for analysis B, respectively.

71
Crimean group (specifically 3C66A in [126]) in doubt, the detection of BL Lac is commonly
recognized as the first detection of an LBL object at VHE -rays by the VHE -ray Astroparticle
physics community.

72
Figure 18: Comparison of the reconstructed angular distribution of events from the BL Lac 2005
observations used for the calculation of the significance of the detection. Top: Result obtained in
this work using standard Hillas Parameter cuts and the ν2 parameter. The grey dotted line defines
the signal region. Bottom: Published analysis using the Random Forrest regression method and the
Alpha parameter. The grey dotted line denotes a parabolic fit to the Off-data. As expected for a
point like -ray source at the position of BL Lac an excess is detected for small values of Alpha and
ν2 respectively. The corresponding values of the significance, excess and background events as well
as observation time are given in the figures.

73
Figure 19: Sky maps of analysis A (top) and B (bottom) in arbitrary units (color scale). Each map is
smoothed with a 2-D Gaussian of 0.1°. The axes of analysis A show the Offset from the coordinates
of BL Lac in right ascension and declination (dotted light blue lines indicate the coordinates in the
figure), while the axes of analysis B show right ascension and declination. The position of the
excess is compatible with the catalogue position of BL Lac (black crosses). The white circles indicate
the PSF of the MAGIC telescope. In both cases the detected signal is consistent with a point source.
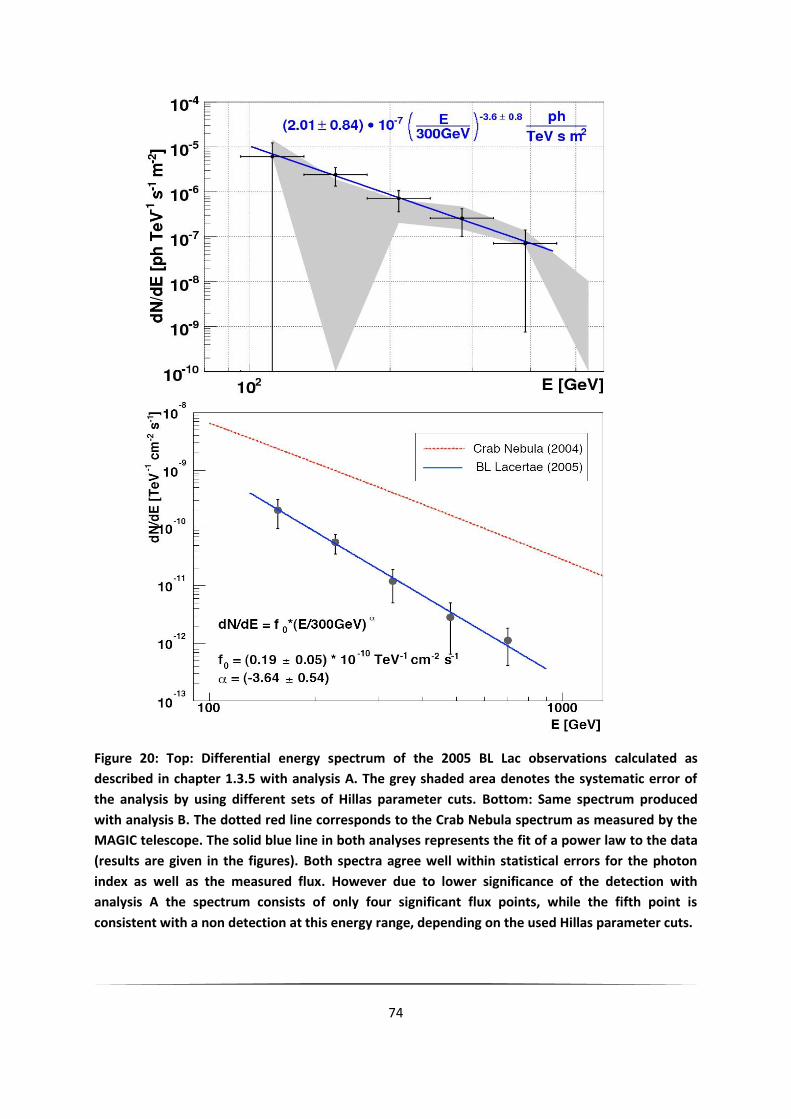
74
Figure 20: Top: Differential energy spectrum of the 2005 BL Lac observations calculated as
described in chapter 1.3.5 with analysis A. The grey shaded area denotes the systematic error of
the analysis by using different sets of Hillas parameter cuts. Bottom: Same spectrum produced
with analysis B. The dotted red line corresponds to the Crab Nebula spectrum as measured by the
MAGIC telescope. The solid blue line in both analyses represents the fit of a power law to the data
(results are given in the figures). Both spectra agree well within statistical errors for the photon
index as well as the measured flux. However due to lower significance of the detection with
analysis A the spectrum consists of only four significant flux points, while the fifth point is
consistent with a non detection at this energy range, depending on the used Hillas parameter cuts.

75
3.1.2. MAGIC observations of BL Lac in 2006 and
2007
After the detection of VHE -rays from BL Lac in 2005, MAGIC consequently
continued observations of BL Lac in 2006 and 2007. These observations have been carried
out in wobble mode [127] where the source is observed with an offset of 0.4° from the
camera centre. The advantage of this observation mode lies in the simultaneous
measurement of the Off-data, defined as three equidistant regions on a circle around the
camera centre (with the On-data as fourth region). Accordingly On- and Off-data share the
same systematic errors as well as azimuth and zenith angle distributions.
26.0 hours of low zenith angle data have been taken in 2006 and an additional 71.2
hours in 2007. After quality selection 21.8 hours (2006) and 57.4 hours (2007) remained. All
data have been analyzed using standard Hillas parameter cuts and the ν2 parameter as
described in previous chapters. No significant emission has been found in the combined data
set as can be seen in figure 21. The 95% confidence upper limit using the method of [128]
(taking the scaling factor between On- and Off-observations into account) is 1.5% of the Crab
Nebula flux above an energy threshold of 140 GeV. An analysis of every single night has been
performed, which did not reveal any significant excess during the observation period. The
according results are summarized in tables 10 and 11. The corresponding 95% confidence
upper limit of the individual days is of the order ≈5 – 10% of the Crab Nebula flux and it can
be concluded that a flare on the order of 10% of the Crab Nebula flux during one single day
would have been detected by MAGIC.
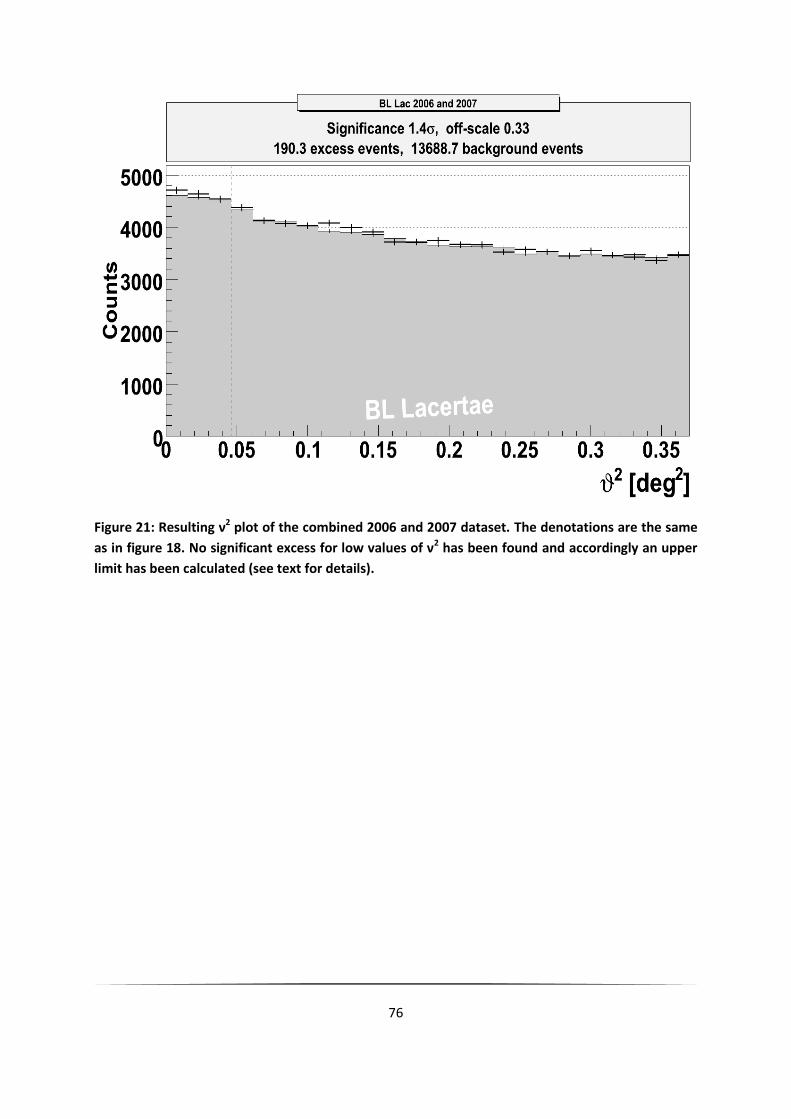
76
Figure 21: Resulting ν2 plot of the combined 2006 and 2007 dataset. The denotations are the same
as in figure 18. No significant excess for low values of ν2 has been found and accordingly an upper
limit has been calculated (see text for details).

77
3.1.3. MAGIC observations during a large scale
multiwavelength campaign on BL Lac in 2008
With the launch of Fermi the gap between HE -ray observations and VHE -ray
observations can finally be closed. The MAGIC telescope is ideally suited to extend the Fermi
observations into the VHE regime, since it is currently the instrument with the best
sensitivity in the energy range from 60 – 150 GeV. While Fermi can measure the second peak
of the SED, MAGIC can measure the cut-off of the spectrum. Combined with measurements
in the optical, radio and X-ray regime the emission models can finally be constrained, since
the location and amplitude of both peaks will be known. In order to reach this goal, a
multiwavelength (MW) campaign on BL Lac has been organized between August 20th and
September 9th 2008. The schedule has been chosen such, that ground based instruments
have optimal visibility of the source. The included observatories are MAGIC, Fermi [71], RXTE
[129], Swift [130], WEBT [131], and VLBA [132]. This campaign is the most densely sampled
and most widely covered (in terms of the energy range), that has ever been conducted for
this object. At the time when this thesis was written the data had been successfully collected
and were being analyzed. About 28 hours of data have been taken with the MAGIC
telescope. These data are currently transferred to the datacenter for a full analysis. The
Online Analysis (OA) program, which is running automatically during MAGIC observations,
has not shown a significant excess. The sensitivity of the OA program is in the order of 2.9%
of the Crab nebula flux [133] and thus about a factor of two worse than the best achievable
sensitivity with the full analysis chain. However since the result of the OA program shows a
significance of -0.3 standard deviations (figure 22), a detection during the multiwavelength
Campaign is highly unlikely and accordingly upper limits will be calculated.

78
Figure 22: Result of the Online Analysis program of the MAGIC telescope for the 2008 MW
observation of BL Lac. The so called Alpha plot is shown above a Size threshold of 200 phe. The
significance, the gamma rate, the observation time and the MJD at the end of the observation are
given in the figure. For more explanation see text.

79
3.1.4. Optical R-band observations using the KVA
and Tuorla telescopes simultaneous to the
MAGIC observations
Simultaneous to the MAGIC observations, the Tuorla blazer monitoring program [79]
has used the KVA and Tuorla optical telescopes to collect R-band data of BL Lacertae. The
optical light curves in the R-band are shown in figure 23. In the R-band, BL Lacertae can be
detected every night and has been found to be variable. The contribution of the host galaxy
to the R-band flux (1.38 mJy) has been subtracted. The average R-band flux in 2005 is 9.2
mJy. In 2006 it has been measured to be 4.2 mJy and 6.2 mJy in 2007 respectively.

80
Figure 23: Optical light curves of BL Lac (R-band) corrected for the host galaxy contribution (1.38
mJy). From top to bottom: 2005, 2006 and 2007 observations. Property of the Tuorla blazar
monitoring program [79]. Except of the 2005 observations the data are not published. Green filled
points denote observations that are within ±1 day of the MAGIC observations. Data marked with
white filled points have been taken without VHE -ray coverage. In the 2007 light curve only
observations that are simultaneous with VHE -ray observations are shown.

81
3.1.5. Summary
In total more than 150.85 hours of data has been collected with the MAGIC
telescope. The first campaign in 2005 yielded a significant detection of the source with a
significance of 5.1 . The VHE -ray light curve is compatible with a constant flux at a level of
3% of the Crab Nebula flux above 200 GeV. The spectrum can be described by a featureless
power law, with a spectral index of -3.6.
Contrary to the detection in 2005, subsequent campaigns in 2006, 2007 and 2008
have not resulted in a detection of the source. The upper limit from the 2006 – 2007
campaign corresponds to 1.5% of the Crab Nebula flux above 140 GeV.
Simultaneous optical observations with the KVA and Tuorla telescopes detected the
source at a variable flux in the R-band. The mean flux of 2005 is 9.2 mJy, which is reduced to
4.2 mJy in 2006 and 6.2 mJy in 2007, respectively.

82

83
3.2. W Comae
3.2.1. MAGIC observations of W Comae
The MAGIC telescope has observed W Comae for 9.6 hours. After quality selections
8.1 hours of data remain between April to May 2005 and March until June 2008 respectively.
Details of individual observation nights can be found in table 12 in the Appendix. The ν2-Plot
for the integrated observation time is shown in figure 24 with a significance of -0.7 standard
deviations. The source has thus not been detected by MAGIC. The zenith angle of the
observations is between 1° and 36° resulting in an energy threshold of ≈190 GeV.
Since no contemporaneous Crab data is available with the same telescope
configuration, the yearly averaged sensitivity derived from Crab Nebula data (see chapter
1.3) is used to estimate the flux upper limit from the non detection of an excess in the
direction of W Comae using the method of [128]. The corresponding 95% confidence upper
limit above 190 GeV is 2.3% of the Crab Nebula flux.

84
Figure 24: Integrated MAGIC VHE -ray observations of W Comae between 2005 and 2008. No
excess has been found and the corresponding upper limit has been calculated (see text).
85
3.2.2. VERITAS and AGILE observations of W
Comae
Recently the VERITAS Collaboration published the discovery of VHE -ray emission
above 200 GeV from W Comae [134] following an earlier report of significant emission in
ATel#1422 [135]. The reported discovery is not in conflict with the MAGIC observations,
since the VERITAS Collaboration has observed a flare in the middle of March 2007 that lasted
about four days with a characteristic time scale of 1.29 ± 0.28 days. The Veritas data are
reproduced in figure 25 together with the MAGIC upper limits, which are shown as red
squares. The MAGIC observations started slightly after the flare, which explain why the
source has not been detected. It should be noted that no signal has been found in the rest of
the Veritas dataset which amounts to nearly 50 hours. The integral photon flux above 200
GeV corresponds to 9% of the Crab Nebula flux, which is nearly four times higher, than the
integral upper limit of the MAGIC observations. The spectrum obtained from the two nights
with the strongest emission can be fit by a featureless power law dN/dE = I0∙(E/400 GeV)-α
with a photon index α = 3.81 ± 0.35st between 200 GeV and 1 TeV and I0 = (2.00 ± 0.31st)∙10-11
cm-2s-1TeV-1.
In June 2008 the VERITAS Collaboration reported an exceptional flare of W Comae in
ATel#1565 [136]. The reported flux on June 7th is twice as large as during the flare on March
13th which would correspond to ≈20% of the Crab Nebula flux. However one day later MAGIC
observations did not reveal a significant excess (table 6 in the Appendix), indicating that the
flare decreased again within only one day (flux upper limit for the 8th of June is ≈7.5% of the
Crab Nebula flux above 200 GeV). Additional information of the flare structure or the
spectral index has not been published yet by the VERITAS Collaboration.
After the detection by VERITAS (and also after the observations by MAGIC had been
finished) the AGILE Collaboration reported a detection of W Comae above 100 MeV at the 4
level during a target of opportunity re-pointing [137]. The data are not public yet and can
thus not be compared to previous detections in the HE -ray regime. Unfortunately there are
no contemporaneous observations above 100 GeV since IACTs could not observe due to
strong moon light.

86
Figure 25: Lightcurve above 200 GeV of the 2008 W Comae observations by VERITAS and MAGIC
(Veritas data taken from [134]). Observation dates are given in the figure in MJD. The detection is
clearly dominated by a flare at the end of March as observed by Veritas (blue dots). The MAGIC
95% confidence upper limits of consecutive observations are shown as red squares with arrows.

87
3.2.3. Summary
MAGIC observations of W Comae in the VHE -ray band between 2005 and 2008 did
not yield a significant detection of the source. The integral upper limit above 190 GeV is 2.3%
of the Crab Nebula flux. However during the same period the Veritas collaboration has
detected two short flares: The first one in the middle of March 2007 and another one in
June 2008. The flux during the flares ranges between 9 – 20% of the Crab Nebula flux above
200 GeV. Additional data (about 50 hours) taken by the Veritas Collaboration does not yield
a detection of the source. The derived spectrum is compatible with a pure power law with a
photon index of 3.81.
Observations by AGILE above 100 MeV resulted in a 4 hint. These observations are
not simultaneous to the Veritas observations.

88
89
3.3. S5 0716+714
3.3.1. MAGIC observations in the VHE -ray
energy range
The MAGIC telescope has observed 0716 in wobble mode [127] for 16.5 hours in
November 2008 and for an additional 5.4 hours between April and May 2008 partially during
twilight. In total 10.7 hours survived the quality selections and were used for the analysis.
The zenith angle range of the observations lies between 42° to 55° (0716 culminates at 42°
at the observation site on La Palma). As discussed in chapter 2.3 dedicated samples of -
hadron separation cuts has been used in order to adapt to the higher zenith angles of the
0716 observations. When these cuts are applied to the corresponding datasets of 2007 and
2008 a significant signal of VHE -rays (figure 26) is found. This is the first time that this
source has been detected in VHE -rays. An Astronomer’s Telegram has been published in
order to notify the astrophysical community of the strong flaring activity of the source in
VHE -rays [138].

90
Figure 26: Combined dataset of the 2007 and 2008 observations of 0716. The observations have
been analyzed separately for each observation period and combined after -hadron separation
cuts. A point like signal with a significance of more than six standard deviations has been detected.
For more details see text.
A separation of the signal into individual observation nights has been performed. The
summary in table 7 shows that the majority of the excess is concentrated in the 2008
observations. Overall the mean flux (E > 200 GeV) in 2007 is almost a factor of seven lower
than in 2008 (the significance of the yearly observations is 2.6 and 6.5 respectively).
Year Significance Flux (E>200GeV)
[photons/cm-2s] x10-12
2007 2.6 6.0±2.5
2008 6.5 40.0±7.0
Table 4: Calculated fluxes and significances of the MAGIC observations of 0716 in 2007 and 2008.
Interestingly the flux in 2008 has not been constant during the observations. The
dataset is reduced to only three nights, which makes a fit to a constant function meaningless
for the determination of the variability of the dataset. Instead the statistical errors have
been used to determine the significance of the change in flux between the 23rd and the 24th
of April. The significance of the decrease of the flux is at the level of 2.8 . Similarly the
method of [128] can be used to determine the probability that a fluctuation of the
background is causing a reduction of the excess rate between the two days. The probability

91
that both days have the same flux is less than 0.2%. In conclusion there is strong evidence (>
99.8% confidence) that the flux has decreased by more than a factor of two within only one
day. Another possibility is a change of the photon index between both observation nights.
The available statistics is too low to calculate spectra from individual nights. Accordingly this
possibility cannot be excluded.
The differential energy spectrum is shown in figure 27. Similarly to BL Lac and W
Comae the VHE -ray data of 0716 can be described by a featureless power law with a
photon index of 3.9 ± 0.5. The fit values are given in figure 27.
Figure 27: Differential energy spectrum of the 2008 VHE -ray flare of 0716. The individual data
points can be fit by a featureless power law (blue line). The fit results are given in the figure. The
grey area denotes the uncertainty of the data points depending on different data analysis cuts.

92
3.3.2. Summary
The MAGIC observations of S5 0716 in 2007 and 2008 resulted in the first detection
of the source in VHE -rays at a very significant level of almost 7 . The flux has found to be
variable on yearly time scales, with additional hints for a daily variability in 2008. Compared
to 2008 the flux (E > 200 GeV) is almost a factor of seven lower in 2007. The spectrum can be
described by a featureless power law with a photon index of 3.9.

93
4. Results
4.1. Interpretation of the detection of BL Lac
in VHE -rays
The detected average integral flux of the MAGIC observations in 2005 corresponds to
about 3% of the Crab Nebula flux above 200 GeV. It is thus below all previous upper limits
published for instance in [93], [94] and [95]. This flux is unfortunately too low for a
significant detection below 140 GeV as can be seen in the spectrum that has been shown in
figure 20. The limit is not due to insufficient statistics, but rather the significant degradation
of the -hadron separation at these energies. The reasons have been discussed in chapter
1.1.3. and in [4] and [139] respectively. This creates a gap in the SED between the previously
detected spectra by EGRET and the MAGIC result (shown in figure 28). The gap between 20
GeV and 140 GeV is sufficiently large to complicate the interpretation of the VHE -ray
emission. Since no contemporaneous HE -ray data is available (neither AGILE nor FERMI had
been launched yet) the emission of BL Lac during the 2005 observations is completely
undefined in the HE -ray regime. However the ratio between the HE and VHE -ray flux is a
crucial discriminator of blazer emission models. The three most important emission models
are the SSC, EC and SPB models. A short summary of these models can be found in chapter
1.4. and references therein. Prior to the MAGIC observations model predictions have been
prepared to estimate the VHE -ray emission of BL Lacertae. An example can be found in
figure 28 (reproduced with data from [140], published in [125]). The -ray flux in the HE
regime is explained via an SSC model in 1995 and an additional EC component in 1997.
Including statistical and systematic errors the measured flux above 140 GeV is marginally
consistent with both models. While this indicates that an EC component is not required to
explain the measured VHE -ray spectrum of BL Lac, its existence cannot be excluded either.
Additionally SPB models correctly predicted the VHE -ray flux (see for instance [141] and
[142]). It can be concluded that sufficient model discrimination can only be achieved with a
large scale multi wavelength campaign, simultaneously measuring the SED of BL Lacertae
from the Radio to VHE -ray band. Unfortunately the 2008 multiwavelength campaign did

94
not yield a detection of BL Lacertae in the VHE -ray regime due to low source activity8 and
thus, the question remains unanswered.
Figure 28: Spectral Energy Distribution of BL Lacertae [125]. The MAGIC VHE -ray points have been
corrected for absorption due to the extragalactic background light using the Kneiske “Low” EBL
model [143]. Simultaneous data from 2005 is marked by filled black circles, while archival data is
shown in grey. The simultaneous data consists of Radio data taken by UMRAO9 and Metsähovi,
optical data from the Tuorla Blazar monitoring program [79] and the MAGIC VHE -ray
observations. SSC and EC model fits from [140] are shown in a straight black and grey dotted line
respectively.
8 Fermi Collaboration, private communication.
9 UMRAO is partially supported by a series of grants from the NSF and by funds from the University of
Michigan.

95
Source
Name
model
characteristics
B [G] Ref.
BL Lac SSC+EC 8 1 [160]
BL Lac SSC+EC 15.5 0.73 [83]
BL Lac SPB 8 40 [142]
Table 5: Summary of the obtained Doppler factor and magnetic field from different model fits for
BL Lacertae. The references are given in the table.
The results of different model fits to the SED of BL Lacertae are shown in table 5. The
resulting Doppler factors are between 8 and 15.5 with magnetic field strengths between
0.73 G and 40 G respectively. The strongest magnetic field is required by the SPB model,
while the leptonic models require magnetic fields of around 1 G. This is mainly due to a
higher X-ray flux during the MAGIC observations, which indicates a stronger synchrotron
component in the X-ray emission that can be comptonized into the VHE -ray regime.
Recently Marscher et al. [144] have published a more complex model of BL Lac, trying
to simultaneously explain the 2005 light curves in the radio, optical, X-ray and (VHE) -ray
band. The authors interpret the time variable emission with an outburst of particles that
happened close to the black hole and propagated as knot along helical magnetic field lines
through the jet. High energy electrons are being accelerated as they move along the jet,
which is increasing the Doppler beaming of the synchrotron radiation they emit. The
predicted rise of the light curve and the change of the electric vector position angle can be
rather sharp, which has been confirmed by observations in the radio, optical and X-ray
regime. The authors also say that “The highly significant detection of >0.2 TeV -rays from
2005.819 to 2005.831 during the first X-ray flare implies that acceleration of electrons with
sub-TeV energies was particularly efficient at this time.”[144]. This statement suggests that
MAGIC has seen a sub-TeV flare of BL Lac during the above mentioned time. However the
MAGIC light curve is consistent with a constant flux during the entire observation period in
2005. Figure 29 shows a reproduction of the published MAGIC light curve where the
corresponding time frame quoted by Marscher et al. is marked between two green lines. The 2/dof of a fit to a constant emission is close to 1 ( 2/dof = 16.3/15), as expected for a
constant emission without significant variability. This fit includes the three nights that are
within the time frame that has been referred to by Marscher et al. While the overall
detected signal of BL Lac is indeed highly significant, the flux of individual observation days is
rather poorly defined as can be seen by the 1 error bars in figure 29. Within 1-2 all three
points are consistent with the average flux. MAGIC can thus not claim the detection of a

96
flare during the corresponding time. However due to the low significance of individual
observation nights a flux that is two times higher than the average flux cannot be excluded.
In conclusion the suggested explanation of the broad band light curve behaviour of
BL Lacertae by Marscher et al. is very appealing, but in the VHE (and HE) -ray regime more
sensitive observations are required to confirm the expected flare coinciding with the already
observed optical flare.
Since none of the MAGIC observation nights has individually shown a significant
detection, a correlation study between the R-band flux and the VHE -ray flux on the
timescale of days is not possible. However as has been discussed in [125] the 2005 R-band
observations show an on average higher optical activity of 9.2 mJy, while the average R-band
flux has been measured to be 4.2 mJy in 2006 and 6.2 mJy in 2007 respectively. Thus the
optical data follow the trend of the VHE -ray observations towards lower fluxes.
Figure 29: MAGIC light curve of the 2005 BL Lac observations above 200 GeV. The emission is
perfectly consistent with a constant flux ( 2/dof = 16.3/15) as indicated by the horizontal blue
dotted line. The publication by Marscher et al. [144] refers to the short time frame between the
two vertical green lines.

97
4.2. Modeling of the VHE -ray emission of W
Comae
In [134] the VERITAS collaboration is using the spectrum of the two nights with the
highest flux in March 2008 to fit SSC, SPB and SSC+EC models to the SED. Within the
experimental errors all three models can appropriately fit the data, although the predicted
HE -ray flux differs by almost one order of magnitude. Contemporaneous HE -ray data
(which is however not available) is needed to determine the emission process that causes
the VHE -ray emission. It is rather unfortunate that the AGILE observations have taken place
when the IACT telescopes could not observe the source. Vice versa the new Veritas data that
has been taken in June 2008 [136] has again been taken without contemporaneous AGILE
data. Since the MAGIC and Veritas data show clear variability of the VHE -ray emission, only
strictly simultaneous data can help to distinguish between the different emission models.
Source
Name
model
characteristics
B [G] Ref.
W Comae SSC 30 0.007 [134]
W Comae SSC 24.5 0.01 [145]
W Comae SSC+EC 30 0.3 [134]
W Comae SSC+EC 19.41 0.78 [145]
W Comae SPB 8 40 [145]
Table 6: Summary of the results of various model fits to the W Comae data. The references are
given in the last column.
Table 6 shows a collection of various model fits to the SED of W Comae including
those from the Veritas collaboration (references are given in the table). The very high energy
emission of W Comae can be modelled by a Doppler factor of 8 as well as 30. The difference
is even more extreme for the magnetic field strength that has been determined to be 0.007
G (pure SSC component) and 40 G (mixture of electrons and protons in the jet, SPB)
depending on the model respectively. This is a range of four orders of magnitude. The very
low magnetic field strength of 0.007 G was required in order to allow the particles to reach
sufficiently large Doppler factors in order to produce the observed VHE -ray flux [134],
while simultaneously allowing for the wide separation of the peaks in the spectral energy

98
distribution and the observed low X-ray flux. It should however be noted that the peak of
the high energy component is not well defined, since data in the HE -ray regime is missing.
By adding an external photon component (SSC+EC) a good fit with a significantly stronger
magnetic field of 0.3 G can be achieved. However rather inefficient particle acceleration is
required with a shock velocity of 0.1 c. Predictions from [145] successfully describe the VHE
-ray data with a Doppler factor of 19.41 and a magnetic field strength of 0.78 G. The SPB
model fit [145] provides a more natural explanation of the emission albeit requiring a
stronger magnetic field of 40 G, which is within the standard range of SPB models.

99
4.3. Discussion of the detection of S5 0716 in
the VHE -ray regime
In order to understand the nature of the VHE -ray emission of S5 0716 during the
outburst in 2008, its activity in other wavelengths has to be considered. High activity has
been measured in the X-ray [146] and the R-band [79]. At present no contemporaneous data
in the HE -ray band has been published. It should also be noted that polarimetric
measurements immediately after the optical maximum [147] have shown that the position
angle of polarization started to rotate with approximately 60° per day. This could indicate
that BL Lac and 0716 share a similar propagation of polarized knots spiraling down the jet
[144]. There are however a few caveats: The peak of the X-ray flare appeared after the
maximum of the VHE -ray emission, when the MAGIC data quality was not stable due to
bad weather conditions. The data thus had to be rejected for the analysis and the VHE -ray
flux during the X-ray flare remains unknown. Vice versa simultaneous X-ray observations
during the MAGIC observations are missing as well. Model interpretations must consider the
fact that the flux observed by MAGIC varied more than a factor of two within one day and
can thus have changed significantly during the X-ray and the polarization measurements.
AGILE observations in the HE -ray regime between September and October 2007
suggest a rather complex behavior of 0716 [115]. While the emission can still be explained in
the context of an SSC model, two independent components with different variability are
required to simultaneously explain the -ray and optical light curves. Unfortunately the
AGILE observations ended before the MAGIC observations in November 2007 began. The
measured -ray flux in the HE regime was amongst the highest ever measured for BL Lac
objects, which demonstrates that 0716 has been in an exceptional flaring period. The
spectrum is extraordinary hard for this energy range, reaching a photon index of 1.56 ± 0.30
in September. The modeling of the SED is shown in figure 30 (adapted from [115]) with the
preliminary MAGIC flux measurements from November 2007 and April 2008 shown in grey
and black, respectively. It is obvious that the MAGIC VHE -ray flux measured in April 2008
exceeds the expectation in that energy range for the high state in September 2007. This
either hints to the fact that MAGIC has observed an even higher emission state or the
assumptions of the model are incorrect and an additional external radiation and/or hadronic
component is required.

100
Figure 30: SED from 0716 optained by AGILE and GASP-WEBT collaborators [115]. Green circles
denote simultaneous observations in September 2007, while blue and red circles mark archival
data. The grey point represents the MAGIC VHE -ray observations during November 2007, while
the black point denotes the flux during the flare in April 2008. The green line represents a two zone
SSC model fit to the data that clearly underestimates the MAGIC VHE -ray flux.
Source
Name
model
characteristics
B [G] Ref.
0716 SSC (spine) 10 1.8 [148]
0716 SPB 10 40 [141]
Table 7: Results of two model fits to the SED of 0716. A more detailed discussion can be found in
the text.
Modeling using SPB [141] and spine/layer [148] models can reproduce the observed
VHE -ray flux state very well. Although the used data are not strictly simultaneous and the
result should thus be treated with caution, it seems that the emission can only be explained
properly either with a hadronic jet component or a structured jet. The fit results are listed in

101
table 7. A Doppler factor of 10 has been used and the magnetic field strength varies between
1.8 G (spine) and 40 G (SPB), respectively.

102

103
4.4. Summary and comparison of the
detected LBL/IBL objects with known extra-
galactic VHE -ray emitters
It is remarkable that all low peaked BL Lac objects share a similar energy spectrum
within the same energy range: the photon index of the measured VHE -ray spectrum is 3.6
for BL Lac and 3.8 and 3.9 for W Comae and 0716, respectively. It must however be
considered that the measured spectrum has to be corrected for EBL absorption and the
error of the determined photon index is large enough to hide a difference of up to ±0.5.
Nonetheless the detected steep spectra confirm the expected lower peak frequency of the
objects and explain the lack of detectability with previous experiments due to their higher
energy threshold and lower sensitivity.
All low peaked objects are highly variably in the -ray range: Whilst the VHE -ray
light curve of BL Lac in 2005 was constant within the MAGIC sensitivity (but variable on
yearly time scales), the authors of [91] note a factor of 2.5 increase in flux within 8 hours
during the 1997 EGRET observations. W Comae experienced a flaring period with a
characteristic timescale of 1.3 days during Veritas observations. The shortness of the flare is
confirmed by MAGIC observations (this work) that could provide only upper limits one day
after the flare had declined. Finally MAGIC observations of 0716 show a clear variability
within yearly timescales and hints of even shorter day scale variability during the flare in
2008. It can thus be concluded that strong and fast variability is a characteristic feature of
these objects in the VHE and HE -ray regime10.
The observed variability timescale of the order of one day in all LBL objects in the VHE
and HE -ray regime can be used to restrict the size of the emission region R due to causality
arguments:
cmtcR 15106.2 (18)
10 After the completion of this thesis the VERITAS Collaboration reported the discovery of significant
-ray emission above 100 GeV from another intermediate peaked BL Lac object: 3C66A [149], [150].
The flux was detected at a level of about 6% of the Crab Nebula flux with a spectral index of -4. The
light curve has been found to be variable on the timescale of days, consistent with the conclusions of
this thesis.
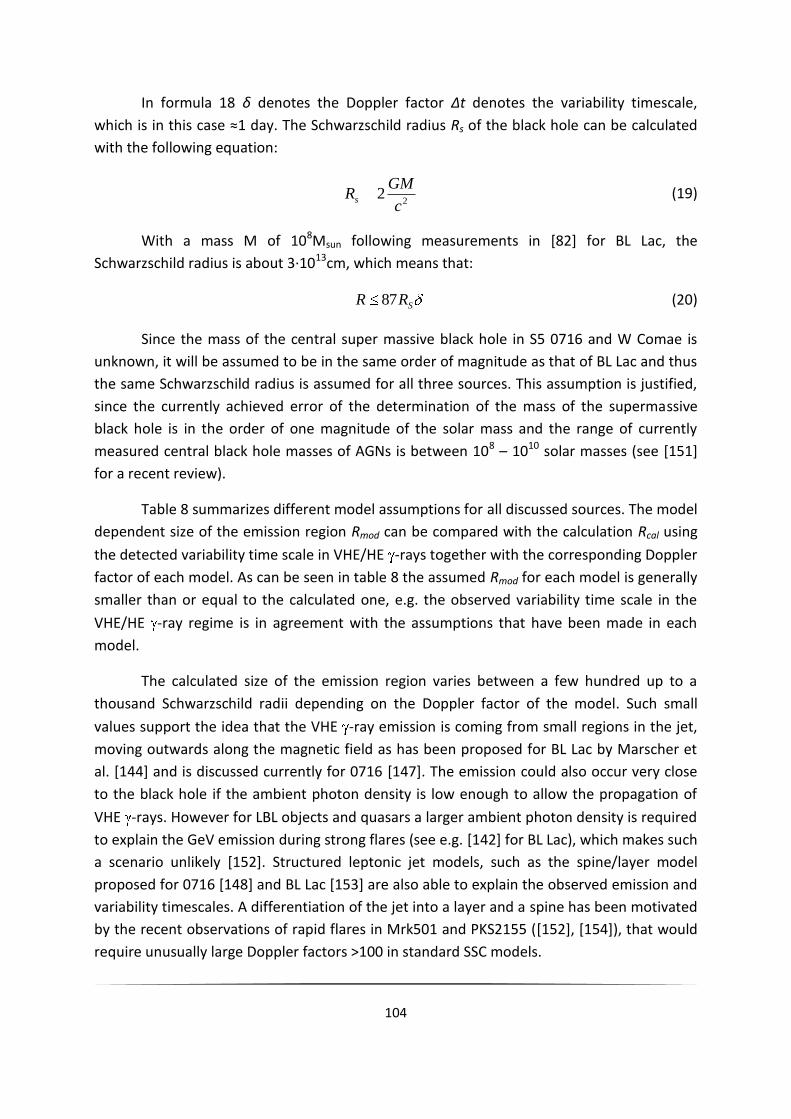
104
In formula 18 δ denotes the Doppler factor ∆t denotes the variability timescale,
which is in this case ≈1 day. The Schwarzschild radius Rs of the black hole can be calculated
with the following equation:
22
c
GMRs
(19)
With a mass M of 108Msun following measurements in [82] for BL Lac, the
Schwarzschild radius is about 3·1013cm, which means that:
SRR 87 (20)
Since the mass of the central super massive black hole in S5 0716 and W Comae is
unknown, it will be assumed to be in the same order of magnitude as that of BL Lac and thus
the same Schwarzschild radius is assumed for all three sources. This assumption is justified,
since the currently achieved error of the determination of the mass of the supermassive
black hole is in the order of one magnitude of the solar mass and the range of currently
measured central black hole masses of AGNs is between 108 – 1010 solar masses (see [151]
for a recent review).
Table 8 summarizes different model assumptions for all discussed sources. The model
dependent size of the emission region Rmod can be compared with the calculation Rcal using
the detected variability time scale in VHE/HE -rays together with the corresponding Doppler
factor of each model. As can be seen in table 8 the assumed Rmod for each model is generally
smaller than or equal to the calculated one, e.g. the observed variability time scale in the
VHE/HE -ray regime is in agreement with the assumptions that have been made in each
model.
The calculated size of the emission region varies between a few hundred up to a
thousand Schwarzschild radii depending on the Doppler factor of the model. Such small
values support the idea that the VHE -ray emission is coming from small regions in the jet,
moving outwards along the magnetic field as has been proposed for BL Lac by Marscher et
al. [144] and is discussed currently for 0716 [147]. The emission could also occur very close
to the black hole if the ambient photon density is low enough to allow the propagation of
VHE -rays. However for LBL objects and quasars a larger ambient photon density is required
to explain the GeV emission during strong flares (see e.g. [142] for BL Lac), which makes such
a scenario unlikely [152]. Structured leptonic jet models, such as the spine/layer model
proposed for 0716 [148] and BL Lac [153] are also able to explain the observed emission and
variability timescales. A differentiation of the jet into a layer and a spine has been motivated
by the recent observations of rapid flares in Mrk501 and PKS2155 ([152], [154]), that would
require unusually large Doppler factors >100 in standard SSC models.

105
Source
Name
model
characteristics
B [G] Rcal [1015
cm]
Rmod [1015
cm]
Ref.
BL Lac SSC+EC 8 1 20.8 7.0 [160]
BL Lac SSC+EC 15.5 0.73 40.3 7.0 [83]
BL Lac SPB 8 40 20.8 1.3 [142]
W Comae SSC 30 0.007 101.4 100 [134]
W Comae SSC 24.5 0.01 101.4 63.511 [145]
W Comae SSC+EC 30 0.3 101.4 18 [134]
W Comae SSC+EC 19.41 0.78 50.5 10 [145]
W Comae SPB 8 40 27.0 10 [145]
0716 SSC (spine) 10 1.8 26.0 5 [148]
0716 SPB 10 40 26.0 0.9 [141]
Table 8: Summary of Doppler factors, magnetic field strength and size of the emission region as
assumed for different model calculations for the sources discussed in this thesis work. Main model
characteristics (SSC, EC and SPB models) with the proper reference for each model are given in the
table. The size of the emission region in units of 1015 cm has been calculated using formula 18 with
the Doppler factor given by each model. More discussions can be found in the text.
Only models that successfully describe the data are listed in table 8. Overall, the
model dependent Doppler factor varies between 8 and 30. The magnetic field has an even
larger range between 0.007 G and 40 G. The very low magnetic field strength and large
Doppler factors push simple single zone SSC models to their physical limits. Thus it seems
that structured jet models, external radiation fields (EC) or hadronic jet components are
preferred. However it should be noted that these extreme values could actually be due to a
very simple selection effect: Only three objects out of thousands of AGN have been
discussed here. Accordingly it cannot be excluded that these three are the most extreme
representatives of the entire population. Additionally all the detections are biased, since
11 A black hole mass of 108 solar masses has been assumed (similar to BL Lacertae), since the authors
do not explicitly mention the mass of W Comae that has been used in the calculations.

106
they occurred only during flaring states, which can be assumed to be the most extreme
conditions in those objects.
Another question is the duty cycle of the three objects: How often do these flaring
states occur? The BL Lac data represent by far the most apprehensive collection of
observations in the VHE regime. Out of a total of 125 hours a significant detection was only
possible in 17.8 hours corresponding to about 14% of the total observation time. This value
can be considered to be unbiased, since the observation times have been randomly chosen
(constraint only by the visibility at La Palma). Similarly W-Comae has been observed by
MAGIC and Veritas for a total of 50 hours, wherein only 55 minutes12 a flux at the level of 9%
of the Crab Nebula [134] has been detected. This corresponds to less than 2% of the total
observation time of both instruments13. Observations of 0716 by MAGIC have been triggered
by high states in the optical and X-ray regime and are thus biased towards high states.
Accordingly the object has been detected both in 2007 and 2008. Monitoring of the source is
foreseen in 2008 and 2009, which will hopefully lead to a more unbiased determination of
the duty-cycle in VHE -rays.
Currently none of these objects has been detected during the low emission state
(0716 however has not yet been observed during the low state), although extensive
observation campaigns have been conducted in the case of BL Lac (>100 hours) and W
Comae (>50 hours). The upper limits for the low emission state derived in this thesis for BL
Lac and W-Comae (between 1-2% of the Crab Nebula flux) indicate that the low state
emission is at least a factor of 2-5 lower than the high state emission. It could however also
be characterized by an earlier cut-off, which shifts the required detection threshold towards
lower energies, outside the accessible energy range of IACTs.
It is very interesting to note that HBL objects show a similar flaring behaviour as the
LBL objects: the bright HBL objects such as Mrk 421 and 501 as well as PKS 2155 have been
observed during various emission states. Thanks to their higher VHE -ray emission
compared to LBL objects they can also be observed during very low (possibly even ground)
emission states. All of them have significantly harder spectra during high emission states as
12 The observation time of the flare is not explicitly given in [134]. The value can however be
calculated using the derived significance of the excess (6.3 ) with the given flux of 9% of the Crab
Nebula. Assuming the official Veritas sensitivity (as publicly mentioned during the Veritas overview
talk at the Gamma 2008 symposium in Heidelberg) of 1% of the Crab Nebula flux in 47 hours, the
observation of the W Comae flare has been 55 minutes.
13 This calculation does not take the recently reported second flare into account [136], since details
regarding additional observations by Veritas have not been published yet.

107
compared to the lower emission states (see e.g. [68], [118], spectral hardening has also been
reported for the exceptional flare of PKS 2155 in 2006, the publication is in preparation).
However the intensity of the hardening is different for each source, most likely due to
characteristic internal absorption effects.
Recently evidence has been found by the MAGIC Collaboration that also the giant
radio galaxy M87 experiences a slight hardening during flaring states [76], albeit at low
significance due to the weak emission of the source.
Finally 3C279, the only known quasar that emits at energies >100 GeV, is also
showing a similar behaviour. Day-Scale variability had previously been found from optical to
HE -rays [155] and recently also in VHE -rays [47]. During high activity the flux in the HE -
ray band can increase by a factor of up to 100 and the photon index becomes significantly
harder [156].
In the case of the LBLs the low emission states have not been detected yet, but
observations by EGRET and X-ray satellites have shown evidence for such hardening effects
[157]. However since EGRET was a pointed experiment the amount of available data is highly
insufficient and biased. E.g. for BL Lac only two data points are available, which indeed
suggest that such a correlation exists. It might however also have been a coincidence. Fermi
will dramatically increase the statistics due to its higher sensitivity and the planned all sky
monitor observation mode. Still, different flux states, especially high flux states are required
and depending on the object in question these can be quite rare. Thus it can be expected
that a definite conclusion on the subject will be available in several years, after the entire
mission of Fermi has been concluded. Flares shorter than one day are possible, but are
beyond the sensitivity of current telescopes. For the brightest HBLs such very short flares
have already been found ([119], [158] and [118]).
In summary evidence has been found that sources of all classes of extra-galactic VHE
-ray emitters apparently share two distinct features: a hardening of the spectra with higher
flux states and short term variability at least down to the scale of days (or even minutes).
The spectral hardening is especially important for the detection of LBL objects. These objects
usually have the second peak of the broad band energy distribution in the HE -ray regime,
outside of the range of conventional IACTs. During a state of high activity, this peak is shifted
towards higher energies and consequently the cut off of the spectrum is shifted as well.
Within the VHE -ray regime these LBLs assume the spectral characteristics of an HBL during
a state of low emission (in the VHE -ray regime!) and thus they become detectable for
current generation instruments. Whilst the low state of an HBL can be observed during most
of the time the LBL high state occurs of course much less frequent (similar to HBL high
states) and consequently it can only be observed in a fraction of the observation time and

108
only, if the detector’s sensitivity is sufficient to detect the object within this time. This
answers one of the important questions of this thesis:
Why are only a few of the LBLs detected at VHE -rays whilst they are nearly ten
times more frequent in the HE -ray regime?
Because they are detectable only during states of spectral hardening which is for the
currently detected LBL coinciding with high emission states. Since these states appear to be
rather rare (depending on the source) and short (day-scale) the detector sensitivity and
duty-cycle are crucial for the detection of LBL objects.
It can be concluded that many LBL objects can emit in VHE -rays, but have not yet
been observed during a flare since IACTs are only capable of pointed observations. Thus for
future searches a close and fast (<1 day) connection between multi wavelength
observatories is required to increase the detection possibility of LBL objects. The prospects
should increase dramatically with Fermi, since it monitors the HE -ray sky once every three
hours and should have sufficient sensitivity to detect these flares at energies below 10 GeV.
However a crucial component is the hardening of the spectra. Only sources with hard
spectra during flares have good prospects for a detection at VHE -rays.
Meanwhile the differences between HBLs and LBLs are becoming smaller. Not only
are LBLs showing HBL character during flaring states, but newly discovered HBLs are also
showing softer spectra, e.g. Mrk 180 [159] and 1ES 0806 [167]. The classification into
differently peaked BL Lac objects is thus not a very sharp, distinctive line and it can be
expected that the current generation of IACTs with a lower trigger threshold will discover
more objects that close the gap between both source classes.

109
5. Conclusion and outlook
The work of this thesis lead to the discovery of the first LBL object in VHE -rays: BL
Lacertae. The IBL object S5 0716+714 has also been discovered and the fast variability (in the
order of one day) of the IBL object W Comae has been confirmed. All of the objects could
only be detected during a state of high emission and all of them experience steep spectra in
the VHE -ray regime, consistent with the expected lower peak frequency from model
predictions. The duty cycle of these objects has been estimated to be between 2% - 14%.
The combination of the steep spectra with low fluxes and the low duty cycles of the objects
is the explanation for the low detection probability in the VHE -ray regime.
The observed SED of all three low peaked BL Lac objects can be explained by a variety
of emission models, including SSC (with spine/layer components), SSC + EC and SPB models.
It should be noted that some of the model fits discussed here have been made prior to the
detection of the objects in the TeV range. This includes the SSC + EC models for BL Lac and
W-Comae([160], [83], [145]) as well as the SPB model fits for all the sources ([142], [145],
[141]). It can thus be concluded that the observed VHE -ray emission is within the
previously expected flux and energy range for a given optical and X-ray flux state. While
simple SSC models need to be pushed to their limits in order to explain the observed
emission (especially in the case of W-Comae and 0716), recently developed structured jet
models including a layer and a spine of the jet as well as SSC + EC and SPB models can
explain and predict the observed luminosity in VHE -rays correctly. In fact it is not possible
to firmly exclude any of the models presented here. However the models predict very
different HE -ray fluxes, observable with the Fermi satellite. Combined observations in the
HE and VHE -ray regime will thus help to distinguish between the different blazar emission
models.
As a surprising result of this work it has been found that low peaked and
intermediate peaked BL Lacertae objects share several features with all AGNs that have been
previously detected in the VHE -ray regime: evidence for short time variability and spectral
hardening during high states.
Low states of LBL/IBL objects could not be detected so far. This could either be due to
the very low emission (below the detection sensitivity of current experiments) or a shift of
the spectra below the energy threshold of current IACTs.

110
Increasing the duty-cycle of IACTs with twilight and moon observations also increases
the possibilities to detect LBLs. In the case of MAGIC the detection probability can be
increased by up to 50% without significant loss in sensitivity.
Due to the short time scales of the flaring events it is crucial that other observatories
are informed as soon as possible about these high states so that follow up observations can
occur. In the X-ray regime the launch of MAXI (scheduled for June 2009) will significantly
improve the monitoring of BL Lac objects in the 0.5 to 30 keV band [161]. In HE -rays the
successful operation of the Fermi satellite has already triggered a large number of
campaigns, however until today most of them have considered flat spectrum radio quasars
and not LBL or IBL objects. A fast alert system that triggers VHE -ray, radio and optical
observations by ground based instruments is crucial for a better understanding of flaring
events and a search for correlations between these energy bands.
One could argue that a continuous all sky monitor in the energy range from 100
GeV14 to several TeV is required. However the only detectors with such capabilities are
Water Cherenkov experiments such as Argo [162] or Milagro [163]. Both experiments have a
rather high energy threshold of several TeV and insufficient sensitivity [62]. The extension of
Milagro to the HAWK observatory will feature an increased sensitivity by a factor of 10 and a
lower energy threshold of 300 GeV (projected). Still the sensitivity will be nearly a factor of
10 worse than that of the MAGIC telescope at 300 GeV. Thus the required time for a
detection of BL Lacertae in a flux state as in 2005 would require 1700 hours, which is not
feasible. In the near future pointed observations with higher sensitivity are thus the only
possibility to study LBL and IBL objects.
The Cherenkov Telescope Array (CTA), a joint project of the H.E.S.S. and MAGIC
Collaborations with a planned increase of sensitivity of a factor of ten over the previous
generations (MAGIC and H.E.S.S. telescopes) will require 100 times less observation time
compared to current generation IACT experiments. It could thus detect BL Lac within only 10
minutes if it is in the same flux state, as it was detected in 2005. A possible observation
strategy could be derived from the experiences that have been made during the monitoring
of bright TeV blazars during twilight with the MAGIC telescope: Evenly spaced short
observation windows of 10 minutes once every few nights, would be sufficient to study the
variability of one of the most prominent blazars. Since CTA also aims to lower the energy
14 The Fermi satellite is projected to reach a maximum energy of 300 GeV, however at limited
statistics due to the small volume of the detector. The required integration time or source flux for a
significant signal is most likely too high to detect flares of sources discussed in this work above 100
GeV.

111
threshold the detection probability can be further improved. The CTA is projected to start its
full operation in 2017.
Meanwhile improvements of the current generation IACTs are underway: The MAGIC
telescope has recently demonstrated the possibility to observe HE -rays above 25 GeV from
the Crab Pulsar from ground [164] with a special trigger setup (the so-called “sum trigger”).
These observations close the gap between ground based and satellite based -ray
observations. However the sensitivity in this energy range still has to be improved and the
test setup has to be integrated into the automatic observation procedure of the MAGIC
telescope. Observations in stereo mode with the MAGIC II system will considerably enhance
the background rejection. A good sensitivity at 25 GeV is crucial for LBL observations due to
their steep energy spectrum in the VHE -ray regime. Also the planned upgrade of the
H.E.S.S. array with a 28m class telescope will significantly lower the energy threshold (30
GeV projected) and increase the sensitivity for low peaked BL Lac objects.
In conclusion it can be expected that the number of detected LBL and IBL objects in
the VHE -ray regime will increase dramatically within the next years due to improvements
in the detection technique and the operation of the next generation IACT experiments. At
the same time already known objects can be studied in more detail, which will ultimately
lead to a better understanding of the non-thermal emission processes of supermassive black
holes in distant AGN.

112

113
6. Appendix
Sequence
Number
Start Time Dura-
tion
[min]
Min
Zd [°]
Max Zd
[°]
Data
rate
[Hz]
Inhomo-
geneity
PSF
[mm]
Average
Cloudiness
[%]
332266 2008-02-01
19:50:54
14.0 27 30 142 15.0 11.6 18.1
333073 2008-02-02
19:54:38
14.5 25 28 164 15.8 14.4 14.3
333691 2008-02-04
19:52:53
18.2 23 27 155 13.6 14.3 0.0
334346 2008-02-05
19:53:54
18.5 22 26 157 14.7 13.7 0.6
335248 2008-02-07
19:55:08
18.3 20 24 146 15.3 13.1 15.3
336658 2008-02-27
20:09:25
15.6 7 7 144 12.2 13.6 16.6
337446 2008-02-29
20:23:25
7.4 7 8 161 12.6 13.2 28.7
Table 9: Crab observations used to determine the sensitivity in twilight. Only sequences with a
mean rate >140 Hz, cloudiness <30% and Inhomogeneity <16 have been selected to ensure good
weather conditions and stable operation of the telescope.

114
Year: 2006
Observation date Observation time [min] Significance Excess events Background events
07-20 47.5 0.43 5.7 128.3
07-26 59.2 -0.03 -0.3 88.3
08-01 18.0 -1.66 -13.3 54.3
08-03 40.4 0.53 5.7 84.3
08-04 57.8 -0.62 -7.3 106.3
08-05 85.4 -1.96 -32.7 222.7
08-06 20.7 -0.71 5.7 45.3
08-20 43.9 0.43 5.3 114.7
08-21 53.8 0.49 6.7 133.3
08-22 108.7 0.36 7 283
08-23 125.0 0.57 12 328
08-24 71.8 0.90 13.7 168.3
08-25 124.4 0.14 2.7 287.3
08-27 115.5 1.77 33.7 256.3
09-16 56.2 0.03 0.3 115.7
09-17 108.6 -0.72 -13 248
09-19 68.5 0.60 8.7 153.3
09-20 58.1 0.31 4 121
09-23 46.0 0.72 9.3 123.7
Table 10: Results of the 2006 observations of BL Lac separated into single days. Three Off-Regions
have been used to determine the background event rate. Excess Events are calculated by
subtracting the normalized Off-Events from the On-Events and can thus also be negative.

115
Year 2007
Observation date Observation time [min] Significance Excess events Background events
06-19 97.2 0.37 6.3 218.7
06-20 94.8 -0.04 -0.7 191.7
06-21 19.6 1.00 7.7 40.3
06-24 117.4 -0.64 -12 268
06-25 102.6 0.35 6 213
07-22 95.0 0.26 4 177
09-06 30.7 0.30 3.3 93.7
09-08 224.4 -0.56 -17.7 751.7
09-09 227.0 0.16 5 758
09-10 234.0 -0.19 -6 740
09-11 219.6 1.19 37.3 716.7
09-12 210.3 -0.81 -24 668
09-13 212.7 1.39 39.3 583.7
09-14 220.1 1.51 47.3 712.7
09-15 174.8 -0.66 -18.3 580.3
09-16 179.6 0.19 5.3 596.7
09-18 160.9 0.88 23.7 536.3
09-20 46.5 0.60 8.7 152.3
10-03 18.0 0.26 2.3 59.7
10-04 112.7 1.77 40 365
10-07 95.3 -0.97 -9.7 313.7
10-10 95.2 0.72 14.7 308.3
10-11 24.6 -1.24 -12.3 79.3

116
10-14 40.1 -0.18 -2.3 120.3
10-15 203.3 0.37 6.3 218.7
Table 11: Significance of individual days of the 2007 BL Lac observation campaign. Excess Events
are calculated by subtracting the normalized Off-Events from the On-Events and can thus also be
negative.
Observation date Duration [min] Significance Excess events Background
events
2005-04-02 17.8 -0.9 -4.5 23.5
2005-04-03 113.0 -0.3 -4 113
2005-04-12 50.6 2.2 17 47
2005-04-29 108.0 -0.7 -10 156
2008-03-15 67.5 -1.2 -18 166
2008-03-16 57.6 -0.3 -4 127
2008-06-08 75.6 0.2 3 214
Table 12: W-Comae Observations with the MAGIC telescope. No significant signal has been
detected during the individual observation nights. Observations in 2005 have been taken in On/Off
mode while 2008 observations have been taken in Wobble mode. Note that for On/Off-
observations the same Off-data has been used for each day and thus the significances cannot be
added quadratically.

117
Observation date Duration [min] Significance Excess events Background events
2007-11-05 160.4 1.4 39 618
2007-11-06 32.0 1.1 14 127
2007-11-12 50.0 0.9 11 127
2007-11-14 44.6 0.0 0 125
2007-11-15 52.8 1.0 14 165
2007-11-16 49.4 2.7 37 131
2007-11-18 51.9 0.5 7 178
2008-04-23 49.1 5.1 290 2564
2008-04-24 47.4 2.3 121 2369
2008-04-25 113.9 2.6 174 3567
Table 13: Summary of 0716 observations from 2007 until 2008 by the MAGIC telescope. The
significance of each individual day is given with the number of excess and background events. On
the 23rd of April 2008 a clear flare has been detected, whilst on the next day the flux was a factor of
≈2 lower (3 confidence level). Observations in 2007 and 2008 have been taken under different
telescope conditions and have thus been analyzed with a different set of -hadron separation cuts
(see text for more details) resulting in different background levels.
Cuts optimized for c1 c2 c3 c4
2007 0.18 0.220256 5.78916 0.0752077
2008, Size < 200 phe 0.18 0.223023 5.46832 0.0818875
2008, Size < 400 phe 0.18 0.19912 5.63479 0.0799926
Standard (time) 0.215 0.215468 5.63973 0.0836169
Table 14: Results of the cut optimization on dataset of Mrk421 (2008) and Mrk501 (2007) in order
to obtain optimal -hadron selection cuts for the 0716 observations with higher zenith angles. An
explanation of the cut parameters can be found in chapter 1.1.3.4. (equations (14), (15)). For
comparison the standard cuts are also given.

118

119
List of Figures
Figure 1: Schematic illustration of the Cherenkov Effect. Following the Huygens Principle
Cherenkov light can be described by the superposition of the elementary waves that the
particle emits from every point along its trajectory. The resulting wave front has a cone
shape. ....................................................................................................................................... 13
Figure 2: Cherenkov light density on the ground (x and y coordinates are given in m). Top:
100 GeV gamma-ray primary particle, bottom: 100 GeV proton primary. The colour scale
denotes the number of Cherenkov photons. Only 5% of the Cherenkov photons are shown.
The detector is positioned directly at the centre of the coordinate system. While the gamma-
ray shower shows a very uniform light pool on the ground, the proton shower is fragmented
into subshowers. Thanks to Dorota Sobczynska for the simulations. ..................................... 16
Figure 3: The MAGIC telescope on the canary island of La Palma at the Roque de los
Muchachos. The site is about 2200 m above sea level. The green structure on the left is the
camera access tower. The position of the camera and the reflector dish are highlighted in the
figure. ....................................................................................................................................... 17
Figure 4: Detection principle of an IACT. Following the result of equation 3 the Cherenkov
angle is in the order of one degree. However since the maximum of a -ray induced air
shower is situated at a height of approximately 8 km (assuming a ground level of 2 km) the
covered effective area of the telescope amounts to 104m2 at zenith. .................................... 20
Figure 5: Illustrative demonstration of the calculation of four important Hillas Image
Parameters in a MAGIC-like camera: Alpha (a measure for the shower orientation), Dist
(which is related to the distance of the shower core to the telescope), Width and Length
(both are characterizing the shape of the shower and can be used to discriminate between
Hadron and Photon induced showers). More details on the calculation of the individual
parameters can be found in the text. ...................................................................................... 25
Figure 6: Distance versus Impact Parameter. For a single Cherenkov Telescope the Distance is
the most important image parameter for the reconstruction of the Impact Parameter below
100 m. ....................................................................................................................................... 28
Figure 7: Time Gradient versus Impact Parameter. The Time Gradient is especially well suited
for the reconstruction of high Impact Parameters (above 100 m). ......................................... 28

120
Figure 8: Explanation of the working principle of the time gradient cut. Every shower is
removed that does not lie within the allowed height region of a -ray shower. .................... 29
Figure 9: The RF-estimated energy versus true MC energy (top) follows a linear relation. The
image at the bottom shows the rms error of the energy estimation versus the estimated
energy. Both images are taken from [19]. ............................................................................... 31
Figure 10: Composite image of the Crab Nebula from [66]. Optical emission is shown in green
and dark blue, infrared emission in red and X-ray emission in light blue. The black star marks
the position of the Crab Pulsar. White crosses denote the position of the VHE -ray excess at
different energies as measured with the MAGIC telescope (see [66] for details). The white
dashed circle indicates the 95% confidence upper limit on the 39% confinement radius of the
-ray emission above 500 GeV. ................................................................................................ 38
Figure 11: Spectral Energy Distribution (SED) of the Crab Nebula in the HE to VHE -ray
domain [66]. Measurements of several experiments on ground and in orbit are shown for
comparison. The gap between 10 GeV and 60 GeV shows the so far unexplored region that
would enable a cross correlation between satellite experiments and ground based
telescopes. ................................................................................................................................ 39
Figure 12: Schematic illustration of the spectral energy distribution of HBL and LBL objects.
The position of the peaks has been highlighted in the energy scale; the flux scale is shown in
arbitrary units. .......................................................................................................................... 42
Figure 13: Results from the optical monitoring of BL Lac from 2003 until 2008. Property of
the Tuorla blazar monitoring program [79]. Except of the 2005 observations the data are not
published. Red points denote the measured optical magnitude of the source in the R-band,
while green points refer to the measured magnitude of the control star used for the
calibration. ................................................................................................................................ 50
Figure 14: Mean discriminator threshold in arbitrary units versus observation time. Twilight
observations were carried out from time index 19:54:00 until 20:09:00. Data taken after
20:10:00 were taken in dark time. As can be seen the thresholds during twilight are stable
around 19. Reloading the thresholds at the beginning of the dark night reduced the
thresholds to a value close to 17. ............................................................................................ 58
Figure 15: Rate in Hz versus observation time from the same observation night as in figure
14. The same time limits for twilight and dark time apply. The overall trend of increasing
rates with time is due to a decrease of the zenith angle. During twilight the average rate is
reduced by 20%. ....................................................................................................................... 59

121
Figure 16: Twilight observations of the Crab Nebula. A strong signal is detected towards the
source. Since no anti-theta cut was used in the analysis, the -ray events of the Crab Nebula
are also visible in the Off-data in the range of 0.15 deg² to 0.35 deg². ................................... 60
Figure 17: Result from the Online Analysis program of a twilight observation from Markarian
501 on October 14th. Even with the reduced sensitivity of the Online Analysis the flare is
clearly visible after only 10 minutes of observation time. ....................................................... 62
Figure 18: Comparison of the reconstructed angular distribution of events from the BL Lac
2005 observations used for the calculation of the significance of the detection. Top: Result
obtained in this work using standard Hillas Parameter cuts and the ν2 parameter. The grey
dotted line defines the signal region. Bottom: Published analysis using the Random Forrest
regression method and the Alpha parameter. The grey dotted line denotes a parabolic fit to
the Off-data. As expected for a point like -ray source at the position of BL Lac an excess is
detected for small values of Alpha and ν2 respectively. The corresponding values of the
significance, excess and background events as well as observation time are given in the
figures. ...................................................................................................................................... 72
Figure 19: Sky maps of analysis A (top) and B (bottom) in arbitrary units (color scale). Each
map is smoothed with a 2-D Gaussian of 0.1°. The axes of analysis A show the Offset from
the coordinates of BL Lac in right ascension and declination (dotted light blue lines indicate
the coordinates in the figure), while the axes of analysis B show right ascension and
declination. The position of the excess is compatible with the catalogue position of BL Lac
(black crosses). The white circles indicate the PSF of the MAGIC telescope. In both cases the
detected signal is consistent with a point source. ................................................................... 73
Figure 20: Top: Differential energy spectrum of the 2005 BL Lac observations calculated as
described in chapter 1.3.5 with analysis A. The grey shaded area denotes the systematic
error of the analysis by using different sets of Hillas parameter cuts. Bottom: Same spectrum
produced with analysis B. The dotted red line corresponds to the Crab Nebula spectrum as
measured by the MAGIC telescope. The solid blue line in both analyses represents the fit of a
power law to the data (results are given in the figures). Both spectra agree well within
statistical errors for the photon index as well as the measured flux. However due to lower
significance of the detection with analysis A the spectrum consists of only four significant
flux points, while the fifth point is consistent with a non detection at this energy range,
depending on the used Hillas parameter cuts. ........................................................................ 74
Figure 21: Resulting ν2 plot of the combined 2006 and 2007 dataset. The denotations are the
same as in figure 18. No significant excess for low values of ν2 has been found and
accordingly an upper limit has been calculated (see text for details). .................................... 76

122
Figure 22: Result of the Online Analysis program of the MAGIC telescope for the 2008 MW
observation of BL Lac. The so called Alpha plot is shown above a Size threshold of 200 phe.
The significance, the gamma rate, the observation time and the MJD at the end of the
observation are given in the figure. For more explanation see text. ...................................... 78
Figure 23: Optical light curves of BL Lac (R-band) corrected for the host galaxy contribution
(1.38 mJy). From top to bottom: 2005, 2006 and 2007 observations. Property of the Tuorla
blazar monitoring program [79]. Except of the 2005 observations the data are not published.
Green filled points denote observations that are within ±1 day of the MAGIC observations.
Data marked with white filled points have been taken without VHE -ray coverage. In the
2007 light curve only observations that are simultaneous with VHE -ray observations are
shown. ...................................................................................................................................... 80
Figure 24: Integrated MAGIC VHE -ray observations of W Comae between 2005 and 2008.
No excess has been found and the corresponding upper limit has been calculated (see text).
.................................................................................................................................................. 84
Figure 25: Lightcurve above 200 GeV of the 2008 W Comae observations by VERITAS and
MAGIC (Veritas data taken from [134]). Observation dates are given in the figure in MJD. The
detection is clearly dominated by a flare at the end of March as observed by Veritas (blue
dots). The MAGIC 95% confidence upper limits of consecutive observations are shown as red
squares with arrows. ................................................................................................................ 86
Figure 26: Combined dataset of the 2007 and 2008 observations of 0716. The observations
have been analyzed separately for each observation period and combined after -hadron
separation cuts. A point like signal with a significance of more than six standard deviations
has been detected. For more details see text.......................................................................... 90
Figure 27: Differential energy spectrum of the 2008 VHE -ray flare of 0716. The individual
data points can be fit by a featureless power law (blue line). The fit results are given in the
figure. The grey area denotes the uncertainty of the data points depending on different data
analysis cuts. ............................................................................................................................. 91
Figure 28: Spectral Energy Distribution of BL Lacertae [125]. The MAGIC VHE -ray points
have been corrected for absorption due to the extragalactic background light using the
Kneiske “Low” EBL model *143+. Simultaneous data from 2005 is marked by filled black
circles, while archival data is shown in grey. The simultaneous data consists of Radio data
taken by UMRAO and Metsähovi, optical data from the Tuorla Blazar monitoring program
[79] and the MAGIC VHE -ray observations. SSC and EC model fits from [140] are shown in a
straight black and grey dotted line respectively. ..................................................................... 94

123
Figure 29: MAGIC light curve of the 2005 BL Lac observations above 200 GeV. The emission is
perfectly consistent with a constant flux ( 2/dof = 16.3/15) as indicated by the horizontal
blue dotted line. The publication by Marscher et al. [144] refers to the short time frame
between the two vertical green lines. ..................................................................................... 96
Figure 30: SED from 0716 optained by AGILE and GASP-WEBT collaborators [115]. Green
circles denote simultaneous observations in September 2007, while blue and red circles
mark archival data. The grey point represents the MAGIC VHE -ray observations during
November 2007, while the black point denotes the flux during the flare in April 2008. The
green line represents a two zone SSC model fit to the data that clearly underestimates the
MAGIC VHE -ray flux. ............................................................................................................ 100

124

125
List of Tables
Table 1: List of the coefficients of the ξ parameter. ................................................................ 26
Table 2: Analysis cut parameters c1 – c4 as given by formulas 14 and 15. The first row shows
the cut values for the analysis of 2005 data that does not include the timing information of
the showers, while the second row shows the values that have been used in 2006 and
onward together with the timing information. The cuts have been optimized on large, low
zenith angle (<30°) Crab Nebula datasets in order to optimize ·log(Excess) of the Crab
Nebula. ..................................................................................................................................... 27
Table 3: Summary of LBL and IBL candidate sources. The classification (LBL or IBL), the fluxes
and spectral indices as measured by EGRET and AGILE are given with the corresponding
references. ................................................................................................................................ 45
Table 4: Calculated fluxes and significances of the MAGIC observations of 0716 in 2007 and
2008. ......................................................................................................................................... 90
Table 5: Summary of the obtained Doppler factor and magnetic field from different model
fits for BL Lacertae. The references are given in the table. ..................................................... 95
Table 6: Summary of the results of various model fits to the W Comae data. The references
are given in the last column. .................................................................................................... 97
Table 7: Results of two model fits to the SED of 0716. A more detailed discussion can be
found in the text. .................................................................................................................... 100
Table 8: Summary of Doppler factors, magnetic field strength and size of the emission region
as assumed for different model calculations for the sources discussed in this thesis work.
Main model characteristics (SSC, EC and SPB models) with the proper reference for each
model are given in the table. The size of the emission region in units of 1015 cm has been
calculated using formula 18 with the Doppler factor given by each model. More discussions
can be found in the text. ........................................................................................................ 105
Table 9: Crab observations used to determine the sensitivity in twilight. Only sequences with
a mean rate >140 Hz, cloudiness <30% and Inhomogeneity <16 have been selected to ensure
good weather conditions and stable operation of the telescope.......................................... 113
Table 10: Results of the 2006 observations of BL Lac separated into single days. Three Off-
Regions have been used to determine the background event rate. Excess Events are
126
calculated by subtracting the normalized Off-Events from the On-Events and can thus also be
negative. ................................................................................................................................. 114
Table 11: Significance of individual days of the 2007 BL Lac observation campaign. Excess
Events are calculated by subtracting the normalized Off-Events from the On-Events and can
thus also be negative. ............................................................................................................. 116
Table 12: W-Comae Observations with the MAGIC telescope. No significant signal has been
detected during the individual observation nights. Observations in 2005 have been taken in
On/Off mode while 2008 observations have been taken in Wobble mode. Note that for
On/Off-observations the same Off-data has been used for each day and thus the
significances cannot be added quadratically. ........................................................................ 116
Table 13: Summary of 0716 observations from 2007 until 2008 by the MAGIC telescope. The
significance of each individual day is given with the number of excess and background
events. On the 23rd of April 2008 a clear flare has been detected, whilst on the next day the
flux was a factor of ≈2 lower (3 confidence level). Observations in 2007 and 2008 have
been taken under different telescope conditions and have thus been analyzed with a
different set of -hadron separation cuts (see text for more details) resulting in different
background levels. .................................................................................................................. 117
Table 14: Results of the cut optimization on dataset of Mrk421 (2008) and Mrk501 (2007) in
order to obtain optimal -hadron selection cuts for the 0716 observations with higher zenith
angles. An explanation of the cut parameters can be found in chapter 1.1.3.4. (equations
(14), (15)). For comparison the standard cuts are also given. ............................................... 117

127
Abbreviations
0716: S5 0716+714
AGN: Active Galactic Nucleus
AMC: Automatic Mirror Control
BL Lac: BL Lacertae
Cangaroo: Collaboration of Australia and Nippon (Japan) for a Gamma Ray Observatory in
the Outback
CGRO: Compton Gamma Ray Observatory
dof: degrees of freedom
DT: Discriminator Threshold
EBL: Extragalactic Background Light
EC: External inverse Compton
EGRET: Energetic Gamma Ray Experiment Telescope
FADC: Fast Analogue Digital Converter
FOV: Field Of View
GC: Galactic Centre
GRB: Gamma Ray Burst
HAWK: High Altitude Water Cherenkov
HBL: High peaked BL Lac
HE: High Energy (20 MeV – 100 GeV)
H.E.S.S.: High Energy Stereoscopic System
HPD: Hybrid Photodiode
IACT: Imaging Atmospheric Cherenkov Telescope

128
IBL: Intermediately peaked BL Lac
IPRC: Individual Pixel Rate Control
LBL: Low peaked BL Lac
MAGIC: Major Atmospheric Gamma-Ray Imaging Cherenkov
MC: Monte Carlo
MSSM: minimal standard supersymetric model
MW: multiwavelength
NSB: Night Sky Background
PMT: Photon Multiplier Tube
PSF: Point Spread Function
PWN: Pulsar Wind Nebula
QE: Quantum Efficiency
RF: random forest
RMS: root mean squared
RXTE: Rossi X-Ray Timing Explorer
SED: Spectral Energy Distribution
SNR: Super Nova Remnant
SPB: Synchroton Proton Blazar
VCSELs: Vertical Cavity Surface Emitting Lasers
VERITAS: Very Energetic Radiation Imaging Telescope Array System
VHE: Very High Energy (E > 100 GeV)
VLBA: Very Long Baseline Array
WEBT: Whole Earth Blazar Telescope
WIMP: Weakly Interacting Massive Particle

129
References:
[1] Cherenkov, P. A., Dokl. Akad. Nauk, SSSR, 2: 451, 1934.
[2] Klassische Elektrodynamik, Jackson, J., D., de Gruyter, 2. Auflage, 1982.
[3] Teilchen und Kerne, Frauenfelder, H., Henley, E., M., Oldenbourg, 1987.
[4] Natural limit to the /hadron separation for a stand alone air Cherenkov telescope,
Sobczynska, D., J. Phys. G: Nucl. Part. Phys. 34, 2279-2288, 2007.
[5] First ground based measurement of atmospheric Cherenkov light from cosmic rays,
Aharonian, F., et al. (H.E.S.S. Collaboration), Phys.Rev. D75, 042004, 2007.
[6] The Surface Detector System of the Pierre Auger Observatory, Allekotte, I., et al. for
the Pierre Auger Collaboration, accepted for publication in Nuclear Inst. and Methods
in Physics Research, 2007. Preprint available: arXiv:0712.2832.
[7] Baixeras, C., et al. , Nucl. Instrum. Methods Phys, Res. A, 518, 188, 2004.
[8] Cortina, J., et al. (MAGIC Collaboration), Proc. 29th Int. Cosmic Ray Conf. (Pune), 5,
359, 2005.
[9] The mirrors for the MAGIC telescope, Bastieri, D., et al (MAGIC Collaboration), Proc.
29th Int. Cosmic Ray Conf. (Pune), 2005.
[10] A Measurement of the Photon Detection Efficiency of Silicon Photomultipliers, Otte,
A. N., et al., Nucl. Instr. and Methods in Physics Research A, 545, 705-715, June 2005.
[11] The MAGIC Telescope: development of new technologies and first observations,
Paneque, D., PhD thesis, Technische Universität München, 2004.
[12] Gaug, M., et al. (MAGIC Collaboration), Proc. 29th Int. Cosmic Ray Conf. (Pune), 5, 375,
2005.
[13] Image Cleaning study, Bretz, T., internal document:
www.astro.uni-wuerzburg.de/wiki, 2007.
[14] Improving the performance of the single-dish Cherenkov telescope MAGIC through
the use of signal timing, Aliu, E., et al. (MAGIC Collaboration), Astropart. Phys. 30,
293, 2009.

130
[15] Optimization of cleaning levels for Moon observations, Zapatero, J., Font, L., internal
document, 2007.
[16] Cherenkov light images of EAS produced by primary gamma, Hillas, A., M.,
Proceedings of the International Cosmic Ray Conference, vol. 3, p. 445-448, 1985.
[17] Bretz, T., et al., in AIP Conf. Proc., 745, High-Energy Gamma-Ray Astronomy, ed.
Aharonian, F. A., Völk, J. H. & Horns, D. (New York: AIP), 730, 2005.
[18] A systematic study of the interdependence of IACT image parameters, Riegel, B., et
al. for the MAGIC Collaboration, Proc. 29th Int. Cosmic Ray Conf., Pune, 2005.
[19] Implementation of the Random Forest Method for the Imaging Atmospheric
Cherenkov Telescope MAGIC, J. Albert et al. (MAGIC Collaboration), Nucl. Instr. Meth.
A, 588, 424, 2008.
[20] Spektrum des Krabbennebels im Gamma-Bereich (German), Berger, K., diploma
thesis, Institut für Theoretische Physik und Astrophysik, Julius-Maximilians-
Universität Würzburg, 2005.
[21] Analysis methods for results in gamma-ray astronomy, Li, T.-P., Ma, Y.-Q., ApJ 272,
317-324, 1983.
[22] Bretz, T.: http://astro.uni-wuerzburg.de/mars
[23] Observations of the Active Galactic Nucleus 1ES1218+304 with the MAGIC telescope,
Bretz, T., PhD thesis, Universität Würzburg, 2006.
[24] Hess, V., Phys. Z., 13, 1084, 1913.
[25] http://www.auger.org/
[26] http://pamela.roma2.infn.it/index.php
[27] http://www.physics.adelaide.edu.au/astrophysics/hires/index.html
[28] http://atic.phys.lsu.edu/aticweb/
[29] Abraham, J., et al (Pierre Auger Collaboration), Science, 318, 938, 2007.
[30] Direct Measurements, Acceleration and Propagation of Cosmic Rays, Blasi, P.,
Rapporteur Paper for the OG1 session of the 30th Int. Cosm. Ray Conf. (ICRC),
Merida, Mexico, 2007.

131
[31] Five-Year Wilkinson Microwave Anisotropy Probe (WMAP) Observations:
Cosmological Interpretation, Komatsu, E., et al., Astrophys J. Suppl., 180, 330 – 376,
2009.
[32] A direct empirical proof of the existence of dark matter, Clowe, D., et al., Astrophys.
J., 648, L109 – L113, 2006.
[33] Upper limit for gamma-ray emission above 140 GeV from the dwarf spheroidal galaxy
Draco, Albert, J., et al. (MAGIC Collaboration), Astrophys. J. 679, 428, 2008.
[34] Supersymmetric dark matter, Jungman, G., et al., Phys. Rept., 267, 195 – 373, 1996.
[35] Non-baryonic dark matter: Observational evidence and detection methods,
Bergström, L., Rept. Prog. Phys., 63, 793, 2000.
[36] Particle dark matter: Evidence, candidates and constraints, Bertone, G., et al., Phys.
Rept., 405, 279 – 390, 2005.
[37] Dark Matter Candidates: A Ten-Point Test, Taoso, M., et al., JCAP, 0803, 022, 2008.
[38] Fermi Observations of High-Energy Gamma-Ray Emission from GRB 080916C, Abdo,
A., A., et al. (Fermi LAT and GBM Collaborations), Science, 323, 1688C, 2009.
[39] Milagro Constraints on Very High Energy Emission from Short Duration Gamma-Ray
Bursts, Abdo, A., A., et al. (Milagro Collaboration), ApJ, 666, 361A, 2007.
[40] MAGIC upper limits on high energy emission from GRBs, Albert, J., et al. (MAGIC
Collaboration), ApJ, 667, 358, 2007.
[41] H.E.S.S. observations of gamma-ray bursts in 2003-2007, Aharonian, F., et al. (H.E.S.S.
Collaboration), A&A, 495, 505, 2009.
[42] Mészáros, P., Rept. Prog. Phys., 69, 2259 – 2322, 2006.
[43] Probing quantum gravity using photons from a flare of the active galactic nucleus
Markarian 501 observed by the MAGIC telescope, Albert, J. et al. (MAGIC
Collaboration), Phys. Lett. B, 668, 253, 2008.
[44] The Cosmic Infrared Background: Measurements and Implications, Hauser, M., G.,
Dwek, E., Ann. Rev. Astron. Astrophys., 39, 249, 2001.
[45] Kneiske, T., M., et al., Astron. Astrophys., 386, 1, 2002.
[46] Kneiske, T., M., et al., Astron. Astrophys., 413, 807, 2004.

132
[47] Very high energy gamma rays from a distant Quasar: How transparent is the
Universe? Albert, J., et al. (MAGIC Collaboration), Science, 320, 1752, 2008.
[48] A low level of extragalactic background light as revealed by gamma-rays from blazars,
Aharonian, F., et al. (HESS Collaboration), Nature, 440, 1018 – 1021, 2006.
[49] A massive binary black-hole system in OJ287 and a test of general relativity, Valtonen,
M., J. et al., Nature, 452, 851V, 2008.
[50] Implications of a possible 23 day periodicity for binary black hole models in Mkn 501,
Rieger, F. M. and Mannheim, K., Astron. Astrophys. 359, 948, 2000.
[51] A periodicity of 1 hour in X-ray emission from the active galaxy RE J10341396,
Gierlin´ski, M., et al., Nature, 455, 369, 2008.
[52] Hofmann, W., Proc. 28th Int. Cosmic Ray Conf., Tsukuba, 2811, 2003.
[53] Gamma-ray Astronomy, Hinton, J., 30th Int. Cosmic Ray Conf. (Merida), 2007, preprint
available: arxiv:0712.3352
[54] VHE -ray Sky Map and Source Catalog, Wagner, R.,
http://www.mppmu.mpg.de/~rwagner/sources/
[55] The H.E.S.S. survey of the inner Galactic plane, Hoppe, S., for the H.E.S.S.
Collaboration, Proc. 30th Intl. Cosmic Ray Conf. (Merida), 2007.
[56] Discovery of very high energy gamma-rays associated with an X-ray binary,
Aharonian, F., et al. (H.E.S.S. Collaboration), Science, 309, 746-749, 2005.
[57] Discovery of the Binary Pulsar PSR B1259-63 in Very High Energy Gamma Rays around
Periaston with H.E.S.S., Aharonian, F., et al. (H.E.S.S. Collaboration), A&A, 439, 1013,
2005.
[58] Variable Very High Energy Gamma-ray emission from the Microquasar LS I +61 303,
Albert, J., et al. (MAGIC Collaboration), Science, 312, 1771-1773, 2006.
[59] Very High Energy Gamma-Ray Radiation from the Stellar Mass Black Hole Binary
Cygnus X-1, Albert, J., et al. (MAGIC Collaboration), ApJL, 665, L51, 2007.
[60] TeV Gamma-Ray Astrophysics, Ribó, M., Frascati Workshop on “Multifrequency
Behaviour of High Energy Cosmic Sources”, Vulcano, Italy, ChJAA, in press, 2007,
preprint available: arxiv:0801.2906v1

133
[61] High-(Energy)-Lights – The Very High Energy Gamma-Ray Sky, Horns, D., to appear in
Reviews of Modern Astronomy, preprint available: arvix:0808.3744
[62] Very High Energy Astrophysics, De Angelis, A., Mansutti, O., Persic, M., La Rivista del
Nuovo Cimento , 31, n.4, 187, 2008.
[63] H.E.S.S. Observations and VLT Spectroscopy of PG 1553+113, Aharonian, F., et al
(H.E.S.S. Collaboration), A&A, 477, 481-489, 2008.
[64] Observation of TeV gamma rays from the Crab Nebula using the Atmospheric
Cherenkov Imaging Technique, Weeks, T. C., et al, ApJ, 377, 379, 1989.
[65] Collins, G. W. II, Claspy, W. P., Martin, J. C., PASP, 111, 871, 1999.
[66] VHE Gamma-Ray Observation of the Crab Nebula and its Pulsar with the MAGIC
telescope, Albert, J., et al. (MAGIC Collaboration), APJ, 674, 1046, 2008.
[67] Punch, M., et al., Nature, 358, 477, 1992.
[68] Observations of Mkn 421 with the MAGIC Telescope, Albert, J., et al. (MAGIC
Collaboration), ApJ, 663, 892, 2007.
[69] Urry, C. M., Padovani, P., Publ. Astron. Soc. Pacific, 107, 803, 1995.
[70] Giommi, P. & Colafrancesco, S., Proc. Of Gamma Wave 2005, Exp. A., 30, 21, 2006.
[71] http://glast.gsfc.nasa.gov
[72] Maraschi , L, et al, ApJ, 397, 5, 1992.
[73] Bloom, S. D. & Marscher, A. P. , ApJ, 461, 657, 1996.
[74] Dermer, C. D. & Schlickeiser, R., ApJ, 416, 458, 1993.
[75] Mannheim, K., A&A, 269, 67, 1993.
[76] MAGIC observations of a 13-day flare complex in M87 in February 2008, Albert, J., et
al. (MAGIC Collaboration), ApJ letters, 685, L23, 2008.
[77] The Deep X-Ray Radio Blazar Survey (DXRBS). III. Radio Number Counts, Evolutionary
Properties, and Luminosity Function of Blazars, Padovani, P., Giommi, P., Landt, H.,
Perlman, E. S., 2007.
[78] A theoretical unifying scheme for gamma-ray bright blazars, Ghisellini, G., et al.,
MNRAS, 301, 451G, 1998.

134
[79] Optical lightcurves of Blazars: http://users.utu.fi/kani/1m/index.html
[80] BL Lac: A New Ultrahigh-Energy Gamma-Ray Source, Neshpor, Yu., I., et al. (Crimean
Group), Astr. Reports, 45, 4, 249-254, 2001.
[81] The Spectrum And Magnitude Of The Galaxy Associated With BL Lacertae, Miller, J.,
S., et al., ApJ, 219, 85, 1978.
[82] Wu, X.-B., et al., A&A, 389, 742, 2002.
[83] Sambruna, R., M., et al., ApJ, 515, 140, 1999.
[84] Denn, G., R., et al., ApJS, 129, 61, 2000.
[85] Tateyama, C., E., et al., ApJ, 500, 810, 1998.
[86] Hardee, P., E., ApJ, 318, 78, 1987.
[87] Villata, M., et al., A&A, 424, 497, 2004.
[88] Discovery of a precessing jet nozzle in BL Lacertae, Stirling, A., M., et al., MNRAS, 341,
405-422, 2003.
[89] Is the Radio Core of BL Lac Precessing? Mutel, R., L., Denn, G., R., Astrophys. J., 623,
79-84, 2005.
[90] Detection of Gamma Rays with E>100 MeV from BL Lacertae, Catanese, M., et al.,
ApJ, 480, 562, 1997.
[91] Observations of a Correlated Gamma-Ray and Optical Flare for BL Lacertae, Bloom, S.,
D., et al., ApJ, 490, L145, 1997.
[92] Kranich, D., et al. (HEGRA Collaboration), ASP Conf. Proc., Vol. 299, High Energy Blazar
Astronomy, ed. L. O. Takalo & E. Valtaoja (San Fransisco: ASP), 3, 2003.
[93] Catanese, M., et al., ApJ, 480, 562, 1997.
[94] Aharonian, F., et al. (HEGRA Collaboration), A&A, 421, 529, 2004.
[95] Horan, D., et al., ApJ, 603, 51, 2004.
[96] Rapid Optical Variability of the Source PKS 1514-24, Biraud, F., Nature, 232, 178B,
1971.
[97] Worral, D., M. and Wilkes, B., J., ApJ, 360, 396, 1990.

135
[98] Tagliaferri, G., et al., A&A, 354, 431, 2000.
[99] Massaro, E., et al., A&A, 342, L49, 1999.
[100] Hartman, R., C., et al., ApJS, 123, 79, 1999.
[101] Dingus, B., L., and Bertsch, D., L., AIPC, 587, 251, 2001.
[102] Kerrick, A., D., et al., ApJ, 452, 588, 1995.
[103] Horan, D., et al., ApJ, 603, 51, 2004.
[104] Scalzo, R., A., et al., ApJ, 607, 778, 2004.
[105] Kühr, H., et al., A&A, 45, 367, 1981.
[106] Biermann, P., L., et al., ApJ, 247, L53, 1981.
[107] Nesci, R., et al., AJ, 130, 1466, 2005.
[108] Nilsson, K., et al., A&A, 487, 2, L29, 2008.
[109] Wagner, S., J., et al., AJ, 111, 2187, 1996.
[110] Ostorero, L., et al., A&A, 451, 797, 2006.
[111] Quirrenbach, A., et al., ApJ, 372, L71, 1991.
[112] Wager, S., et al., ARA&A, 33, 163, 1995.
[113] Qian, S.-J., Chin. A&A, 20, 1, 20, 15, 1996.
[114] Hartman, R., C., et al., ApJS, 123, 79, 1999.
[115] AGILE detection of variable -ray activity from the blazer S5 0716+714 in September –
October 2007, Chen, A., W., et al. (AGILE Collaboration), A&A, 489L, 37C, 2008.
[116] Observations of Very High Energy Gamma-Rays during Moonlight and Twilight with
the MAGIC Telescope, Rico, J., et al., for the MAGIC Collaboration, Proc. 30th Int.
Cosmic Ray Conf., Merida, 2007.
[117] Telescope Operation Manual, Cortina, J., internal document, 2007.
[118] Variable VHE gamma-ray emission from Markarian 501, Albert, J., et al. (MAGIC
Collaboration), ApJ, 669, 2, 862, 2007.
136
[119] An Exceptional VHE Gamma-Ray Flare of PKS 2155-304, Aharonian, F., et al. (H.E.S.S.
Collaboration), ApJ, 664, L71, 2007.
[120] Observations of the Naked-Eye GRB 080319B: Implications of Nature’s Brightest
Explosion, Bloom, J., S., et al., ApJ, in press, pre print available: arXiv:0803.3215
[121] GRB 080319B: A Naked-Eye Stellar Blast from the Distant Universe, Racusin, J., L., et
al., Nature, in press, preprint available: arXiv:0805.1557
[122] VERITAS observes Mrk421 in a high flaring state, Swordy, S., et al. (VERITAS
Collaboration), ATel#1506, http://www.astronomerstelegram.org/?read=1506
[123] Measurement of VHE -ray emission from four blazars using the MAGIC telescope
and a comparative blazar study, Wagner, R., PhD thesis, Technische Universität
München, 2006.
[124] Observation of Very-High-Energy Gamma-Rays from Blazars with the MAGIC
Telescope, Hayashida, M., PhD thesis, LMU München, 2008.
[125] Discovery of Very High Energy Gamma-Ray Emission from the Low-Frequency-peaked
BL Lacertae Object BL Lacertae, Albert, J., et al. (MAGIC Collaboration), ApJ Lett., 666,
L17, 2007.
[126] Neshpor, Y., I., et al (Crimean Group), Astronom. Lett., 24, 134, 1998.
[127] Daum, A., et al., AstroPart. Phys., 8, 1, 1997.
[128] Rolke, W., et al., Nucl. Instrum. Meth., A551, 493, 2005.
[129] http://heasarc.gsfc.nasa.gov/docs/xte/XTE.html
[130] http://heasarc.gsfc.nasa.gov/docs/swift/swiftsc.html
[131] http://www.to.astro.it/blazars/webt/
[132] http://www.vlba.nrao.edu/
[133] Online Analysis, Zanin, R., et al., internal document, MAGIC-TDAS 08-01, 2008.
[134] VERITAS Discovery of >200GeV Gamma-ray Emission from the Intermediate-
frequency BL Lac Object W-Comae, Acciari, V., A., et al. (VERITAS Collaboration), ApJL
in press, pre print available: arXiv:0808.0889
[135] Swordy, S., et al. (VERITAS Collaboration), ATel#1422,
http://www.astronomerstelegram.org/?read=1422

137
[136] Swordy, S., et al. (VERITAS Collaboration), ATel#1565,
http://www.astronomerstelegram.org/?read=1565
[137] F. Verreccia, et al. (AGILE Collaboration), ATel#1582,
http://www.astronomerstelegram.org/?read=1582
[138] MAGIC discovers VHE gamma ray emission from the blazar S50716+714, Teshima, M.,
et al. (MAGIC collaboration), ATel#1500,
http://www.astronomerstelegram.org/?read=1500
[139] Cosmic-Ray Events as Background in Imaging Atmospheric Cherenkov Telescopes,
Maier, G., Knapp, J., Astroparticle Physics, 28, 1, 72-81, 2007.
[140] Ravasio, M., et al., A&A, 383, 763, 2002.
[141] Beacons at the gamma ray horizon, Mannheim, K., et al., A&A, 315, 77M, 1996.
[142] Böttcher, M. and Reimer, A., Astrophys. J., 609, 576-588, 2004.
[143] Kneiske, T., M., et al., A&A, 413, 807, 2004.
[144] The inner jet of an active galactic nucleus as revealed by a radio-to- -ray outburst,
Marscher, A., P., et al., Nature, 452, 06895, 2008.
[145] Böttcher, M., et al., ApJ, 581, 143, 2002.
[146] Swift detection of the brightest X-ray flare from S50716+714, Giommi, P., et al.,
ATel#1495, http://www.astronomerstelegram.org/?read=1495
[147] S5 0716+71: polarimetric activity during outburst, Larionov, V., et al., ATel#1502,
http://www.astronomerstelegram.org/?read=1502
[148] Tavecchio, F., Ghisellini, G., MNRAS in press, preprint available: arXiv:0811.1883v1
[149] Swordy, S., et al. (VERITAS Collaboration), ATel#1753,
http://www.astronomerstelegram.org/?read=1753
[150] VERITAS Observations of a Very High Energy Gamma-ray Flare from the Blazar 3C
66A, Acciari, V., A., et al (Veritas Collaboration), Astrophys. Let., in press, preprint
available: arXiv:0901.4527
[151] Black-hole masses of distant quasars, Vestergaard, M., invited contribution to the
2007 Spring Symposium on "Black Holes" at the Space Telescope Science Institute,
proceedings, published by Cambridge University Press, are in press.

138
[152] Implications of very rapid TeV variability in blazars, Begelman, M., C., et al., MNRAS,
384L, 19B, 2008.
[153] Tavecchio, F., Ghisellini, G., MNRAS 385, 98, 2008.
[154] Ghisellini, G., et al., TeV variability in blazars: how fast can it be? MNRAS in press,
preprint available: arXiv:0810:5555
[155] Day-Scale Variability of 3C 279 and Searches for Correlations in Gamma-Ray, X-Ray,
and Optical Bands, Hartman, R., C., et al., ApJ, 558, 583H, 2001.
[156] Multi-Epoch Multiwavelength Spectra and Models for Blazar 3C 279, Hartman, R., C.
and Boettcher, M., et al., ApJ, 553, 683H, 2001.
[157] Does The Blazar Gamma-Ray Spectrum Harden With Increasing Flux ? - Analysis Of
Nine Years Of EGRET Data, Nandikotkur, G., et al., ApJ, 657, 706, 2007.
[158] Aharonian, F., et al. (HEGRA Collaboration), A&A, 393, 89, 2002.
[159] Albert, J., et al. (MAGIC Collaboration), Astrophys. J, 648, 105, 2006.
[160] Madejski, G., M., et al., ApJ, 521, 145, 1999. [161]
http://kibo.jaxa.jp/en/experiment/ef/maxi/
[162] The Argo-YBJ Experiment, INFN Roma 3:
http://193.204.162.110/~nucleare/argo/argo.html
[163] The MILAGRO Gamma-Ray Observatory, LANL: http://www.lanl.gov/milagro
[164] Observation of Pulsed -Rays Above 25 GeV From the Crab Pulsar with MAGIC, Aliu,
E., et al. (MAGIC Collaboration), Science, 322, pg. 1221-1224, 2008.
[165] Observations of PG 1553+113 with the MAGIC telescope, Dorner, D., PhD thesis,
Universität Würzburg, 2008.
[166] Status of the VERITAS Observatory, Holder, J., et al. (VERITAS Collaboration), Proc.
Gamma 2008, Heidelberg, in press, pre print available: arXiv:0810.0474
[167] Acciari, V., et al. (VERITAS Collaboration), Astrophys. J, 690L, 126A, 2009.
139
Publication List
The publications are ordered by publication date, starting from the most recent one. The
most important publications are underlined.
1. Search for VHE Gamma-ray Emission from the Globular Cluster M13 with the MAGIC
Telescope
H. Anderhub et al., submitted to Astrophys. J. (2009)
2. Simultaneous Multiwavelength Observations of Markarian 421 During Outburst
V. A. Acciari et al., submitted to Astrophys. J. (2009)
3. Discovery of VHE gamma-ray emission of the Intermediate peaked BL Lac object S5
0716+714
E. Aliu, et al., in preparation (2009)
4. MAGIC upper limits to the VHE flux of 3C454.3 in high emission state
E. Aliu et al., Astron. & Astrophys. in press (2009)
5. Discovery of a VHE gamma-ray signal from the 3C66A/B region
E. Aliu et al., AstrophysJ. Lett., 692 (2009) 29
6. Improving the performance of the single-dish Cherenkov telescope MAGIC through
the use of signal timing
E. Aliu et al., Astropart. Phys. 30 (2009) 293
7. MAGIC upper limits on the VHE gamma-ray emission from the satellite galaxy Wilman
1
E. Aliu et al., Astrophys. J. submitted (2008)
8. Observation of Pulsed -Rays Above 25 GeV From the Crab Pulsar with MAGIC
E. Aliu et al., Science, 322 (2008) 1221.
9. The June 2008 Flare of Markarian 421 from the Optical to TeV Energies
I. Donnarumma et al, to Astrophys. J. Lett., 691, L13 (2008).
10. Observations Of BL Lacertae With The MAGIC Telescope
K. Berger, R. Wagner, M. Hayashida, D. Kranich, E. Lindfors, E. Lorenz, V. Vitale for the
MAGIC Collaboration, Proc. Gamma 2008 (Heidelberg), AIP in press (2008)

140
11. Very-High-Energy -Ray Observations of a Strong Flaring Activity in M87 in 2008
February
D. Mazin, D. Tescaro, R. M. Wagner, K. Berger and N. Galante on behalf of the MAGIC
Collaboration, Proc. Gamma 2008 (Heidelberg), AIP in press (2008)
12. Monitoring of the Radio Galaxy M87 with the MAGIC Telescope
K. Berger, D. Mazin, D. Tescaro, R. M. Wagner for the MAGIC Collaboration, Proc.
Workshop on Blazar Variability across the Electromagnetic Spectrum (Paris),
PoS(BLAZARS2008) 028 (2008)
13. First Bounds on the High-Energy Emission from Isolated Wolf-Rayet Binary Systems
E. Aliu et al., Astrophys. J. Lett., 685, L71 (2008)
14. Very high energy gamma rays from a distant Quasar: How transparent is the
Universe?
J. Albert et al., Science, 320 (2008) 1752
15. Periodic Very High Energy -Ray Emission From LS I+61 303 Observed With The
MAGIC Telescope
J. Albert et al., Astrophys. J. subm. (2008)
16. Very-High-Energy -Ray Observations of a Strong Flaring Activity in M 87 in February
2008
J. Albert et al., Astrophys. J. Lett., 685, L23 (2008)
17. MAGIC Observations of PG 1553+113 during a Multi-Wavelength Campaign in July
2006
J. Albert et al., Astron. Astrophys., 493, 467 (2009)
18. Multi-wavelength (radio, X-ray and gamma-ray) observations of the gamma-ray
binary LS I +61 303
J. Albert et al., Astrophys. J. 684 (2008) 1351
19. Systematic search for VHE gamma-ray emission from X-ray bright high-frequency BL
Lac objects
J. Albert et al., Astrophys. J. 681, 944 (2008)
20. Simultaneous multiwavelength observations of the blazar 1ES1959+650 at a low TeV
flux
G. Tagliaferri et al., Astrophys. J. 679, 1029 (2008)

141
21. Upper limit for gamma-ray emission above 140 GeV from the dwarf spheroidal galaxy
Draco
J. Albert et al., Astrophys. J. 679, 428 (2008)
22. Implementation of the Random Forest Method for the Imaging Atmospheric
Cherenkov Telescope MAGIC
J. Albert et al., Nucl. Instr. Meth. A 588, 424 (2008)
23. MAGIC Observations of the unidentified Gamma-ray source TeV J2032+4130
J. Albert et al., Astrophys. J. 675, L25 (2008)
24. VHE Gamma-Ray Observation of the Crab Nebula and Pulsar with MAGIC
J. Albert et al., Astrophys. J. 674 (2008) 1037
25. Probing quantum gravity using photons from a flare of the active galactic nucleus
Markarian 501 observed by the MAGIC telescope
J. Albert et al. (MAGIC Collaboration) and John Ellis, N.E. Mavromatos, D.V.
Nanopoulos, A.S. Sakharov, E.K.G. Sarkisyan,Phys. Lett. B, 668, 253 (2008)
26. Unfolding of differential energy spectra in the MAGIC experiment
J. Albert et al., Nucl. Instr. Meth. A 583, 494 (2007)
27. Discovery of Very High Energy gamma-rays from 1ES1011+496 at z=0.212
J. Albert et al., Astrophys. J. Lett. 667, L21 (2007)
28. Observation of VHE gamma-rays from Cassiopeia A with the MAGIC telescope
J. Albert et al., Astron. Astrophys. 474, 937 (2007)
29. Discovery of VHE Gamma Radiation from IC 443 with the MAGIC Telescope
J. Albert et al., ApJ Lett. 664 (2007) L87
30. Very high gamma-ray observations during moonlight and twilight with the MAGIC
telescope
J. Albert et al., Astropart. Phys. subm. (2007)
31. Constraints on the steady and pulsed VHE gamma-ray emission from observation of
PSR B1951+32/CTB 80 with the MAGIC Telescope
J. Albert et al., Astrophys. J. 669 (2007) 1143
32. MAGIC upper limits on high energy emission from GRBs
J. Albert et al., Astrophys. J. 667 (2007) 358
33. FADC Signal reconstrution for the MAGIC telescope
J. Albert et al., Nucl. Instr. Meth. A 594 (2008) 407

142
34. Variable VHE gamma-ray emission from Markarian 501
J. Albert et al., ApJ 669 (2007) 862
35. Discovery of Very High Energy Gamma-Ray Emission from the Low-Frequency-peaked
BL Lacertae Object BL Lacertae
J. Albert et al., ApJ Lett. 666 (2007) L17
36. Discovery of very high energy gamma-ray emission from the LBL object BL Lacertae
M. Hayashida, K. Berger, E. Lindfors, et al., for the MAGIC Collaboration, Proc. 30th
Int. Cosmic Ray Conf. (2007, Merida)
37. Very High Energy Gamma-Ray Radiation From The Stellar-Mass Black Hole Cygnus X-1
J. Albert et al., Astrophys. J. Lett. 665 (2007) L51
38. Observations of Mkn 421 with the MAGIC Telescope
J. Albert et al., ApJ 663 (2007) 125
39. Results of two observation cycles of LS I+61°303 with the MAGIC telescope
Berger, Karsten; Sidro, Nuria; Bosch-Ramon, Valentí; Cortina, Juan; Jogler, Tobias;
Paredes, Joseph M.; Perez Torres, Mighel; Ribó, Marc; Rico, Javier; Torres, Diego F.;
MAGIC Collaboration, AN, 328 (2007) 623B
40. Discovery of VHE -rays from BL Lacertae with the MAGIC telescope
Berger, Karsten; Hayashida, Masaaki; Kranich, Daniel; Lindfors, Elina; Lorenz, Eckhart;
Vitale, Vicenzo; Wagner, Robert; MAGIC Collaboration, AN, 328 (2007) 622B
41. Observation of very high energy gamma rays from the AGN 1ES 2344+514 in a low
emission state with the MAGIC telescope
J. Albert et al., ApJ 662 (2007) 892
42. First bounds on very high energy gamma-ray emission from Arp 220
J. Albert et al., ApJ 658 (2007) 245
43. Detection of VHE radiation from the BL Lac PG 1553+113 with the MAGIC telescope
J. Albert et al., ApJ Letters 654 (2007) L119 - L122
44. Discovery of very high energy gamma-rays from Markarian 180 triggered by an
optical outburst
J. Albert et al., ApJ Letters 648 (2006) L105 - 108
45. Variable Very High Energy Gamma-ray Emission from the Microquasar LSI +61 303
J. Albert et al., Science 312, 1771 (2006)
143
46. Discovery of VHE gamma-ray emission from 1ES1218+30.4
J. Albert et al., ApJ Letters 642, L119 (2006)
47. Observation of VHE gamma radiation from HESS J1834-087/W41 with the MAGIC
telescope
J. Albert et al., ApJ Letters 643, L53 (2006)
48. MAGIC Observations of very high energy gamma-rays from HESS J1813-178
J. Albert et al., ApJ Letters 637, L41 (2006)
49. Flux upper limit of gamma-ray emission by GRB050713a from MAGIC Telescope
observations
J. Albert et al., ApJ Letters 641, L9 (2006)
50. Observation of Gamma Rays from the Galactic Center with the MAGIC telescope
J. Albert et al., ApJ Letters 638, L101 (2006)
51. Observation of VHE gamma-ray emission from the Active Galactic Nucleus
1ES1959+650 using the MAGIC telescope
J. Albert et al., ApJ 639 (2006) 761-765
52. Data management and processing for the MAGIC telescope
D. Dorner, K. Berger, T. Bretz, M. Gaug for the MAGIC Collaboration, Proc. 29th Int.
Cosmic Ray Conf. (2005, Pune)
53. A systematic study of the interdependence of IACT image parameters
B. Riegel, T. Bretz, D. Dorner, K. Berger, D. Höhne for the MAGIC Collaboration, Proc.
29th Int. Cosmic Ray Conf. (2005, Pune)
54. Comparison of on/off and wobble mode observations for MAGIC
T. Bretz, D. Dorner, B. Riegel, D. Höhne, K. Berger for the MAGIC Collaboration, Proc.
29th Int. Cosmic Ray Conf. (2005, Pune)
55. Spektrum des Krabbennebels im Gamma-Bereich (German)
K. Berger, diploma thesis, Institut für Theoretische Physik und Astrophysik, Julius-
Maximilians-Universität Würzburg (2005)

144

145
Acknowledgements
At the beginning I would like to express my regrets and my gratitude for Florian
Goebel, who unfortunately died due to an accident at the MAGIC II site. His wit and his
public spirit were always an inspiration to me. Work on the MAGIC experiment will never be
the same without him.
I am very thankful for the possibility to work in the group of Prof. Dr. Mannheim, who
always provided fruitful working conditions.
I would like to thank the Instituto de Astrofísica de Canarias for the excellent working
conditions at the Observatorio del Roque de los Muchachos in La Palma. The support of the
German BMBF is gratefully acknowledged.
I gratefully acknowledge the support by Prof. Dr. Bednarek and Dorota Sobczynska
during my stay in Lodz, Poland.
Additionally I express my thanks to all members of the MAGIC Collaboration for all
the good work and the fun we had together through the years and all the help that they
gave me.
I would especially like to thank Abelardo Moralejo Olaizola for the many, many fruitful
discussions and his patience.
Of course I want to thank my family and my friends, especially my good friend Felix
Schlosser, who helped me to find the necessary distractions from work and reminded me
who I really am.