discussion topics overview of water rates in california legal framework of water rates water...
TRANSCRIPT

Discussion Topics Overview of Water Rates in California
Legal Framework of Water Rates
Water Consumption Patterns
Empirical Data – City of Fresno
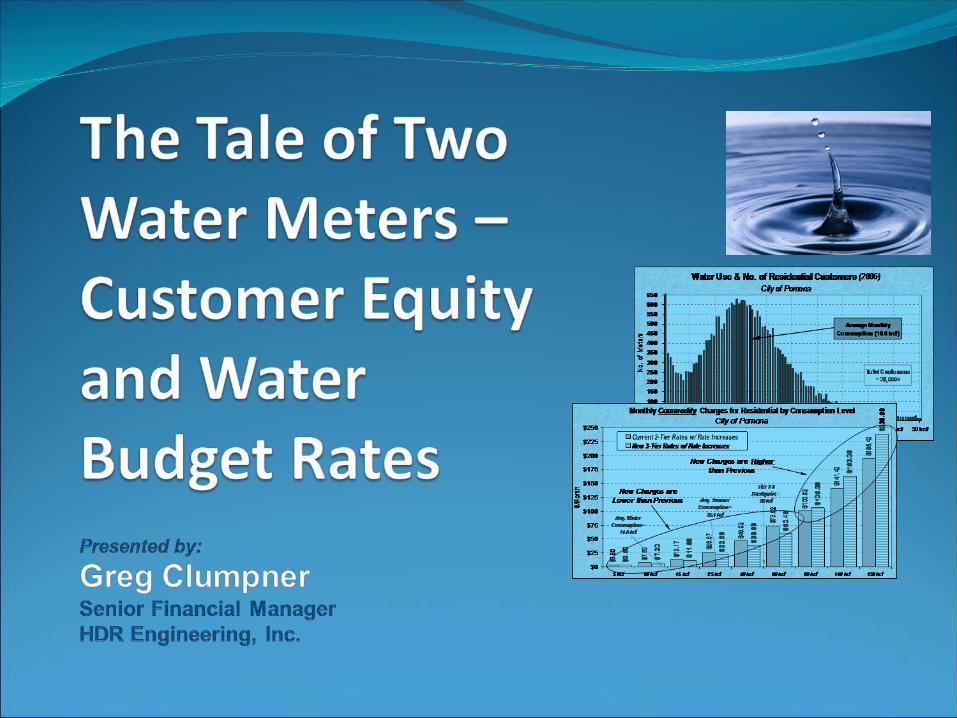
The Tale of Two Water Meters
Conclusions
HDR - A Tale of Two Meters 2
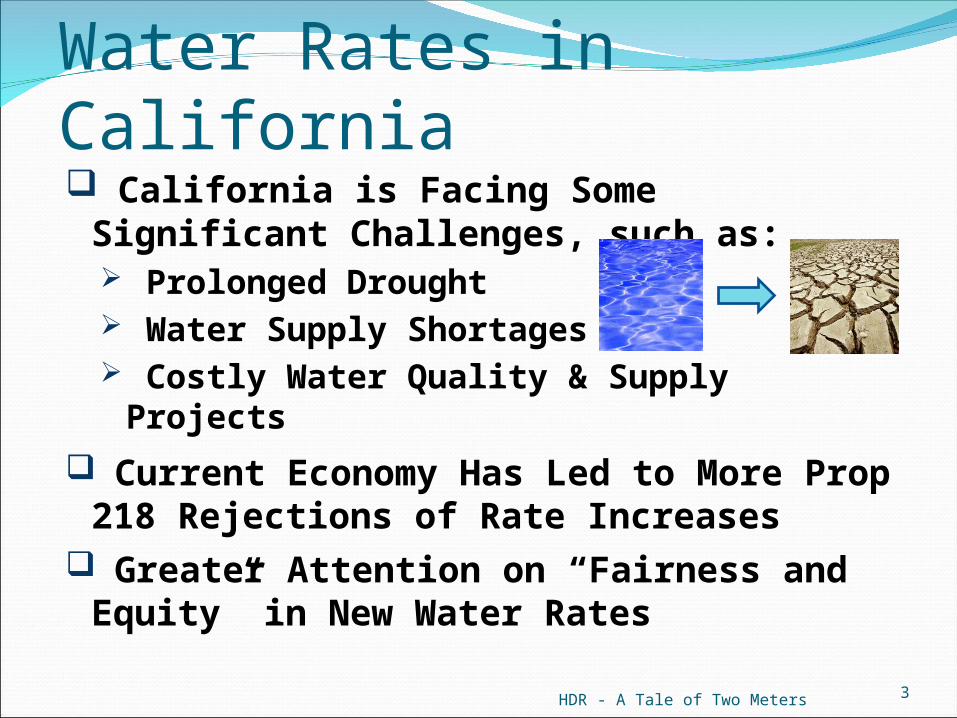
Water Rates in California California is Facing Some Significant
Challenges, such as: Prolonged Drought Water Supply Shortages Costly Water Quality & Supply Projects
Current Economy Has Led to More Prop 218 Rejections of Rate Increases
Greater Attention on “Fairness and Equity” in New Water Rates
HDR - A Tale of Two Meters 3

Water Rates in California (cont.) Many Cities are Moving Towards More
Conservation-Oriented Water Rates: Converting from Flat to Volumetric Rates
Converting from Uniform Volumetric (Single-Tier) Rates to Multi-Tiered Rates
Converting from Multi-Tiered Rates to Water Budget Based Rates
HDR - A Tale of Two Meters 4

Water Rates in California (cont.) Water Budget-Based Rates Appear to
be the “Cutting Edge” in Conservation: A Water Budget is Defined for Each
Customer (Typically Just Residential)
Budgets Reflect Lot Size, Irrigable Area, Household Size, etc.
They Clearly Promote Conservation, but Raise Some Questions About Equity
HDR - A Tale of Two Meters 5

Legal Framework of Water Rates
Prop 218* – The “Right to Vote on New Taxes” (1996)
AB 3030* – Inflation Adjustments and Wholesale Pass-throughs (2002)
AB 2572* – Requires Water Meters for Urban Water Suppliers (2004)
AB 2882*– Allocation-Based Conservation Water Pricing (2008)
HDR - A Tale of Two Meters 6
* California law
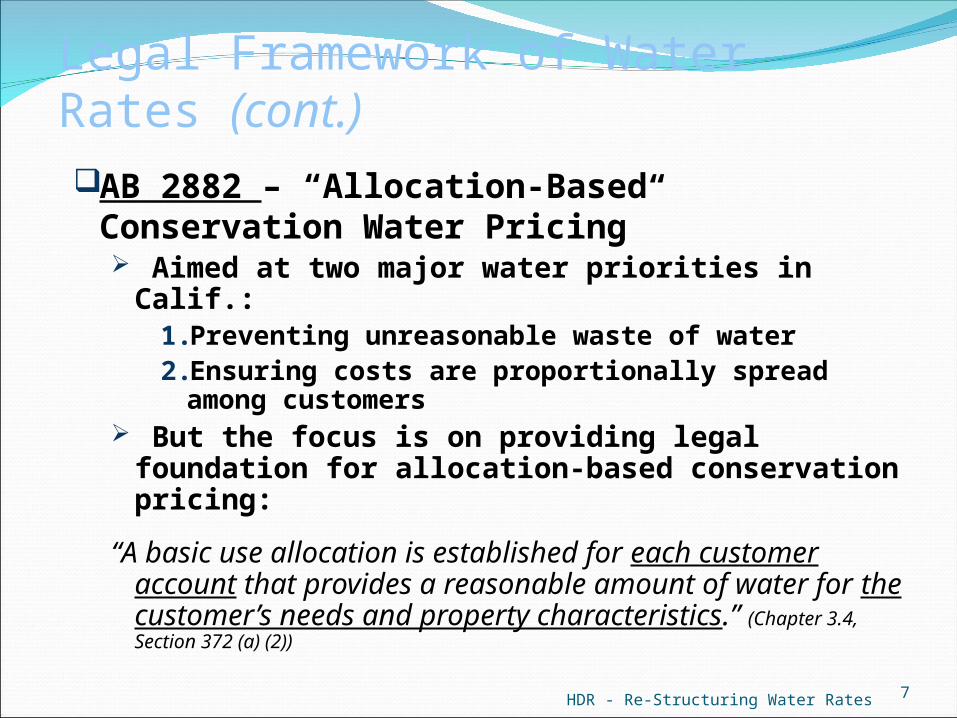
AB 2882 – “Allocation-Based Conservation Water Pricing” Aimed at two major water priorities in Calif.:
1. Preventing unreasonable waste of water2. Ensuring costs are proportionally spread among
customers But the focus is on providing legal foundation for
allocation-based conservation pricing:
“A basic use allocation is established for each customer account that provides a reasonable amount of water for the customer’s needs and property characteristics.” (Chapter 3.4, Section 372 (a) (2))
HDR - Re-Structuring Water Rates 7
Legal Framework of Water Rates (cont.)

AB 2882 – Additional Requirements for Allocation-Based Pricing:Rates must be based on metered usageMust use increasing blocks (tiers) to
encourage conservationRates must be proportional to:
HDR - Re-Structuring Water Rates 8
Customer classes Basic use allocations Meter size
Water consumption “Discretionary Allocation of
incremental costs between tiers”
Legal Framework of Water Rates (cont.)

Water Consumption Patterns
HDR - A Tale of Two Meters 9
Water Consumption Patterns
HDR - A Tale of Two Meters 10
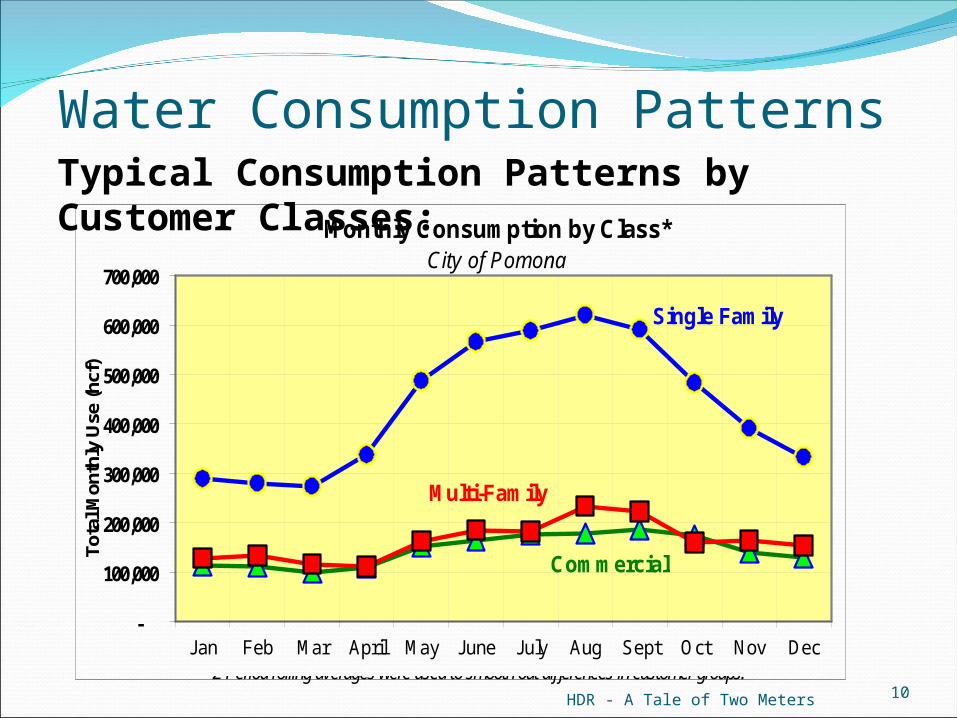
Typical Consumption Patterns by Customer Classes:Monthly Consumption by Class*
City of Pomona
Commercial
Multi-Family
Single Family
-
100,000
200,000
300,000
400,000
500,000
600,000
700,000
Jan Feb Mar April May June July Aug Sept Oct Nov Dec
Tota
l Mon
thly
Use
(hcf
)
*2-Period rolling averages were used to smooth out differences in customer groups.

Water Consumption Patterns (cont.)
HDR - A Tale of Two Meters 11
Typical Peaking Patterns by Customer Classes:Peaking Patterns by Class
City of Pomona
100%
120%
140%
160%
180%
200%
220%
240%
Jan Feb Mar April May June July Aug Sept Oct Nov Dec
% o
f Low
est M
onth
'
Single Family
Commercial
Multi-Family
HDR - A Tale of Two Meters 12
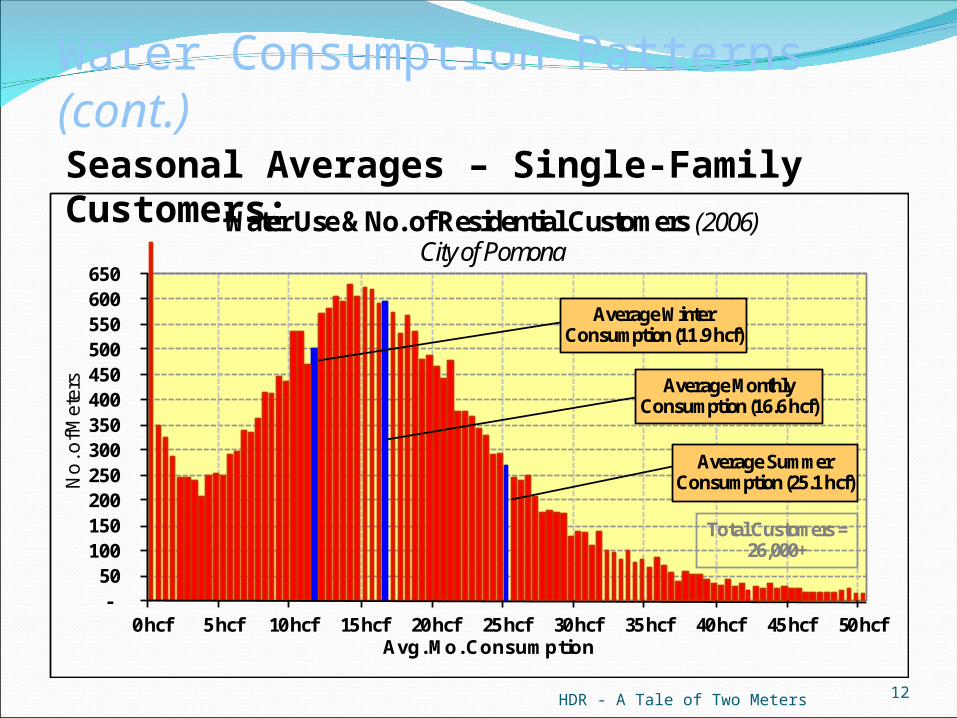
Seasonal Averages – Single-Family Customers:
-50
100 150 200 250 300 350 400 450 500 550 600 650
0 hcf 5 hcf 10 hcf 15 hcf 20 hcf 25 hcf 30 hcf 35 hcf 40 hcf 45 hcf 50 hcf
No
. of M
eter
s
Avg. Mo. Consumption
Water Use & No. of Residential Customers (2006)City of Pomona
Average Monthly Consumption (16.6 hcf)
Average Winter Consumption (11.9 hcf)
Average Summer Consumption (25.1 hcf)
Total Customers = 26,000+
Water Consumption Patterns (cont.)
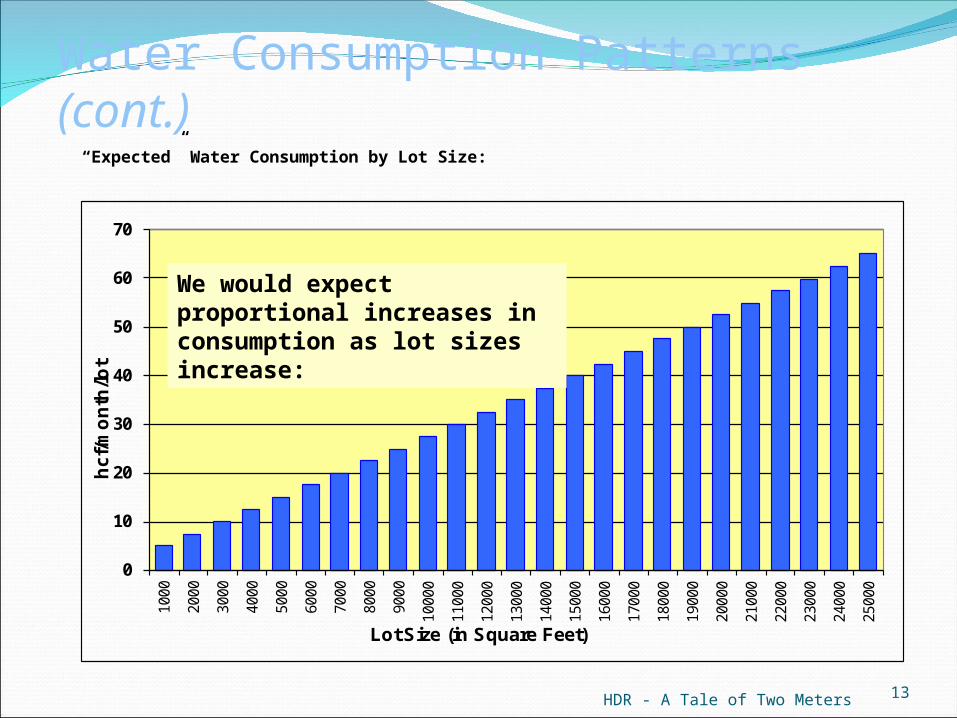
“Expected” Water Consumption by Lot Size:
HDR - A Tale of Two Meters 13
0
10
20
30
40
50
60
70
1000
2000
3000
4000
5000
6000
7000
8000
9000
1000
0
1100
0
1200
0
1300
0
1400
0
1500
0
1600
0
1700
0
1800
0
1900
0
2000
0
2100
0
2200
0
2300
0
2400
0
2500
0
hc
f/m
on
th/lo
t
Lot Size (in Square Feet)
Water Consumption Patterns (cont.)
We would expect proportional increases in consumption as lot sizes increase:

Water Consumption by Lot Size (City of Modesto)
HDR - A Tale of Two Meters 14
0
5
10
15
20
25
30
35
1,00
0
2,00
0
3,00
0
4,00
0
5,00
0
6,00
0
7,00
0
8,00
0
9,00
0
10,0
00
11,0
00
12,0
00
13,0
00
14,0
00
15,0
00
16,0
00
17,0
00
18,0
00
19,0
00
20,0
00
21,0
00
22,0
00
23,0
00
24,0
00
25,0
00
hc
f/m
on
th/lo
t
Lot Size (in Square Feet)
Average Monthly Water Consumption by Lot Size
Water Consumption Patterns (cont.)

Number of Lots by Size (Modesto)
HDR - A Tale of Two Meters 15
0%
10%
20%
30%
40%
50%
60%
70%
80%
90%
100%
0
2,500
5,000
7,500
10,000
12,500
15,000
17,500
20,000
22,500
25,000
1,00
0
2,00
0
3,00
0
4,00
0
5,00
0
6,00
0
7,00
0
8,00
0
9,00
0
10,0
00
11,0
00
12,0
00
13,0
00
14,0
00
15,0
00
16,0
00
17,0
00
18,0
00
19,0
00
20,0
00
21,0
00
22,0
00
23,0
00
24,0
00
25,0
00
% o
f T
ota
l L
ots
No
. of
Lo
ts
Lot Size (Square Feet)
Distribution of Residential Lots
No. of Lots by Size
Cumulative % of Lots
Water Consumption Patterns (cont.)
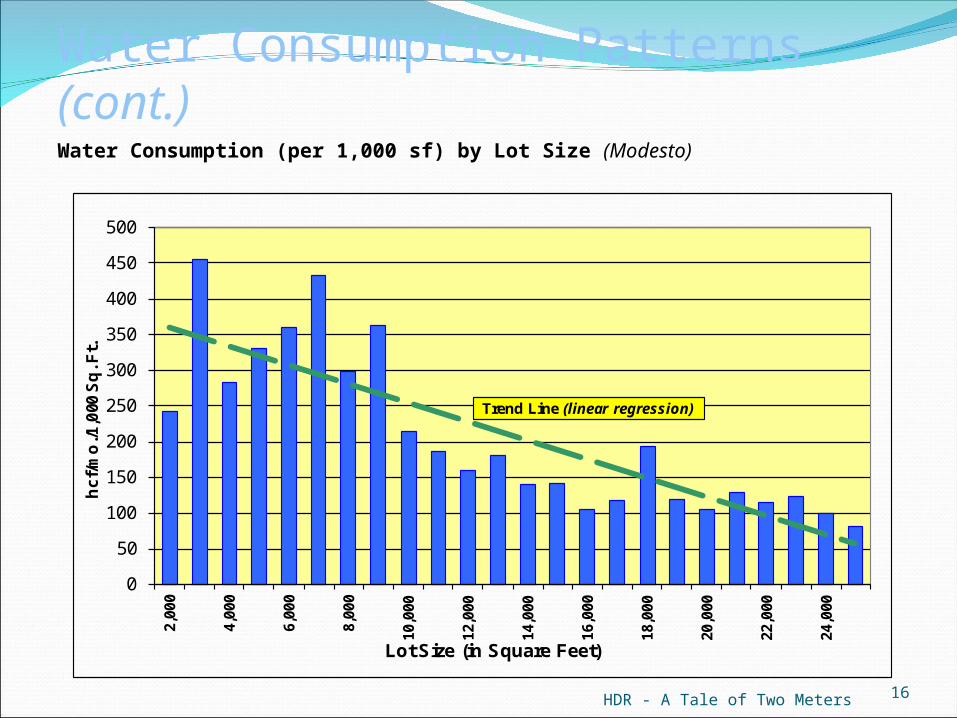
Water Consumption (per 1,000 sf) by Lot Size (Modesto)
HDR - A Tale of Two Meters 16
0
50
100
150
200
250
300
350
400
450
500
2,00
0
4,00
0
6,00
0
8,00
0
10,0
00
12,0
00
14,0
00
16,0
00
18,0
00
20,0
00
22,0
00
24,0
00
hc
f/m
o./1
,000
Sq
. Ft.
Lot Size (in Square Feet)
Trend Line (linear regression)
Water Consumption Patterns (cont.)

Empirical Data –City of Fresno
HDR - A Tale of Two Meters 17

HDR - A Tale of Two Meters 18
Fresno Bee Article* (“How Will Meters affect Fresno Water Bills?”):
Analysis based on 6 months of meter data from 70 homes showed: Highest consumption was 7x lowest
25% to 50% appeared to have plumbing or irrigation leaks
Water use varied widely, even among homes with the same size lots
Empirical Data – City of Fresno
(*Fresno Bee, 8-30-09):
HDR - A Tale of Two Meters 19
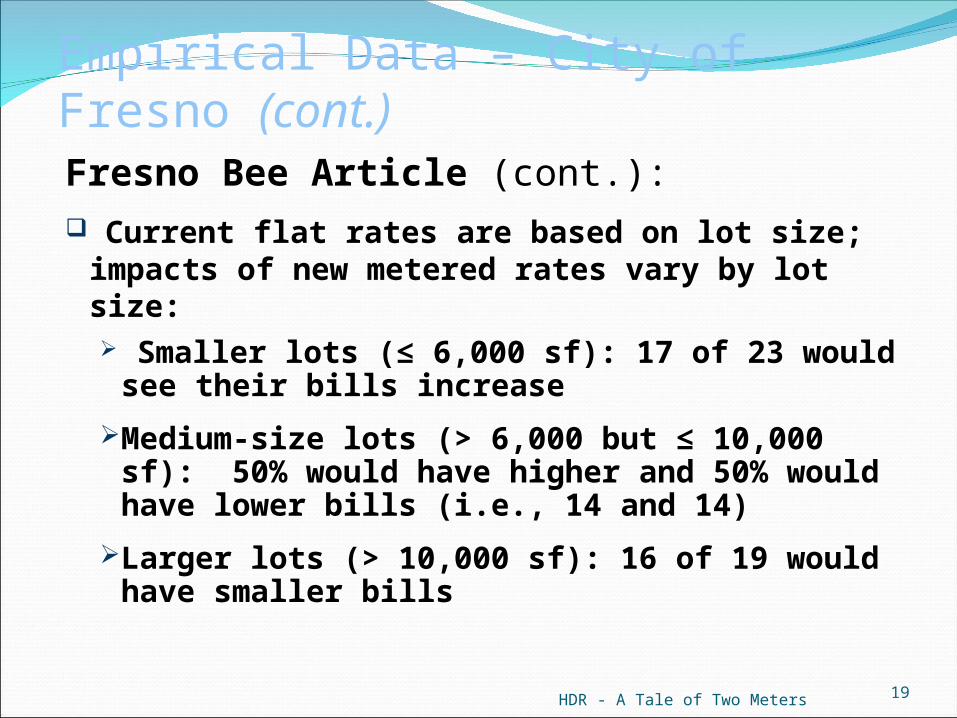
Fresno Bee Article (cont.):
Current flat rates are based on lot size; impacts of new metered rates vary by lot size: Smaller lots (≤ 6,000 sf): 17 of 23 would see
their bills increase
Medium-size lots (> 6,000 but ≤ 10,000 sf): 50% would have higher and 50% would have lower bills (i.e., 14 and 14)
Larger lots (> 10,000 sf): 16 of 19 would have smaller bills
Empirical Data – City of Fresno (cont.)

City of Fresno – Changes in Water Bills from Current Flat Rates to New Metered Rates:
HDR - A Tale of Two Meters 20
5
141617
14
30
2
4
6
8
10
12
14
16
18
20
Smallest Lots Medium-Size Lots Larger Lots
Nu
mb
er
of
Lo
ts
Lower Monthly Bills
Higher Monthly Bills
Empirical Data – City of Fresno (cont.)

City of Fresno – Changes in Water Bills from Current Flat Rates to New Metered Rates
HDR - A Tale of Two Meters 21
•Data from 23 homes on lots ≤ 6,000 sf
•17 of 23 homes would pay more under metered rates
$11.17
$296.89
$22.87 $22.87
$0
$25
$50
$75
$100
$125
$150
$175
$200
$225
$250
$275
$300
Largest Decrease Largest Increase
$/m
on
th
New Metered Rates
Current Flat Rates
Empirical Data – City of Fresno (cont.)

HDR - A Tale of Two Meters 22
Fresno Bee Article (8-30-09):
Analysis based on 6 months of meter data from 70 homes showed: Highest consumption was 7x lowest
25% to 50% appeared to have plumbing or irrigation leaks
Water use varied widely, even among homes with the same size lots.
Empirical Data – City of Fresno (cont.)

The Tale of Two Water Meters
HDR - A Tale of Two Meters 23
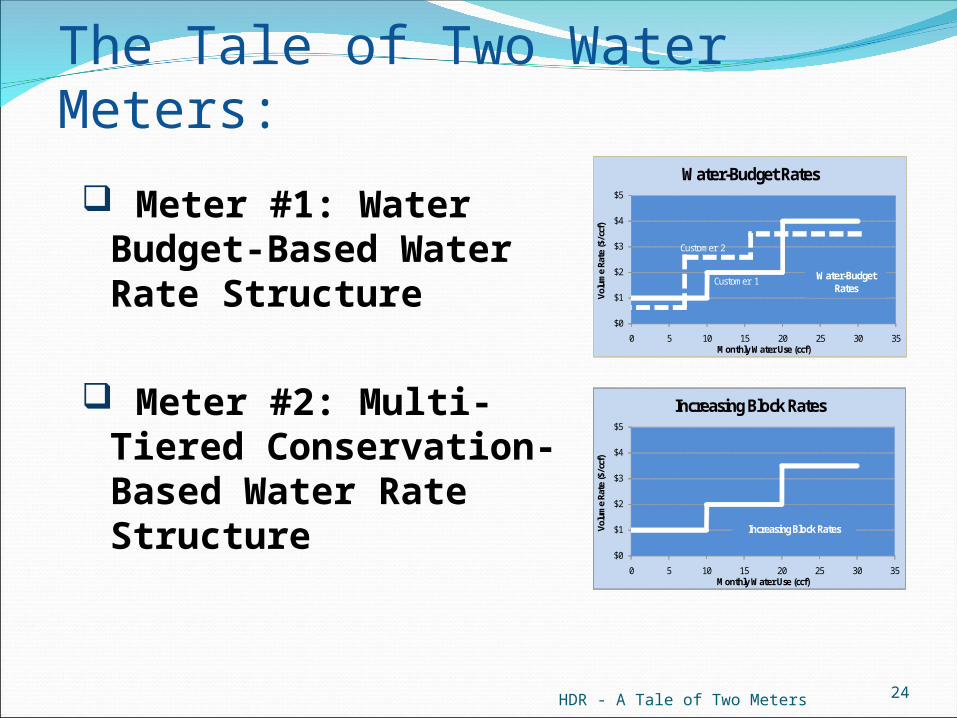
The Tale of Two Water Meters:
HDR - A Tale of Two Meters 24
Meter #1: Water Budget-Based Water Rate Structure
Meter #2: Multi-Tiered Conservation-Based Water Rate Structure
$0
$1
$2
$3
$4
$5
0 5 10 15 20 25 30 35
Volu
me
Rate
($/c
cf)
Monthly Water Use (ccf)
Water-Budget Rates
Water-Budget Rates
Customer 1
Customer 2
$0
$1
$2
$3
$4
$5
0 5 10 15 20 25 30 35
Volu
me
Rate
($/c
cf)
Monthly Water Use (ccf)
Increasing Block Rates
Increasing Block Rates
Water-Budget Rates
Customer 1
Customer 2
HDR - A Tale of Two Meters 25
City of Aurora Metered Data (Summer Season) for 50,700 Residential Customers Was Used to Compared Monthly Bills Under These Two Rate Structures
Water Budget-Based Rates from Boulder, CO, Were Applied to Aurora’s Consumption Data for Lots of 5,000 to 9,000 sf
The Tale of Two Water Meters (cont.)
HDR - A Tale of Two Meters 26
Monthly Bills from Water Budget Rates Were Compared to Bills from More Typical Multi-Tiered Conservation Rates
Results indicate that Most Customers had Different Bills for Exactly the Same Level of Consumption
The Tale of Two Water Meters (cont.)

The Tale of Two Water Meters (cont.)
HDR - A Tale of Two Meters 27
Results: Water Bills for Water Budget Rates vs. Multi-Tiered Rates
SQUAREFEET
5,0095,0095,0095,0095,0095,0095,0095,0095,0095,0095,0095,0095,0095,009
Avg. Resid. Summer Water Bills: Two Rate Structures(Avg. Consumption Levels of 25 to 30 hcf/mo. - Aurora, CO)
$35
$40
$45
$50
$55
$60
$65
$70
$75
25.0
25.4
25.8
26.3
27.2
27.6
28.2
29.0
29.9
Avg. Summer Consumption (hcf/mo.)
Bould
er W
ater
-Bud
get R
ates
$90
$100
$110
$120
$130
$140
$150
$160
$170
Bould
er/A
uror
a Hy
brid
Rate
s
Boulder's Water Budget-Based Rates
Boulder/Aurora Hybrid Rates
From Lot Sizes of 5,000-6,000 and 8,000-9,000 square feet.Total No. of Lots = 3,400
Lower consumption but higher bill
Higher consumption but lower bill

HDR - A Tale of Two Meters 28
Results - Water Bills (for the same amount of water use):
$21.31
$30.06
$39.22
$55.86
$74.38
$23.03
$34.03
$52.37
$75.55
$98.03
$0
$10
$20
$30
$40
$50
$60
$70
$80
$90
$100
$110
15.2 20.1 25.0 30.3 35.2
Avg
. Su
mm
er B
ills
Avg. Summer Consumption (June-August)
City of Aurora, Resid. Lots (5,000-6,000 & 8,000-9,000 Sq. Ft.) Summer 2006
Lowest Summer Bill (hcf/mo.)
Highest Summer Bill (hcf/mo.)
Avg. Summer Consumption: 5,000-6,000 s.f. = 17.3 hcf/mo.8,000-9,000 s.f. = 22.2 hcf/mo.
The Tale of Two Water Meters (cont.)

Conclusions:
HDR - A Tale of Two Meters 29
Residential consumption is typically highly variable within lots of the same size
Our analysis of water budget-based rate structures showed: Water-budget based rates will result in some
customers with higher water use paying lower water bills (for very similar size lots)
Rate Equity: will customers using less water but getting higher bills consider water budget-based rates to be equitable?
Water Agencies should carefully evaluate consumption patterns and know the rate impacts before adopting water budget rates

Questions?
HDR - A Tale of Two Meters 30