dwsd rates - water and sewerage | departments and ... rates understanding dwsd water rates this...
TRANSCRIPT

DWSD RatesUnderstanding DWSD Water Rates
This Water Rates Summary was published through a collaborative effort of the Detroit Water and Sewerage Department, a not-for-profit agency, and its customer communities.
The purpose of DWSD Rates is to introduce the Detroit Water and Sewerage Department (DWSD) process for formulating and calculating water rates. The elements of the rate formula and a broad over-view of the DWSD system are presented. We believe that a better understanding of rates can be achieved when you understand where our water comes from, how it is delivered to customers, and how we plan to maintain this system for future generations.
This document has been created for elected officials, governmental employees and citizens throughout Southeastern Michigan. It is the product of a col-laborative effort between DWSD and its customers. The need for a primer on water rates emerged in the results of a 2003 Customer Satisfaction Survey where participants indicated they wanted more information on rates. This document will evolve as our water rates process changes to meet the collective needs of our community. We encourage your feedback and appreci-ate your willingness to learn more about this most important resource – water.

Overview of the Water Rate Setting Process
Rate setting is a forward-looking process based on as-sumptions of how much water will be produced and delivered in the coming year. Predicting the amount of water that four million people will use each year is a challenge. Water usage varies widely, depending on weather, population growth and economic activity.
This annual exercise is similar to determining how much money to charge for a group bus trip from Detroit to Washington DC. Although the cost of the bus trip will vary year to year (just as a community’s cost of water varies year to year), let’s assume that the cost of the bus does not vary with the number of people.
You start by estimating how many people will come on the trip. Then, you divide the fixed cost of the bus by the estimated number of people. This gives you the average estimated cost per person. If fewer people attend than you planned, the unit price per person goes up. Likewise, if more people attend (and you have the capacity to accommodate them) the price per person goes down. In the long run, the number of people that take the trip determines the price that everyone pays for the service.
Like the group trip example, DWSD uses historical information and data to annually forecast both water usage and costs for water production and delivery services. DWSD then sets a rate for each customer to cover its costs.
By law, DWSD can only recover the cost of service – it cannot make a profit. If “more people ride the bus,” or a lot more water is sold than expected, the extra funds received must be used for the system and offset the need to increase rates in the future. These extra funds cannot be diverted to non-DWSD activities.
Likewise, if the annual revenue of the water system is insufficient to meet requirements, future rates may have to be increased to make up the difference. The fiscal fortunes of the water utility are somewhat dependent upon the weather. Hot, dry weather generally results in more water sales and extra revenue to be used by the utility in a future year. Cool, damp weather can have the opposite effect, generally result-ing in an annual revenue shortfall. Reserve funds are maintained and policies established for their use to address both of these scenarios.
2
• A not-for-profit agency by Michigan statute.
• Owned by the City of Detroit and receives no subsidies from property taxes.
• Uses the Great Lakes, the world’s largest concentration of fresh water, as our water source.
• Largest water system in the State of Michigan.
• Supplies water to four million people.
• Third largest municipal system in the United States.
• Fees are based on cost of service only.
• Water rates have consistently been among the lowest in the nation’s twenty largest municipalities.
Facts About the DWSD Water System
Water Works Park is the newest of Detroit’s five water treatment plants that deliver drinking water to 126 communities. While the plant is new, the site has been a source of drinking water for the system since 1879. Water Works Park is Michigan’s largest facility to use ozone disinfection.
3
DWSD’s Rate Model Based on Approved AWWA Standard
The American Water Works Association (AWWA) is an international, nonprofit, scientific and educational society dedicated to the improvement of drinking water quality and supply. DWSD’s water rate model follows a “Base-Extra Capacity” approach in accordance with approved AWWA standards.
The Base-Extra Capacity method recognizes that in addition to providing base service during aver-age conditions, water systems are also engineered with the extra capacity to meet customer demands during peak usage periods. As a “Base-Extra Capac-ity” system, DWSD’s water system was designed and engineered to deliver water at adequate pressures at peak demands. For example, during the hottest day of the summer, DWSD will deliver over a billion gallons or almost two times a normal day’s production.
In order to effectively operate, maintain, and expand its system, DWSD allocates charges to customers for providing both base and extra capacity services (hereafter known as “peak demand” services.) Because customers vary in their needs for base and peak demand services, customers can and do have different rates, even when they are neighbors.
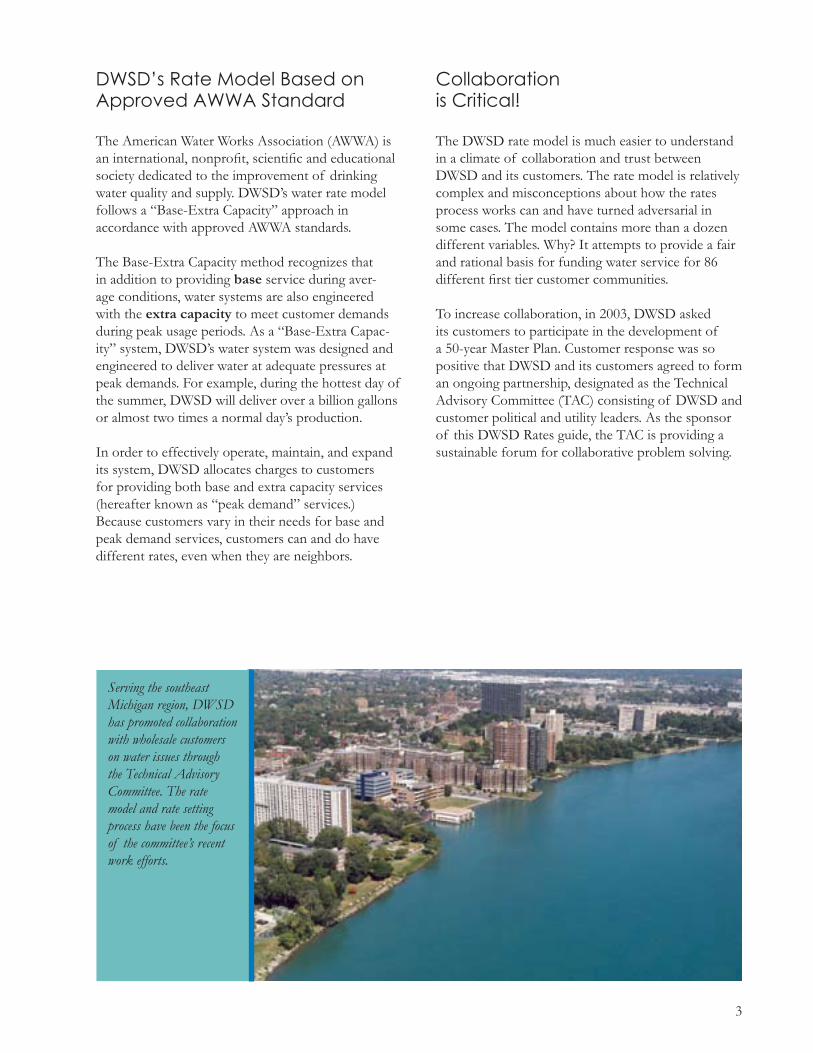
Serving the southeast Michigan region, DWSD has promoted collaboration with wholesale customers on water issues through the Technical Advisory Committee. The rate model and rate setting process have been the focus of the committee’s recent work efforts.
Collaboration is Critical!
The DWSD rate model is much easier to understand in a climate of collaboration and trust between DWSD and its customers. The rate model is relatively complex and misconceptions about how the rates process works can and have turned adversarial in some cases. The model contains more than a dozen different variables. Why? It attempts to provide a fair and rational basis for funding water service for 86 different first tier customer communities.
To increase collaboration, in 2003, DWSD asked its customers to participate in the development of a 50-year Master Plan. Customer response was so positive that DWSD and its customers agreed to form an ongoing partnership, designated as the Technical Advisory Committee (TAC) consisting of DWSD and customer political and utility leaders. As the sponsor of this DWSD Rates guide, the TAC is providing a sustainable forum for collaborative problem solving.

Calculate Units of Service by Customer
DWSD rates are based on the philosophy that each customer should be charged according to its individual use of the system. Through years of experience and careful study, DWSD has established a set of Units of Service that is the backbone of the rate calculation. As shown in Exhibit A, City of Allen Park Water Bill (2005): The Units of Service multi-plied by the cost of these units (Unit Cost of Service) yields the dollar costs for their water.
Each Unit of Service is derived from a Cost Func-tion. Suburban wholesale customer rates contain 11 Cost Functions (Exhibit B). The rate model for Detroit residents, who are served by DWSD as retail customers, has four additional Cost Functions related to the provision of retail service.
Exhibit B, that begins on the following page, sum-marizes the 11 Cost Functions and describes how the Units of Service are calculated. Remember that the Cost Functions for all customers are related to one of the following concrete measurable results: • amount of water used in the prior year• average daily water usage • amount of water used in peak demand times in
prior years• fixed measurement of the average distance from
the five water plants to the community• fixed measurements of the elevation average differ-
ential between a community and the water plants• costs for providing customer service • meter maintenance costs
The Cost Functions and Units of Service don’t exist in a vacuum. The total costs of operating the system are parceled into the Cost Functions on an annual basis. The assignment proportions are fairly constant from year to year.
In the process, DWSD determines how much of the system cost is allocated to providing base service, meeting peak demand and other Cost Functions. The logic that drives the allocation of total system costs is provided in the descriptions under the term: Alloca-tion Logic. Please refer to Allen Park’s Water Bill as you read.
Estimate System Costs
DWSD estimates costs for two major categories: Operations and Maintenance (O&M) and Capital Improvement Program (CIP). O&M and CIP projects are critical to system performance. Each year, DWSD prepares a detailed O&M budget that delineates the specific activities necessary to meet customer demands and maintain existing system facilities.
DWSD also reviews and adjusts its five-year CIP. This plan identifies new equipment, new facilities, and rehabilitation projects that must be undertaken to meet regulatory requirements, to operate reliably and cost-effectively, and to expand the system to meet future needs.
Most of the cost to design and construct CIP proj-ects is financed up front through the sale of revenue bonds. (Although a small percentage of CIP projects are financed with current revenues). DWSD takes careful steps when it sells revenue bonds to retain a favorable Wall Street rating and to secure lower interest rates that benefit all customers. Currently, DWSD’s revenue bonds have favorable rating from the nation’s top rating agencies.
4
1
2DWSD follows three basic steps to calculate the next year’s rates.
1. DWSD estimates system costs to operate, maintain, and improve the system for the coming year.
2. DWSD calculates Units of Service for each customer.
3. DWSD identifies the costs for the above units of service (Unit Cost of Service) and calculates customer rates.
Rate Making Steps

Exhibit B: The Suburban Wholesale Customer - 11 Cost Functions*
5
Cost Function
1. Base: This is the amount of water used by a customer on an average day. It is calculated by dividing the estimated annual sales by 365 days. Turning to Exhibit A, DWSD forecasts that Allen Park will use 601.4 thousand cubic feet (Mcf) of water per day over the next year. (This forecast includes unaccounted for water that is produced but does not reach customer meters.)
2. Maximum Day Increment: This is the average amount of water used by the customer above the average day usage. It is measured on the day that DWSD distributes the highest amount of water to all of its customers – thus the term: maximum day. This day always occurs in the summer. On this maximum day for the system, Allen Park used an average of 64% more water than it does on a normal day. 64% of the base usage yields a total of 386 Mcf per day.
Allocation Logic
A portion of the cost of running the five water plants and pumping water into the water system is allocated to the Base. This cost of $871.99 can be found on Exhibit A in the Unit Cost of Service. Multiply the forecasted units of service by the unit cost of service to arrive at allocated cost of base service of $524,415. Note that this cost represents 33% of Allen Park’s total bill. Therefore, almost two thirds of Allen Park’s water charge is allocated to supplying peak demand water.
Even though Allen Park does not use the additional 386 Mcf per day year round, it is charged for that amount because DWSD must design and engineer the system to provide maximum amounts of water on demand. DWSD allocates capital costs for the purification equip-ment and the pumps required to supply this level of capacity.
* The number for each Cost Function is the same as the Line Number on Exhibit A.
Exhibit A: City of Allen Park Water Bill (2005)
1 Base 601.4 $ 871.99 $ 524,415 2 Maximum Day Increment 386.8 474.55 183,558 3 Peak Hour Increment 221.0 265.27 58,625 4 Base Distance 12,629.4 11.67 147,386 5 Maximum Day Distance 8,122.8 9.70 78,796 6 Peak Hour Distance 4,641.0 9.70 45,020 7 Base Distance-Elevation 12,629.4 11.72 148,026 8 Maximum Day Distance-Elevation 8,122.8 27.73 225,227 9 Peak Hour Distance-Elevation 4,641.0 27.73 128,685 10 Customer A 192.0 9.26 1,778 11 Customer B 961.0 36.87 35,432
Total Cost of Service $1,576,947
Allocated Cost of Service
$
Line No. Cost Function
Units of Service
Unit Cost of Service $/Unit
Dollars are shown per Mcf.

6
Cost Function
3. Peak Hour Increment: This is the amount of water used by the customer over and above the maximum day usage. It is measured on the hour of the maximum day and occurs in the hour that DWSD distributes the highest amount of water to its customers. Obviously, this peak hour always occurs on a summer day, although the exact hour of the day varies year to year.
Referring to Exhibit A, during its peak hour, Allen Park used 221 Mcf on top of the 988.2 Mcf (Base + Maximum Day Increment). As in the previous examples, this figure is multiplied by the Unit Cost of Service to arrive at an Allocated Cost of Service of $58,625.
4. Base Distance: This is the distance in miles from the customer’s connection(s) to the DWSD system. Since there are five water plants and each plant is capable of supplying water to most customers in the system, the distance is the average measured distance (in miles) between the customer connection(s) and each of the five water treatment plants.
Referring to Exhibit A, the Units of Service, 12,629.4 is arrived at by multiplying the distance factor (21 miles) by the base usage, 601.4 Mcf.
5. Maximum Day Distance: This Cost Func-tion uses the same distance as base distance. The Units of Service is arrived at by multi-plying the distance factor (21 miles) by the maximum day increment usage, 386.8 Mcf.
6. Peak Hour Distance: This Cost Function is based on the premise that DWSD must provide peak capacity through the distribution network to the customer. The Units of Service are calculated by multiplying the distance factor (21 miles) by the peak hour increment of 221 Mcf.
Allocation Logic
DWSD allocates operational and capital costs for reservoirs to this Cost Function. Reservoirs provide storage and allow DWSD to meet peak demand. Some communities have built their own storage and are able to reduce their maximum day and peak hour demands from the DWSD system, thus giving them an opportunity to reduce their water rates.
DWSD pumping costs (and DWSD capital costs of pumping facilities) are allocated to this Cost Function. The farther a customer is from the five water plants, the more the customer will pay because the base flow has to be pumped a longer distance.
DWSD allocates capital costs for rehabilitating and building transmission mains (large pipes) to this Cost Function.
As in the previous item, DWSD allocates capital costs for rehabilitating and building transmission mains to this Cost Function.
Exhibit B: The Suburban Wholesale Customer - 11 Cost Functions* continued
* The number for each Cost Function is the same as the Line Number on Exhibit A.

7
Cost Function
7. Base Distance Elevation: The elevation factor is the measured elevation difference between the customer connection(s) and the average elevation of each of the five water treatment plants.
Referring to Exhibit A, the Units of Service, 12,629.4 is arrived by multiplying the base distance (21 miles) by the elevation factor by the base usage, 601.4 Mcf. In the case of Allen Park, it is at the same elevation as the average elevation of the five water plants, so the Units of Service are the same as base distance.
8. Maximum Distance - Elevation: This Cost Function is based on the premise that DWSD must provide extra capacity through the distribution network to get the water to the customer at the customer’s elevation. The Units of Service are calculated by multiplying the distance factor (21 miles) by the elevation factor by the maximum day increment of 386.8 Mcf.
9. Peak Hour Distance - Elevation: This Cost Function is based on the premise that DWSD must provide peak hour demand through the distribution network by supplying water at the customer’s elevation. The Units of Service are calculated by multiplying the distance factor (21 miles) by the elevation factor by the peak hour increment of 221.0 Mcf.
10. Customer A: This Cost Function is based on the costs associated with meter reading and the provision of customer service.
11. Customer B: This Cost Function is based on the costs associated with installation and maintenance of meters.
Allocation Logic
DWSD pumping costs and the capital costs are allocated to this Cost Function. The higher the elevation of customer connections, the more the customer will pay because it takes more energy to pump water uphill.
DWSD allocates the operating and capital costs for booster stations to this Cost Function. Booster stations support the delivery of extra capacity over long distances and differences in elevations.
As in the previous Cost Function, DWSD allocates the operating and capital costs for booster stations to this Cost Function. Booster stations support the delivering of peak hour demand over long distances and differences in elevations.
DWSD allocates the cost of a portion of DWSD’s Commercial Division to this Cost Function.
DWSD allocates the actual cost of meter service to this Cost Function.
Exhibit B: The Suburban Wholesale Customer - 11 Cost Functions* continued
* The number for each Cost Function is the same as the Line Number on Exhibit A.
8
Calculate Rates for each Customer
In Steps 1 and 2, the overall costs of running the sys-tem are estimated and Units of Service are calculated. In Step 3, DWSD calculates rates for each customer using four steps:
1. The total units of service are calculated by sum-ming the Units of Service for all customers. For example, to calculate the Base Units of Service, the 601.4 units in the Allen Park example (equaling the total sales for the year divided by 365 days plus unaccounted for water) would be added with all the other customer Base Units of Service to arrive at a total figure of 82,682.5 units.
2. The revenue requirement, known as the Total Utility Basis Revenue Requirement, is identified for each Cost Function using the Allocation Logic presented in the preceding descriptions of the Cost Functions.
3. The Total Utility Basis Revenue Requirement is divided by the Units of Service to arrive at the Unit Cost of Service. Exhibit C shows how the development of Unit Costs of Service for all the Cost Functions. Note: these same Unit Costs can be seen in the Allen Park Bill, Exhibit A.
3
Exhibit C: Development of Unit Cost of Service, $/Unit
1 Base $ 72,098,300 82,682.5 $ 871.99 2 Maximum Day Increment 26,124,100 55,049.7 474.55 3 Peak Hour Increment 5,758,800 21,709.2 265.27 4 Base Distance 23,408,300 2,005,842.2 11.67 5 Maximum Day Distance 13,014,700 1,341,646.6 9.70 6 Peak Hour Distance 5,163,600 532,297.5 9.70 7 Base Distance-Elevation 31,006,700 2,645,454.0 11.72 8 Maximum Day Distance-Elevation 51,214,800 1,847,060.8 27.73 9 Peak Hour Distance-Elevation 20,649,400 744,715.7 27.73 10 Customer A 10,454,900 1,129,255 9.26 11 Customer B 16,222,800 440,002 36.87
Unit Cost ofService$/Unit
Line No. Cost Function
Total UtilityBasis RevenueRequirement
$ Units of Service
4. The Units of Service is multiplied by the Unit Cost of Service to yield Allocated Cost of Service. As shown on Exhibit A, the sum of the Allocated Cost of Service charges is the overall bill for Allen Park, $1,576,947.
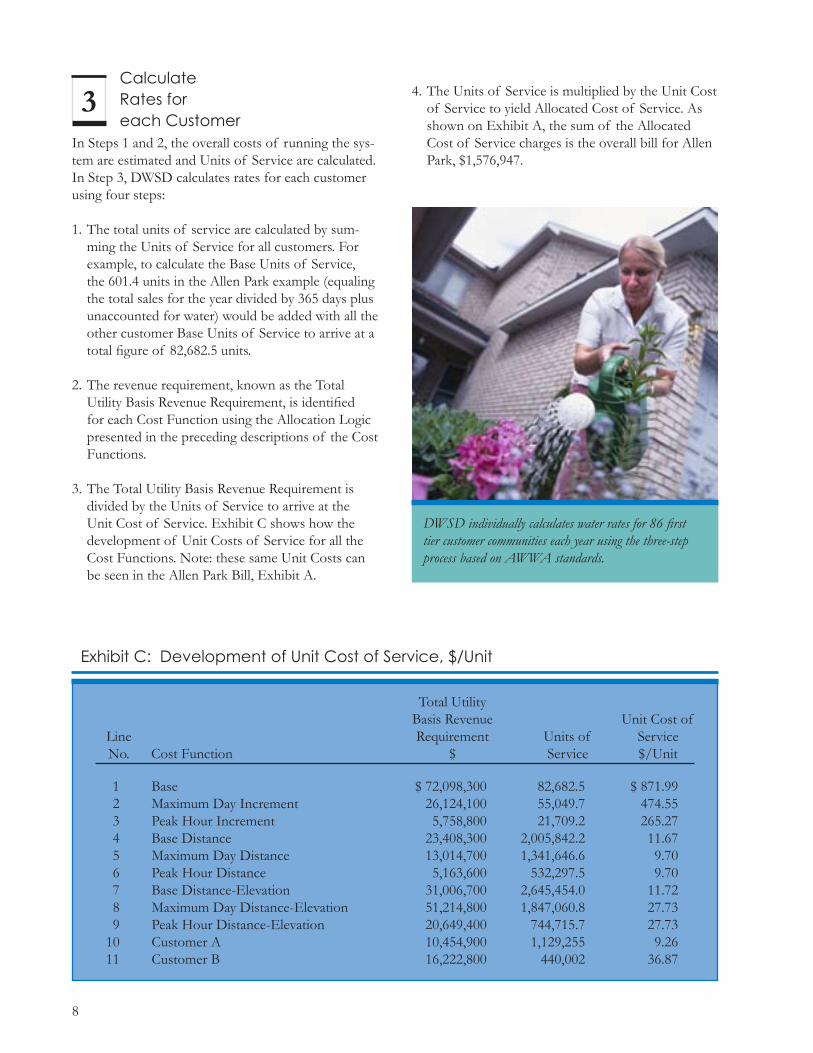
DWSD individually calculates water rates for 86 first tier customer communities each year using the three-step process based on AWWA standards.

9
Frequently Asked Questions About Rates 1. Do you have a simple graphic model that shows a build up of a bill? Exhibit D is based on the Allen Park bill that shows the cumulative effect of summing the Allocated Costs of Services for the Base/Max Day/Peak Hour Cost Functions.
In addition, the Allocated Costs of Service are color coded to show groups of costs that are influenced by Base, Max Day and Peak Hour factors, making it easy to see the multiplicative impact on water costs from changes in Peak Hour and Max Day factors.
2. Why do water rates increase?Water supply, treatment, and delivery are dependent on an aging infrastructure that must be maintained or replaced. In addition, the level of required treatment to comply with safe drinking water standards contin-ues to increase due to regulatory requirements.Water utilities across the United States are faced with the need for increased revenues that must, in most cases, be met from water rate increases. Two major expenses impact rate levels:
• Capital Improvement Program (CIP) Financing - Continued improvements from an established CIP
ensure reliable service for an aging infrastructure. Many CIP projects are also necessary to maintain
compliance with environmental regulations. The CIP changes from year to year depending on current needs.
• Operations & Maintenance (O&M) Expense - Inflation impacts both labor and equipment for
O&M. This expense rises as new facilities are con-structed and brought into service, increasing the amount of O&M that must be performed. O&M expense can be offset by efficiency achievement in some areas. O&M expenses are also impacted by the cost of utilities, chemicals and property insurance that can increase in price. For instance, property insurance has risen since the September 11, 2001 terrorist attack, and energy costs have more than doubled in recent years.
3. Why do rates vary so much year to year? Seasonal usage of water has a dramatic impact on the overall cost of service. Increases or decreases in maximum day or peak hour increments due to changes in lawn watering contribute costs to six different Units of Service: Maximum Day Increment, Peak Hour Increment, Maximum Day Distance, Peak Hour Distance, Maximum Day Distance-Elevation, and Peak Hour Distance – Elevation. In the Allen Park example, these six different Units of Service affect 46% of the total charge.
Exhibit D: Build Up of Allen Park Water Bill
Peak Hour Distance-Elevation $ 128,685.00 8 % Peak Hour Total = 15% Peak Hour Distance 45,020.00 3 % Peak Hour Increment 58,625.00 4 %
Max Day Distance-Elevation 225,227.00 15 % Max Day Total = 32% Max Day Distance 78,796.00 5 % Max Day 183,558.00 12 %
Base Elevation 148,026.00 10 % Base Total = 53% Base Distance 147,386.00 10 % Base 524,415.00 33 %
$1,539,738.00 100 %

10
4. Why do some neighboring communities have such different rates?Community usage of water (driven by lot size and amount and type of development) has a significant impact on rate charges. Elevation and distance also have an impact when comparing neighboring commu-nities. For example, below you will find a comparison of water rates in neighboring communities.
Analysis:Community “A” has a rate of $19.17 per Mcf. It is $4.91 higher than Community “B’s” rate of $14.26.
The lion’s share of this rate differential can be found in Cost Functions 7, 8, and 9, those associated with elevation. Community “A” is at higher elevation than Community “B” by a factor of 8.8 (43.2 – 34.4) and this difference results in $3.38 ($10.10-$6.72).
Community “B”
Cost Base Max Day Peak Hour Total ElevationFunction Factor
1, 2, 3 $2.65 $1.95 $0.44 $ 5.04 4, 5, 6 .094 1.05 0.42 2.41 7, 8, 9 1.23 3.92 1.57 6.72 34.4Other 0.09 Total $4.91 $6.92 $2.43 $14.26
Community “A”
Cost Base Max Day Peak Hour Total ElevationFunction Factor
1, 2, 3 $2.69 $ 2.73 $0.36 $ 5.78 4, 5, 6 1.06 1.65 0.39 3.11 7, 8, 9 1.56 6.89 1.64 10.10 43.2Other 0.18 0.18 Total $5.49 $11.28 $2.40 $19.17
5. What can my community do to control its rates?DWSD’s recently completed 50 Year Master Plan forecasts that, in long-term, rates will increase on average, 6% per year. Approximately 3% of this increase is allotted to the impact of inflation on operations and maintenance costs. The other 3% increase results from CIP projects. Over two thirds of the CIP is targeted at system rehabilitation, much of which is driven by regulatory requirements.
Communities should focus on eliminating waste within their system and on educating citizens and businesses on environmentally sound watering practices. In the long run, these initiatives will reduce peak demands and will result in lower costs assigned to them.
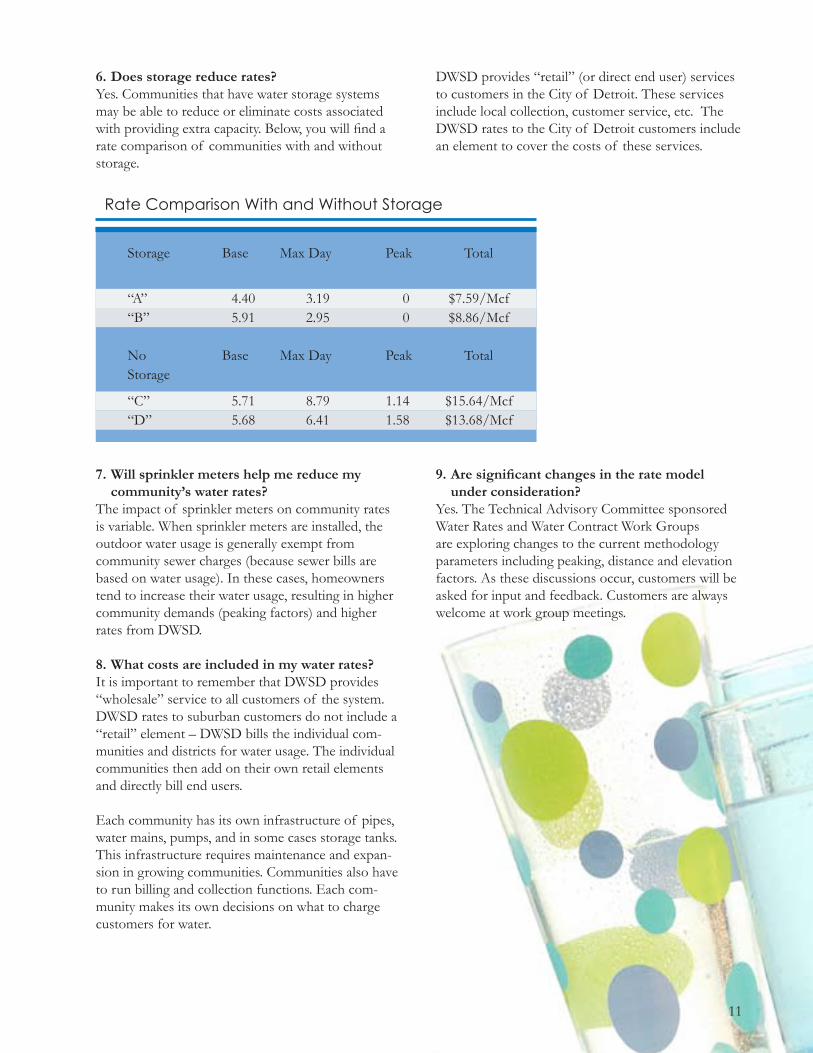
6. Does storage reduce rates?Yes. Communities that have water storage systems may be able to reduce or eliminate costs associated with providing extra capacity. Below, you will find a rate comparison of communities with and without storage.
7. Will sprinkler meters help me reduce my community’s water rates? The impact of sprinkler meters on community rates is variable. When sprinkler meters are installed, the outdoor water usage is generally exempt from community sewer charges (because sewer bills are based on water usage). In these cases, homeowners tend to increase their water usage, resulting in higher community demands (peaking factors) and higher rates from DWSD.
8. What costs are included in my water rates?It is important to remember that DWSD provides “wholesale” service to all customers of the system. DWSD rates to suburban customers do not include a “retail” element – DWSD bills the individual com-munities and districts for water usage. The individual communities then add on their own retail elements and directly bill end users.
Each community has its own infrastructure of pipes, water mains, pumps, and in some cases storage tanks. This infrastructure requires maintenance and expan-sion in growing communities. Communities also have to run billing and collection functions. Each com-munity makes its own decisions on what to charge customers for water.
DWSD provides “retail” (or direct end user) services to customers in the City of Detroit. These services include local collection, customer service, etc. The DWSD rates to the City of Detroit customers include an element to cover the costs of these services.
9. Are significant changes in the rate model under consideration?Yes. The Technical Advisory Committee sponsored Water Rates and Water Contract Work Groups are exploring changes to the current methodology parameters including peaking, distance and elevation factors. As these discussions occur, customers will be asked for input and feedback. Customers are always welcome at work group meetings.
11
Storage Base Max Day Peak Total
“A” 4.40 3.19 0 $7.59/Mcf “B” 5.91 2.95 0 $8.86/Mcf
No Base Max Day Peak Total Storage
“C” 5.71 8.79 1.14 $15.64/Mcf “D” 5.68 6.41 1.58 $13.68/Mcf
Rate Comparison With and Without Storage

August
September
October
November
December
January
February
July
Preliminary review of previous year’s actual expenditures and water billed.
DWSD forecasts flow projections for next year’s water usage. Estimated projections are sent to each customer.
DWSD develops additional units of service information and determines preliminary cost to finance and operate system and presents to customers.
DWSD analyzes preliminary revenue requirements and units of service to determine preliminary cost of service allocations and presents to customers.
Board of Water Commissioners Rates Workshop held. DWSD notifies BOWC of rate proposals and mails preliminary rate notifications to customers.
Meetings with individual customer communities as requested. Board of Water Com-missioners public hearing and approval.
City Council public hearing. Rates approved by City Council.
New rates effective on all bills issued on or after August 1.
Rate Setting Schedule
10. How are customers involved in the rate setting process?Wholesale customers are involved in the process through mailings, work group meetings, individual meetings, and informational briefings.
The rate-setting schedule goes from August to February with the new rates approved by the Board of Water Commissioners (BOWC) and the Detroit City Council. New rates go into effect in July.
Each fall, DWSD sends customers flow projections for review and feedback. These flow projections are based on each customer’s historical trend. If a customer feels their data will change significantly in the coming year, their revised projection is used.
DWSD, through the Water Rates Work Group of the Technical Advisory Committee, holds a series of meetings during the “rates season” to share informa-tion that will be used for rate calculations and prelimi-nary information regarding rate development. The planned schedule for these meetings is shown below.
11. Is it true that DWSD makes a profit on the water system?No, DWSD is not legally allowed to make or seek profits.
By Michigan law, DWSD and other utilities (like Kalamazoo) are allowed to charge customers a return on investment for the facilities that its citizens have invested in to provide water to its customers. This return on investment fee is often mistakenly confused with profit. The City of Detroit returns this fee to its citizens in the form of lower rates. This fee is not returned in any portion to the operating funds for the City of Detroit.
12

The DWSD water service area includes 126 communities extending as far north as Flint and as far south as Monroe County.
DWSD Water System Basics
The DWSD water system emerged in the early 1700’s when water was drawn from the Detroit River by dipping pails and casks and delivered by horse and wagon. In 1827, the citizens of Detroit installed the first water distribution system to serve a population of 1,500 residents at a cost of $10 per year.
The system has evolved and now provides an average of 650 million gallons of water each day to over four million people in Southeastern Michigan. Today, there are more than 2,000 employees in DWSD who strive daily to perform their mission:
To exceed our customers’ expectations through the innovative treatment and transmission of water and wastewater, and the provision of services that promote healthy communities and economic growth.
Overall, the DWSD service area covers 1,215 square miles. In addition to the residents of the city of Detroit, the DWSD system provides water to 125 communities, extending in area from Flint in the north to Monroe County in the south and to Ypsilanti in the west.
DWSD draws water from the Detroit River and Lake Huron. Three intakes supply raw water to DWSD’s five water treatment plants. These plants distribute water through 3,400 miles of water pipes using 22 pumping stations and 17 reservoirs, all designed to deliver adequate pressure to customers from freezing winter mornings to the sweltering summer after-noons.
DWSD takes its role very seriously in protecting the health and well being of its customers. The U.S. Geological Survey, Michigan Department of Environmental Quality (MDEQ), and DWSD constantly strive to identify potential contamination threats to the water supply system. Over the next ten years, DWSD plans to make many improvements to meet and/or exceed state water quality standards.
Detroit Water System Map
13
While treatment and construction methods have changed over the decades, DWSD’s focus has remained on innovative treatment and transmission of water. This service is as critical today, for healthy communities and economic growth, as it was when the system started in 1827.

Water Distribution from Water Treatment Plant
What Happens When You Turn on your Faucet?
Depending on where you live, your water can travel several hundred miles before it reaches your home. This journey begins either from the Detroit River or Lake Huron where the water travels through an intake structure to a water treatment plant.
At the plants, the water is treated through a three-step process and disinfected to produce safe drinking water. Huge pumps at DWSD’s plants deliver the water into the distribution system. Then, additional pumping stations and large water reservoirs, strategi-cally located throughout the system, ensure that water pressure is maintained at or above the MDEQ guidelines.
After traveling through pumps, pipes and reservoirs, the water arrives at the border of DWSD’s water customer communities. Most communities then distribute and sell the DWSD water to their citizens, for example, Dearborn or Washington Township. Some of the communities are wholesalers, mean-ing they sell water to other communities. Flint is an example of a wholesale customer. And, a few of the communities have joined together to form authori-ties. An example is the Southeastern Oakland County Water Authority (SOCWA). But, for all types of customers, the DWSD water typically travels through master meters at the community border and enters a local distribution system. From there it is moved to homes, buildings, factories, and even farms through a non-DWSD system of pipes, pumps, and in some cases, storage tanks.
14
Glossary
AWWA: American Water Works Association
Base-Extra Capacity: An AWWA approved rate methodology, used by utilities to be reimbursed for costs to supply water under average conditions and under peak demand conditions.
Board of Water Commissioners [BOWC]: By City Charter, the BOWC is charged with the governance of DWSD. The Mayor appoints the members of the Board. The members serve four-year terms and the terms are staggered so that not more than two members’ terms expire each year. The City Charter provides that at least four members of the Board must be residents of the City. The Board consists of four City residents plus three members representing suburban wholesale customers.
Capital Improvement Program: The typical capital project consists of three distinct phases: study, design, and construction. In some cases, phases are combined, such as study/design or design/construc-tion. For capital program purposes, each phase is considered to be a separate project. Financing is committed only for the current project phase, and not for any subsequent phase until that phase has been authorized to start.
Capital improvement programs cover a five-fiscal-year planning horizon. However, only the first year or two of the programs are actually funded. The department uses the pay as you go method of capital project funding rather than financing projects 100% in advance. The department uses maximum debt financing to pay for the capital programs. This means that the programs are paid for primarily through the sale of revenue bonds, with only a small amount of capital financing provided directly from annual revenues. These fiscal policies allow the department to minimize the impact of the capital programs on water and sewage rates.
Cost Function: The cost elements that make up the Rate Model. These elements originate from the Base-Extra Capacity rate making methodology used by DWSD.
Cost of Service Allocation: The process of dividing the cost of operating the water system to the various functions needed to provide water to customer.
Fifty-Year Water Master Plan: DWSD has devel-oped a large-scale master plan to assess the depart-ment’s infrastructure needs over the next 50 years. This master plan was delivered in 2004.
First Tier Water Customers: Water customers that have contracts for water delivery service with DWSD. There are 86 First Tier customer communities.
Mcf: 1000 cubic feet for approximately 7500 gallons of water.
Master Meter: A billing meter that records a com-munity’s water consumption.
Operations and Maintenance Costs: The costs associated with operating and maintaining the water plants and the distribution system.
TAC Water Rates Work Group: A cross functional team of DWSD and customer personnel who work collaboratively to identify and resolve rate issues.
Technical Advisory Committee [TAC]: The Technical Advisory Committee was created in 2003 as a partnership between DWSD and its customers to address water related issues that affect a large population of the customer base. There are currently individual workgroups that meet on a 4-6 week sched-ule dedicated to problem solving, education, and customer communication. The current key goals of the TAC are as follows:
• Negotiate a new model water contract with each wholesale customer community.
• Develop emergency communication protocols that continually address emergency preparedness.
• Working with Elected Officials to address issues as they are identified.
• Create rate setting policies and education that strive to satisfy the needs of the customer and DWSD.
Unaccounted for Water: Unaccounted for water is the difference between the total annual volume of water produced at the water treatment plants and the total annual volume of metered water consumption. This unaccounted for water stems from leaks in the transmission system, meter inaccuracies, lack of precise measurements of the actual water produced at the plants, and use of water for other purposes that is not metered such as fire fighting, etc.
Units of Service: The amount of service used by customer for each Cost Function.
15 January 2006