disentangling water, ion and polymer dynamics in an anion
TRANSCRIPT
Disentangling water, ion and polymer dynamics inan anion exchange membraneFabrizia Foglia
UCLQuentin Berrod
Laboratoire Léon Brillouin (CEA-CNRS) https://orcid.org/0000-0003-3254-1779Gérard Gebel
CEA LITENV. Sakai
Rutherford Appleton Laboratory https://orcid.org/0000-0001-6570-4218Markus Appel
Institut Laue LangevinJean-Marc Zanotti
Laboratoire Léon Brillouin (CEA-CNRS)Madhu Sudan Tyagi
National Institute of Standards and TechnologyNajet Mahmoudi
ISIS Neutron and Muon SourceAdam Clancy
University College London https://orcid.org/0000-0002-1791-8999Thomas Miller
University College LondonKeenan Smith
UCLDan Brett
University College LondonPaul Shearing
University College LondonSandrine Lyonnard
University Grenoble Alpes (UGA), CEA, CNRS, INAC-SyMMES, F-38000 GrenoblePaul McMillan ( [email protected] )
University College London https://orcid.org/0000-0002-5298-780X
Article

Keywords: polymer electrolyte membrane fuel cell systems, OH- transport, neutron scattering
Posted Date: November 20th, 2020
DOI: https://doi.org/10.21203/rs.3.rs-106476/v1
License: This work is licensed under a Creative Commons Attribution 4.0 International License. Read Full License
1
Disentangling water, ion and polymer dynamics in an anion exchange membrane. Fabrizia Foglia1*, Quentin Berrod2, Gérard Gebel2, Victoria García Sakai3, Markus Appel4, Jean-‐Marc Zanotti5, Madhusudan Tyagi6,7, Najet Mahmoudi3, Adam J. Clancy1, Thomas S. Miller8, Keenan Smith8, Daniel J. L. Brett8, Paul R. Shearing8, Sandrine Lyonnard2*, Paul F. McMillan1* 1 Department of Chemistry, Christopher Ingold Laboratory, University College London, 20 Gordon St., London WC1H 0AJ, UK. 2 Univ. Grenoble Alpes, CNRS, CEA, IRIG-‐SyMMES, 38000 Grenoble, France 3 ISIS Neutron and Muon Source, Rutherford Appleton Laboratory, Harwell Science and Innovation Campus, Chilton OX11 0QX, UK. 4 Institut Laue Langevin, 71 avenue des Martyrs, CS 20156, 38042 Grenoble CEDEX 9, France. 5 Laboratoire Léon Brillouin (CEA-‐CNRS), Université Paris-‐Saclay, CEA Saclay, 91191 Gif-‐sur-‐Yvette Cedex, France. 6 NIST Center for Neutron Research (NCNR), National Institute of Standards and Technology, Gaithersburg, MD 20899, USA. 7 Department of Materials Science and Engineering, University of Maryland, College Park, MD 20742, USA. 8 Electrochemical Innovation Lab, Department of Chemical Engineering, University College London, Torrington Place, London WC1E 7JE, UK.
Fuel cells that generate electrical power by the direct electrochemical conversion
of fuel to electricity are expected to become important sustainable energy sources
for transportation and stationary applications. Polymer electrolyte membrane fuel
cell (PEMFC) systems operating with oxygen and hydrogen or bio-‐derived fuels
require an ion exchange membrane to transport H+ or OH-‐ ions between the anode
and cathode. Proton conduction in Nafion membranes is well studied. However
these PEMFC systems rely on noble metal electrocatalysts due to the corrosive
nature of the acidic electrolyte. An alkaline electrolyte allows non-‐noble catalysts
to be used at the cathode, leading to reduced cost and enhanced sustainability.
Understanding OH-‐ transport and how it influences water management and
polymer dynamics in anion exchange membranes (AEMs) is a critical design
challenge and design parameter. Here, neutron scattering is used to disentangle
the water, polymer relaxation and OH-‐ diffusion dynamics in a commercial AEM
system.
The use of fuel cell (FC) devices for power generation is developing rapidly as we transition from fossil-‐fuelled combustion to electrochemical propulsion and stationary power systems. PEMFCs operate by electrochemically splitting molecules such as H2/CH3OH to produce H+ or OH-‐ ions at the anode along with electrons that are directed through an external circuit to generate electrical power. The ions are transported via an ionically conducting polymer (ionomer) to participate in recombination reactions at the opposite electrode [1]. Cell performance is determined by the electrocatalytic efficiency of supported transition metal nanoparticles at the electrodes and by the transport dynamics of ions and water within the electrolyte. A large class of H+-‐conducting ionomers is derived from the Nafion family of sulfonated tetrafluoroethylene-‐based fluoropolymer-‐copolymers, while OH-‐-‐conducting membranes are commercially available as the Fumasep
2
(FuMA-‐Tech GmbH) and other AEMs based on a hydrophobic polymer backbone [2-‐4] functionalized with quaternary ammonium (QA), imidazole or guanidinium cations for OH-‐ transport [3-‐5].
PEMFCs that incorporate H+-‐conducting membranes typically rely on precious metal catalysts such as Pt to mediate H+ production through anodic hydrogen oxidation and the oxygen reduction reaction (ORR) at the cathode [6]. Alkaline fuel cells that produce OH-‐ ions from an air/water mixture use lower-‐cost and more sustainable non-‐noble catalysts at the cathode (Fig. 1a), as the ORR is more facile in alkaline media [7]. However, their adoption requires the development of more efficient AEMs to optimise their chemical, thermal and mechanical durability, as well as their processability and production costs. Achieving these goals requires better understanding of the OH-‐ and H2O transport in relation to the polymer dynamics [7-‐8]. Present AEM formulations are targeted at improving OH-‐ conductivity to reach similar conductance to that in Nafion [9-‐11]. Simulation studies indicate that ionic current flow in AEMs occurs by a combination of vehicular OH-‐ diffusion and Grotthuss hopping of protons through the H-‐bonded water network solvated by ionomer side groups (Figs. 1b-‐d) [12-‐17]. Changes in water content under operational conditions affect both H2O and OH-‐ mobility, that are impacted by the molecular architecture of ion-‐conducting channels within the ionomer [9,15-‐19]. Although the water, ion and polymer dynamics are expected to be strongly coupled on picosecond (ps) to nanosecond (ns) timescales over dimensions up to several nm, the relationships between these processes are currently not well understood.
Quasi-‐elastic neutron scattering (QENS) provides a powerful technique to study these processes, with the capacity to combine selective chemical and isotopic substitutions with data obtained at instruments with different characteristic time resolution to disentangle the various dynamical contributions. Nafion membranes and related model systems have been probed extensively using QENS [20-‐25]. Pioneering QENS results on AEMs were used to describe the water dynamics within the polymer matrix but were unable observe the OH-‐ hopping process nor its correlation with water content [26-‐27], that is known to be critical for fuel cell operation.
Here we present QENS data for a commercial Fumasep-‐FAD AEM [28-‐32] in its native Br-‐ as well as OH/OD-‐substituted forms. The membranes were examined over a wide range of temperatures and hydration levels (λ), using different spectrometers to probe the relaxation and transport dynamics over a range of timescales, and disentangle details of the polymer-‐water interactions and OH-‐-‐conductivity mechanism (Figs. 1e-‐g).
3
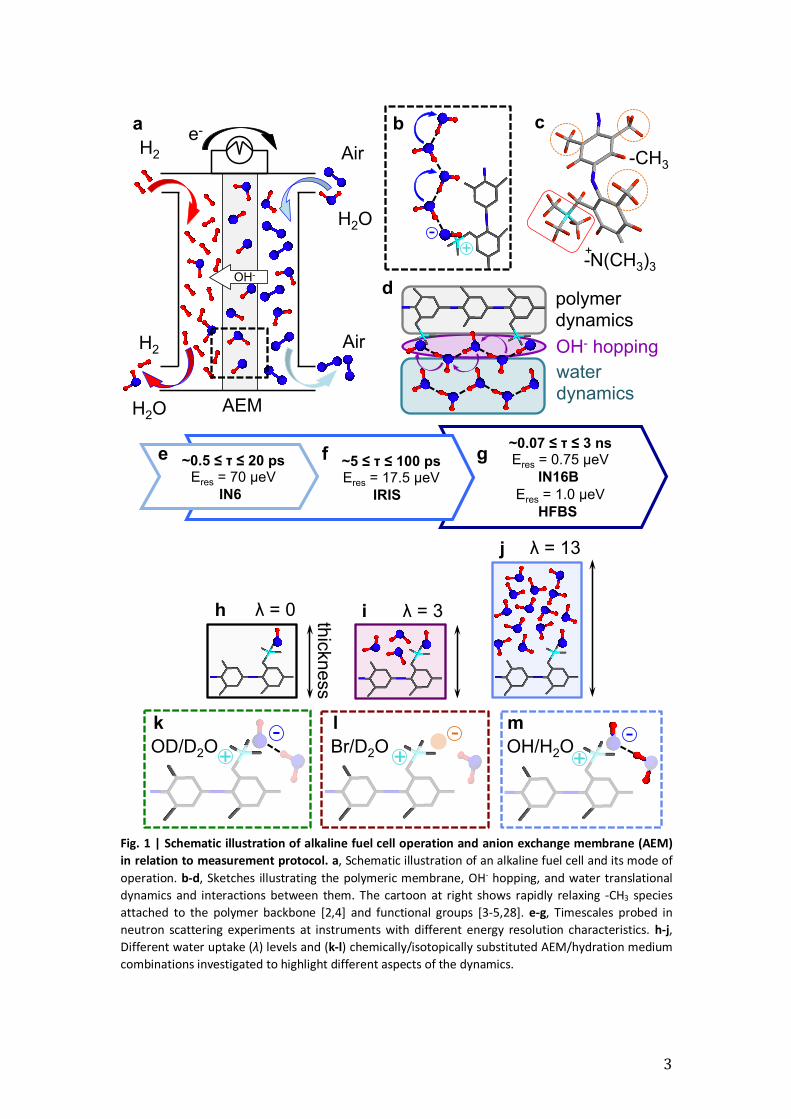
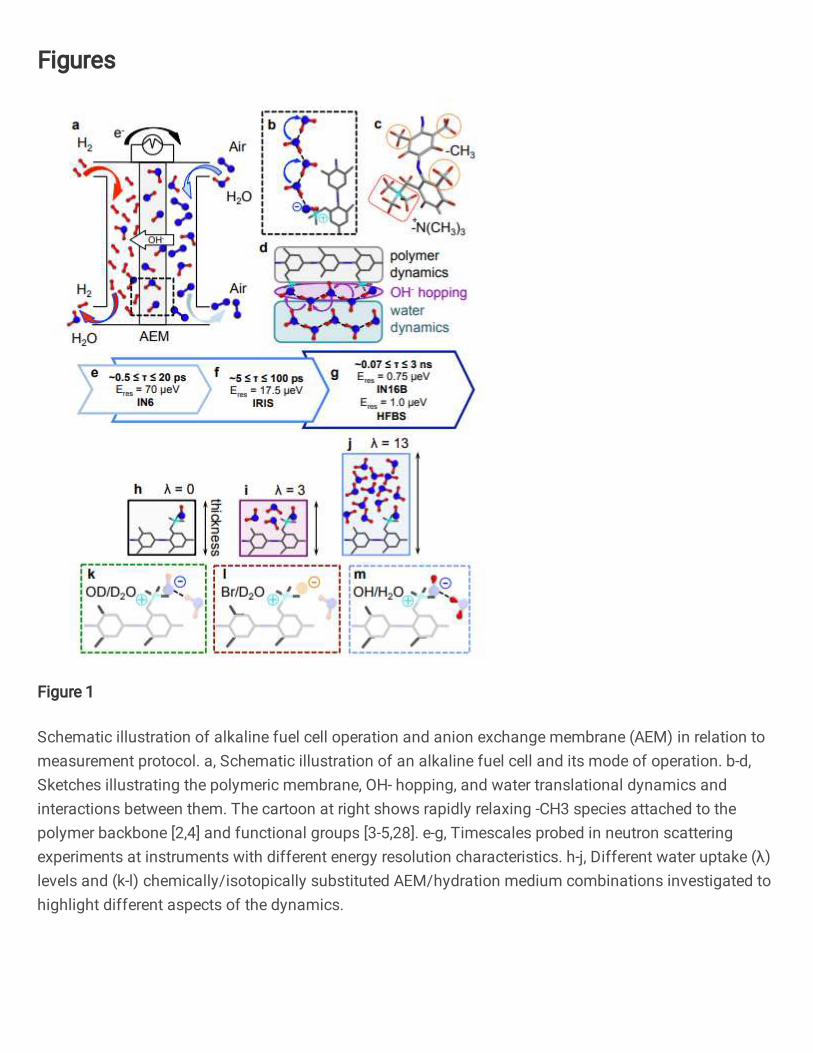
Fig. 1 | Schematic illustration of alkaline fuel cell operation and anion exchange membrane (AEM)
in relation to measurement protocol. a, Schematic illustration of an alkaline fuel cell and its mode of
operation. b-‐d, Sketches illustrating the polymeric membrane, OH-‐ hopping, and water translational
dynamics and interactions between them. The cartoon at right shows rapidly relaxing -‐CH3 species
attached to the polymer backbone [2,4] and functional groups [3-‐5,28]. e-‐g, Timescales probed in
neutron scattering experiments at instruments with different energy resolution characteristics. h-‐j,
Different water uptake (λ) levels and (k-‐l) chemically/isotopically substituted AEM/hydration medium
combinations investigated to highlight different aspects of the dynamics.
k l m
OD/D2O Br/D2O OH/H2O
OH-
e-
Air
H2O
H2
H2
H2O
Air
AEM
a
h i
j
λ = 0 λ = 3
λ = 13
thic
kn
ess
+ -
b
polymer dynamics
OH- hopping
water dynamics
~0.5 ≤ τ ≤ 20 ps Eres = 70 µeV
IN6
~5 ≤ τ ≤ 100 ps Eres = 17.5 µeV
IRIS
~0.07 ≤ τ ≤ 3 ns Eres = 0.75 µeV
IN16B
Eres = 1.0 µeV
HFBS
e f g
d
c
- +
- +
- +
-CH3
-N(CH3)3
+
4
Samples and measurement conditions
To evaluate the effects of membrane swelling and water content on the ion mobility, membranes were examined in states ranging from dry (λ=0) to fully hydrated (λ=13) (see Supplementary Information for details). To disentangle contributions to the polymer, H2O and OH-‐ dynamics, chemically and isotopically substituted versions of the FAD membrane and its hydrating medium were examined: i) the sample in its native Br-‐form hydrated in D2O; ii) the membrane in OH-‐form hydrated in H2O; iii) the AEM sample in OD-‐form hydrated in D2O (Figs. 1k-‐m). The fully deuterated contrast (OD/D2O) was designed to focus mainly on polymer backbone relaxation, including QA methyl side group rotation (Fig. 1c). The fully hydrogenated (OH/H2O) sample targeted water (at λ=13) and OH-‐ hopping dynamics that were revealed at high-‐energy resolution. Comparisons with the Br/D2O membrane data allowed us to evaluate the potential effects of OH-‐ nucleophilic attack on the QA side groups, that are considered to be a primary cause of degradation in AEM performance especially at low hydration levels [5,18,33-‐34]. Our QENS studies showed no change in the rotational response of methyl units attached to the QA groups indicating that little or no degradation occurred during our experiments. This result is supported by SANS, SAXS/WAXS and IR spectroscopic data (see Supplementary Information). Neutron scattering experiments were carried out using instruments at the ISIS Neutron and Muon Spallation Source (Harwell, UK), the Institut Laue Langevin (ILL, Grenoble, France), and the NIST Center for Neutron Research (Gaithersburg, USA) providing different energy resolutions (Eres) allowing access to different relaxation timescales. These instruments were: i) the high-‐resolution backscattering (BS) spectrometers IN16B (ILL) and HFBS (NIST) with Eres=0.75 and 1 μeV, respectively (~0.07-‐3 ns); ii) the time-‐of-‐flight (TOF) near-‐BS spectrometer IRIS (ISIS) with Eres=17.5 μeV (~5-‐100 ps) and iii) the IN6-‐Sharp (operated by the Laboratoire Léon Brillouin at ILL) TOF spectrometer (Eres=70 μeV at λ=5.12 Å; ~0.5-‐20 ps) (Figs. 1e-‐g).
Different dynamic regimes and relaxation processes revealed by EFWS/IFWS
Elastic and Inelastic scattering intensities were studied using Fixed Window Scan (EFWS/IFWS) analysis by increasing (IN16B, HFBS, IN6-‐Sharp) or lowering (IRIS) temperature (T) between 2-‐325 K. EFWS data and mean square atomic displacements (msd) extracted by Debye-‐Waller analysis are shown in Figure 2, with complementary IFWS data shown in Supplementary Information. The EFWS, msd and IFWS data provide insight into the sequential activation of different dynamical processes (i) as a function of T. As each process becomes activated at Ti, the elastic intensity drops accompanied by a corresponding increase in inelastic intensity so that the onset of different dynamic processes is revealed by slope changes in the EFWS and IFWS intensity profiles. These EFWS/IFWS variations are modulated by the finite energy or timescale resolution available to each spectrometer, with the dynamics becoming either too fast or too slow compared with the observational window. Analysis of the datasets obtained across the different instruments thus permits recognition of different dynamic regimes and relaxation behaviours as a function of temperature across all AEM samples and hydration states (Fig. 2).

5
Fig. 2 | EFWS Intensity and Mean Squared Displacement (msd) Data for FAD-‐55 Membrane. Profiles
were been recorded for FAD-‐55 at different hydration levels (0≤λ≤13) and isotopic compositions
(OH/H2O and Br/D2O) at instruments with different Eres. The datasets are separated according to
hydration level. a-‐b, dry sample (λ=0). c-‐d, low-‐hydrated samples (λ=3). e-‐f, fully-‐hydrated samples
(λ=13). Data obtained at each instrument are designated by different panel outlines: i) 0.75 μeV
(IN16B; solid light blue); ii) 1.0 μeV (HFBS; dashed light blue); iii) 17.5 μeV (IRIS; solid blue) and iv) 70
μeV (IN6-‐Sharp; dark blue). Samples with λ=0 are shown as black symbols; OH/H2O-‐hydrated samples
are reported as blue (λ=13) and purple (λ=3) symbols; Br/D2O-‐hydrated samples are designated by
brown (λ=13) and pink (λ=3) symbols. Information extracted on mean square displacements (msd) are
provided at right in each panel. The msd slope extrapolated from data at low-‐T is shown as a black
line. The plots are used to highlight four dynamic ranges of interest: 1) -‐CH3 polymer dynamics; 2)
side-‐chain polymer dynamics; 3) water dynamics and 4) ion hopping. Corresponding IFWS data and
analysis details are provided in Supplementary Information.
Region 1 at lowest T is characterized by a regular loss in EFWS intensity accompanied by an msd increase up to ~200 K, with average slope d<u2>/dT~7.4±0.8 10-‐4 Å2 K-‐1 for λ=0-‐3 (IN16B, HFBS, IRIS), increasing to 13.4±0.2 10-‐4 Å2 K-‐1 when examined within the fast (0.5-‐20 ps) timescale window of IN6-‐Sharp. The dry membrane exhibits a corresponding msd increase above 50 K when investigated at the high-‐resolution HFBS instrument (Fig. 2a). We assign these effects excited at low temperature to fast rotations of -‐CH3 groups attached to the polymer [35]. The larger msd change
0.6
0.8
1.0
0
0
1
0
5
0
0
2
4
6
ho
pp
ing
1.0
0.8
0.6
0 100 200 300 0 100 200 300
0.5
0.0
1.0
1 2
4
sid
e c
ha
in
-CH3
rotation
msd (Å2)
EFWS
OH/H2O
Br/D2O
0.6
0.3
0.0
1.0
0.8
0.6
0 100 200 300 0 100 200 300
2
EFWS
msd (Å2)
side chain dynamics
a
1.0
0.8
0.6
1.0
0.5
0.0
0 100 200 300 0 100 200 300
3
EFWS
msd (Å2)
water dynamics
λ =
13
f
Temperature (K) Temperature (K)
<u
2>a
pp
are
nt (Å
2)
EFWS
1.0
0.5
0.0 0 100 200 300 0 100 200 300
2.0
1.0
0.0
I inc_
ela
stic
1 2
3 4 msd (Å2)
EFWS
1.0
0.5
0.0 0 100 200 300 0 100 200 300
6.0
2.0 4.0
1 2
3
4
0.0
e
msd (Å2)
c side chain + water dynamics
<u
2>a
pp
are
nt (Å
2)
1.0
0.5
0.0 0 100 200 300 0 100 200 300
1.5
1.0
0.5
0.0
I inc_
ela
stic
2
3
EFWS
msd (Å2)
λ =
3
b
d
λ =
0
wa
ter
<u
2>a
pp
are
nt (Å
2)
I inc_
ela
stic
<u
2>a
pp
are
nt (Å
2)
<u
2>a
pp
are
nt (Å
2)
I inc_
ela
stic
I inc_
ela
stic
I inc_
ela
stic
<u
2>a
pp
are
nt (Å
2) HFBS
HFBS
IN16B
IN6-Sharp
IN6-Sharp
IRIS

6
recorded at IN6-‐Sharp occurs as additional large-‐amplitude and acoustic-‐type motions of the polymer backbone contribute to the excitation profile.
In region 2 (>200 K) we observe a rapid EFWS decrease accompanied by a sharp msd rise for H2O-‐hydrated samples (λ=3; Fig. 2c), along with an IFWS intensity maximum recorded at IN16B (Fig. S3). This apparent maximum arises as the probed dynamics enter the backscattering window at ~200 K, to reach an energy-‐dependent maximum at ~260 K, and then vanish at higher T as the motional timescales became faster than the observational window. The relaxation time (τ) for this feature is independent of the scattering correlation length (Q) indicating a spatially localized process, as is also found for the -‐CH3 rotational excitations discussed above, but on a slower timescale. Because analogous behaviour is observed for different AEM hydration levels as well as for OH/H2O and Br/D2O samples, we can assign these additional features to activation of fast polymer side-‐chain dynamics occurring on a few ps timescale.
Region 3 is recognised by a sudden drop in EFWS intensity beginning at 250 K, clearly visible across the entire range of slower (IN16B/HFBS, Figs. 2c,e), intermediate (IRIS, Fig. 2d) to fast (IN6-‐Sharp, Fig. 2f) timescale measurements. The activated process shows a Q-‐dependency at low-‐Q indicating a contribution from centre-‐of-‐mass (c-‐o-‐m) mobility of the species involved. The EFWS changes are more pronounced for H2O-‐ than D2O-‐hydrated samples (Fig. 2d), with the number of mobile species determined to be proportional to the hydration state, while the effects are almost undetectable for the nominally dry membrane (λ=0; Fig 2a). An accompanying increase in IFWS intensity observed above 250 K is similarly dependent on the hydration state and isotopic composition (Supplementary Information). We assign this additional Q-‐dependent process to the onset of rotational-‐translational water dynamics activated within hydrated AEM samples.
Region 4 is first observed as a moderate but regular decrease in EFWS intensity for the λ=3 sample measured on IN16B above T~270 K, accompanied by a continued msd increase with reduced slope (Fig. 2c). Similar changes are observed for λ=13 at HFBS (Fig. 2e). These observations indicate activation of a further dynamic process occurring on a much slower timescale than those described above. The IFWS signal is found to be Q-‐invariant (Fig. S3) indicating localized dynamics. Slight changes in the EFWS and msd slopes in the HFBS and IN6-‐Sharp datasets for λ=0 at this temperature can also be attributed to the same thermally activated relaxation (Figs. 2a,b). We assign this additional process to ion hopping dynamics, as observed for Nafion [23]. It is only clearly detectable on high-‐resolution spectrometers, where although both polymer motions and roto-‐translational water dynamics remain active, they have become too fast to be observed as discrete contributions to the EFWS and IFWS signatures within the resolution window available to lower-‐resolution instruments.
Relaxation processes revealed by QENS analysis in the energy exchange domain QENS broadening is developed around the base of the elastic line as a function of the energy resolution due to scattering by relaxational or diffusional processes. We analyzed QENS contributions to datasets plotted in the energy domain between 230-‐325 K and 0≤λ≤13 by fitting Lorentzian functions guided by the EFWS, msd and IFWS results described above (Fig. 3; analysis details in Supplementary).
7
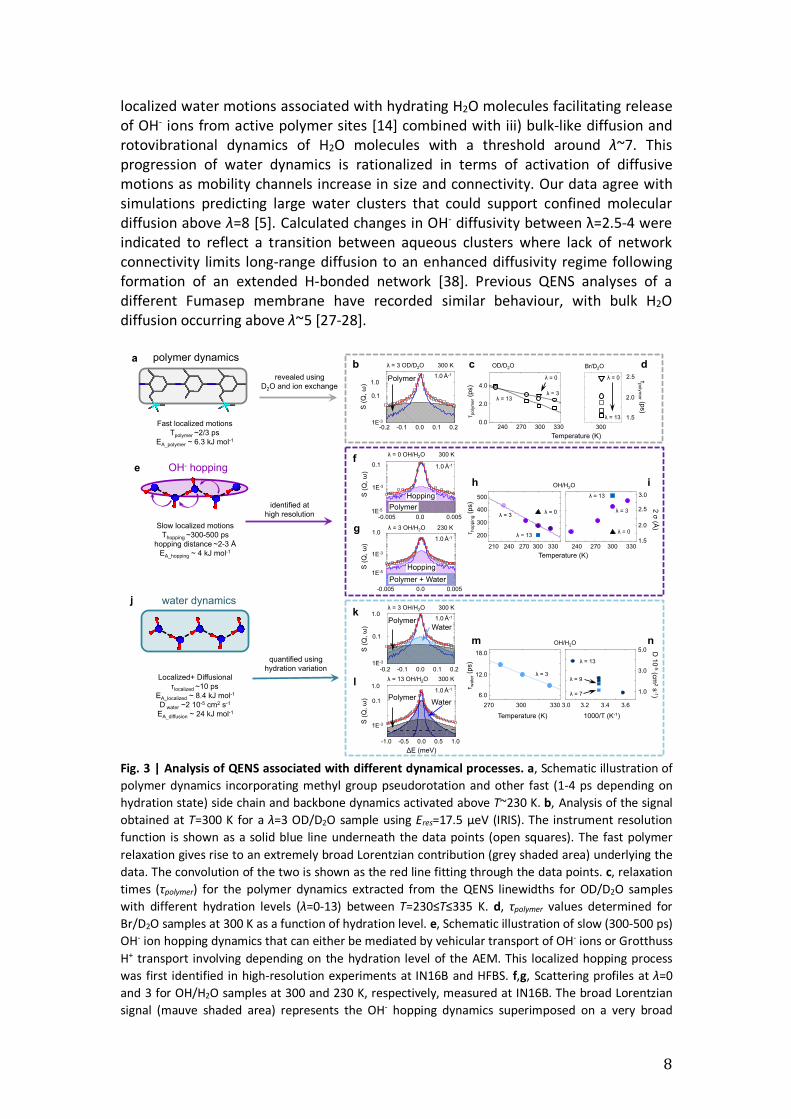
We first describe the fast (1-‐4 ps) Q-‐independent polymer backbone and side-‐chain dynamics for samples containing no mobile protons in the ionic phase (D2O-‐hydrated samples on IRIS and IN6-‐Sharp) [36] (Figs. 3a-‐d). These localised dynamics present above 230 K with an activation energy EA,polymer~6.3 kJ mol-‐1 display a decrease in relaxation time (τpolymer) with increasing temperature with enhanced slope for higher hydration levels (Fig. 3c,d). Because these polymer dynamics are present for all samples this contribution was constrained to be a common component present for all the dataset analyses.
In high-‐resolution (e.g. IN16B: Eres=0.75 µeV) datasets this provides part of a broad underlying QENS contribution, accompanied by a Q-‐independent Lorentzian signal of much smaller width (a few μeV, equivalent to ~400 ps) assigned to slow OH-‐ hopping dynamics (Figs. 3e-‐g) [16]. This contribution was first detected for λ=0 samples and was maintained at higher hydration levels where the broad background contained contributions from both polymer and H2O relaxations (Figs. 3f,g). The OH-‐ residence time (τhopping) and mean hopping distance (2σ) were determined from the Q-‐independent QENS half-‐width at half-‐maximum (τhopping=ħ/Γ) and intensity (I=(1-‐exp(-‐Q2σ2) (Figs. 3h,i) [23]). At λ=3 the feature becomes visible at lower temperature (230 K), indicating coupling between OH-‐ hopping and the hydrated environment (Fig. 3g).
Analysis of the data indicated a pronounced T-‐dependency between 230-‐325 K with an average activation energy EA=4.0±0.2 kJ mol-‐1 (depending on the hydration state) accompanied by an increase of the hopping distance 2σ between 1.8-‐2.8 Å (Figs. 3h,i). Increasing hydration from λ=0-‐13 led to a reduction in τhopping between 380-‐200 ps associated with longer (3 vs 1.8 Å) jump distances (Figs. 3h,i). These values agree with simulation results indicating a combination of ballistic, sub-‐diffusive/rattling and diffusive components of OH-‐ transport dynamics operating in different but overlapping time regimes [14]. The determined values of τhopping and 2σ, especially at λ=3, indicate that on the IN16B experimental timescale mainly OH-‐ ‘rattle and hop’ events are being probed, with minimal coupling to longer-‐range molecular/anionic mobility mechanisms [37]. When probed with a faster time window (e.g. IRIS/IN6-‐Sharp) OH-‐ hopping becomes undetectable, as this component becomes incorporated to the elastic line, while the polymer fast-‐relaxation component is complemented by a further Lorentzian signal. This new feature is associated with dynamics of water molecules incorporated in the AEM samples (Fig. 3j), and its behaviour evolves as a function of hydration levels. At λ=3 (Fig. 3k) it shows Q-‐independent behaviour, compatible with localized dynamics (τ~10 ps and EA~8.4 kJ mol-‐1; Fig. 3m). By λ=13 (Fig. 3j) the water dynamics have become Q-‐dependent, indicating translationally mobile H2O molecules (Fig. 3n).
We note that in all these cases an additional approximately linear or extremely broad Lorentzian background was required to account for very fast (sub-‐ps) relaxations extending from the vibrational regime. Our QENS analyses correspond to the interpretation of the EFWS/msd/IFWS datasets above by describing separate but coupled dynamical regimes and relaxation phenomena, that enter the relaxation profile probed by the QENS experiments conducted for isotopically-‐ and chemically-‐substituted AEM samples, exposed to H2O/D2O solvents, as a function of hydration levels and temperatures. These include i) polymer side-‐chain and backbone dynamics that operate for all samples throughout the temperature range; ii)
8
localized water motions associated with hydrating H2O molecules facilitating release of OH-‐ ions from active polymer sites [14] combined with iii) bulk-‐like diffusion and rotovibrational dynamics of H2O molecules with a threshold around λ~7. This progression of water dynamics is rationalized in terms of activation of diffusive motions as mobility channels increase in size and connectivity. Our data agree with simulations predicting large water clusters that could support confined molecular diffusion above λ=8 [5]. Calculated changes in OH-‐ diffusivity between λ=2.5-‐4 were indicated to reflect a transition between aqueous clusters where lack of network connectivity limits long-‐range diffusion to an enhanced diffusivity regime following formation of an extended H-‐bonded network [38]. Previous QENS analyses of a different Fumasep membrane have recorded similar behaviour, with bulk H2O diffusion occurring above λ~5 [27-‐28].
Fig. 3 | Analysis of QENS associated with different dynamical processes. a, Schematic illustration of
polymer dynamics incorporating methyl group pseudorotation and other fast (1-‐4 ps depending on
hydration state) side chain and backbone dynamics activated above T~230 K. b, Analysis of the signal
obtained at T=300 K for a λ=3 OD/D2O sample using Eres=17.5 μeV (IRIS). The instrument resolution
function is shown as a solid blue line underneath the data points (open squares). The fast polymer
relaxation gives rise to an extremely broad Lorentzian contribution (grey shaded area) underlying the
data. The convolution of the two is shown as the red line fitting through the data points. c, relaxation
times (τpolymer) for the polymer dynamics extracted from the QENS linewidths for OD/D2O samples
with different hydration levels (λ=0-‐13) between T=230≤T≤335 K. d, τpolymer values determined for
Br/D2O samples at 300 K as a function of hydration level. e, Schematic illustration of slow (300-‐500 ps)
OH-‐ ion hopping dynamics that can either be mediated by vehicular transport of OH-‐ ions or Grotthuss
H+ transport involving depending on the hydration level of the AEM. This localized hopping process
was first identified in high-‐resolution experiments at IN16B and HFBS. f,g, Scattering profiles at λ=0
and 3 for OH/H2O samples at 300 and 230 K, respectively, measured at IN16B. The broad Lorentzian
signal (mauve shaded area) represents the OH-‐ hopping dynamics superimposed on a very broad
b c d
-0.005 0.0 0.005
0.1
1E-3
λ = 0 OH/H2O 300 K
S (
Q, ω
)
1E-5
Hopping
Polymer
1.0 Å-1
-0.2 -0.1 0.0 0.1 0.2
001
.01
0.1
1
-0.2 -0.1 0.0 0.1 0.2
1.0
0.1
1E-3
λ = 3 OH/H2O 300 K
1.0 Å-1
S (
Q, ω
) Water Polymer
-1.0 -0.5 0.0 0.5 1.0
1.0
0.1
1E-3
λ = 13 OH/H2O 300 K
1.0 Å-1
S (
Q, ω
) Water Polymer
01
01
.1
1
-0.2 -0.1 0.0 0.1 0.2
1.0
0.1
1E-3
λ = 3 OD/D2O 300 K
1.0 Å-1
S (
Q, ω
)
Polymer λ = 0 τp
olym
er (p
s)
λ = 13
300
2.5
2.0
1.5
Br/D2O
λ = 13 λ = 3
OD/D2O
240 270 300 330
4.0
2.0
0.0
τp
oly
mer (
ps)
Temperature (K)
λ = 0
OH/H2O
2 σ
(Å)
3.0
2.5
2.0
210 240 270 300 330 240 270 300 330
Temperature (K)
τh
op
pin
g (
ps)
500
400
200
300
1.5 λ = 13
λ = 3 λ = 0
λ = 0
λ = 13
λ = 3
λ = 3
OH/H2O
18.0
τw
ate
r (p
s)
270 300 330 3.0 3.2 3.4 3.6
12.0
6.0
Temperature (K) 1000/T (K-1)
5.0
3.0
1.0
D 1
0-5 (cm
2 s-1)
ΔE (meV)
Fast localized motions Τpolymer ~2/3 ps
EA_polymer ~ 6.3 kJ mol-1
Slow localized motions Τhopping ~300-500 ps
hopping distance ~2-3 Å EA_hopping ~ 4 kJ mol-1
Localized+ Diffusional τlocalized ~10 ps
EA_localized ~ 8.4 kJ mol-1
D water ~2 10-5 cm2 s-1
EA_diffusion ~ 24 kJ mol-1
polymer dynamics
OH- hopping
water dynamics
revealed using D2O and ion exchange
quantified using hydration variation
1E
1E
0.
0.
0.
1
-0.005 0.0 0.005
1.0
S (
Q, ω
)
λ = 3 OH/H2O 230 K
1E-3
1E-5 Hopping
Polymer + Water
1.0 Å-1
identified at high resolution
λ = 13
λ = 9
λ = 7
a
e f
g
j
h i
k
l
m n
9
background (grey) corresponding to underlying polymer (f for λ=0) or polymer + H2O (g: λ=3)
dynamics, that both occur on too rapid timescales to contribute to the narrower Lorentzian function
within the instrumental Eres (0.75 μeV). Symbols and lines for the experimental data (squares),
instrumental resolution function (blue) and global fit (red) are as before. h, Hopping dynamics
timescale (τhopping) extracted from QENS linewidths as a function of temperature (230≤T≤335 K) for
OH/H2O samples with 0≤λ≤13. i. OH-‐ hopping distance (2σ) modelled from QENS data for
0≤λ≤13OH/H2O samples between 230≤T≤335 K. j, Schematic illustration indicating pseudorotational,
diffusional and sometimes nanoconfined dynamics of H2O molecules occurring within hydrated
membrane samples over intermediate (6-‐14 ps) timescales. k,l, Scattering profiles for OH/H2O
samples with λ=3 and 13 recorded at 300 K with Eres=17.5 (IRIS) and 70 (IN6-‐Sharp) μeV, respectively.
The H2O dynamics give rise to the main Lorentzian contribution with narrower linewidth (light blue
shaded) with a significantly broader "background" signal due to polymer relaxations (grey shaded
component). m, H2O relaxation timescale determined from QENS linewidths for λ=3 at T=230≤T≤335
K. n, Diffusion constants (cm2 s-‐1) determined from fitting QENS profiles for mobile H2O molecules
within AEM samples with λ=7-‐13 plotted as a function of 1000/T.
Analyzing the intermediate scattering function to disentangle different relaxation
timescales
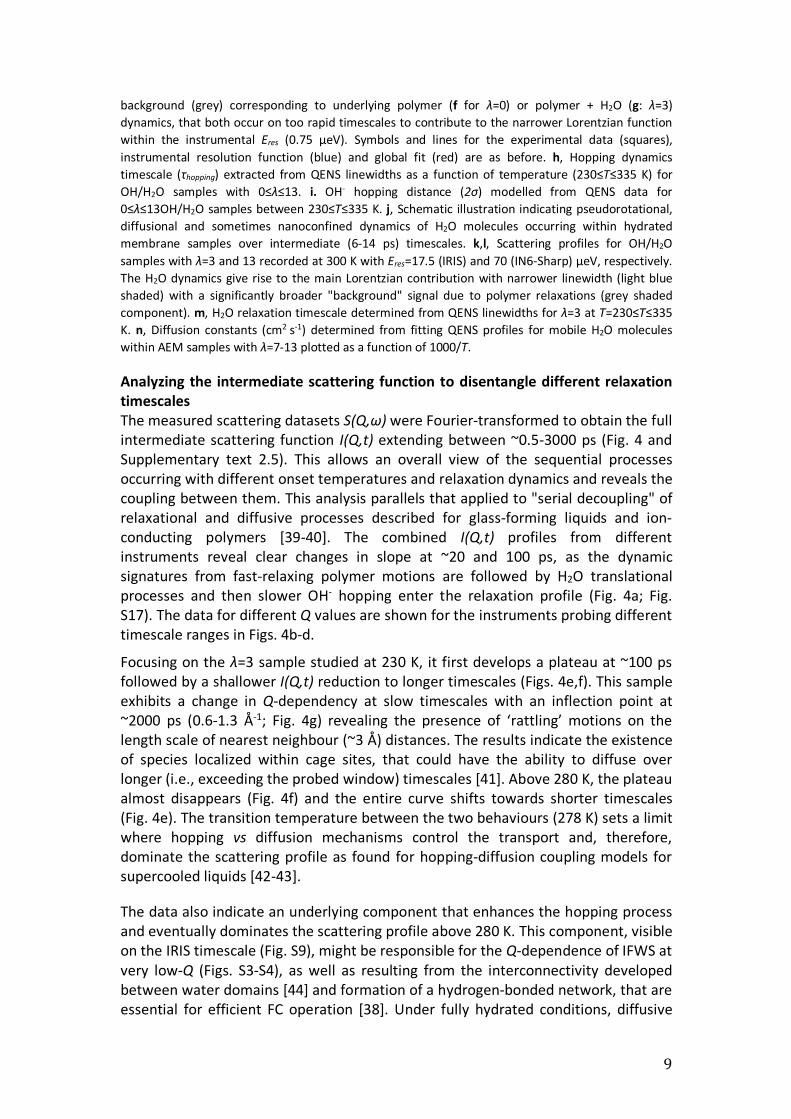
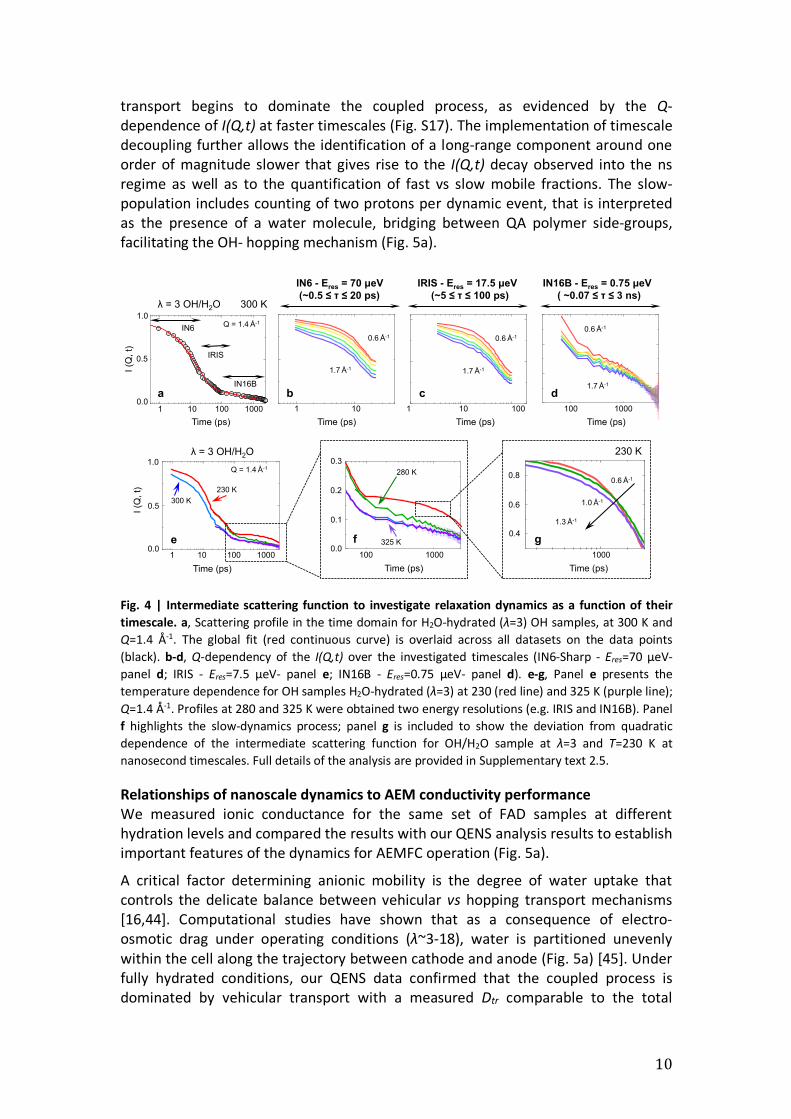
The measured scattering datasets S(Q,ω) were Fourier-‐transformed to obtain the full intermediate scattering function I(Q,t) extending between ~0.5-‐3000 ps (Fig. 4 and Supplementary text 2.5). This allows an overall view of the sequential processes occurring with different onset temperatures and relaxation dynamics and reveals the coupling between them. This analysis parallels that applied to "serial decoupling" of relaxational and diffusive processes described for glass-‐forming liquids and ion-‐conducting polymers [39-‐40]. The combined I(Q,t) profiles from different instruments reveal clear changes in slope at ~20 and 100 ps, as the dynamic signatures from fast-‐relaxing polymer motions are followed by H2O translational processes and then slower OH-‐ hopping enter the relaxation profile (Fig. 4a; Fig. S17). The data for different Q values are shown for the instruments probing different timescale ranges in Figs. 4b-‐d.
Focusing on the λ=3 sample studied at 230 K, it first develops a plateau at ~100 ps followed by a shallower I(Q,t) reduction to longer timescales (Figs. 4e,f). This sample exhibits a change in Q-‐dependency at slow timescales with an inflection point at ~2000 ps (0.6-‐1.3 Å-‐1; Fig. 4g) revealing the presence of ‘rattling’ motions on the length scale of nearest neighbour (~3 Å) distances. The results indicate the existence of species localized within cage sites, that could have the ability to diffuse over longer (i.e., exceeding the probed window) timescales [41]. Above 280 K, the plateau almost disappears (Fig. 4f) and the entire curve shifts towards shorter timescales (Fig. 4e). The transition temperature between the two behaviours (278 K) sets a limit where hopping vs diffusion mechanisms control the transport and, therefore, dominate the scattering profile as found for hopping-‐diffusion coupling models for supercooled liquids [42-‐43].
The data also indicate an underlying component that enhances the hopping process and eventually dominates the scattering profile above 280 K. This component, visible on the IRIS timescale (Fig. S9), might be responsible for the Q-‐dependence of IFWS at very low-‐Q (Figs. S3-‐S4), as well as resulting from the interconnectivity developed between water domains [44] and formation of a hydrogen-‐bonded network, that are essential for efficient FC operation [38]. Under fully hydrated conditions, diffusive
10
transport begins to dominate the coupled process, as evidenced by the Q-‐dependence of I(Q,t) at faster timescales (Fig. S17). The implementation of timescale decoupling further allows the identification of a long-‐range component around one order of magnitude slower that gives rise to the I(Q,t) decay observed into the ns regime as well as to the quantification of fast vs slow mobile fractions. The slow-‐population includes counting of two protons per dynamic event, that is interpreted as the presence of a water molecule, bridging between QA polymer side-‐groups, facilitating the OH-‐ hopping mechanism (Fig. 5a).
Fig. 4 | Intermediate scattering function to investigate relaxation dynamics as a function of their
timescale. a, Scattering profile in the time domain for H2O-‐hydrated (λ=3) OH samples, at 300 K and
Q=1.4 Å-‐1. The global fit (red continuous curve) is overlaid across all datasets on the data points
(black). b-‐d, Q-‐dependency of the I(Q,t) over the investigated timescales (IN6-‐Sharp -‐ Eres=70 μeV-‐
panel d; IRIS -‐ Eres=7.5 μeV-‐ panel e; IN16B -‐ Eres=0.75 μeV-‐ panel d). e-‐g, Panel e presents the
temperature dependence for OH samples H2O-‐hydrated (λ=3) at 230 (red line) and 325 K (purple line);
Q=1.4 Å-‐1. Profiles at 280 and 325 K were obtained two energy resolutions (e.g. IRIS and IN16B). Panel
f highlights the slow-‐dynamics process; panel g is included to show the deviation from quadratic
dependence of the intermediate scattering function for OH/H2O sample at λ=3 and T=230 K at
nanosecond timescales. Full details of the analysis are provided in Supplementary text 2.5.
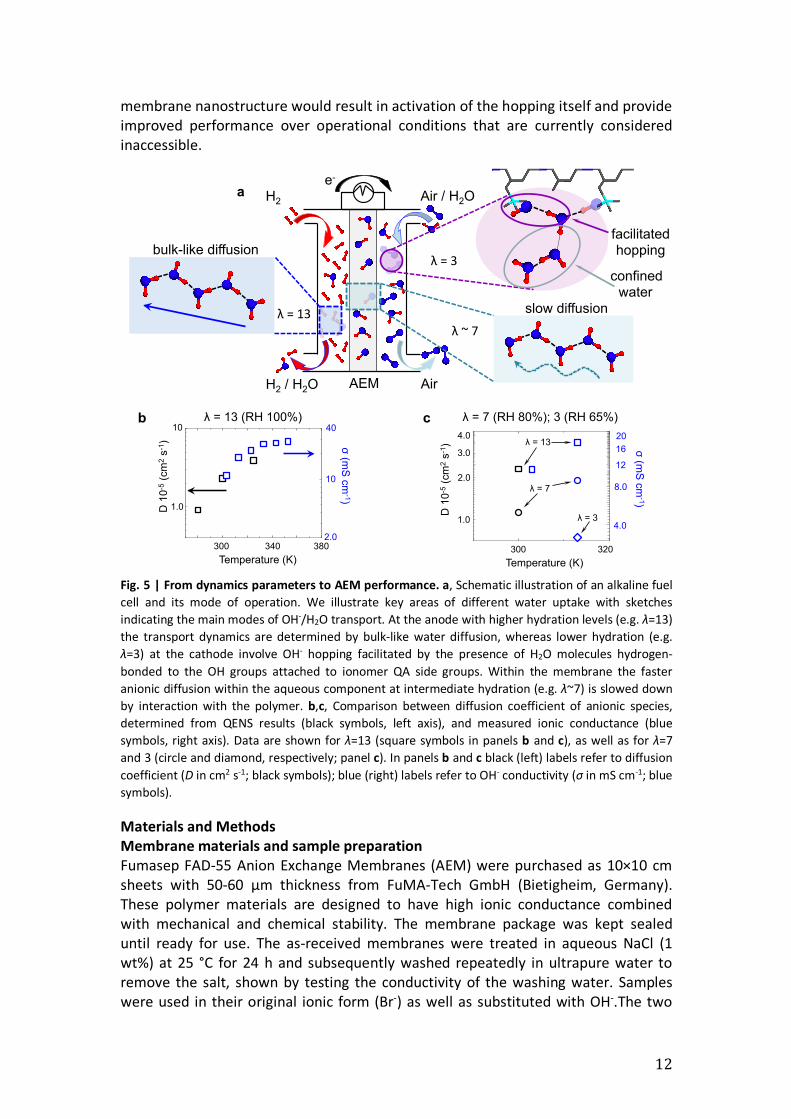
Relationships of nanoscale dynamics to AEM conductivity performance
We measured ionic conductance for the same set of FAD samples at different hydration levels and compared the results with our QENS analysis results to establish important features of the dynamics for AEMFC operation (Fig. 5a).
A critical factor determining anionic mobility is the degree of water uptake that controls the delicate balance between vehicular vs hopping transport mechanisms [16,44]. Computational studies have shown that as a consequence of electro-‐osmotic drag under operating conditions (λ~3-‐18), water is partitioned unevenly within the cell along the trajectory between cathode and anode (Fig. 5a) [45]. Under fully hydrated conditions, our QENS data confirmed that the coupled process is dominated by vehicular transport with a measured Dtr comparable to the total
IN6 - Eres = 70 µeV IRIS - Eres = 17.5 µeV IN16B - Eres = 0.75 µeV
(~0.5 ≤ τ ≤ 20 ps) (~5 ≤ τ ≤ 100 ps) ( ~0.07 ≤ τ ≤ 3 ns) λ = 3 OH/H2O 300 K
0.5
0.0 1 10 100 1000
I (Q
, t)
1.0
a b c d
IN6
IRIS
IN16B
1 10 1 10 100 100 1000
0.6 Å-1
1.7 Å-1
0.6 Å-1
1.7 Å-1
0.6 Å-1
1.7 Å-1
Q = 1.4 Å-1
Time (ps) Time (ps) Time (ps) Time (ps)
1 10 100 1000
1.0
0.5
0.0
I (Q
, t)
Q = 1.4 Å-1
230 K
300 K
e
280 K
325 K
100 1000 1000 0.0
0.1
0.2
0.3
Time (ps) Time (ps)
f
Time (ps)
1000
0.4
0.6
0.80.6 Å
-1
1.0 Å-1
1.3 Å-1
0.8
0.6
0.4
λ = 3 OH/H2O 230 K
g

11
diffusion coefficient for membranes similar to the FAD sample studied here [14-‐17]. They further indicate the presence of a long-‐range component comparable to the value computed for OH-‐ diffusion [14-‐15], suggesting that the Grotthuss mechanism contributes ~15% to the total process.
The activation energy EA=24.5±4.5 kJ mol-‐1 for coupled OH-‐/H2O diffusion determined by QENS analysis is comparable with that shown by conductance measurements (18.4±0.1 kJ mol-‐1; Fig. 5b). The suggestion that vehicular transport provides the main contribution to the anion conductivity at high hydration levels is confirmed by the similar values observed for Cl-‐ and OH-‐ systems (Fig. S1) [29,31]. As the hydration level is lowered to λ=7, representing a typical overall water content within the AEM polymer matrix under normal operating conditions [45], the self-‐diffusion coefficient becomes ~50% slower than at λ=13 (Fig. 5c). A similar change in performance is found when comparing with operation at higher temperatures (Fig. 5c). At λ=3 and below, OH-‐ hopping becomes the primary component of the coupled transport mechanism, with a limited contribution from vehicular transport becoming activated above 280 K, as demonstrated by the IRIS QENS datasets and I(Q,t) observed at fast timescales (Figs. 4e-‐f) as well as by the remarkable reduction in conductivity by around one order of magnitude (Fig. 5c). Our quantitative results indicate that although OH-‐ transport is enabled via Grotthuss ion hopping within a dynamic complex involving three H2O molecules, at least six water molecules must also be involved in activation of the complementary mass transport to permit efficient functioning of the fuel cell.
During our study we found no clear evidence for polymer degradation over the temperature range in which current generations of AEMFCs are operated. Small-‐angle X-‐ray scattering (SAXS; Fig. S18) results for Br/D2O and OD/D2O samples indicate an uneven distribution of QA species distributed along the FAD backbone, resulting in “pockets” of higher local hydration that could shield the functional groups from degradation [31]. This is supported by the similar conductance values at low-‐hydration observed for OH-‐ and Cl-‐ samples (Fig. S1), suggesting that AEMFCs could function under even harsher conditions than are typically used, although with reduced efficiency due to the lack of a well-‐defined diffusive component.
Conclusions
Our results provide new experimental constraints and fundamental insights into anion transport dynamics and membrane performance during AEM fuel cell operation. They support previous simulations indicating that OH-‐ transport occurs via a combination of vehicular dynamics along with Grotthuss H+-‐exchange with the two mechanisms balanced according to the hydration level [11-‐17]. The reduced efficiency of anion transport at low-‐hydration is due to the lack of coupling with H2O diffusional dynamics enabled at higher hydration levels, rather than degradation of the polymer ionomer functionality. The fact that the dynamics are associated with two slow protons indicating the need for one H2O molecule to mediate the OH-‐ transport provides an explanation for why the slower vehicular mechanism dominates at low-‐hydration. At medium-‐hydration the conductivity is determined by slowdown in water mobility due to interactions with the polymer matrix, whereas at high-‐hydration the diffusivity is determined by bulk water dynamics. These data and analyses will thus provide a guide to design new devices where tuning the
12
membrane nanostructure would result in activation of the hopping itself and provide improved performance over operational conditions that are currently considered inaccessible.
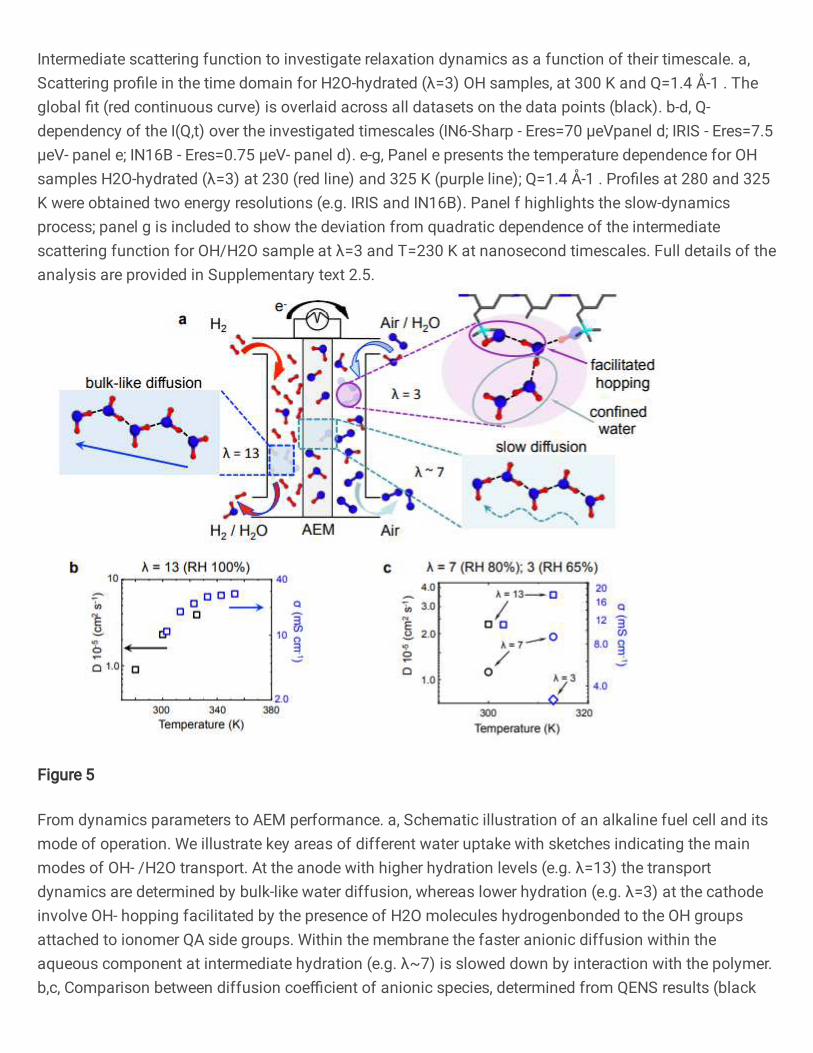
Fig. 5 | From dynamics parameters to AEM performance. a, Schematic illustration of an alkaline fuel
cell and its mode of operation. We illustrate key areas of different water uptake with sketches
indicating the main modes of OH-‐/H2O transport. At the anode with higher hydration levels (e.g. λ=13)
the transport dynamics are determined by bulk-‐like water diffusion, whereas lower hydration (e.g.
λ=3) at the cathode involve OH-‐ hopping facilitated by the presence of H2O molecules hydrogen-‐
bonded to the OH groups attached to ionomer QA side groups. Within the membrane the faster
anionic diffusion within the aqueous component at intermediate hydration (e.g. λ~7) is slowed down
by interaction with the polymer. b,c, Comparison between diffusion coefficient of anionic species,
determined from QENS results (black symbols, left axis), and measured ionic conductance (blue
symbols, right axis). Data are shown for λ=13 (square symbols in panels b and c), as well as for λ=7
and 3 (circle and diamond, respectively; panel c). In panels b and c black (left) labels refer to diffusion
coefficient (D in cm2 s-‐1; black symbols); blue (right) labels refer to OH-‐ conductivity (σ in mS cm-‐1; blue
symbols).
Materials and Methods
Membrane materials and sample preparation
Fumasep FAD-‐55 Anion Exchange Membranes (AEM) were purchased as 10×10 cm sheets with 50-‐60 μm thickness from FuMA-‐Tech GmbH (Bietigheim, Germany). These polymer materials are designed to have high ionic conductance combined with mechanical and chemical stability. The membrane package was kept sealed until ready for use. The as-‐received membranes were treated in aqueous NaCl (1 wt%) at 25 °C for 24 h and subsequently washed repeatedly in ultrapure water to remove the salt, shown by testing the conductivity of the washing water. Samples were used in their original ionic form (Br-‐) as well as substituted with OH-‐.The two
1
10
280 300 320 340 360 380
e-
Air / H2O H2
H2 / H2O Air AEM
λ=3
λ~7
λ=13
Temperature (K)
300 340 380
10
1.0
2.0
10
σ (m
S c
m-1)
D 1
0-5
(cm
2 s
-1)
40
facilitated hopping
slow diffusion
bulk-like diffusion
a
b c
confined water
1
1.5
2
2.5
3
3.5
4
300 320
λ = 13 (RH 100%) λ = 7 (RH 80%); 3 (RH 65%)
λ = 7
Temperature (K)
300 320
1.0 4.0
8.0
σ (m
S c
m-1)
D 1
0-5
(cm
2 s
-1)
12
λ = 3
λ = 13
2.0
3.0
4.0
16
20
13
ionic forms (OH-‐ and/or Br-‐) were produced by immersing in 1 M NaOH or NaBr (aq) at room temperature for 1h followed by washing in pure water to remove excess NaOH (or NaBr).
Experiments were carried out on three H/D isotopically substituted compositions at water contents ranging between high (λ=13) and low (λ=3) hydration levels expressed as the number of water molecules per functional group. The highest λ was obtained by first immersing the membrane in liquid water followed by gentle pad-‐drying to remove excess liquid; lower hydration was obtained by removing the appropriate amount of water using a vacuum oven (T=40 °C) and heating for specified times followed by weighing. Fully dried (λ=0) membranes were obtained by heating overnight in a vacuum oven at T=40 °C.
Quasi-‐elastic neutron scattering (QENS) experiments
To characterise the dynamics occurring at different timescales within the samples, four QENS spectrometers at three instrument facilities were used: i) IN6-‐Sharp (ILL, France), to investigate relaxation dynamics on a ps time scale; ii) IRIS (ISIS, UK) [46], to study dynamics on the tens to hundred ps-‐time scale; and iii-‐iv) IN16B (ILL, France) [47] as well as the High Flux Backscattering Spectrometer (HFBS; NIST, USA) [48]; to investigate ns timescale dynamics.
TOF experiments were performed at 300 K using an incident wavelength of λ=5.12 Å (covering a Q-‐range between 0.3-‐2.1 Å−1) and an instrument energy resolution of 70 μeV (Eres; obtained by measuring the dry sample at 2 K); this configuration allows probing motions in the ps time scale of 0.5<τ<20 ps. Complementary experiments were performed from 230-‐325 K on IRIS, using the PG002 analyser crystal set-‐up (0.56≤Q≤1.84 Å−1) and Eres of 17.5 μeV, probing motions in the in the range 5<τ<100 ps. IN16B experiments were performed using the standard unpolished strained Si(111) monochromator and analyser corresponding to an incident wavelength of λ=6.271 Å (covering a Q-‐range between 0.56 and 1.79 Å−1), an instrument energy resolution of 0.75 μeV, and a dynamic range of ±30 μeV; HFBS experiments were performed over a Q range of 0.25 to 1.75 Å−1, with Eres=1.0 μeV and a dynamic range of ±15 μeV. These two spectrometers probe motions in the ns time scale (0.07<τ<3 ns). Any dynamical process with longer characteristic timescale will appear as ‘elastic’ scattering (i.e., contained within the Eres profile) in the QENS profile, while faster processes that accessible by the instrument contribute to a background in the QENS dataset. Employing four spectrometers that access different timescales was necessary to carry out a full dynamical characterization of the sample dynamics.
Elastic fixed window scans (EFWS) were recorded while heating (0.13 K min-‐1; from 2 to 300/325 K; IN6-‐Sharp and IN16B, respectively) or cooling (IRIS) the sample. Inelastic fixed window scans (IFWSs) were recorded either by adjusting the Doppler speed on IN16B [47] to achieve ∆E=3 and 6 μeV energy offsets, or integrating an arbitrarily chosen energy range (having integration width equivalent to Eres; IRIS and IN6-‐Sharp).
AEM samples were wrapped in Al foil and then loaded into indium sealed either in Au-‐coated flat cell (4×5 cm) or Al annular cells. In both cases the cells had an inner thickness of ~0.5 mm to achieve a neutron transmission of ~90%, thus minimising multiple scattering. Vanadium reference and empty can measurements were carried
14
out for data normalization (e.g. detector efficiency corrections and/or data normalisation to absolute units).
Ionic conductivity measurements (OH− and Cl-‐ anions, partially to fully hydrated)
The ionic conductivity for FAD-‐55 membrane was tested for both ionic forms (OH-‐ and Cl-‐) under fully (λ=13) and partially (9≤λ≤3) hydrated conditions in the temperature range from 303 to 353 K, using a BekkTech four-‐point probe conductivity cell.
Small Angle Neutron Scattering (SANS) SANS measurements were performed on the SANS2d beamline at the ISIS Pulsed Neutron & Muon Source (STFC Rutherford Appleton Laboratory, UK), using neutrons with wavelengths of 1.65≤λ≤14 Å. Scattering profiles were simultaneously recorded on 2 two-‐dimensional detector positioned at 4 and 8 m from the sample; providing a wide scattering vector (Q=(4π/λ)sinθ) range 0.0025≤Q≤0.8 Å−1. FAD membranes were investigated after overnight treatment either in vacuum oven at 40 °C (e.g. dried samples) or ii) immersed in liquid H2O and removing the excess of surface water pad drying the membrane surface (e.g. hydrated samples). All measurements were performed into sealed 1 mm thick fused quartz Hellma cells at a temperature of 25 °C and room humidity.
Small and Wide Angle X-‐ray scattering (SAXS and WAXS)
Profiles were acquired on a SAXS/WAXS Nano-‐inXider instrument (Xenocs, Sassenage, France) using a micro-‐focus sealed-‐tube Cu 30 W/30 μm X-‐ray source (Cu K-‐α, λ=1.54 Å). The SAXS and WAXS scattering patterns (covering the respective Q-‐ranges of 0.0045-‐0.37 Å-‐1 and 0.3-‐4.1 Å-‐1) were detected simultaneously using two Dectris Pilatus 3 hybrid pixel detectors. Scattering was collected on the same samples measured with SANS and loaded in sealed capsules with kapton windows, at room temperature and humidity. The WAXS profiles were de-‐convoluted using Origin2019b.
Fourier Transform Infrared measurements (FTIR)
IR spectra were recorded on a Bruker Alpha FTIR instrument between 400-‐4000 cm-‐1 for 16 averaged scans at 0.25 cm-‐1 resolution with autosubtracted background.
Atomic force microscopy imaging (AFM)
AFM images were recorded using Bruker Dimension Icon with SNL-‐10A and Scanasyst fluid+ probe. Sample imaging in water was carried out in PeakForce tapping mode. Acknowledgments: We thank the neutron scattering facilities at ILL (Grenoble, France), ISIS (UK), and NIST (USA) for the award of beamtime necessary to carry out these experiments. We are grateful to ISIS (Didcot, UK) and ILL (Grenoble, France) for neutron beamtime (DOI: 10.5286/ISIS.E.RB1920608, 10.5286/ISIS.E.RB2090038-‐1 and 10.5291/ILL-‐DATA.9-‐11-‐1916). We also thank Science and Technology Facilities Council (STFC) for the use of Nano-‐inXider instrument in the Materials Characterisation Laboratory. Access to the HFBS was provided by the Center for High-‐Resolution Neutron Scattering, a partnership between the NIST and the NSF under agreement no. DMR-‐1508249. Certain commercial equipment, instruments, or materials are identified in this paper in order to specify the experimental procedure
15
adequately. Such identification is not intended to imply recommendation or endorsement by the NIST. Funding: This project has received funding from the EU Graphene Flagship under Horizon 2020 Research and Innovation program grant agreement no. 881603-‐GrapheneCore3 and from the EPSRC Materials Research Hub for Energy Conversion, Capture, and Storage (M-‐RHEX) EP/R023581/1. A.J.C. thanks SCI and the Ramsay Memorial Trust for support. Author contributions: The study was initiated as a collaboration between CEA and UCL at a meeting between PRS, FF, PFM, SL, GG, QB and JMZ, following discussions with DJLB and TSM. Neutron scattering experiments were initiated and directed by FF in collaborations with VGS, JMZ and MT at neutron beamline facilities. AJC and KS participated in neutron scattering experiments, KS carried out ionic conductivity experiments, AJC provided FTIR data and NM obtained essential SAXS/WAXS and SANS data. FF and PFM worked closely with SL and QL to interpret the neutron scattering results. All authors read, edited, commented on, and fully contributed to the manuscript. Competing interests: The authors declare that they have no competing interests. Data and materials availability: All data needed to evaluate the conclusions in the paper are present in the paper and/or the Supplementary Materials. Additional data related to this paper may be requested from the authors.
References
1. Zhang, H. & Shen, P. K. Recent development of polymer electrolyte membranes for fuel cells. Chem. Rev. 112, 2780-‐2832(2012).
2. Xu, T., Wu, D. & Wu, L. Poly(2,6-‐dimethyl-‐1,4-‐phenylene oxide) (PPO) -‐ A versatile starting polymer for proton conductive membranes (PCMs). Prog. Polym. Sci. 33, 894-‐915 (2008).
3. Barnes, A. M, Liu, B. & Buratto, S. K. Humidity-‐dependent surface structure and hydroxide conductance of a model quaternary ammonium anion exchange membrane. Langmuir
35, 14188-‐14193 (2019). 4. Ran, J. et al. Anion exchange membranes (AEMs) based on poly(2,6-‐dimethyl-‐1,4-‐
phenylene oxide) (PPO) and its derivatives. Polym. Chem. 6, 5809-‐5826 (2015). 5. Pusara, S., Srebnik, S. & Dekel, D. R. Molecular simulation of quaternary ammonium
solutions at low hydration levels. J. Phys. Chem. C 122, 11204-‐11213 (2018). 6. Shao, Y., Yin, G. & Gao, Y. Understanding and approaches for the durability issues of Pt-‐
based catalysts for PEM fuel cell. J. Power Sources 171, 558-‐566(2007). 7. Varcoe, J. R. & Slade, R. C. T. Prospects for alkaline anion-‐exchange membranes in low
temperature fuel cells. Fuel Cells 5, 187-‐200 (2005). 8. Ramírez, S. C. & Paz, R. R. New Trends in Ion Exchange Studies Ch. 4 (IntechOpen, London,
2018). 9. Li, X., Yu, Y., Liu, Q. & Meng, Y. Synthesis and characterization of anion exchange
membranes based on poly(arylene ether sulfone)s containing various cations functioned tetraphenyl methane moieties. Int. J. Hydrogen Energy 38, 11067-‐11073 (2013).
10. Kang, M.-‐S., Choi, Y.-‐J. & Moon, S.-‐H. Characterization of anion-‐exchange membranes containing pyridinium groups. AIChE J. 49, 3213-‐3220 (2003).
16
11. Zheng, Y. et al. Water uptake study of anion exchange membranes. Macromolecules 51, 3264-‐3278 (2018).
12. Marx, D., Chandra, A. & Tuckerman, M. E. Aqueous basic solutions: hydroxide solvation, structural diffusion, and comparison to the hydrated proton. Chem. Rev. 110, 2174-‐2216 (2010).
13. Tu ckerman, M. E., Marx, D. & Parrinello, M. The nature and transport Mechanism of hydrated hydroxide ions in aqueous solution. Nature 417, 925-‐929 (2002).
14. Dubey, V., Maiti, A. & Daschakraborty, S. Predicting the solvation structure and vehicular diffusion of hydroxide ion in an anion exchange membrane using nonreactive molecular dynamics simulation. Chem. Phys. Lett. 755, 137802 (2020).
15. Chen, C., Tse, Y.-‐L. S, Lindberg, G. E., Knight, C. & Voth, G. A. Hydroxide solvation and transport in anion exchange membranes. J. Am. Chem. Soc. 138, 991-‐1000 (2016).
16. Dong, D., Zhang, W., van Duin, A. C. T. & Bedrov, D. Grotthuss versus vehicular transport of hydroxide in anion-‐exchange membranes: insight from combined reactive and nonreactive molecular simulations. J. Phys. Chem. Lett. 9, 825-‐829 (2018).
17. Zhang, W., Dong, D., Bedrov, D. & van Duin, A. C. T. Hydroxide transport and chemical degradation in anion exchange membranes: a combined reactive and non-‐reactive molecular simulation study. J. Mater. Chem. A 7, 5442-‐5452 (2019).
18. Diesendruck, C. E. & Dekel, D. R. Water – A key parameter in the stability of anion exchange membrane fuel cells. Curr. Opin. in Electrochem. 9, 173-‐178 (2018).
19. Dekel, D. R., Amar, M., Willdorf, S., Kosa, M., Dhara, S. & Diesendruck, C. E. Effect of water on the stability of quaternary ammonium groups for anion exchange membrane fuel cell applications. Chem. Mater. 29, 4425-‐4431 (2017).
20. Volino, F., Pineri, M., Dianoux, A. J. & Geyer, A. D. Water mobility in a water-‐soaked nafion® membrane: a high-‐resolution neutron quasielastic study. J. Polym. Sci. Polym.
Phys. 20, 481-‐496 (1982). 21. Paciaroni, A. et al. Temperature-‐dependent dynamics of water confined in nafion
membranes. J. Phys. Chem. B 110, 13769-‐13776 (2006). 22. Lyonnard, S. et al. Perfluorinated surfactants as model charged systems for
understanding the effect of confinement on proton transport and water mobility in fuel cell membranes. A study by QENS. Eur. Phys. J. Spec. Top. 189, 205-‐216 (2010).
23. Perrin, J.-‐C., Lyonnard, S. & Volino, F. Quasielastic neutron scattering study of water dynamics in hydrated nafion membranes. J. Phys. Chem. C 111, 3393-‐3404 (2007).
24. Berrod, Q., Hanot, S., Guillermo, A., Mossa, S. & Lyonnard, S. Water sub-‐diffusion in membranes for fuel cells. Sci. Rep. 7, 8326 (2017).
25. Hanot, S., Lyonnard, S. & Mossa, S. Sub-‐diffusion and population dynamics of water confined in soft environments. Nanoscale 8, 3314-‐3325 (2016).
26. Melchior, J.-‐P., Lohstroh, W., Zamponni, M. & Jalarvo, N.H. Multiscale water dynamics in model anion exchange membranes for alkaline membrane fuel cells. J. Membr. Sci. 586, 240-‐247 (2019).
27. Melchior, J.-‐P. & Jalarvo, N.H. A quasielastic neutron scattering study of water diffusion in model anion exchange membranes over localized and extended volume increments. J. Phys. Chem. C 123, 14195-‐14206 (2019).
28. FuelCellStore. Membranes. https://www.fuelcellstore.com/fuel-‐cell-‐components/membranes (2020).
29. FuelCellStore. Fumasep FAD-‐55. https://www.fuelcellstore.com/fumasep-‐fad-‐55 (2020). 30. Dlugolecki, P., Nymeijer, K., Metz, S. & Wessling, M. Current status of ion exchange
membranes for power generation from salinity gradients. J. Membr. Sci. 319, 214-‐222 (2008).
17
31. McGrath, M. J. et al. 110th Anniversary: The dehydration and loss of ionic conductivity in anion exchange membranes due to FeCl4− ion exchange and the role of membrane microstructure. Ind. Eng. Chem. Res. 58, 22250-‐22259 (2019).
32. Palaty, Z. & Benndová, H. Permeability of a Fumasep-‐FAD membrane for selected inorganic acids. Chem. Eng. Technol. 41, 385-‐391 (2018).
33. Varcoe, J. R. et al. Anion-‐exchange membranes in electrochemical energy systems. Energy Environ. Sci. 7, 3135 (2014).
34. Chempath, S. et al. Mechanism of tetraalkylammonium headgroup degradation in alkaline fuel cell membranes. J. Phys. Chem. C 112, 3179-‐3182 (2008).
35. Prager, M., Pawlukojc, A., Wischnewski, A. & Wuttke, J. Inelastic neutron scattering study of methyl groups rotation in some methylxanthines. J. Chem. Phys. 127, 214509 (2007).
36. De Petris, S., Frosini, V., Butta, V. & Boccaredda, M. Mechanical relaxation in in poly(2.6-‐dimethyl-‐l.4-‐phenylene oxide) in glassy state. Die Makromolekulare Chemie 109, 54-‐61 (1967).
37. Ma, Z. & Tuckerman, M. E. On the connection between proton transport, structural diffusion, and reorientation of the hydrated hydroxide ion as a function of temperature. Chem. Phys. Lett. 511, 177-‐182 (2011).
38. Zadok, I. et al. Unexpected hydroxide ion structure and properties at low hydration. J. Mol. Liq. 313, 113485 (2020).
39. Torell, L. M. & Angell, C. A. Ion-‐matrix coupling in polymer electrolytes from relaxation time studies. Br. Polym. J. 20, 173-‐179 (1988).
40. Angell. C. A. Relaxation in liquids, polymers and plastic crystals -‐ strong/fragile patterns and problems. J. Non-‐Cryst. Solids 131-‐133, 13-‐31 (1991).
41. Gotze, W. & Sjogren, L. Relaxation processes in supercooled liquids. Rep. Prog. Phys. 55, 241-‐376 (1992).
42. Bhattacharyya, S. & Bagchi, B. Anisotropic local stress and particle hopping in a deeply supercooled liquid. Phys. Rev. Lett. 89, 025504 (2002).
43. Bhattacharyya, S. M., Bagchi, B. & Wolynes, P. G. Facilitation, complexity growth, mode coupling, and activated dynamics in supercooled liquids. Proc. Natl. Acad. Sci. USA 105, 16077-‐16082 (2008).
44. Dong, D., Wei, X., Hooper, J. B., Pan, H. & Bedrov, D. Role of cationic groups on structural and dynamical correlations in hydrated quaternary ammonium-‐functionalized poly(p-‐phenylene oxide)-‐based anion exchange membranes. Phys. Chem. Chem. Phys. 20, 19350-‐19362 (2018).
45. Dekel, D. R., Rasin, I. G., Page, M. & Brandon, S. Steady state and transient simulation of anion exchange membrane fuel cells. J Power Sources 375, 191-‐204 (2018).
46. Carlile C. J. & Adams M. A. The design of the IRIS inelastic neutron spectrometer and improvements to its analysers. Physica B 182, 431-‐440 (1992).
47. Frick, B., Combet, J. & van Eijck, L. New possibilities with inelastic fixed window scans and linear motor doppler drives on high resolution neutron backscattering spectrometers. Nucl. Instrum. Methods Phys. Res Section A: Accelerators, Spectrometers,
Detectors and Associated Equipment 669, 7-‐13 (2012). 48. Meyer, A., Dimeo, R. M., Gehring, P. M. & Neumann, D. A. The high-‐flux backscattering
spectrometer at the NIST Center for Neutron Research. Rev. Sci. Instrum. 74, 2759-‐2777 (2003).
Figures
Figure 1
Schematic illustration of alkaline fuel cell operation and anion exchange membrane (AEM) in relation tomeasurement protocol. a, Schematic illustration of an alkaline fuel cell and its mode of operation. b-d,Sketches illustrating the polymeric membrane, OH- hopping, and water translational dynamics andinteractions between them. The cartoon at right shows rapidly relaxing -CH3 species attached to thepolymer backbone [2,4] and functional groups [3-5,28]. e-g, Timescales probed in neutron scatteringexperiments at instruments with different energy resolution characteristics. h-j, Different water uptake (λ)levels and (k-l) chemically/isotopically substituted AEM/hydration medium combinations investigated tohighlight different aspects of the dynamics.
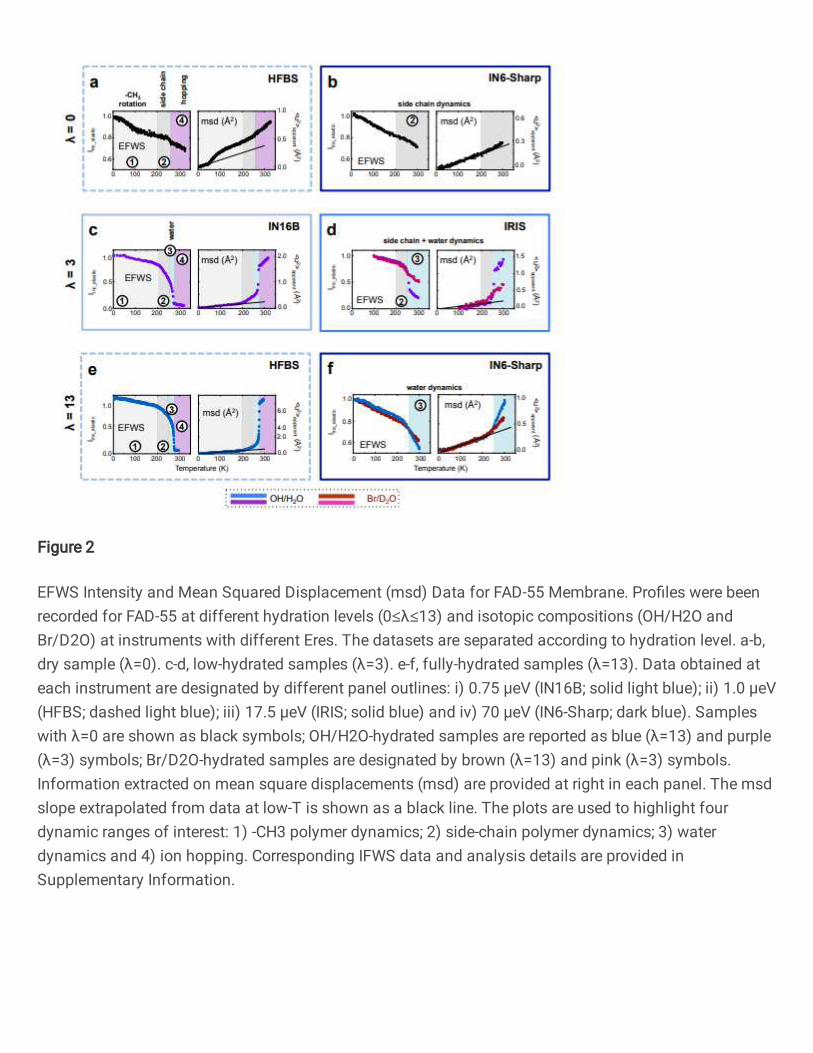
Figure 2
EFWS Intensity and Mean Squared Displacement (msd) Data for FAD-55 Membrane. Pro�les were beenrecorded for FAD-55 at different hydration levels (0≤λ≤13) and isotopic compositions (OH/H2O andBr/D2O) at instruments with different Eres. The datasets are separated according to hydration level. a-b,dry sample (λ=0). c-d, low-hydrated samples (λ=3). e-f, fully-hydrated samples (λ=13). Data obtained ateach instrument are designated by different panel outlines: i) 0.75 μeV (IN16B; solid light blue); ii) 1.0 μeV(HFBS; dashed light blue); iii) 17.5 μeV (IRIS; solid blue) and iv) 70 μeV (IN6-Sharp; dark blue). Sampleswith λ=0 are shown as black symbols; OH/H2O-hydrated samples are reported as blue (λ=13) and purple(λ=3) symbols; Br/D2O-hydrated samples are designated by brown (λ=13) and pink (λ=3) symbols.Information extracted on mean square displacements (msd) are provided at right in each panel. The msdslope extrapolated from data at low-T is shown as a black line. The plots are used to highlight fourdynamic ranges of interest: 1) -CH3 polymer dynamics; 2) side-chain polymer dynamics; 3) waterdynamics and 4) ion hopping. Corresponding IFWS data and analysis details are provided inSupplementary Information.
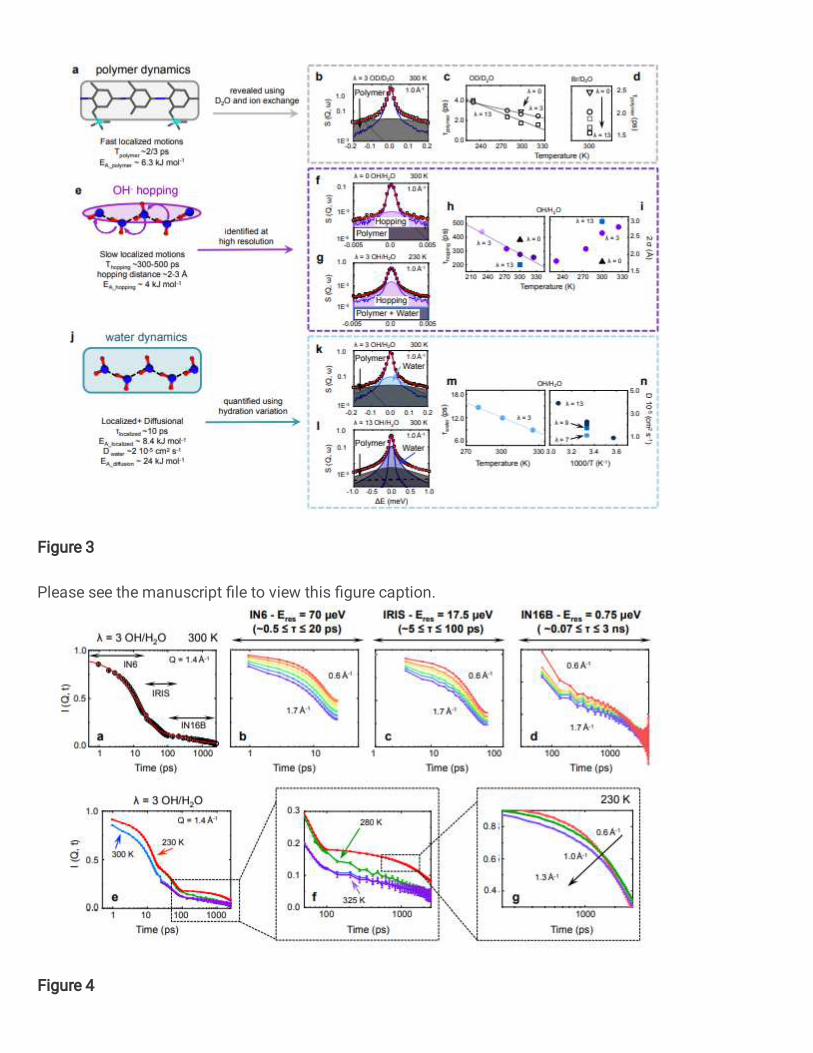
Figure 3
Please see the manuscript �le to view this �gure caption.
Figure 4
Intermediate scattering function to investigate relaxation dynamics as a function of their timescale. a,Scattering pro�le in the time domain for H2O-hydrated (λ=3) OH samples, at 300 K and Q=1.4 Å-1 . Theglobal �t (red continuous curve) is overlaid across all datasets on the data points (black). b-d, Q-dependency of the I(Q,t) over the investigated timescales (IN6-Sharp - Eres=70 μeVpanel d; IRIS - Eres=7.5μeV- panel e; IN16B - Eres=0.75 μeV- panel d). e-g, Panel e presents the temperature dependence for OHsamples H2O-hydrated (λ=3) at 230 (red line) and 325 K (purple line); Q=1.4 Å-1 . Pro�les at 280 and 325K were obtained two energy resolutions (e.g. IRIS and IN16B). Panel f highlights the slow-dynamicsprocess; panel g is included to show the deviation from quadratic dependence of the intermediatescattering function for OH/H2O sample at λ=3 and T=230 K at nanosecond timescales. Full details of theanalysis are provided in Supplementary text 2.5.
Figure 5
From dynamics parameters to AEM performance. a, Schematic illustration of an alkaline fuel cell and itsmode of operation. We illustrate key areas of different water uptake with sketches indicating the mainmodes of OH- /H2O transport. At the anode with higher hydration levels (e.g. λ=13) the transportdynamics are determined by bulk-like water diffusion, whereas lower hydration (e.g. λ=3) at the cathodeinvolve OH- hopping facilitated by the presence of H2O molecules hydrogenbonded to the OH groupsattached to ionomer QA side groups. Within the membrane the faster anionic diffusion within theaqueous component at intermediate hydration (e.g. λ~7) is slowed down by interaction with the polymer.b,c, Comparison between diffusion coe�cient of anionic species, determined from QENS results (black

symbols, left axis), and measured ionic conductance (blue symbols, right axis). Data are shown for λ=13(square symbols in panels b and c), as well as for λ=7 and 3 (circle and diamond, respectively; panel c). Inpanels b and c black (left) labels refer to diffusion coe�cient (D in cm2 s-1 ; black symbols); blue (right)labels refer to OH- conductivity (σ in mS cm-1 ; blue symbols).
Supplementary Files
This is a list of supplementary �les associated with this preprint. Click to download.
FADdynamicsSI.pdf