disparities in maternal and infant health: are we making ... · pdf fileeliminating health...
TRANSCRIPT

Fall 2004
LESSONS FROM CALIFORNIA
ARE WE MAKING PROGRESS?
LESSONS FROM CALIFORNIA
IN MATERNAL & INFANT HEALTH:
DISPARITIES
Prepared by:
Susan Egerter, PhD, Kristen Marchi, MPH, Catherine Cubbin, PhD,and Paula Braveman, MD, MPHUniversity of California at San Francisco
with
Alina Salganicoff,Ph.D, Usha R. Ranji, MSThe Henry J. Kaiser Family Foundation
Fall 2004
Disparities In Maternal And Infant Health: Are We Making Progress? Lessons From California

ACKNOWLEDGEMENTS
The research for this report was supported by the Henry J. Kaiser FamilyFoundation and by the Centers for Disease Control and Prevention(Subaward Agreements TS-0842 and TS-521-16/16).
The Access to Maternity Care (ATM) survey was funded by the Agency forHealth Care Policy and Research (R01 HS07910), the CaliforniaDepartment of Health Services Maternal and Child Health Branch (contract#91-13489), and the Robert Wood Johnson Foundation (grant #021899).The Maternal and Infant Health Assessment (MIHA) survey is a collaborativeeffort of the California Department of Health Services Maternal and ChildHealth Branch (contract #02-25096) and the Department of Family andCommunity Medicine at the University of California, San Francisco.
We also would like to thank Nicole Wojtal and Jennie Kamen for theirassistance with searching the literature and in preparing the graphics.

Table of Contents
List of Figures and Tables . . . . . . . . . . . . . . . . . . . . . . . . . . . . . . . . . . . ii
I. Introduction . . . . . . . . . . . . . . . . . . . . . . . . . . . . . . . . . . . . . . . . . . 1
Measuring and Understanding the Gaps . . . . . . . . . . . . . . . . . . . . . . 4
II. Research Findings . . . . . . . . . . . . . . . . . . . . . . . . . . . . . . . . . . . . . 5
Unintended Pregnancy . . . . . . . . . . . . . . . . . . . . . . . . . . . . . . . . . . 5
Prenatal Care . . . . . . . . . . . . . . . . . . . . . . . . . . . . . . . . . . . . . . . . . 9
Breastfeeding . . . . . . . . . . . . . . . . . . . . . . . . . . . . . . . . . . . . . . . . 13
III. Policy Implications . . . . . . . . . . . . . . . . . . . . . . . . . . . . . . . . . . . . 17
Conclusion . . . . . . . . . . . . . . . . . . . . . . . . . . . . . . . . . . . . . . . . . . . . 19
Appendix: . . . . . . . . . . . . . . . . . . . . . . . . . . . . . . . . . . . . . . . . . . . . . 21
Methods . . . . . . . . . . . . . . . . . . . . . . . . . . . . . . . . . . . . . . . . . . . 21
Analyses . . . . . . . . . . . . . . . . . . . . . . . . . . . . . . . . . . . . . . . . . . . 23

PAGE II
LIST OF FIGURES AND TABLES
Figure 1. Selected Healthy People 2010 Objectives in Maternal . . . . . . . . . 1and Infant Health
Figure 2. Overall Improvements in Maternal and Infant Health Among . . . . . 2Childbearing Women in California During 1990s
Figure 3. Rates of Unintended Pregnancy in California by Mother’s . . . . . . . 7Race/Ethnicity, 1994/1995 and 1999/2001
Figure 4. Disparities in Unintended Pregnancy in California . . . . . . . . . . . . . 7by Racial/Ethnic Group, 1994/1995 and 1999/2001
Figure 5. Rates of Delayed/No Prenatal Care in California . . . . . . . . . . . . . 12by Woman’s Income, 1994/1995 and 1999–2001
Figure 6. Disparities in Delayed/Lack of Prenatal Care in California . . . . . . 12by Family Income, 1994/1995 and 1999/2001
Figure 7. Rates of Not Breastfeeding in California by Mother’s . . . . . . . . . . 15Education Level, 1994/1995 and 1999/2001
Figure 8. Disparities in Breastfeeding in California, by Mother’s . . . . . . . . .15Education Level, 1994/1995 and 1999/2001
Table 1. Distribution of Childbearing Women in California, . . . . . . . . . . . . . 31994–1995 and 1999–2001
Table 2. Rates and Disparities in Unintended Pregnancy in California, . . . . 51994–1995 and 1999–2001
Table 3. Rates and Disparities in Delayed or no Prenatal Care in . . . . . . . . . 9California, 1994–1995 and 1999–2001
Table 4. Rates and Disparities Disparities in Breastfeeding in . . . . . . . . . . 13California, 1994–1995 and 1999–2001

Eliminating health disparities between different population groups is a national priorityoutlined in the Healthy People 2000/2010 goals set by the U.S. government.1 The largeand persistent racial/ethnic and socioeconomic disparities in maternal and infant healthhave been of particular concern (Figure 1).
For example, babies born to African American mothers are twice as likely as babies born toWhite mothers to have low birth weights and to die before their first birthdays. Women whohave not finished high school are three times as likely as women who have completedcollege to lack prenatal care during the first three months of pregnancy. There iswidespread recognition that closing these gaps will require more effective strategies, whichin turn require ongoing monitoring and study of disparities in the context of changing socialpolicies and programs.
PAGE 1
I.INTRODUCTION
Adapted from U.S. Department of Health and Human Services, Healthy People 2010, available online at www.healthypeople.gov.
◆ Intended Pregnancies: Increase the proportion of pregnancies that are intended to 70 percent.
◆ Prenatal Care: Increase the proportion of childbearing women who begin prenatal care during the first threemonths (trimester) of pregnancy to 90 percent.
◆ Breastfeeding: Increase the proportion of mothers who breastfeed their babies in the early postpartum periodto 75 percent.
Healthy People 2010 also calls for the elimination of social disparities (between racial/ethnic, income, education,and other social groups) in health, by achieving target rates for each indicator not only overall but in everysocial group.
1 U.S. Department of Health and Human Services, Healthy People 2010, available online atwww.healthypeople.gov.
Figure 1. Selected Healthy People 2010 Objectives in Maternal and Infant Health:
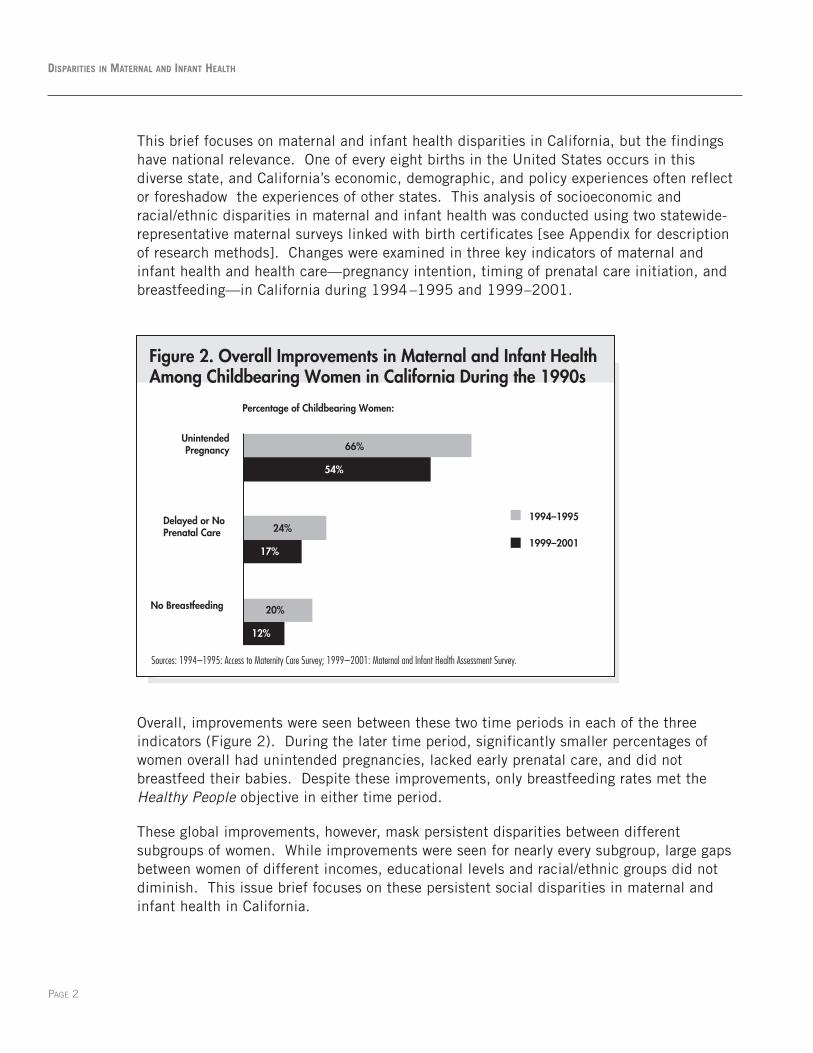
This brief focuses on maternal and infant health disparities in California, but the findingshave national relevance. One of every eight births in the United States occurs in thisdiverse state, and California’s economic, demographic, and policy experiences often reflector foreshadow the experiences of other states. This analysis of socioeconomic andracial/ethnic disparities in maternal and infant health was conducted using two statewide-representative maternal surveys linked with birth certificates [see Appendix for descriptionof research methods]. Changes were examined in three key indicators of maternal andinfant health and health care—pregnancy intention, timing of prenatal care initiation, andbreastfeeding—in California during 1994–1995 and 1999–2001.
Overall, improvements were seen between these two time periods in each of the threeindicators (Figure 2). During the later time period, significantly smaller percentages ofwomen overall had unintended pregnancies, lacked early prenatal care, and did notbreastfeed their babies. Despite these improvements, only breastfeeding rates met theHealthy People objective in either time period.
These global improvements, however, mask persistent disparities between differentsubgroups of women. While improvements were seen for nearly every subgroup, large gapsbetween women of different incomes, educational levels and racial/ethnic groups did notdiminish. This issue brief focuses on these persistent social disparities in maternal andinfant health in California.
PAGE 2
DISPARITIES IN MATERNAL AND INFANT HEALTH
Figure 2. Overall Improvements in Maternal and Infant Health Among Childbearing Women in California During the 1990s
12%
17%
54%
20%
24%
66%
No Breastfeeding
Delayed or NoPrenatal Care
UnintendedPregnancy
1994–1995
1999–2001
Percentage of Childbearing Women:
Sources: 1994–1995: Access to Maternity Care Survey; 1999–2001: Maternal and Infant Health Assessment Survey.

A Time of Economic Growth
Following a statewide economic recession earlier in the decade, the California economy grewrapidly throughout the mid- to late 1990s and unemployment and poverty declined. Thesegeneral economic trends also were seen among California’s childbearing women, withupward shifts in the income and education distributions for this population (Table 1).Compared with 1994–1995, during 1999–2001 relatively fewer women who gave birthwere poor (family incomes below 100% of the poverty threshold, $15,150 and $17,650 fora family of four in 1995 and 2001, respectively) and more had incomes over four times thefederal poverty level ($60,600 and $70,600 for a family of four in 1995 and 2001,respectively). Higher percentages of childbearing women had attended at least somecollege during the later period.
PAGE 3
LESSONS FROM CALIFORNIA
Note: The federal poverty level was $15,150 for a family of four in 1995 and $17,650 in 2001.1 Access to Maternity Care survey, an in-person hospital-based statewide survey.2 Maternal and Infant Health Assessment, a mail-telephone statewide survey.3 Differences in the percentage with 'missing' income are likely due to differences in survey methods.
n=10,132 n=10,519
Poverty Level (FPL)
0–100% 45 32
101–200% 18 20
201–300% 12 10
301–400% 9 7
>400% 13 21
Missing3 3 10
Educational Level
Did not complete high school 30 24
High school graduate/GED 31 24
Some college 24 30
College graduate 15 23
Race/Ethnicity
African-American 7 6
Asian/Pacific Islander 10 10
Latina—Foreign-Born 35 30
Latina—US born 13 16
Native American/American Indian 0 1
White 35 37
Table 1. Distribution of Childbearing Women in California,1994–1995 and 1999–2001
Percentage of Total Population
1994–19951 1999–20012

Local and state funding for services also improved along with the State’s economy duringthe 1990s. Increased provider reimbursement and eligibility expansions implemented inMedi-Cal (California’s Medicaid program) from 1988 through 1990 were sustained, andfurther reforms were implemented in the 1990s to streamline the application process andremove “non-financial” barriers to care among pregnant women with Medi-Cal coverage.The state’s Family PACT program was launched in 1997 to cover the costs of familyplanning services for low-income men and women with incomes up to 200% of the federalpoverty level. Healthy Families, California’s State Children’s Health Insurance Program, alsowas implemented during the late 1990s, and major public health efforts promotingbreastfeeding were launched during the mid- and late-1990s.
Measuring and Understanding the Gaps
Because overall rates can obscure significant disparities between groups, it is thereforeimportant to examine how indicators compare across different social groups defined byincome, education, and race/ethnicity. These groups are defined as follows:
• Income—mother’s self-reported family income, measured as a percentage of the federalpoverty threshold and grouped as: 0–100%, 101–200%, 201–300%, 301–400%, orgreater than 400% of poverty.
• Education—mother’s self-reported highest level of completed schooling, categorized as:did not complete high school, graduated from high school, attended but did not completecollege, or graduated from college.
• Race/ethnicity—mother’s self-reported racial/ethnic group, categorized as: African-American, Asian/Pacific Islander, immigrant Latina, U.S.-born Latina, NativeAmerican/Alaskan Native, or White.
To examine income, education, and racial/ethnic disparities in each indicator during eachtime period, we calculated the relative risk of a poor outcome for each social groupcompared with the most advantaged corresponding group—women with incomes above400% of poverty, college graduates, or Whites.
We also constructed multivariate analytic models to examine the impact of other factors(such as health insurance coverage or having a regular source of health care, for example)on each of these three indicators. Several of these factors could be addressed directly orindirectly through public policies. Findings from these analyses are summarized in the textfor each indicator, but are not displayed in tables.
Data sources and the definitions of the analytic factors are detailed in the Appendix at theend of this paper. Further methodologic details are available on request.
PAGE 4
DISPARITIES IN MATERNAL AND INFANT HEALTH

Unintended Pregnancy
In the United States, half of all pregnancies are unintended. Unintended pregnancy amongadult as well as teen women is associated with social, economic, and medical costs. Socialcosts of unintended births include reduced educational attainment and employmentopportunity, greater welfare dependency, and increased potential for child abuse and neglect.Women with unintended pregnancies are less likely to receive timely prenatal care, and theirinfants are more likely to lack sufficient resources for healthy development.2 We definedunintended pregnancy (Table 2) as the percentage of childbearing women who reported (a) nottrying to get pregnant (1994–95) or (b) not wanting to get pregnant (1999–2001).
PAGE 5
II.RESEARCH FINDINGS
2 U.S. Department of Health and Human Services, Healthy People 2010, Chapter 9, Family Planning. Available online atwww.healthypeople.gov.
Table 2. Rates and Disparities in Unintended Pregnancy in California,1994–1995 and 1999–2001
1994–1995 1999–2001 1994–1995 1999–2001
TOTAL
Poverty Level (FPL)
0–100% 74 63* 1.7** 1.8**101–200% 60 55 1.4** 1.6**201–300% 57 43* 1.3** 1.2**301–400% 44 35* 1.0 1.0
Mother's EducationDid not complete high school 72 58* 1.4** 1.6**High school graduate/GED 64 58 1.2 1.6** ^Some college 62 53* 1.2 1.5**College graduate 52 35* 1.0 1.0
Race/EthnicityAfrican-American 75 70 1.2 1.4**Asian/Pacific Islander 61 52 1.0 1.1Latina—Immigrant 68 49* 1.1 1.0Latina—US born 67 63 1.1 1.3**Native American/American Indian 70 66 1.2 1.3**White 60 49 1.0 1.0
Relative risk of unintended pregnancyPercentage with unintended pregnancy
Note: The federal poverty level was $15,150 for a family of four in 1995 and $17,650 in 2001.* Percent for this group in 1999–2001 was significantly different than that in 1994–1995 (alpha = 0.05). Relative Risk > 1 indicates risk is higher than reference group.** Significantly higher relative risk than reference group (301–400% FPL, College graduate, White), alpha = 0.05.^ Relative risk for this group was significantly different in 1999–2001 than in 1994–1995, alpha = 0.05.Source: UCSF analysis of Access to Maternity Care survey and Maternal and Infant Health Assessment survey.

Disparities between income groups: Mirroring the declines seen among women in Californiaoverall, rates of unintended pregnancy fell between 1994–1995 and 1999–2001 in everyincome group. Despite these improvements, the Healthy People objective of reducing theproportion of pregnancies that are unintended to 30% was not achieved overall or in anyincome group. Furthermore, the size of disparities (as shown by relative risks) betweenincome groups did not change significantly. During both time periods, women with incomesup to 300% of poverty were at significantly greater risk of unintended pregnancy thanwomen in the highest income group (301% to 400% of poverty). Even after taking intoaccount a wide range of other characteristics (such as age, total number of births, maritalstatus, smoking during pregnancy, and drinking alcohol during pregnancy; see Methods forfull list) that have been found to be associated with pregnancy intention, differences byincome continued to be significant.
Disparities by education: Rates of unintended pregnancy had fallen significantly by1999–2001 for all education groups except high-school graduates. Again, however, rates inevery group exceeded 30%, and there was no narrowing in the relative disparities betweenthe different education groups. In fact, the gaps between women without college degreesand those who were college graduates actually appeared wider during 1999–2001. Evenafter taking into account a wide range of other characteristics (such as age, total number ofbirths, marital status, smoking and drinking alcohol during pregnancy; see Methods for fulllist) that have been found to be associated with pregnancy intention, differences bymaternal education continued to be significant.
Racial/ethnic disparities: Although rates of unintended pregnancy ranged from 60.4% forWhites to 75.2% for African Americans in 1994–95, the differences across racial/ethnicgroups were not statistically significant during that time period. Rates of unintendedpregnancy appeared to be lower in all racial/ethnic groups during 1999–2001, but thedecline was statistically significant only for immigrant Latinas (Figure 3). Indeed, incontrast with the earlier picture, disparities between Whites and African Americans, US-born Latinas, and Native American/Alaskan Natives were statistically significant during thelater time period (Figure 4). After controlling for other factors, the differences acrossracial/ethnic groups narrowed, but the disparities remained significant for AfricanAmericans and US-born Latinas relative to White women.
Additional factors deserving particular attention: During 1999–2001, low-income womenwho were uninsured appeared to be at particularly increased risk for having an unintendedpregnancy. Among women with incomes at or below 300% of poverty, those who lackedhealth insurance coverage before pregnancy were more likely to have an unintendedpregnancy even when differences in age, total number of births, income, education, andother characteristics were considered. Although explaining the underlying relationships isbeyond the scope of this work, the link between unintended pregnancy and lackinginsurance may reflect affordability of and access to contraception.
PAGE 6
DISPARITIES IN MATERNAL AND INFANT HEALTH

PAGE 7
LESSONS FROM CALIFORNIA
*Significantly different from 1994–1995 level at p< .05.
Source: UCSF analysis of Access to Maternity Care survey and Maternal and Infant Health Assessment survey.
Figure 3. Rates of Unintended Pregnancy in California by Mother’s Race/Ethnicity, 1994/1995 and 1999/2001
1994–1995 1999–2001
75%68% 67% 70%
60%61%49%
66%
52%
63%
49%*
70%
0%
20%
40%
60%
80%
Percentage of childbearing women with an unintended pregnancy:
WhiteAfricanAmerican
Latina,Foreign Born
Latina,U.S. Born
Asian/PacificIslander
NativeAmerican/
Alaskan Native
Figure 4. Disparities in Unintended Pregnancy in California by Racial/Ethnic Group, 1994/1995 and 1999/2001
1.21.4*
11.1
1.3*
11.11.2 1.3*
1 11.1
0
1
2
1994–1995 1999–2001
African American Latina, Foreign Born Latina, US Born Asian/Pacific Islander Native American/Alaskan Native White
Relative risk of having an unintended pregnancy:
Equal risk of having an unintended pregnancy
Relative risk > 1 indicates unintended pregnancy more likely than among White women.
*indicates difference is statistically significant (p < .05)
Source: UCSF analysis of Access to Maternity Care survey and Maternal and Infant Health Assessment survey.


PAGE 9
LESSONS FROM CALIFORNIA
Prenatal Care
Including early prenatal care as a Healthy People objective reflects widespread agreementthat initiating care in the first three months of pregnancy is important for timely riskassessment and intervention, including health promotion, that could improve a range ofmaternal and infant health outcomes. We studied initiation of prenatal care by examiningdelayed or no prenatal care, defined as the percentage of childbearing women who lackedearly prenatal care because they either began prenatal care after the first trimester orreceived no care at all (Table 3).
Table 3. Rates and Disparities in Delayed or no Prenatal Care in California,1994–1995 and 1999–2001
1994–1995 1999–2001 1994–1995 1999–2001
TOTALPoverty Level (FPL)0–100% FPL 38 28* 9.9** 8.2**101–200% 18 18 4.7** 5.4**201–300% 12 13 3.1** 3.8**301– 400% 8 6 2.1 1.8**>400% 4 3 1.0 1.0
Mother’s EducationDid not complete high school 38 28* 5.8** 4.4**High school graduate 24 22 3.7** 3.4**Some college 15 13 2.2** 2.0**College graduate 7 6 1.0 1.0
Race/EthnicityAfrican-American 22 19 1.4 2.0**Asian/Pacific Islander 26 18 1.7 1.9**Foreign-born Latina 32 25 2.1** 2.7**US-born Latina 24 19 1.6** 2.1**Native American/Alaskan Native 27 18 1.8 1.9White 15 9 1.0 1.0
Relative risk of delayed/no prenatal care
Percentage of women with delayed/no prenatal care
The federal poverty level was $15,150 for a family of four in 1995 and $17,650 in 2001.
* Percent for this group in 1999–2001 was significantly different than that in 1994–1995 (alpha = 0.05).
Relative Risk > 1 indicates risk is higher than reference group.
** Significantly higher relative risk than reference group (income > 400% FPL, College graduate, White), alpha = 0.05.
Source: UCSF analysis of Access to Maternity Care survey and Maternal and Infant Health Assessment survey.

PAGE 10
DISPARITIES IN MATERNAL AND INFANT HEALTH
Disparities between income groups: Although a significantly smaller percentage of poorwomen had delayed or no care in the later time period, the disparities between incomegroups were not significantly reduced (Figures 5,6). Even with overall improvements inrates of early care, only women with incomes above 300% of poverty had rates of earlyprenatal care that met the Healthy People target of 90%, and there remained an 8-folddisparity between women in the lowest and highest income groups. Compared with thehighest income group, rates of delayed or no prenatal care were higher not only for poor andnear-poor women but for women with incomes up to 300% of poverty in 1994–95 and up to400% of poverty in 1999–2001. When income was considered along with other factors(such as age, total number of births, marital status, smoking and alcohol use duringpregnancy; see Methods for full list of factors) that may affect whether a woman receivesearly prenatal care, the disparities by income remained evident.
Disparities by education: Patterns by education were generally similar to those seen byincome. Women with lower levels of education were less likely in both time periods to haveearly prenatal care, and women with the least education (who had not completed highschool) experienced significant improvement between 1994/1995 and 1999/2001. Therelative disparities between women of different education levels did not change, however,and it is noteworthy that there were persistent disparities across all levels of educationalattainment, not just between the least and most educated subgroups. At both times, evenwomen who had attended but not graduated from college had higher rates of delayed or nocare than did college graduates—the only group that met the Healthy People target.
However, additional findings suggest that other factors may play a role in the educationdisparities in prenatal care. Although there appeared to be differences in initiation ofprenatal care between women with different levels of education, these differences werelargely explained by other factors (see Methods for full list of factors).

PAGE 11
LESSONS FROM CALIFORNIA
Racial/ethnic disparities: Rates of delayed or no prenatal care were lowest among Whitewomen and highest among immigrant Latinas during both time periods. Compared withWhites (the only group that met the Healthy People objective), rates of delayed or noprenatal care also were significantly higher for US-born Latinas in both time periods and forAfrican American and Asian/Pacific Islander women in 1999–2001. There were nosignificant declines between the two time periods, either in the rates of delayed or no carefor any racial/ethnic group or in the size of the disparities between the differentracial/ethnic groups.
As with the differences by education, however, differences between most racial and ethnicgroups in the likelihood of receiving early prenatal care were no longer apparent after otherfactors, including income and education, were considered. These findings suggest thatracial/ethnic gaps could be reduced by focusing on these socioeconomic factors.
Additional factors that deserve particular attention: Our research suggests factors that maycontribute to the income disparities in prenatal care initiation: (i) whether a woman hadhealth insurance coverage (including Medi-Cal or private coverage) during the first 3 monthsof her pregnancy and (ii) whether the pregnancy was intended. For example, in the lower-income subgroups of women at higher risk of delayed or no prenatal care, lack of first-trimester insurance coverage was associated with a 4- to 5-fold increased risk, taking otherfactors into consideration.

PAGE 12
DISPARITIES IN MATERNAL AND INFANT HEALTH
Figure 6. Disparities in Delayed/Lack of Prenatal Care in California by Family Income, 1994/1995 and 1999/2001
Relative risk of delaying or going without prenatal care:
9.9*
8.2*
1 1
5.4*4.7*
3.8*3.1*
1.8*2.1
0
2
4
6
8
10
1994–1995 1999–2001
0–100% 101–200% 201–300% 301–400% > 400%
Equal risk of delaying or going without prenatal care
Relative risk > 1 indicates delayed/lack of prenatal care more likely than among women with incomes > 400% of poverty.
*indicates difference is statistically significant (p < .05).
Note: The federal poverty level for a family of four was $15,150 in 1995 and $17,650 in 2001.
Source: UCSF analysis of Access to Maternity Care survey and Maternal and Infant Health Assessment survey.
Note: The federal poverty level was $15,150 for a family of four in 1995 and $17,650 in 2001.
*Significantly different from 1994–1995 level at p<.05.
Source: UCSF analysis of Access to Maternity Care survey and Maternal and Infant Health Assessment survey.
Figure 5. Rates of Delayed/No Prenatal Care in California by Woman’s Income, 1994/1995 and 1999/2001
>400%101–200%0–100% 201–300% 301–400%
38%
28%*
0%
20%
40%
1994–1995 1999–2001
Percentage of women with delayed or no prenatal care:
18% 18%
12% 13%
8% 6%4% 3%

PAGE 13
LESSONS FROM CALIFORNIA
Breastfeeding
The benefits of breastfeeding for infant and maternal health are widely recognized, and theAmerican Association of Pediatrics considers breastfeeding in general to be “the ideal methodof feeding and nurturing infants.” In these analyses (Table 4), the indicator was nobreastfeeding, defined as the percentage of childbearing women who (a) did not plan tobreastfeed when interviewed during their delivery stays (1994–95) or (b) had never breastfedwhen interviewed two to seven months after giving birth (1999–2001).
Table 4. Rates and Disparities in Breastfeeding in California, 1994–1995 and1999–2001.
1994–1995 1999–2001 1994–1995 1999–2001
TOTAL
Poverty Level (FPL)0–100% FPL 23 18 2.3** 3.2**101–200% 17 12* 1.7 2.1**201–300% 27 13* 2.7 2.3**301–400% 22 9* 2.2** 1.6**>400% 10 6 1.0 1.0
Mother’s EducationDid not complete high school 23 17 2.8** 3.8**High school graduate 22 17 2.6** 3.9**Some college 20 11* 2.4** 2.5**College graduate 9 4* 1.0 1.0
Race/EthnicityAfrican-American 34 23* 1.5 2.4**Asian/Pacific Islander 20 11* 0.9 1.1Foreign-born Latina 14 9* 0.6** 0.9US-born Latina 25 20* 1.1 2.0**Native American/Alaskan Native 20 12 0.9 1.2White 22 10* 1.0 1.0
Relative risk of not breastfeedingPercentage who did not breastfeed
The federal poverty level was $15,150 for a family of four in 1995 and $17,650 in 2001.*Percent for this group in 1999–2001 was significantly different than that in 1994–1995, alpha = 0.05.Relative Risk > 1 indicates risk is higher than reference group. **Significantly higher relative risk than reference group (income > 400% FPL, College graduate, White), alpha = 0.05.Source: UCSF analysis of Access to Maternity Care survey and Maternal and Infant Health Assessment survey.

Disparities between income groups: Breastfeeding rates in 1994–1995 were close to theHealthy People target of 75% and appeared to increase among women in every incomegroup by 1999–2001 (table 4). However, the relative disparities between women indifferent income groups did not narrow over time. In both time periods, women in thehighest income group appeared most likely to breastfeed their babies; in 1999–2001, thesewomen were significantly more likely to breastfeed than were women in all groups with lowerincomes. However, when considered along with education, race/ethnicity, and other factors(such as age, total number of births, marital status, health behaviors and birth outcomes;see Methods for full list) that may affect whether a woman breastfeeds, the incomedisparities in breastfeeding appeared to be largely explained by differences in education.
Disparities by education: Significant improvements in breastfeeding rates between 1994–95and 1999–2001 occurred among women with at least some college education, but therelative disparities in breastfeeding by education were not reduced (Figures 7,8). In bothtime periods, college graduates were more likely than women with less education tobreastfeed their babies. In this study, educational attainment was a strong predictor ofbreastfeeding. Even after taking into account differences in income and other factors thatmay affect breastfeeding (see Methods for full list), we found that both the woman’s and herpartner’s education played an important role in the likelihood that she will breastfeed.
Racial/ethnic disparities: Although significant improvements in breastfeeding were seen formost racial/ethnic groups between the mid and late 1990s, the gaps between Whites andboth African Americans and U.S.-born Latinas appeared to widen. African American women(in both time periods) and US-born Latina women (in 1999–2001) were less likely thanWhite women to breastfeed their babies. When other factors were considered, thedisparities in breastfeeding by racial/ethnic group remained significant but appeared to beexplained in part by differences in education and income.
Additional factors deserving particular attention: None of the other factors examined inadditional analyses (see Methods for full list of factors) appeared to play a significant role inbreastfeeding disparities by income, education, or racial/ethnic group.
PAGE 14
DISPARITIES IN MATERNAL AND INFANT HEALTH

PAGE 15
LESSONS FROM CALIFORNIA
Figure 8. Disparities in Breastfeeding in California, by Mother’s Education Level, 1994/1995 and 1999/2001
Relative risk of not breastfeeding:
2.8*
3.8*
2.6*
3.9*
2.4* 2.5*
1 1
0
2
4
1994–1995 1999–2001
< High SchoolHS GraduateSome CollegeCollege Graduate
Equal risk of not breastfeeding
Relative risk > 1 indicates women in this educational group more likely than women who are college graduates to not breastfeed.
*indicates difference is statistically significant (p < .05).
Source: UCSF analysis of Access to Maternity Care survey and Maternal and Infant Health Assessment survey.
*Significantly different from 1994–1995 rate at p<.05.
Source: UCSF analysis of Access to Maternity Care survey and Maternal and Infant Health Assessment survey.
9%
4%*
College graduate
Figure 7. Rates of Not Breastfeeding in California by Mother’s Education Level, 1994/1995 and 1999/2001
23% 22%20%
11%*
17%17%
0%
20%
40% 1994–1995 1999–2001
<High school High schoolgraduate
Some college
Percentage of childbearing women who did not breastfeed:


PAGE 17
Overall, progress was made in California toward achieving some critical Healthy People2000/2010 objectives in maternal and infant health during the 1990s. Between1994–1995 and 1999–2001, fewer women had unintended pregnancies, more womenreceived early prenatal care, and more women breastfed their infants. Across differentincome groups, education levels, and racial/ethnic groups, women experiencedimprovements on these three measures between the two time periods. Despite theseimprovements, however, disparities by income, education, and race/ethnicity did notdiminish in size. Women in more advantaged groups consistently fared better than theirless advantaged counterparts.
Nationally, there has been a call for greater attention to health disparities. Disparities inmaternal and infant health limit women’s and children’s chances for good health and well-being throughout their lives. While the root causes and underlying factors contributing todisparities are complex, there is considerable evidence that systemic inequities in thehealth care system are a contributing factor.
Several factors consistently appeared to contribute to disparities in the maternal and childhealth indicators studied here. For the most part, these factors are reflections ofsocioeconomic status. For unintended pregnancy, prenatal care, and breastfeeding,significant disparities by income and/or education remained even after taking into account awide array of other factors, and most racial/ethnic disparities were at least partly explainedby socioeconomic differences. Thus, efforts addressing differences in economic resourcesand other factors closely related to socioeconomic status are likely to be critical for reducingthe disparities in each of these three indicators.
In addition, the results reported here point to health insurance coverage as a key factor indisparities in maternal and infant health. They also suggest that increased use of familyplanning could not only reduce unintended pregnancies but may also lead to more timelyprenatal care. Other policies that are likely to affect health and levels of disparity mayinclude the quantity and/or quality of education received by less advantaged groups. Thesefindings underscore how health care policy is intertwined with policy in other sectors,indicating that multi-sectoral efforts are needed to address health disparities.
Despite some differences in the patterns of disparities and in the specific policy contextsfor the three indicators of maternal and infant health examined here, the findings overallsupport the following general recommendations:
III.POLICY IMPLICATIONS

PAGE 18
DISPARITIES IN MATERNAL AND INFANT HEALTH
Identifying and targeting the vulnerable subgroups is critical for closing the gaps. Consistently,the findings demonstrate that the least-advantaged groups fare worst in maternal and infanthealth outcomes. For each outcome, there were absolute improvements overall and amongwomen in many social groups between 1994–1995 and 1999–2001. However, withoutrelatively greater improvements among women in the least-advantaged groups, the relativedisparities did not diminish, suggesting that targeted efforts that are tailored toward thesocioeconomic and racial/ethnic groups at greatest risk will be needed to make significantprogress on eliminating disparities. This challenge is bound to grow as all of the states, andparticularly California, face severe budget shortfalls that threaten services for vulnerablewomen and families.
Efforts to eliminate disparities must also reach a broader spectrum of childbearing women.While certain groups are at greatest risk for poor outcomes, this report shows that evengroups that are not the most vulnerable fell short of meeting the Healthy People targets forunintended pregnancy and prenatal care. Because most childbearing women in Californiaare in groups at elevated risk, efforts must focus on a broader spectrum of the population.Even women with moderate incomes and those with some college education were found tohave higher rates of unintended pregnancy, late prenatal care, and lower rates ofbreastfeeding than their higher-income and higher-education counterparts.
Continue monitoring disparities to identify groups at risk and assess progress. This researchhighlights the importance of looking beyond aggregate figures when monitoring health statusand outcomes. Overall patterns can obscure significant disparities between subgroups. Asshown by the examples in this issue brief, social and economic disparities are complexissues, involving a number of factors that interact in complicated relationships. Lookingbeneath the overall trends helps reveal the levels of disparity, the subgroups that are atgreatest risk, and the different factors that are likely to play a role in health inequities.

PAGE 19
LESSONS FROM CALIFORNIA
Conclusion
The findings reported here demonstrate what can be learned from a practical approach tostudying disparities in these and other indicators—an approach that can be adapted withappropriate modifications by other researchers, including those in state health departments.(A more detailed explanation of this approach will be available in the December 2004 issueof the American Journal of Public Health.) While monitoring and research are surely notsufficient to eliminate health disparities, they are essential for assessing our progress andhelping to identify priority areas. Having information to measure and understand thedisparities is critical for formulating effective strategies and targeting limited resources.
The economic recession and budget crises now faced by California and other states are ofgreat concern, threatening severe cuts in services that are likely to have contributed toearlier improvements in maternal and infant health and health care. In California, theMedicaid program faces the possibility of broad-scale reform with unknown consequencesfor the family planning program, which has been critical in serving low-income women andis often held up as a model for other states. In such an environment, close monitoring ofdisparities at the state level will be particularly crucial, both to assess and improve theeffectiveness of policies and programs and to document needs for additional resources.


PAGE 21
LESSONS FROM CALIFORNIA
APPENDIX: METHODS
A brief summary of methods is given here. More detailed information on the data sources isavailable from the authors.
Data Sources and Limitations
This report summarizes cross-sectional data from two California statewide-representativepostpartum surveys linked with birth certificates. The most recent data were obtained in1999 through 2001 as part of the Maternal and Infant Health Assessment (MIHA), anongoing population-based survey of mothers a few months after they deliver liveborn infantsin California; MIHA is a collaborative effort of the California Department of Health ServicesMaternal and Child Health Branch and the University of California, San Francisco,Department of Family and Community Medicine. Modeled on CDC’s Perinatal RiskAssessment Monitoring System (PRAMS), MIHA is an annual mail survey with telephonefollow-up to non-respondents; approximately 3,500 mothers are surveyed annually, totaling10,519 in 1999–2001. The Access to Maternity Care Study (ATM), conducted in1994–95, interviewed 10,132 mothers of liveborn infants during their postpartum stays ina representative sample of California hospitals. Both surveys were linked with birthcertificates, and samples were similar to the statewide maternity populations during thecorresponding time periods. Response rates for MIHA and ATM were approximately 71%and 86%, respectively.
Although many of the methods and questions used were similar for both surveys, differencesin the sampling designs for the two surveys indicate that comparisons between the two timeperiods should be made with some caution. Because only two time periods were studied,we were unable to estimate actual time trends.
Health indicators, social groups, and explanatory factors examined in this study:
Which maternal and infant health outcome indicators were studied? Unintended pregnancy: Percentage of childbearing women who reported (a) not trying to getpregnant (1994–95) or (b) not wanting to get pregnant (1999–2001).
Delayed or no prenatal care: Percentage of childbearing women who received no prenatalcare during the first three months of pregnancy (first trimester), because they either beganprenatal care after the first trimester or received no care at all.
No breastfeeding: Percentage of childbearing women who (a) did not plan to breastfeed wheninterviewed during their delivery stays (1994–95) or (b) had never breastfed wheninterviewed 2–7 months after giving birth (1999–2001).

PAGE 22
DISPARITIES IN MATERNAL AND INFANT HEALTH
How were social (socioeconomic and racial/ethnic) groups characterized at the individual orhousehold level?Income: Self-reported family income during pregnancy as a percentage of the federalpoverty level ($17,650 for a family of four in 2001), categorized as 0–100%, 101–200%,201–300%, 301–400%, or above 400% of poverty. Because nearly 11% of the MIHAsample lacked income data, a category was included for missing income. Unintendedpregnancy analyses are limited to women with incomes at or below 400% poverty becausewomen with higher incomes were not asked about pregnancy intention in 1994–1995.
Education: A woman’s self-reported highest completed level of education (did not completehigh school, high school graduate or received GED, some college, college graduate).
Race/ethnicity: Self-reported race/ethnicity categorized as African American, Asian orPacific Islander, European American (including women from Spain and the Middle East),Latina, or Native American/Alaskan Native. Latinas were further categorized as foreign- orUS-born.
What other potential explanatory factors were examined in relation to each of the threematernal or infant health indicators in 1999–2001?Based on the literature and our hypotheses, we examined the following factors (listed byindicator) in addition to the woman’s family income, education, and racial/ethnic group:
Unintended pregnancy: Education level of baby’s father, woman’s age, total number ofbirths, marital status, insurance coverage before pregnancy, regular source of care beforepregnancy, language spoken at home, smoking during pregnancy, drinking alcohol duringpregnancy, and the “sense of control” a woman felt she had over her life.
Delayed or no prenatal care: Education level of baby’s father, woman’s age, total number ofbirths, marital status, insurance during the first trimester, regular source of care beforepregnancy, language spoken at home, importance of prenatal care to others, smoking duringpregnancy, drinking alcohol during pregnancy, “sense of control,” and pregnancy intention.
No breastfeeding: Education level of baby’s father, woman’s age, total number of births,marital status, insurance during pregnancy, language spoken at home, importance ofprenatal care to others, number of prenatal care visits, smoking during pregnancy, whethershe took folic acid or multivitamins before pregnancy, “sense of control,” feelings about thepregnancy, multiple births, length of hospital stay, low birth weight, cesarean section,whether on WIC during pregnancy, and body-mass-index before pregnancy.

PAGE 23
LESSONS FROM CALIFORNIA
ANALYSES
Descriptive analyses: measuring and tracking social disparities in the three maternal andinfant health outcome indicators. We first described the distributions of income, education,and race/ethnicity in each time period. We next determined the prevalence of the maternaland infant health indicators in each income, education, and racial/ethnic group in1994–1995 and 1999–2001, and calculated the relative risk of a poor outcome in eachsocial group using the most advantaged corresponding group (women with incomes above400% of poverty, college graduates, or Whites, respectively) as the reference.
Explanatory analyses: examining specific social groups and risk factors. Using 1999–2001data because they are the most recent, we examined the role of potential explanatory factorsin the observed disparities by: (1) in each income, education, and racial/ethnic subgroup,examining the prevalence of and relative risks associated with potential explanatory factors;and (2) multivariate logistic regression analyses of (a) the whole sample, to identify factorsassociated with significant reductions in the odds ratios reflecting disparities by income,education, or race/ethnicity; and (b) the at-risk social groups (those disadvantaged groupswith high relative risks of an adverse outcome on a given indicator), to identify significantrisk factors for these women.

The Henry J. Kaiser Family Foundation2400 Sand Hill RoadMenlo Park, CA 94025Tel: (650) 854-9400Fax: (650) 854-4800
Washington office:1330 G Street, N.W.Washington, DC 20005Tel: (202) 347-5270Fax: (202) 347-5274
www.kff.org
Additional copies of this publication (#7157) are available on theKaiser Family Foundation’s website at www.kff.org.
The Kaiser Family Foundation is a non-profit, private operatingfoundation dedicated to providing information and analysis on healthcare issues to policymakers, the media, the health care community,and the general public. The Foundation is not associated with KaiserPermanente or Kaiser Industries.