distillation column november 14, 2002 troy hall 615...
TRANSCRIPT
Distillation Column
Troy Hall November 14, 2002 1
November 14, 2002
Troy HallRed - Yellow Team: Distillation ColumnCollege Of Engineering and Computer ScienceUniversity of Tennessee at Chattanooga615 McCallie AvenueChattanooga, TN. 34705
To: Dr. Jim Henry, P.E. Professor of Engineering University of Tennessee at Chattanooga 615 McCallie Avenue Chattanooga, TN. 34705
Dr. Henry:
The following report is describing the continuous distillation for constant reflux of 95%but different wattage added to reboiler in the distillation column. This report details theobjectives, theory, procedure, equipment analysis, findings, and conclusions obtained.
Troy HallRed – Yellow TeamSenior Undergraduate StudentChemical EngineeringUniversity of Tennessee at Chattanooga

Distillation Column
Troy Hall November 14, 2002 2
Distillation Column Experiments, Continuous DistillationUniversity of Tennessee at Chattanooga
College of Engineering and Computer ScienceEngineering 435 Chemical Process Laboratory
Author: Troy HallTeam Members: John Mayes
Sidney SpencerAnthony PaolucciTo: Dr. Jim Henry
Cc: Dr. Frank Jones

Distillation Column
Troy Hall November 14, 2002 3
Abstract:
The distillation column at the University of Tennessee at Chattanooga was part of a
study for a continuous distillation with constant reflux of 95% using a binary mixture of
methanol and water. The university’s column was used for continuous distillation
experiments with constant reflux of 95% but different wattage added to reboiler in the
distillation column. The data was collected from the continuous distillation at different
wattages supplied to the reboiler and the average temperature was found for the top tray
when the system had reached steady state. Perry’s Handbook for Chemical Engineering
provided an X, Y vs. T diagram of methanol and water. By using the average temperature
of the top tray the distillate composition was found from the graph.
The composition of the column trays was calculated. An energy balance on the condenser
and reboiler was performed. A material balance was performed on the different wattages
being added to the reboiler.
A fifth experiment was conducted with the reflux ratio being lowered to 66% after steady
state was achieved.

Distillation Column
Troy Hall November 14, 2002 4
Table of Contents: Page
I Introduction………………………………………………………………………5
II Theory………………………………………………………………………...…6
III Equipment……………………………………………………..…………...…10
IV Operation Procedure…………………………………………………………..17
V Experimental Procedure………………………………………………………..19
VI Results………………………………………………………………………...21
VII Discussion of Results…………………………………………………………
VIII Recommendations……………………………………………………………
IX References………………………………………………………………………
X Appendices……………………………………………………………………….

Distillation Column
Troy Hall November 14, 2002 5
Section I -Introduction:
The purpose of this study of the distillation column by the Red – Yellow Team was to
study the continuous distillation for constant reflux but different wattage added to
reboiler in the distillation column. This process was conducted on the system at steady
state conditions.
The University’s distillation column was used to perform this investigation. The
distillation column consists of a liquid storage tank with cal rod for a heating element
called the reboiler, 12 distillation trays aligned in a vertical column. The trays serve to
allow the liquid and vapor phases to come in contact and into equilibrium with each
other. The vapor that is produced from the heating of the liquid in the reboiler is
condensed by cooling water that is located inside the condenser at the top of the
distillation column. This vapor is known as reflux and is collected. The collected reflux is
returned to the reboiler.
A theoretical background describing the distillation column and process is contained
in this report. Equipment section will describe the distillation column. Procedure will
describe the procedure used in the investigation on the system. Results will provide the
data that was recorded. The discussion of the results will follow with recommendations
for future experiments. References and Appendices will conclude this report.

Distillation Column
Troy Hall November 14, 2002 6
Section II-Theory:
Distillation is a process used to separate the substances composing a mixture. It
involves a change of state, as of liquid to gas, and subsequent condensation. The
distillation column at the University of Tennessee at Chattanooga was used to separate a
non-ideal mixture of methanol and water. This is known as a binary system since it
contains only two components.
A vapor - liquid equilibrium diagram, figure 1,was created from tabulated data in
Perry’s Handbook for methanol and water mixture. The diagram was used to determine
the composition of each tray.
Figure 1 represents a diagram of the vapor – liquid equilibrium for methanol and water.
The letter A represents the Dew Point on the liquid equilibrium line and the letter B
represents the Bubble Point on the vapor equilibrium line. In this example a temperature
of 78.0 °C is reached giving a dew point mol fraction of 0.30 for the light composition
methanol. The bubble point mol fraction is 0.67 of methanol.
A constant reflux of 95% was used in the first four experiments and the last
experiment the reflux ratio was switched to 66%. The distillate is the product from the
Vapor Equilibrium line
Liquid Equilibrium Line
AB
Perry's Data for Methanol-Water
60
65
70
75
80
85
90
95
100
0.0 0.2 0.4 0.6 0.8 1.0
x,y
Temperature, °C
A B

Distillation Column
Troy Hall November 14, 2002 7
top of the distillate column. At 95% reflux, the 5% product is collected in the condenser
and the remaining 95 % of the mixture is returned to the column. The remaining 95 % is
returned to the distillation column for further distillation. The successive distillation
improves the purity
of the product. Therefore, the higher the reflux percentage, the greater amount of liquid is
sent back to the column for further separation.
The university distillation column contains a rectifying and a stripping section. The
rectifying section is above where the feed is introduced. The stripping section is below
where the feed is introduced.
Energy balance
At steady state the energy added to the distillation column is equal to the energy
removed from the column minus the heat loss to the surrounding environment. Equation
1 was used to find the overall heat loss.
Q reboiler= Q condenser + Q loss (1)
Q reboiler is the energy added to the reboiler, Q condenser is the energy removed from the
condenser, and Q loss is the energy loss by the distillation column to the surrounding
environment.
Q is defined in Equation 2 as:
Q= m Cp ∆T (2)
The above equation was used to perform the energy balance for the condenser. Q is the
energy, in watts, removed by the condenser. The m is the mass flow rate of cold water
entering the condenser. Cp is the heat capacity of water. ∆T equals the Tout minus Tin
and is in ° Celsius.

Distillation Column
Troy Hall November 14, 2002 8
Material balance
Over all balance was achieved with the following formula.
F=B+D (3)
F is the feed rate entering, B is from the reboiler and D is the distillate.
A balance was performed on the condenser. The following equation was used for the
condenser balance.
RD = L/D (4)
RD is the reflux ratio, L is the liquid in the condenser, and D is the distillate.

Distillation Column
Troy Hall November 14, 2002 9
Section III-Equipment:
The distillation column is approximately 15 feet tall and a diameter of 0.5 feet. The
distillation column contains 12 trays, condenser, reflux valves, pumps, Reboiler, and feed
location.
The section of the distillation column located above the feed tray is known as the
rectifying section. The section below the feed tray is known as the stripping section.
Condenser:
“A condenser is heat transfer device used to liquefy vapors by removing their latent
heat. The latent heat is removed by absorbing it in a cooler liquid. In the shell and tube
condenser the condensing vapor and coolant are separated by a tubular heat transfer
surface." (McCabe, Smith, and Harriott) The condenser is of the shell and tube type with
cold water flowing in the tubes and condensation on the shell. The condenser can be seen
in the photograph below.
Photograph P1 shows the condenser.

Distillation Column
Troy Hall November 14, 2002 10
Pumps:
There are four pumps connected to the distillation column located in the 435 lab. The
computer using Labview can control these pumps.
Feed Pump
The feed pump will pump the binary mixture of methanol and water from the feed tank
into the column. The feed is controlled by lab view through Mevan 2002 remote 1.vi.
Reboiler Pump
Reboiler pump is normally used to pump the bottom product out of the reboiler when
the binary liquid level reaches an undesired state. The reboiler pump and the level control
device work together in order to control the level in the reboiler.
Distillate Pump
The distillate pump will pump out the distillate from the distillate receiver. The
distillate is the overhead product.

Distillation Column
Troy Hall November 14, 2002 11
Reboiler:
The distillation column uses a counter current motion inside the column. The reboiler
boils the liquid to create vapor that travels up the column. The reboiler consists of an
electrical heating element called cal rods. As the methanol content inside the reboiler is
turned into vapor, the remaining liquid molar percent becomes more water. The
temperature of the reboiler will rise and the level has to be controlled to ensure the cal
rods remained covered by liquid and don’t burn up. The reboiler is shown in the
photograph below.
Photograph P2 shows the reboiler.
Reflux Valve:
The reflux valve is the valve that divides the distillate flow from the condenser into a
product stream and a reflux stream that reenters the column at tray 1. The reflux valve is
controlled by an electromagnet. Photograph P3 shows the reflux valve.

Distillation Column
Troy Hall November 14, 2002 12
Photograph P3 shows the reflux valve on the distillation column.
Trays:
The separation process utilizes liquid and vapor phases that are at the same
temperature and pressure. The two phases are brought into contact on 12 separate trays.
The trays are stacked in a vertical position and enclosed in a cylindrical shell to form the
distillation column. The trays are designed in a bubble-cap design. Figure 2 depicts a
drawing of the bubble – cap tray.
The down comer zones generally occupy 10 to 30 percent of the total cross section area.
The cross – flow utilizes the liquid down comer due to its transfer efficiency and
operating range. The down comer also helps to control the liquid – flow pattern.
Depending on the efficiency of the tray, the vapor and liquid phases reach thermal,
pressure, and composition equilibrium. The tray efficiency depends on the following:
1. The system – composition and properties
2. Flow condition – rates of throughput
3. Geometry – tray type and dimensions
Downcomer area
Distributing zone
Downcomer area
Distributing zone
Active area
Periphery waste
Distillation Column
Troy Hall November 14, 2002 13
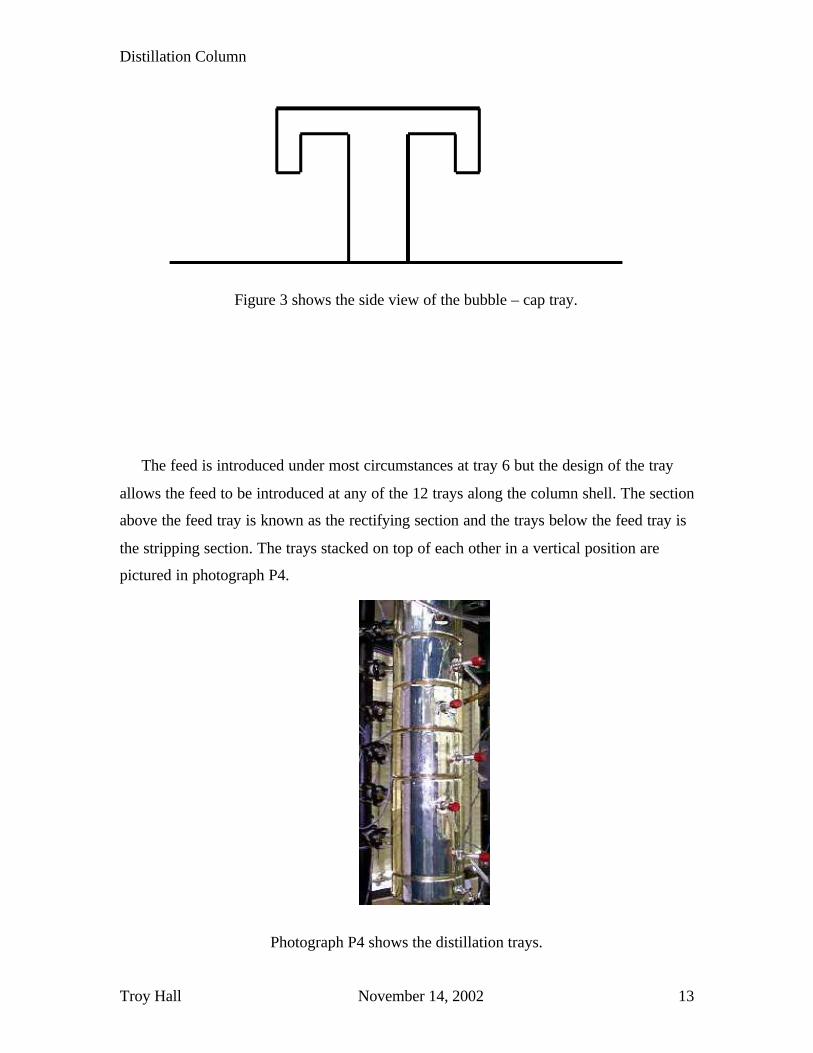
Figure 3 shows the side view of the bubble – cap tray.
The feed is introduced under most circumstances at tray 6 but the design of the tray
allows the feed to be introduced at any of the 12 trays along the column shell. The section
above the feed tray is known as the rectifying section and the trays below the feed tray is
the stripping section. The trays stacked on top of each other in a vertical position are
pictured in photograph P4.
Photograph P4 shows the distillation trays.

Distillation Column
Troy Hall November 14, 2002 14
Photograph P5 shows the sample port on each of the trays in the column.
Feed Location:
When determining the optimal design for the location of the feed the desired outcome
of the system must be considered. Placing the feed toward the stripping section increase
the number of rectifying stages. Placing the feed toward the rectifying section increases
the stripping stages. For a saturated feed the optimal location of the feed is to stage whose
liquid mostly closely approximates the feed composition. P5 shows the feed location.
Photograph P5 shows tray #6 where the feed comes in to the column.

Distillation Column
Troy Hall November 14, 2002 15
Level control system:
Reboiler
The level control system has a small analog pressure transmitter with two sensors. One is
connected with tubing to the lower outlet of the reboiler. This sensor had to wired and
taped to the reboiler in order for it to work properly in the experiment. The other sensor is
open to the atmosphere. A pressure differential is measured and transmitted to the
computer. The computer is able to convert the differential measurement in to a level
reading for the reboiler.
Distillate Receiver
This system is the same as the reboiler control system. A pressure differential is
measured and converted in to a level reading which signals the lever controlled by the
computer.

Distillation Column
Troy Hall November 14, 2002 16
A schematic of the system is depicted on this page. Figure 4 shows the entire system.
Reboiler Pump
Calrod HeatersLiquid Mixture
Reboiler
Feed /Product
Tank
TI PI
LI
Tray 12
Tray 11
Tray 10
Tray 9
Tray 8
Tray 7
TI
TI
TI
TI
TI
TI
Feed
Tray 6
Tray 5
Tray 4
Tray 3
Tray 2
Tray 1
LI
TI
TI
TI
TI
TI
Feed Pump
Reflux
TI
TI
CondenserTI
TI
Supply
Return
Cooling WaterTI
Cooler DistillateReceiver
DistillatePump
F
Heat Loss vs. Reboiler Temperature
0
200
400
600
800
1000
1200
1400
2 0 30 40 50 6 0 70 80 90 100
Reboiler Temperature (°C)
Hea
t L
oss
(W
)
ComputerController
CoolingWater Flow
Valves
Figure 3 -Distillation ColumnSchematic Diagram
Cooling Water

Distillation Column
Troy Hall November 14, 2002 17
Operation Procedure:
Distillation Column Procedure – Start Up:
Turn on the main power switch located above the computer station. (See picture P6 on
the next page).
In order to start the Lab View program for the distillation column, double click on the
short cut to distillation icon. This will open the Mevan 2002 program.
Adjust all inputs on the input screen by clicking on the scale below the input (Ex. Pump
speed, reflux value, reboiler). The inputs should agree with your experiments for the day.
Start the distillation column up by clicking on the green start button located in the upper
left corner of Mevan 2002.
Make sure cold water is circulating in the condenser at the top of the column.
Click on the distillation column files to open the data files for the distillation column.
Select the one marked with the days date.
Caution: DO NOT LET THE WATER LEVEL IN THE REBOILER TANK TO
FALL BELOW THE CALROD HEATERS.
This will result in damage to the calrods therefore resulting in damage to the reboiler
heating system. If the liquid level falls below the calrods turn the column off and the
condensation will return to the reboiler and cover up the calrods. If the condensation is
not enough to cover the calrods more solution will have to be pumped in from the
auxiliary tank.
Distillation Column
Troy Hall November 14, 2002 18
Distillation Column Procedure – Shut Down:
Turn off the all feed sources on the Lab View screen.
Turn the reflux percent up to 100 % to help cool the column.
Turn off all pumps
Click the red stop button located on the top left corner of the Lab View screen.
Save all data files collected for the days experiments.
Turn off the column power source lever located above the computer station.
Distillation Column Procedure- Emergency Shut Down:
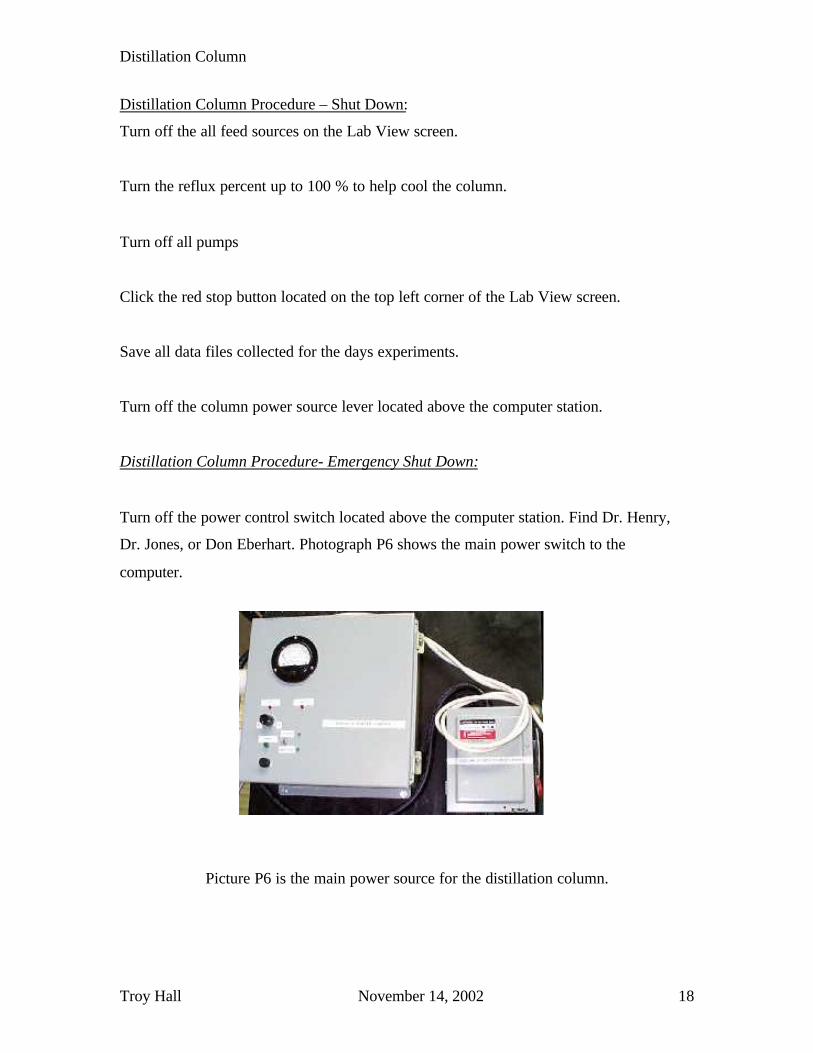
Turn off the power control switch located above the computer station. Find Dr. Henry,
Dr. Jones, or Don Eberhart. Photograph P6 shows the main power switch to the
computer.
Picture P6 is the main power source for the distillation column.

Distillation Column
Troy Hall November 14, 2002 19
Experimental Procedure:
Five experiments were run for continuous distillation operation. The inputs for this
continuous distillation were reflux percent, wattage added to the reboiler, and feed pump
input. The P-only controllers maintained approximately 10 liters in the reboiler. Table 1
depicts the experiments that were run for continuous distillation.
Table 1 Experiments for Continuous Distillation
On the 3000 watts added to the reboiler experiments, the reflux ratio was dropped to
66% after the system reach steady state with the setting of 95% reflux. A 5 mL graduated
cylinder was filled with liquid from the feed tank. The liquid was weighted on the triple
beam balance. The density of the liquid, g/mL, could then be determined from Perry’s
data.
The composition of each tray was looked at each of the five experiments. The
composition of the distillate was calculated at steady state. Temperature data was used in
conjunction with the chart, displayed in figure 1, was used to figure the composition of
methanol in each tray.
Composition of the Column Trays
The distillation column was operated in a continuous distillation and the composition of
the trays was calculated as the system reached steady state. Temperature data was
recorded and used with the X, Y versus T chart to find the composition.
Experiment Number Reflux Ratio Heat Added to Reboiler Composition of wt% Methanol
1 95% 2250 watts 15% 2 95% 2500 watts 15% 3 95% 2750 watts 15% 4 95% 3000 watts 15% 5 66% 3000 watts 15%

Distillation Column
Troy Hall November 14, 2002 20
Result s:
The results section shows the data recorded for the four experiments.
Figure 5 shows the distillate receiver level recorded for continuous distillation at 2250
watts added to the reboiler.
Figure 5 shows the distillate receiver level recorded for 2250 watts added to the reboiler.
The x-axis is time in minutes. The y-axis is the distillate level recorded in ml. The reflux
ratio for this experiment was 95%.
Distillate Receiver Level
200
210
220
230
240
250
260
270
280
290
300
100 105 110 115 120 125 130
Time (min)
Dis
tilla
te le
vel (
ml)

Distillation Column
Troy Hall November 14, 2002 21
Figure 6 shows the X, Y versus T diagram for 2250 watts added to the reboiler
Figure 6 shows the X, Y versus T diagram for the 2250 watts added to the reboiler
experiment. The y-axis gives the temperature in degree Celsius. The x-axis gives the
fraction of liquid and vapor composition in the distillation column. The chart can be used
to determine the dew point and vapor point of the mixture at a given temperature.
X,Y versus T diagram (2250 watts)
60 65 70 75 80 85 90 95
100
0 0.2 0.4 0.6 0.8 1
X, Y
Temp °C

Distillation Column
Troy Hall November 14, 2002 22
Figure 7 shows the distillate receiver level recorded for continuous distillation with 2500
watts added to the reboiler.
Figure 7 shows the distillate receiver level recorded for 2500 watts added to the reboiler.
The x-axis is time in minutes. The y-axis is the distillate level recorded in ml. The reflux
ratio for this experiment was 95%.
Distillate Receiver Level
200
210
220
230
240
250
260
270
280
290
300
100 105 110 115 120 125 130 135 140 145 150
Time (min)
Dis
tilla
te le
vel (
mL
)

Distillation Column
Troy Hall November 14, 2002 23
Figure 8 shows the X, Y versus T diagram for 2500 watts added to the reboiler
Figure 8 shows the X, Y versus T diagram for the 2500 watts added to the reboiler
experiment. The y-axis gives the temperature in degree Celsius. The x-axis gives the
fraction of liquid and vapor composition in the distillation column. This data recorded
with a 95% reflux ratio.
X,Y versus T diagram (2500 watts)
60
70
80
90
100
110
0 0.2 0.4 0.6 0.8 1
X, Y
Temp °C

Distillation Column
Troy Hall November 14, 2002 24
Figure 9 shows the distillate receiver level recorded for continuous distillation with 2750
watts added to the reboiler.
Figure 9 shows the distillate receiver level recorded for 2750 watts added to the reboiler.
The x-axis is time in minutes. The y-axis is the distillate level recorded in ml. The reflux
ratio for this experiment was 95%.
Distillate Receiver Level
200
210
220
230
240
250
260
270
280
290
300
50 52 54 56 58 60 62 64 66 68 70
Time (min)
Dis
tilla
te le
vel (
mL
)

Distillation Column
Troy Hall November 14, 2002 25
Figure 10 shows the X, Y versus T diagram for 2750 watts added to the reboiler.
Figure 10 shows the X, Y versus T diagram for the 2750 watts added to the reboiler
experiment. The y-axis gives the temperature in degree Celsius. The x-axis gives the
fraction of liquid and vapor composition in the distillation column. This data recorded
with a 95% reflux ratio.
X,Y versus T diagram (2750 watts)
60.0
70.0
80.0
90.0
100.0
110.0
0 0.2 0.4 0.6 0.8 1
X, Y
Temp °C

Distillation Column
Troy Hall November 14, 2002 26
Figure 11 shows the distillate receiver level recorded for continuous distillation with
3000 watts added to the reboiler.
Figure 11 shows the distillate receiver level recorded for 3000 watts added to the reboiler.
The x-axis is time in minutes. The y-axis is the distillate level recorded in ml. The reflux
ratio for this experiment was 95% then when steady state was achieved the reflux ratio
was changed to 66%.
Distillate Receiver Level
200
210
220
230
240
250
260
270
280
290
300
80 85 90 95 100 105 110 115 120
Time (min)
Dis
tilla
te le
vel (
mL)

Distillation Column
Troy Hall November 14, 2002 27
Figure 12 shows the X, Y versus T diagram for 3000 watts added to the reboiler and a
reflux of 95%.
Figure 12 shows the X, Y versus T diagram for the 2250 watts added to the reboiler
experiment. The y-axis gives the temperature in degree Celsius. The x-axis gives the
fraction of liquid and vapor composition in the distillation column. This data recorded
with a 95% reflux ratio.
X,Y versus T diagram (3000 watts)
60.0
70.0
80.0
90.0
100.0
110.0
0 0.2 0.4 0.6 0.8 1
X, Y
Temp °C

Distillation Column
Troy Hall November 14, 2002 28
Figure 13 shows the X, Y versus T diagram for 3000 watts added to the reboiler and a
reflux of 66%.
Figure 13 shows the X, Y versus T diagram for the 3000 watts added to the reboiler
experiment. The y-axis gives the temperature in degree Celsius. The x-axis gives the
fraction of liquid and vapor composition in the distillation column. This data recorded
with a 66% reflux ratio. This data appears to be bogus and should be retested.
X,Y versus T diagram (3000 watts)
90.0
95.0
100.0
105.0
0 0.1 0.2 0.3X, Y
Temp °C

Distillation Column
Troy Hall November 14, 2002 29
Table 2 shows the calculations of the distillate rate for continuous distillation and a 95%
reflux rate. Table 2 shows 2250, 2500, and 2750 watts being added to the reboiler.
Minutes Dist. Level (ml) Minutes Dist. Level (ml) Minutes Dist. Level (ml)119 248.77 128.01 239.88 56 274.65115 241.74 125 230.41 55 271.04
4 7.03 3.01 9.47 1 3.61
1.76 mL/min 3.15 mL/min 3.61 mL/min
Minutes Dist. Level (ml) Minutes Dist. Level (ml) Minutes Dist. Level (ml)123 259.9 141 243.59 60 280.8121 252.3 138 242.81 57 275.53
2 7.6 3 0.78 3 5.27
3.80 mL/min 0.26 mL/min 1.76 mL/min
Minutes Dist. Level (ml) Minutes Dist. Level (ml) Minutes Dist. Level (ml)129 267.42 148 242.71 70 291.84127 262.83 145 236.95 67 282.56
2 4.59 3 5.76 3 9.28
2.30 mL/min 1.92 mL/min 3.09 mL/min
Minutes Dist. Level (ml) Minutes Dist. Level (ml) Minutes Dist. Level (ml)126 268.2 134 235.78 65.01 283.54124 263.8 130 234.61 63 275.82
2 4.4 4 1.17 2.01 7.72
2.20 mL/min 0.29 mL/min 3.84 mL/min
2750 Watts
2750 Watts
2750 Watts
2250 watts 2500 watts 2750 Watts
2250 watts
2250 watts
2250 watts
2500 watts
2500 watts
2500 watts

Distillation Column
Troy Hall November 14, 2002 30
Table 3 shows the calculations of the distillate rate for continuous distillation, 3000 watts
added to the reboiler, and a 95% reflux rate changing to a 66% reflux ratio.
Minutes Dist. Level (ml) Minutes Dist. Level (ml)114.67 256.09 176.67 283.93
114 252.09 176.33 273.934 4 4 10
1.00 mL/min 2.50 mL/min
Minutes Dist. Level (ml) Minutes Dist. Level (ml)113.67 254.24 173.67 385.39113.33 250.82 173.33 385.29
4 3.42 4 0.1
0.86 mL/min 0.02 mL/min
Minutes Dist. Level (ml) Minutes Dist. Level (ml)116.67 261.07 171.67 384.51116.34 260.2 171.34 384.22
4 0.87 4 0.29
0.22 mL/min 0.07 mL/min
Minutes Dist. Level (ml) Minutes Dist. Level (ml)111.67 246.13 170.67 384.41111.34 245.84 170.34 382.46
4 0.29 4 1.95
0.07 mL/min 0.49 mL/min
3000 watts 66%
3000 watts 66%
3000 watts 66%
3000 watts 66%
3000 watts 95%
3000 watts 95%
3000 watts 95%
3000 watts 95%

Distillation Column
Troy Hall November 14, 2002 31
Table 4 shows the average of the data recorded for the distillate rate for the experiments
conducted on the distillation column.
Figure 14 shows the graph of the methanol composition in the liquid tray. Thesecalculations were performed once the continuous distillation reached steady state.
Figure 14 shows the continuous distillation with variable wattage graph. The x-axis is thetrays in the distillation column. The y-axis is the mole fraction of methanol. Figure 14illustrates the difference in the liquid composition for the continuous distillation but withdifferent watts added to the reboiler.
Continuous distillation with Variable Wattage
0
0.5
1
0 5 10
Tray
Mole Fraction Methanol
2250, 2500, 2700,3000 watts @ 95%
3000 watts@ 66%
2250 watts 2500 watts 2750 watts 3000 watts 3000 watts95% reflux 95% reflux 95% reflux 95% reflux 66% refluxAvg. ml/min Avg. ml/min Avg. ml/min Avg. ml/minAvg. ml/min
2.015 1.4075 3.075 0.5375 0.77

Distillation Column
Troy Hall November 14, 2002 32
Energy balance
Table 6 shows the energy balance that was performed on the condenser. Reflux and
wattage settings are represented under the continuous distillation column. Cws is the cold
water source and cwr is the cold-water return. Diff t is the difference in the temperature
of the cold-water source and cold water return. Cwf is the cold-water flow is in liters per
minute. A correction factor of 2.8 was need because lab view displays the wrong flow
rate for the system.
ContinuousDistillationReflux % CWS (K) CWR (K) Diff T CWF (L/min) Corr factor Watts absorbed by condenser
95 (2250 watts) 19.48 20.39 1.21 1.14 2.8 202.3395 (2500watts) 18.43 20.93 2.5 1.17 2.8 571.1295 (2700 watts) 18.16 21.28 3.12 1.18 2.8 718.8495 (3000 watts) 15.95 18.33 2.38 1.2 2.8 557.6466 (3000 watts) 15.83 19.55 3.72 1.19 2.8 864.35
Cws is the cold-water source, Cwf is the cold-water flow, Corr factor is the correction
factor added to the cold water flow because the displayed rate on the computer is
inaccurate.
Table 7 displays the watts absorbed by the condenser and the heat loss to the reboiler.
Reflux %Watts absorbed by
condenser Heat Loss-Reboiler (Watts)95 (2500 watts) 202.33 1945.6795 (2250 watts) 571.12 1928.8895 (2700 watts) 718.84 1781.1695 (3000 watts) 557.64 1942.3666 (3000 watts) 864.35 1635.65

Distillation Column
Troy Hall November 14, 2002 33
Table 8 shows the results of the material balance perfomed on the distillation column.
Watts added Refux Ratio F D B L V L' RD Xf XD XB2250 95% 4 0.53 3.47 10.1 10.62 14.09 19 0.15 1 0.022500 95% 4 0.53 3.5 9.5 10 13.5 19 0.14 0.98 0.022750 95% 4 0.34 3.66 6.4 6.74 10.4 19 0.09 0.96 0.013000 95% 4 0.25 3.75 4.75 5 8.75 19 0.09 0.97 0.013000 66% 4 0.23 3.77 0.45 0.69 4.45 1.94 0.02 0.3 0.003
In the table above F is the feed, D is the distillate, B is the bottom of the column, is the
liquid, L’ is the liquid on solute bases, V is the vapor, RD is the reflux ratio, Xf is the
mole fraction of feed in the feed system, XD is the mole fraction of methanol in the
distillate, and XB is composition at the bottom of the column.

Distillation Column
Troy Hall November 14, 2002 34
Discussion of Results:
The composition of each tray from temperature calculations was shown in Figure 14.
The highest methanol percent was found in tray 1 which was consistent with our theory.
Tray 2 through 12 showed subsequently lower mole fraction of methanol.
Using a constant reflux ratio of 95% and various watts added to the reboiler, it was
shown that the mole fraction of methanol was close to the same in the distillation trays.
The 66% reflux ratio showed a lower mole fraction of methanol in the trays in the
rectifying section of the column. The stripping section of the column showed a more
consistent mole fraction of methanol with either 66% or 95% reflux ratio. This was not at
all what I expected to find when making conclusions about the column.
The material balance showed that the column composition at the bottom of the column is
correct.
When the 3000 watts added to the reboiler experiment was run, there was a change in the
reflux ratio. The initial reflux ratio was 95% then switched to 66%. This experiment
need to be reran due to bogus XY versus T plot for 66%.

Distillation Column
Troy Hall November 14, 2002 35
Conclusions:
The methanol concentration in the trays decreases as you move from tray 1 to tray 12.
As the feed is entered in to the column the stripping portion of the column the methanol
is less than it is in the rectifying section.
The distillate level varied as the different wattages was being added to the reboiler.
Recommendations:
It would be interesting to see how the column would perform under a different separation
of a binary mixture; Acetone and water or some other mixture.

Distillation Column
Troy Hall November 14, 2002 36
References:
Unit Operations of Chemical Engineering, 6th Ed., Warren L McCabe, Julian C. Smith
and Peter Harriott, McGraw-Hill, Boston, 2001.
Cunningham, James R. Dr. Lecture Notes Fall 2002 for ENCH 432 at the University of
Tennessee at Chattanooga.
UTC Engineering Controls Lab Online. University of Tennessee at Chattanooga.
http://distillation.engr.utc.edu/data.htm
Engineering 536 Mass Transfer Operations. University of Tennessee at Chattanooga
http://chem.engr.utc.edu/webres/536f/FINALRPT.htm
Perry, Robert H. and Don W. Green. Perry’s Chemical Engineers Handbook, 7th Edition,
June 1, 1997. McGraw-Hill Professional
Engineering 435 Distillation Column Maintenance. University of Tennessee at
Chattanooga September 24, 2002.

Distillation Column
Troy Hall November 14, 2002 37
Appendices:
Figure 15 shows the tray temperature for 2250 watts added to the reboiler.
Trays Temperature Chart (2250)
6 0
6 5
7 0
7 5
8 0
8 5
100 105 110 1 1 5 120 125 130
Time (min)
Temperature °C
Tray 1 Temperature Tray 2 Temperature Tray 3 Temperature Tray 4 Temperature Tray 5 Temperature Tray 6 Temperature
Tray 7 Temperature Tray 8 Temperature Tray 9 Temperature Tray 10 Temperature Tray 11 Temperature Tray 12 Temperature

Distillation Column
Troy Hall November 14, 2002 38
Figure 16 shows the tray temperature for 2500 watts added to the reboiler.
Tray Temps 2500 W
65
66
67
68
69
70
50 100 150 200
Time (min)
Temp. ° C
Tray 1 Temperature Tray 2 Temperature Tray 3 Temperature Tray 4 Temperature
Tray 5 Temperature Tray 6 Temperature Tray 7 Temperature Tray 8 Temperature
Tray 9 Temperature Tray 10 Temperature Tray 11 Temperature Tray 12 Temperature
Distillation Column
Troy Hall November 14, 2002 39
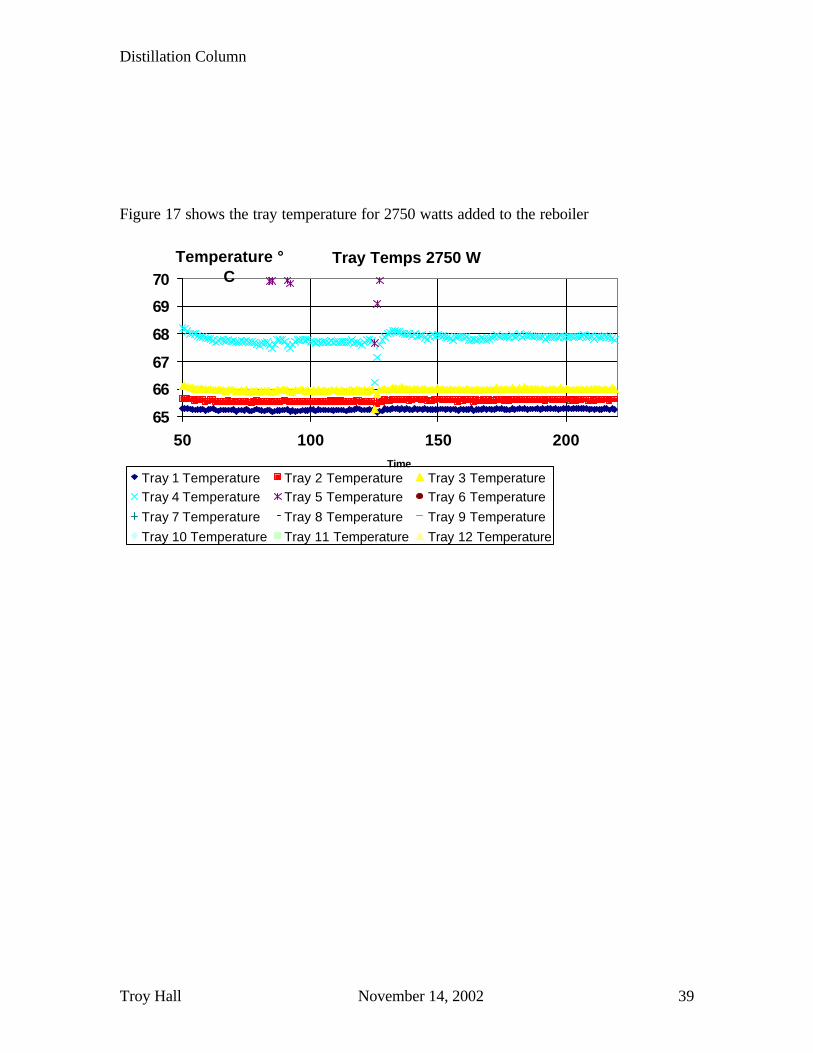
Figure 17 shows the tray temperature for 2750 watts added to the reboiler
Tray Temps 2750 W
65
66
67
68
69
70
50 100 150 200Time
Temperature ° C
Tray 1 Temperature Tray 2 Temperature Tray 3 TemperatureTray 4 Temperature Tray 5 Temperature Tray 6 TemperatureTray 7 Temperature Tray 8 Temperature Tray 9 TemperatureTray 10 Temperature Tray 11 Temperature Tray 12 Temperature

Distillation Column
Troy Hall November 14, 2002 40
Figure 18 shows the tray temperature for 3000 watts added to the reboiler
Tray Temp. 3000 watts
60708090
100110
50 70 90 110
Time (min)
Temperature °C
Tray 1 Temperature Tray 2 Temperature Tray 3 Temperature Tray 4 Temperature
Tray 5 Temperature Tray 6 Temperature Tray 7 Temperature Tray 8 Temperature
Tray 9 Temperature Tray 10 Temperature Tray 11 Temperature Tray 12 Temperature

Distillation Column
Troy Hall November 14, 2002 41
Tray composition data
2500 Tray Temp x comp ycomp xD
1 65.2 0.95 0.98 0.982 65.4 0.94 0.97 xB3 65.8 0.92 0.96 0.024 67.4 0.8 0.92 f5 69.7 0.67 0.86 0.21846 76.5 0.35 0.70 xF7 90.2 0.07 0.35 0.20648 93.0 0.05 0.26 effic9 97.0 0.02 0.12 0.510 96.5 0.02 0.14 11 96.9 0.02 0.12 12 99.8 0.00 0.01
reboiler 96.5 0.02 0.14 Feed 85.7 0.13 0.48
3000 (95%)
2250 Tray Temp x comp ycomp xD
1 64.7 0.99 1.00 1.002 65.1 0.95 0.98 xB3 65.5 0.91 0.96 0.024 67.2 0.75 0.89 f5 70.0 0.66 0.86 0.21636 76.1 0.37 0.72 xF7 89.0 0.08 0.38 0.21578 91.7 0.06 0.30 effic9 95.4 0.03 0.18 0.810 94.7 0.03 0.2 11 95.2 0.03 0.18 12 96.7 0.02 0.13
reboiler 96.1 0.02 0.15 Feed 85.3 0.14 0.49

Distillation Column
Troy Hall November 14, 2002 42
TrayTemp
x compycomp
xD
165.40.940.970.97
265.70.910.96xB
366.20.880.950.01
468.40.750.90
f
571.40.580.82
0.2427
680.20.240.62xF
790.70.070.33

Distillation Column
Troy Hall November 14, 2002 43
0.1628
894.10.040.22effic
998.80.010.03
1098.20.010.07
1198.80.010.03
12101.50.000.00
Reboiler98.10.010.07
Feed88.90.090.39
2750Tray Temp x comp ycomp xD

Distillation Column
Troy Hall November 14, 2002 44
1 65.3 0.92 0.96 0.962 65.6 0.93 0.97 xB3 66.0 0.9 0.96 0.014 67.9 0.78 0.91 f5 70.6 0.62 0.84 0.24446 78.0 0.3 0.67 xF7 91.1 0.06 0.32 0.15338 94.1 0.04 0.22 effic9 98.5 0.01 0.06 0.45
10 97.7 0.02 0.09 11 98.0 0.02 0.08 12 100.8 0.00 0.00
Reboiler 97.8 0.01 0.09 Feed 89.3 0.08 0.38
3000 (66%) Tray Temp x comp ycomp xD
1 91.5 0.06 0.30 0.302 97.3 0.02 0.10 xB3 97.9 0.01 0.08 0.004 98.2 0.01 0.07 f5 97.8 0.01 0.08 0.30226 95.0 0.03 0.19 xF7 95.0 0.03 0.19 0.05328 98.8 0.01 0.03 effic9 103.3 0.00 0.00
10 101.8 0.00 0.00 11 101.8 0.00 0.00 12 103.4 0.00 0.00
Reboiler 99.4 0.00 0.02 Feed 96.7 0.02 0.13

Distillation Column
Troy Hall November 14, 2002 45
Material balances
Visual
RD 1.94 V (mol/hr) 0.69 Qc (kJ) y 0.30
D (mol/hr) 0.23
xD 0.30 L (mol/hr) 0.45 xexit condFeed (mol/hr) 4 xL 0.30
xF 0.02 f 0 VN+1 (mol/hr)
B (mol/hr) 3.77

Distillation Column
Troy Hall November 14, 2002 46
LN (mol/hr) xB 0.00265 xexit reboil Qr (kJ)
2250 watts
Material Balances Overall F=D+B B= 3.47 F*xF=D*xD+B*xB D= 0.53Condenser RD=L/D L= 10.09 V=L+D V= 10.62Feed Tray L'=L+(1-f)F L'= 14.09 V'=V-fF 10.62
Visual
RD 19 V (mol/hr) 10.00 Qc (kJ) y 0.98
D (mol/hr) 0.50
xD 0.98 L (mol/hr) 9.50 xexit condFeed (mol/hr) 4 xL 0.98
xF 0.14 f 0 VN+1 (mol/hr)

Distillation Column
Troy Hall November 14, 2002 47
B (mol/hr) 3.50 LN (mol/hr) xB 0.02 xexit reboil Qr (kJ)
2500 watts
Math Material Balances Overall F=D+B B= 3.50 F*xF=D*xD+B*xB D= 0.50Condenser RD=L/D L= 9.50 V=L+D V= 10.00Feed Tray L'=L+(1-f)F L'= 13.50 V'=V-fF 10.00
Visual
RD 19 V (mol/hr) 6.74 Qc (kJ) y 0.96
D (mol/hr) 0.34
xD 0.96 L (mol/hr) 6.40 xexit condFeed (mol/hr) 4 xL 0.96
xF 0.09

Distillation Column
Troy Hall November 14, 2002 48
f 0 VN+1 (mol/hr)
B (mol/hr) 3.66 LN (mol/hr) xB 0.01 xexit reboil Qr (kJ)
2700 watts
Material Balances Overall F=D+B B= 3.66 F*xF=D*xD+B*xB D= 0.34Condenser RD=L/D L= 6.40 V=L+D V= 6.74Feed Tray L'=L+(1-f)F L'= 10.40 V'=V-fF 6.74
Visual
RD 19 V (mol/hr) 5.00 Qc (kJ) y 0.97
D (mol/hr) 0.25
xD 0.97

Distillation Column
Troy Hall November 14, 2002 49
L (mol/hr) 4.75 xexit condFeed (mol/hr) 4 xL 0.97
xF 0.07 f 0 VN+1 (mol/hr)
B (mol/hr) 3.75 LN (mol/hr) xB 0.01 xexit reboil Qr (kJ)
3000 watts 95% reflux
Material Balances Overall F=D+B B= 3.75 F*xF=D*xD+B*xB D= 0.25Condenser RD=L/D L= 4.75 V=L+D V= 5.00Feed Tray L'=L+(1-f)F L'= 8.75 V'=V-fF 5.00
Visual
RD 1.94 V (mol/hr) 0.69 Qc (kJ) y 0.30

Distillation Column
Troy Hall November 14, 2002 50
D (mol/hr) 0.23
xD 0.30 L (mol/hr) 0.45 xexit condFeed (mol/hr) 4 xL 0.30
xF 0.02 f 0 VN+1 (mol/hr)
B (mol/hr) 3.77 LN (mol/hr) xB 0.00265 xexit reboil Qr (kJ)
3000 watts 66% reflux
Material Balances Overall F=D+B B= 3.77 F*xF=D*xD+B*xB D= 0.23Condenser RD=L/D L= 0.45 V=L+D V= 0.69Feed Tray L'=L+(1-f)F L'= 4.45 V'=V-fF 0.69

Distillation Column
Troy Hall November 14, 2002 51