do entry regulation and taxes hinder firm creation and ... · and another for household surveys,...
TRANSCRIPT

Do Entry Regulation and Taxes Hinder Firm Creationand Formalization? Evidence from Brazil∗
Rudi RochaUFRJ
Gabriel Ulyssea†
PUC-Rio and IpeaLaísa Rachter
UFRJ
September 8, 2014
Abstract
What are the effects of eliminating registration costs and reducing taxes on firmcreation and formalization? We answer this question by estimating the impacts ofa large-scale formalization program in Brazil. We explore exogenous variation inaccess to the program across time, regions and industries using individual paneldata. We show that reducing registration costs is not a sufficient condition toinduce small informal entrepreneurs to formalize nor to foster the creation of newformal businesses. Our unique empirical setting also allows us to separately identifythe impact of reducing taxes once registration costs had already been eliminated.We find modest effects on formalization and none on the creation of new formalbusinesses.
Key words: Entry regulation, taxes, informality, firm creation.JEL code: O17, H32, H26.
∗We would like to thank Mariano Bosch, Carlos Henrique Corseuil, Claudio Ferraz, Miguel Foguel,David McKenzie, and Joana Monteiro for comments and helpful discussions. We are also thankfulto seminar participants at UFRJ, Yale, IDB, PUC-Rio, IPEA, BNDES and the 2013 Meeting of theBrazilian Econometric Society for helpful comments. All remaining errors are ours.†Corresponding author. Address: Department of Economics, Pontifícia Universidade Católica do Rio
de Janeiro, Rua Marquês de São Vicente, 225, Gávea. Rio de Janeiro, RJ, 22451-900, Brasil. Email:[email protected]

1 Introduction
Developing countries are often characterized by burdensome regulations, which areperceived as an important obstacle to firm creation, formalization and growth.1 In or-der to reduce this regulatory burden, many countries have devoted substantial effortsto reduce the monetary and non-monetary costs of registering a business [Bruhn andMcKenzie (2014)]. A growing literature, however, shows little empirical support for theeffectiveness of such reforms. Alternatively, the ongoing costs of formality (e.g. tax lia-bilities) have been increasingly highlighted as a major constraint to firms’ performancein these countries [e.g. Kaplan et al. (2011) and De Mel et al. (2013)].2 If this is thecase, tax reductions could in principle lead to improvements in firm-level outcomes, inparticular greater firm entry and formalization. However, tax reductions can also imply asubstantial fiscal cost, which will be larger the lower their effectiveness in increasing for-malization rates.3 The effectiveness of tax reductions is therefore a key policy parameter,for which we still have very little empirical evidence.
In this paper we answer two specific questions. First, what are the effects of elim-inating regulatory entry costs on the creation of formal firms and the formalization ofexisting informal firms? Second, and most importantly, once registration costs are elimi-nated, what are the effects of reducing the tax burden on firm creation and formalization?To get to these questions, we estimate the effects of a large-scale formalization programimplemented in Brazil, the Individual Micro-Entrepreneur Program (henceforth IMP).4
Introduced in 2009, the program targeted entrepreneurs with at most one employee,and was designed to reduce formalization costs in two dimensions: (i) entry costs, bylowering monetary and non-monetary registration costs; and (ii) the costs of remainingformal, by reducing monthly taxes and red tape. Even though these two sets of benefitswere intended to be introduced simultaneously, we show that in fact the program hadtwo distinct phases. The first phase drastically reduced registration costs but failed toreduce tax rates for most eligible entrepreneurs. This occurred because IMP introduceda monthly lump-sum tax, so only high-income individuals perceived a lower tax rate incomparison to the pre-existing flat rate. It was only in its second phase, when the lump-sum tax is halved, that IMP de facto reduced the monetary cost of remaining formal for
1For within-country evidence, see for example Besley and Burgess (2004). For comprehensive cross-country evidence, Djankov et al. (2002), Botero et al. (2004), and Djankov et al. (2010).
2In Brazil, for example, firms spend on average nearly fifteen times more hours to pay their taxesand face a more than 50% higher tax rate when compared to high-income OECD countries.
3Oppositely, in a scenario where tax reductions induce a large increase in formalization rates, thegains from expanding the tax base could more than compensate the revenue losses from reductions inthe tax rate.
4Programa do Microempreendedor Individual - MEI, in Portuguese.
1

most eligible entrepreneurs. This staggered implementation gives us an unique empiricalsetting in which different incentives are introduced at different points in time. Thisfeature, coupled with variation in access to the program, enables us to separately identifythe effects of reducing registration costs and the costs of remaining formal. As far as weknow, this is the first paper to separately identify these channels.
We explore two sources of exogenous variation in access to the program to identifythese effects. First, eligibility was defined at the industry level. The list of eligibleindustries followed the one used by the pre-existing tax framework for micro, small andmedium enterprises (known as SIMPLES), which was introduced more than a decade priorto IMP.5 As there is no indication that the government hand-picked specific industriesbased on their past performance or observable characteristics, we assume that industryeligibility in IMP was exogenously determined. We perform several empirical tests thatincrease our confidence on this assumption. Second, firm registration within the programmust be made through a web platform, which due to technical restrictions was madeprogressively available across states. This feature generated variation in access to theprogram across states and time.
We use these sources of variation in access to the program across time, regions andindustries to estimate IMP effects using individual panel data, built from the BrazilianMonthly Employment Survey (PME). The panel structure at the individual level allowsus to differentiate formalization of existing informal entrepreneurs from creation of newformal businesses (i.e., transitions of salaried workers into formal entrepreneurship). Theheterogeneity in eligibility and access to the program allows for a treatment/control strat-egy that contrasts the evolution of a given outcome for individuals in different industriesand regions to identify the contribution of IMP to the observed changes.
We find that reducing formal sector’s entry costs had no effect on formalization ofinformal entrepreneurs nor on the creation of new formal businesses. This result is ob-served even amongst high-income informal entrepreneurs, for whom the ongoing costsof formality in IMP were no higher than in SIMPLES. This implies that reducing entrycosts is not a sufficient condition for the formalization of small informal entrepreneurs.We only observe effects on registration of informal entrepreneurs when the monetarycosts of being formal are substantially reduced. In our preferred specification, the es-timates indicate that halving monthly taxes led to a 2.3 percentage points increase inthe median entrepreneur’s registration rate, from a baseline rate of 27%. Several falsi-fication and robustness tests confirm this result. This average effect is entirely driven
5The acronym SIMPLES, in Portuguese, stands for Integrated System for Payment of Taxes andSocial Security Contributions of Micro and Small Enterprises. SIMPLES was the pre-existing, and stillis the main tax system for micro, small and medium enterprises in Brazil.
2

by high-income entrepreneurs, which is consistent with the regressive tax rate scheduleintroduced by IMP. This result is also consistent with the idea that a large fraction oflow-productivity informal firms perceive very small or no benefits at all from formality[e.g. Ulyssea (2013)]. Finally, we find no effects of tax reductions on entrepreneurship, asthe program did not induce either formal or informal salaried workers to become formalentrepreneurs.
This paper makes two main contributions. First, we show that reducing registrationcosts is not a sufficient condition for formalization, even when the costs of remainingformal are also reduced (i.e. amongst high-income entrepreneurs). Second, we are ableto isolate the impact of reducing the ongoing costs of formality on firm creation andformalization, in a context where registration costs had already been nearly eliminated.This paper thus provides the first attempt to test whether the costs of remaining formalare indeed a relevant constraint to the creation of formal firms, irrespective of registrationcosts and net of potential confounding effects. In addition, and contrary to most existingstudies, we are able to identify whether the observed effects on the creation of formalfirms comes from new formal businesses being created or simply informal firms movinginto formality. We find that all the effects come from the formalization of the stock ofinformal firms rather than the creation of new formal businesses.
Several existing studies estimate the effects of reducing registration costs, but do soin settings where the costs of being formal remain unchanged. In a non-experimentalsetting, Kaplan et al. (2011) and Bruhn (2011) estimate the effects of a program thatreduced registration costs in Mexico (SARE) on the creation of formal firms. Bruhn(2011) concludes that the effects come from previously wage workers creating new for-mal businesses. Oppositely, Kaplan et al. (2011) estimate a very small and transitoryimpact, and present evidence that the observed effect comes from the formalization ofexisting informal firms. A second stream of papers relies on experiments and focuseson the formalization of existing informal firms, not being able (by design) to assess theeffects on the creation of new formal firms [e.g. De Mel et al. (2013), De Andrade et al.(2013), De Giorgi and Rahman (2013)]. The results indicate very limited or no effectson formalization. Finally, Monteiro and Assunção (2012) and Fajnzylber et al. (2011)evaluate the effects of SIMPLES, which reduced taxes and red tape associated with taxpayments but left registration costs unchanged. Both studies explore a cross-section offirms to test whether formality was higher amongst new firms created just before andafter the program was introduced, comparing eligible and non-eligible industries. How-ever, as Monteiro and Assunção (2012) recognize, identification concerns leave open thequestion of whether their results are driven by confounding effects.6
6The same is true for Fajnzylber et al. (2011), who follow a similar strategy as Monteiro and As-
3

The remainder of this paper is organized as follows. Section 2 describes the institu-tional setting, the data, and contains the empirical preliminaries. Section 3 describes ourempirical strategy. Section 4 presents and discusses the results, while section 5 presentsrobustness checks. Section 6 concludes.
2 Institutional Setting and Data
2.1 The Individual Micro Entrepreneur Program
The first major initiative to reduce the tax burden of micro, small and medium en-terprises in Brazil dates back to 1996, when the federal government introduced the SIM-PLES program. This program created a differentiated tax system, which reduced redtape, consolidated several taxes and social security contributions into a single payment,and reduced the overall tax burden [Monteiro and Assunção (2012)]. Eligibility to theprogram was defined at the 7-digit industry level and was oriented towards manufactur-ing, transportation, and other services not subject to specific regulations.7 Additionally,a cap on annual revenue limited participation of larger firms. Over the years the rev-enue cap was substantially expanded and the SIMPLES became the relevant institutionalframework for most firms in Brazil.
In July 2009, the federal government introduced a new tax and business registrationframework specifically designed for micro entrepreneurs with up to one employee, theIndividual Micro-Entrepreneur Program (henceforth IMP).8 The program had three maingoals: to foster entrepreneurship and the creation of new formal business; to increase taxregistration and compliance of existing (informal) micro entrepreneurs; and to increasecontributions to the social security system. In fact, the program locked these two marginsof formalization together: when registering their business through IMP, entrepreneurswere also automatically enrolled in the social security system. IMP substantially reducedformalization costs in two dimensions: (i) registration costs, both monetary and non-monetary (e.g. number of procedures required to register a business); and (ii) taxes andred tape associated with tax payments. Hence, the program reduced both the costs of
sunção (2012) but increase the weight of observations in the proximity of the date that the program isimplemented. They also explore a regression discontinuity design that compares firms created aroundthe program’s implementation date. This approach, however, leaves open the question of whether theresults are driven by confounding time fixed effects.
7For instance, the SIMPLES eligibility rule excluded the financial sector, real estate companies, de-velopers, cleaning service firms, and activities with regulated occupations, such as physicians, architects,and musicians.
8This group corresponds to 89% of all entrepreneurs in Brazil [data from the National HouseholdSurvey (PNAD), 2012].
4

entering the formal sector and the costs of remaining formal.Even though these two sets of incentives (lower entry costs and taxes) were intended
to be introduced simultaneously at the time the program was created, this was notthe case. We show that in fact the program had two distinct phases, which we nameIMP1 and IMP2. In the first one (IMP1), the program eliminated monetary entry costsand introduced a web platform for online business registration, which consolidates allprocedures required by agencies at national and sub-national levels into a few onlinesteps. Due to technical constraints, the online platform was not available to all statessimultaneously. There was a 8-month window before all states had access to it, whichoccurred only in February 2010 (Figure 1).9 Since firm registration within the programmust be made through the web platform – and firms cannot register in one state andoperate in another – this generated variation in access to the program across states andtime during IMP1.
Figure 1: IMP Implementation Timeline
*"Eligibility"cap:"R$36,000"per"year *"Eligibility"cap:"R$60,000"per"year*"No"entry"costs *"No"entry"costs*"Fixed"tax"at"11%"of"MW *"Fixed"tax"at"5%"of"MW
>IMP"Phase"1"(IMP1): IMP"Phase"2"(IMP2):
Apr/11
Eligibility"cap"raised"to"R$"
60,000
Nov/11
States"included:"DF,"RJ,"MG,"SP
Sep/09
Expansion"to"SC,"PR,"RS,"CE"and"ES"states.
Remaining"states"
included
Fev/10Jul/09
IMP"started"(01/Jul)
S.S."contribution"to"5%"of"
MW
During IMP1 there was also an attempt to reduce the ongoing costs of formality.Federal taxes were eliminated, while state and municipality taxes were fixed at negligiblevalues. The major tax component became the monthly social security contribution,which was fixed at 11% of the minimum wage and corresponded to more than 90% oftotal monthly tax expenditures. At the time of implementation, IMP1’s monthly taxburden was nearly R$50 (around US$25).10 By fixing monthly tax expenditures, the
9Access was first made available July 1st 2009 for entrepreneurs located in the Federal District; itwas then expanded to the states of Minas Gerais, Rio de Janeiro and Sao Paulo in July 24th; to SantaCatarina, Parana, Rio Grande do Sul, Ceara and Espirito Santo in September 2009.
10The minimum wage was R$465 at the time of implementation and the corresponding social security
5

program automatically introduced a regressive tax rate schedule for eligible entrepreneurs.Moreover, the monthly taxes were fixed at high values relatively to eligible entrepreneurs’income. As a consequence, only entrepreneurs at the highest percentiles of the incomedistribution perceived an actual reduction in their tax rate in comparison to the pre-existing rate under the SIMPLES framework (a fixed rate of around 4%).11 The taxrate under IMP1 was above 10% for entrepreneurs at the 25th percentile of the earningsdistribution. Only for entrepreneurs above the 75th percentile the implied monthly taxrates under IMP1 were similar to, or lower than those of SIMPLES. Figure 2 illustratesthis point.
In April 2011 the program entered its second phase (IMP2), when social securitycontribution was reduced from 11% to 5% of the minimum wage. As shown in Figure2, it was only then that most eligible entrepreneurs perceived an actual reduction intax rates in comparison to that under the SIMPLES framework. Hence, it was only inIMP2 that the program actually reduced the costs of remaining formal for most eligibleentrepreneurs. Put differently, the first phase (IMP1) reduced entry costs but failed toeffectively reduce tax rates. The second phase (IMP2) maintained the benefits from IMP1and further reduced tax rates, effectively reducing the cost of remaining formal for mosteligible entrepreneurs.
2.1.1 Eligibility Criteria
Eligibility to the program is based on three criteria. The first is firm size measuredas number of employees, since the program is targeted at entrepreneurs with at mostone employee. Second, eligibility is defined by annual revenue, with a cap initially set atR$36,000 per year (around US$18,000), and further expanded to R$60,000 in November2011. The annual revenue eligibility cap amounts to around 25% of that under theSIMPLES program, which reinforces the fact that the program was targeted at verysmall businesses.
Third, eligibility was defined by economic activity at the 7-digit industry level. IMP’slist of eligible industries comprised nearly five hundred 7-digit industries, which in 2009(just before the program was fully implemented) corresponded to 46.5% of all entrepreneursin Brazil.12 The definition of eligible and non-eligible industries followed the previous
contribution was R$51 (approximately US$25.5). State and municipality taxes were fixed at R$1 andR$5 per month, respectively (roughly 50 cents and 2.5 US dollars, respectively). IMP1 thus implied anoverall tax burden of either R$52 or R$56, depending on the industry (US$26 or US$28, respectively).
11This corresponds to the tax rate alone. Other variable costs, such as social security contributionand accountant fees are excluded from our calculations, since these are optional and therefore dependon entrepreneurs’ choice.
12According to the National Household Survey (PNAD), our own tabulation. The initial list of eligible
6

Figure 2: Tax rates under SIMPLES, IMP1 and IMP2
Note: Tax rates under the SIMPLES, IMP1 and IMP2 using income in 2011 Reais. The 25th, medianand 75th percentiles refer to the income distribution among entrepreneurs with at most one employeein April 2011, the month of IMP2 implementation. The reduction in tax rates under IMP reflects thereduction of social security contribution from 11% to 5% of the minimum wage in IMP2.
configuration already in place under SIMPLES, which had been introduced more than adecade before IMP implementation. The list of eligible industries was concentrated onmanufacturing, transportation, and services not subject to specific regulations. Therewere minor changes in this list over time, but with no significant variation in the totalnumber of eligible industries (or entrepreneurs) actually observed in the data. We providedescriptive statistics and further details on industry eligibility in the following section.
2.2 Data
The main data set used in our analysis is the Brazilian Monthly Employment Survey(PME), which covers the six largest metropolitan areas in Brazil. It is a rotating panelwith a similar design to that of the Current Population Survey (CPS). It tracks each
industries was edited by Resolution CGSN n.58, April 2009. Marginal changes to the original list wereimplemented by Resolutions CGSN n.64 (August 2009), n.78 (September 2010), n.94 (November 2011),and n.104 (December 2012).
7

household for 4 consecutive months, they rest for 8 months, and are then re-interviewedfor 4 additional months. We use data from January 2006 to August 2012.
In accordance to the eligibility criterion, we focus on entrepreneurs with at most oneemployee (including the self-employed). We do not use the criterion based on revenuebecause the variable reported in the survey is not necessarily the same reported to the taxadministration office.13 The outcome variable is an indicator of whether the individualis an entrepreneur who contributes to the social security system, which is a commonlyused measure of formalization in the literature. Moreover, as discussed in the previoussection, the program locked together social security contribution and business registrationdecisions.14 Hence, contribution to the social security system is a particularly goodformality measure in the present context.
We further restrict our sample to the first and fifth interviews of each individual, sothey are observed in t and t + 12. We include only individuals aged between 21 and 65in their first interview, as well as those who work more than 20 hours per week, so not toinclude occasional occupations. We also exclude individuals in agriculture, public sectorand domestic activities. Our final sample contains 46,212 observations, which correspondsto 23,106 individuals interviewed twice between January 2006 and August 2012. Table 1presents the sample’s main descriptive statistics.
2.2.1 Eligible and Non-Eligible Industries
Despite its many advantages, the PME only contains information about industry clas-sification at the 2-digit level, while program eligibility is defined at a more disaggregatedlevel. Therefore, we use information on industry classification at the 5-digit level availablein the National Household Survey (PNAD) to complement the information available inthe PME.15 The description of how we use the PNAD data to build an improved measureof industry eligibility is provided in the next section.
Table 2 presents summary statistics for entrepreneurs in eligible and non-eligible in-
13In the robustness analysis (Section 5) we do use the criterion based on revenue to further restrictour sample to entrepreneurs below the income threshold. In a different robustness check, we expandthe sample to entrepreneurs with up to 5 employees. The concern in this case is that many small firmshire a share of their workers without a formal labor contract, which can potentially blur the program’seligibility criteria. The results remain largely unchanged in both exercises.
14In Brazil, a firm is formally registered if it holds a CNPJ, which is an acronym for Cadastro Nacionalda Pessoa Jurídica. This is an identification number for firms that is issued by the federal government.
15The National Bureau of Statistics (IBGE) uses two different industry classification systems. Onefor the National Accounts, which is the same used to define program eligibility (at the 7-digit level),and another for Household Surveys, which includes the PNAD (at the 5-digit level). There is a directcorrespondence between these two classification systems that is provided by IBGE. We use this corre-spondence to link industry classification in the PNAD to the one used to define industry eligibility inthe IMP.
8

Table 1: Descriptive Statistics
Mean SD Min Max
Contributes to S.S. (share) 0.27 0.44 0 1
Schooling (years) 8.55 4.00 0 15
Log(Wage) 6.90 0.78 3.25 9.31
Hours worked p/week 43.5 11.0 20 112
Age 44.5 10.6 21 66
White (share) 0.54 0.49 0 1
Male (share) 0.63 0.48 0 1
Obs. 46,212
Source: Authors’ own tabulations from the Monthly EmploymentSurvey (PME).The sample correspond to 23,106 entrepreneurs (self-employed and employers with up to one employee, aged between 21and 65 in the first interview, and who work 20 hours or more perweek) interviewed twice over the January 2006 thought August 2012period.
dustries using PNAD data from 2006 to 2009, just before IMP’s full implementation.To obtain these statistics, we restrict the PNAD data to the same metropolitan regionscovered by PME, and apply the same filters used to restrict the PME sample. We observethat the main difference between eligible and non-eligible industries regards industry com-position, which is explained by the pre-existing eligibility criterion under SIMPLES. Sizedistribution, log-earnings, age and schooling look very similar, even though in most casesthey are statistically different. Taking a step further to refine the comparison betweeneligible and non-eligible groups, we stack the 2006-2009 PNAD data and run a Logitregression of a dummy indicating whether the entrepreneur is in an eligible industry on aseries of observables at the entrepreneur level, conditioning on year and state fixed-effects.We find no association between entrepreneurs’ observables and eligibility, except for theindustry dummies.16
16Results omitted and available upon request.
9

Table 2: Eligible versus Non-Eligible Industries
Non-Eligible Eligible DifferenceMean Mean P-value
Size distribution (shares)No employees 0.815 0.791 0.000
One employee 0.055 0.051 0.113
2 to 5 employees 0.079 0.098 0.000
6 to 10 employees 0.024 0.031 0.000
11+ employees 0.028 0.029 0.415
Formal firms (has CNPJ)† 0.301 0.324 0.019
Contributes to S.S. (share) 0.300 0.314 0.005
Industry Composition
Service 0.072 0.215 0.000
Commerce 0.456 0.142 0.000
Manufacturing 0.020 0.254 0.000
Transportation 0.053 0.094 0.000
Construction 0.313 0.000 0.000
Log-Earnings 7.0 7.0 0.293
Male (share) 0.732 0.543 0.000
Avg. schooling (years) 8.4 9.2 0.000
White (share) 0.526 0.552 0.000
Age 43.1 42.6 0.000
Hours per week 43.9 43.8 0.512
Notes: Authors’ own tabulations from the National Household Sur-veys (PNAD), stacked 2006–2009. Sample restricted to the samemetropolitan regions covered by PME, same additional filters ap-plied.
3 Empirical Strategy
As discussed in the previous section, the PME only provides information about en-trepreneurs’ industry at the 2-digit level. Thus, we do not observe whether she belongs toan eligible industry, as eligibility is defined at a greater level of disaggregation. The mainconsequence is that we cannot directly use PME data to apply a standard difference-in-differences estimator. We thus take a different route and define a potential of treatmentintensity variable, which is the pre-program weighted share of eligible industries withineach 2-digit industry.17 Formally, we use the 2009 PNAD micro data to construct thetreatment intensity variable for a 2-digit industry s as follows:
17This variable is analogous to treatment variables used in different contexts [e.g. Bleakley (2007)].
10

Intenses =
∑k∈s (I [Sub-Industry k is eligible]×Nks)∑
k∈sNks
(1)
where k indexes sub-industries at the 5-digit level, Nks denotes the number of entrepreneursthat belong to sub-industry k within the 2-digit industry s in 2009.18 The variableIntenses is then merged at the industry s level with our monthly panel of entrepreneursfrom PME.
Our strategy is to contrast the evolution of a given outcome for individuals located inindustries with distinct potential of treatment intensities in order to identify the contri-bution of IMP to the observed changes. The underlying assumption is that entrepreneurslocated in industries with higher potential of treatment are more likely to benefit fromthe program than those located in industries with a lower potential. This heterogeneityin potential of treatment allows for a treatment/control strategy analogous to a standarddifference-in-differences estimator. Our approach will be closer to a standard diff-in-diffthe more polarized the distribution of the variable Intenses is. Indeed, Table 3 shows thatIntenses is a discrete variable (it assumes 15 different values) and is very concentratedaround zero and one.
In addition to variation across industries, the staggered implementation of the pro-gram’s web platform also allows us to explore regional variation in access to the programduring its first phase. We thus use a triple interaction between industry (Intenses), time,and region to identify the impacts of IMP1. For IMP2, we rely on the interaction betweenindustry and time.
3.1 Main Specification
In the analysis we consider two sets of outcomes: (i) formalization of informal en-trepreneurs; and (ii) creation of new businesses by individuals who were previously formalor informal employees. In order to identify the effects of reducing entry costs (IMP1) andtaxes (IMP2), we run two separate regressions using time windows around their startdates – July/2007 and April/2011, respectively. More specifically, for IMP1 we definethe sample so that individuals have their first interview at the earliest in August 2008and at the latest in June 2009 – the month just before IMP1 introduction. For IMP2, weanalogously define the time window for the first interview between May 2010 and March
18PNADs’ reference month is September. IMP was first available in the Federal District in July 2009,though the Federal District is not included in our PME sample of metropolitan regions. IMP was thenavailable in Rio de Janeiro, Minas Gerais and Sao Paulo by August 2009, just a few weeks before the2009 PNAD’s month of reference. Since the share of entrepreneurs in eligible industries within each2-digit industry remained quite stable between 2008 and 2009, we opt to base our calculations in 2009,which is closer to IMP1 introduction.
11

Table 3: Variable Intense: Tabulation for Different Samples
Var. Frequencies for Different Sub-samples
Intense Informal Entrepren. Inf. Employee Form. Employee All
0.000 0.219 0.197 0.192 0.193
0.090 0.262 0.167 0.180 0.200
0.126 0.015 0.038 0.058 0.046
0.375 0.015 0.016 0.015 0.016
0.389 0.005 0.009 0.011 0.010
0.604 0.062 0.058 0.067 0.067
0.699 0.015 0.040 0.041 0.033
0.751 0.001 0.009 0.024 0.016
0.822 0.003 0.011 0.017 0.012
0.838 0.056 0.118 0.138 0.119
0.895 0.089 0.051 0.011 0.034
0.907 0.043 0.058 0.036 0.043
0.917 0.002 0.002 0.003 0.003
0.951 0.018 0.037 0.018 0.021
1.000 0.196 0.189 0.188 0.187
Notes: First column contains the values found for the variable Intenses =P
k∈s(I[Sub-Industry k is eligible]×Nks)Pk∈s Nks
. Theremainder columns contain the frequencies for each sub-sample used in regressions: informal entrepreneur in the firstinterview (column 2), informal employee in the first interview (column 3), formal employee in the first interview (column4), and the entire sample (column 5).
2011.19 The main specification for both regressions is given by the following expressions:
Yisrt = β1Post1rt × Intenses + γ1Intenses + γ2Post1rt (2)
+ γ3It × Intenses + γ4ξr × Intenses + Zisrt + φi + εisrt
Yisrt = β2Post2t × Intenses + γ1Intenses + γ2Post2t + Zisrt + φi + εisrt (3)
where i indexes individuals, s industries, r regions and t time. The Yisrt denotes theoutcome variable for entrepreneur i, in industry s, metropolitan region r, at calendar timet. Post1rt is a dummy that indicates whether access to IMP1 through the online platformwas available in metropolitan region r at time t; Post2t is the analogous variable for IMP2,but does not vary across regions; Intenses denotes the weighted share of entrepreneursin eligible industries (equation 1); and It is an indicator variable for the implementationdates in the different regions, i.e. It [t ≥ j] where j ∈ {Aug09, Sept09, Feb10}. The term
19In the robustness analysis we include both variables (IMP1 and IMP2) in a single regression anddo not impose any time restriction on our sample. The results remains unaltered.
12
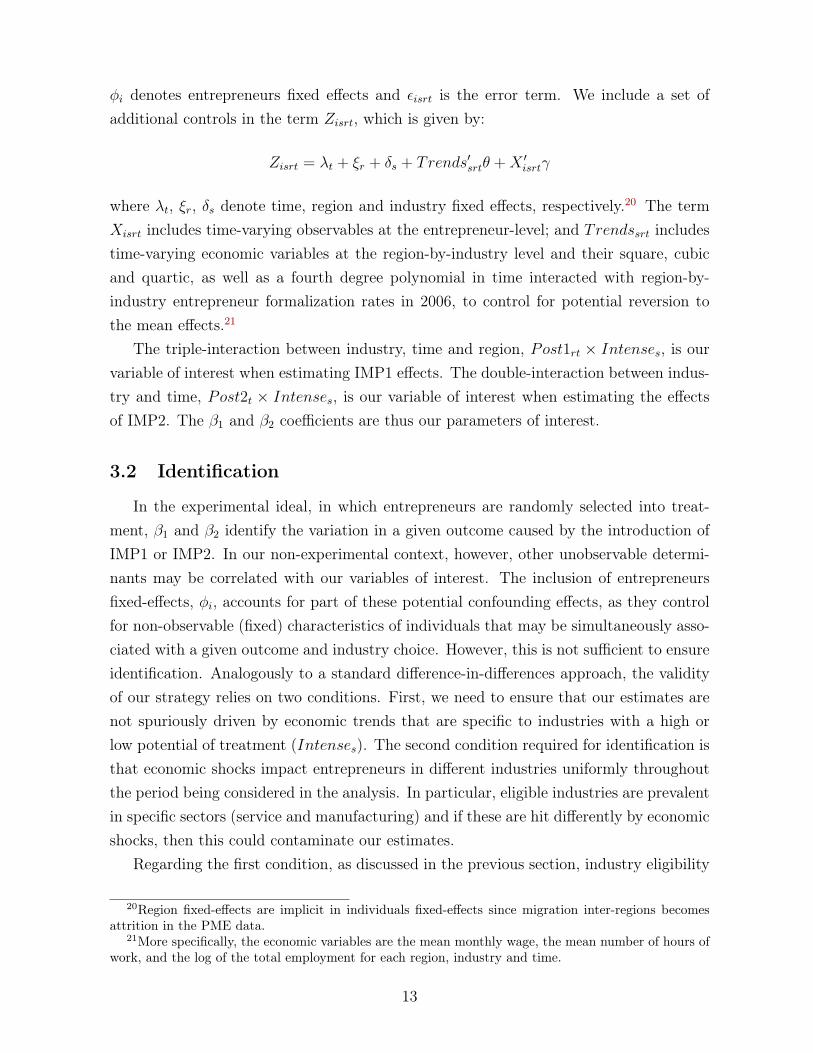
φi denotes entrepreneurs fixed effects and εisrt is the error term. We include a set ofadditional controls in the term Zisrt, which is given by:
Zisrt = λt + ξr + δs + Trends′srtθ +X ′isrtγ
where λt, ξr, δs denote time, region and industry fixed effects, respectively.20 The termXisrt includes time-varying observables at the entrepreneur-level; and Trendssrt includestime-varying economic variables at the region-by-industry level and their square, cubicand quartic, as well as a fourth degree polynomial in time interacted with region-by-industry entrepreneur formalization rates in 2006, to control for potential reversion tothe mean effects.21
The triple-interaction between industry, time and region, Post1rt × Intenses, is ourvariable of interest when estimating IMP1 effects. The double-interaction between indus-try and time, Post2t × Intenses, is our variable of interest when estimating the effectsof IMP2. The β1 and β2 coefficients are thus our parameters of interest.
3.2 Identification
In the experimental ideal, in which entrepreneurs are randomly selected into treat-ment, β1 and β2 identify the variation in a given outcome caused by the introduction ofIMP1 or IMP2. In our non-experimental context, however, other unobservable determi-nants may be correlated with our variables of interest. The inclusion of entrepreneursfixed-effects, φi, accounts for part of these potential confounding effects, as they controlfor non-observable (fixed) characteristics of individuals that may be simultaneously asso-ciated with a given outcome and industry choice. However, this is not sufficient to ensureidentification. Analogously to a standard difference-in-differences approach, the validityof our strategy relies on two conditions. First, we need to ensure that our estimates arenot spuriously driven by economic trends that are specific to industries with a high orlow potential of treatment (Intenses). The second condition required for identification isthat economic shocks impact entrepreneurs in different industries uniformly throughoutthe period being considered in the analysis. In particular, eligible industries are prevalentin specific sectors (service and manufacturing) and if these are hit differently by economicshocks, then this could contaminate our estimates.
Regarding the first condition, as discussed in the previous section, industry eligibility
20Region fixed-effects are implicit in individuals fixed-effects since migration inter-regions becomesattrition in the PME data.
21More specifically, the economic variables are the mean monthly wage, the mean number of hours ofwork, and the log of the total employment for each region, industry and time.
13

under IMP was based on SIMPLES’s list of eligible industries. It was thus defined ona list of industries selected more than a decade prior to IMP. As there is no indicationthat the government hand-picked specific industries based on their past performance orobservable characteristics, we may assume that IMP’s industry eligibility was exogenouslydetermined. Figure 3 provides evidence on the validity of this assumption by plottingformality trends before and after policy changes. We compare average transitions intoformality for those entrepreneurs who report to be informal in the first interview, andare located in industries with distinct potential of treatment intensities (below and abovethe median of the variable Intense). We observe no systematic difference in pre-trendsfor these two groups of entrepreneurs. Nevertheless, we do observe a positive shift intransition rates into formality after IMP2’s implementation, when taxes are halved.
In order to further assess the validity of the assumption that IMP’s industry eligibilitywas exogenously determined, we use the PNAD data to test whether observables at theentrepreneur level or industries’ pre-trends correlate with industry eligibility. We collapsethe micro data at the 5-digit industry level, including averages of entrepreneurs’ socio-demographic characteristics as well as of other outcomes of interest, such as industries’average wage and formalization rates (social security contribution). We then regressindustry eligibility in 2009 (when the program is implemented) against recent variationin formalization rates and wages, as well as other industry-level observables. Table 4presents the results. We find no significant association between industry eligibility andpre-existing trends in formality and wages. This result increases our confidence in theexogeneity of the industry eligibility criterion.
As for the second condition, it is of particular concern for identifying IMP1 effectsbecause its introduction coincides with the effects of the great recession, which werefelt more strongly in Brazil in 2009. For example, if economic recovery within eligi-ble industries was relatively faster (slower) after IMP1, our model would likely overstate(understate) IMP1’s true effect on formalization. To address this potential threat to iden-tification, we first control for specific industry-by-region trends in the term Trendssrt.More importantly, because of the staggered implementation of IMP1 we are able to ex-ploit a triple-interaction between time, region and industry in access to the program,which helps minimize this concern. The identification assumption here is that thereis no reason other than IMP1 for the difference of formalization between industries toincrease relatively more in regions that were treated earlier when compared to thosetreated later.22 As for the IMP2, there is no substantial economic fluctuation around itsimplementation, which reduces our concerns about the potential influence of heteroge-
22A similar triple-difference was implemented in Kaplan et al. (2011), who interacted industry, regionand time eligibility to identify the effect of a reduction in entry costs on firm creation in Mexico.
14

Figure 3: Informal to Formal 12-Month Transition Rates for Entrepreneurs in Industrieswith Potential of Treatment Below and Above the Median
Note: Authors’ own calculation from the Monthly Employment Survey (PME). Annual formalizationrates for each month correspond to the share of formal entrepreneurs in the given month that wereinformal 12 months before. These rates are computed separately for entrepreneurs in industries with lowpotential of treatment (Intenses < Median) and high potential of treatment (Intenses > Median). TheFigure plots the 3-month moving averages of these rates, indexed by the first month used to compute theaverage. The sample corresponds to self-employed and employers with up to one employee who reportedto be informal in the first interview, aged between 21 and 65 in the first interview, and who work 20hours or more per week.
15

Table 4: Determinants of Sector Eligibility: Regressions atthe Industry Level, data from the 2009 PNAD
Dependent variable: Eligible industry in 2009
∆2009−2008(Log Wages) -0.389 -0.405(0.289) (0.288)
∆2009−2008(Formality Rate) -0.110 0.115(0.738) (0.750)
Share Male -0.180 -0.186 -0.180(0.309) (0.313) (0.310)
Avg. Schooling (Yrs) 0.070 0.067 0.070(0.052) (0.051) (0.051)
Share White -1.207 -1.154 -1.225(0.844) (0.832) (0.827)
Avg. Age -0.014 -0.014 -0.014(0.034) (0.035) (0.034)
Share Service 0.265 0.263 0.264(0.250) (0.249) (0.251)
Share Manufacturing 0.621 0.605 0.624(0.195)*** (0.189)*** (0.187)***
Number of Industries 118 118 118
R-squared 0.287 0.281 0.287
Notes: (i) Standard errors in parentheses; (ii) *** p<0.01, ** p<0.05,* p<0.1; (iii).
neous economic shocks across industries. In this case, the validity of our identificationassumption is more straightforward.
3.3 A Simple Framework to Interpret the Estimated Effects
In this section we introduce a very simple model of entrepreneurs’ decision to registertheir business. The goal here is to use this conceptual framework to help us interpretingthe effects we identify with the empirical strategy outlined above. Even though the modelrefers to informal entrepreneurs’ decisions to become formal, the main implications arealso valid to the analysis of heterogenous employees deciding whether to start a formalbusiness.
Let y denote entrepreneurs productivity and, to make notation simple, assume thatentrepreneurs are infinitely lived and have discount rate β.23 Since our empirical analysisfocuses on entrepreneurs with up to one employee, we simply assume that production
23It is straightforward to modify this problem to consider entrepreneurs who work for T periods andthen retire.
16

equals entrepreneur’s productivity. We normalize the price of the final good to one,so that revenues are given by r(y) = y. Entrepreneurs can choose between being formal(IMP1 and IMP2) or informal (INF). Additionally, it is useful to characterize the previousrelevant framework for formal entrepreneurs, which was given by the SIMPLES (SIM).The value function of each state can be described as follows:
V INF (y) =∞∑
t=0
βtΠINF =ΠINF
1− β≡ y − c(y)
1− β
V j(y) =∞∑
t=0
βtΠj =Πj
1− β≡ y − Tj
1− β, j = IMP1, IMP2
V SIM(y) =∞∑
t=0
βtΠSIM − CF =ΠSIM
1− β− CF ≡
(1− τ) y
1− β− CF
where Πk denotes monthly profits in state k = INF, IMP1, IMP2, SIM ; c(·) is a func-tion that summarizes the costs of being informal, where c′, c′′ > 0;24 TIMP1 and TIMP2
denote the fixed monthly tax expenditures in IMP1 and IMP2, respectively; τ and CF
denote the monthly tax rate and the registration costs under SIMPLES, respectively.With this simple structure, it is possible to characterize entrepreneurs’ decisions in
terms of productivity thresholds, as shown in Figure 4. Previously to the introduction ofIMP1 (under the SIMPLES), an entrepreneur would decide to be formal if V SIM(y) ≥V INF (y) ⇐⇒ c(y)−τy ≥ (1−β)CF , or equivalently if y ≥ y4 in Figure 4. After the IMP1is implemented, entrepreneurs formalize if and only if V IMP1(y) ≥ V INF (y) ⇐⇒ c(y) ≥TIMP1, or equivalently iff y ≥ y3 in Figure 4. The magnitude of formalization effectsafter the introduction of IMP1 thus crucially depend on the mass of entrepreneurs withproductivity such that y ∈ [y3, y4]. For higher values of the fixed monthly tax expenditures(TIMP1), we will have that y3 → y4. Moreover, even though IMP1 eliminated entry costs(CF = 0) it raised tax expenditures for a substantial share of entrepreneurs. Due to theregressive structure of IMP’s taxation, high-income entrepreneurs are the only ones whoperceived a decline in formalization costs under IMP1, which correspond to those whoseproductivity is such that τy + (1 − β)CF ≥ TIMP1, or equivalently y ≥ y2 in Figure 4.Finally, under IMP2 the costs of remaining formal, TIMP2, were further reduced, whichled to a de facto reduction in formalization costs for most eligible entrepreneurs. UnderIMP2, entrepreneurs formalize if and only if V IMP2(y) ≥ V INF (y) ⇐⇒ c(y) ≥ TIMP2,or equivalently iff y ≥ y1 in Figure 4.
24This cost function can be motivated as the expected cost of being caught by the government, orany other opportunity cost of being informal (e.g. not having property rights, access to credit, amongothers). This is a common formulation in the literature, see for example de Paula and Scheinkman (2010)and Ulyssea (2013), among others.
17

Figure 4: Graphic Representation of Entrepreneurs’ Decision to Formalizec(y) τ*y+CF*(1-‐β)
Cost
s: τ*
y, c
(y)
TIMP1
TIMP2
y1 y2 y3 y4
Entrepreneurs Productivity
Note: For this graph, we parameterize c(y) = ay2. The thresholds are determined as follows: (i)V IMP2(y1) = V INF (y1) ⇐⇒ c(y1) = TIMP2; (ii) τy2 + (1 − β)CF = TIMP1; (iii) V IMP1(y3) =V INF (y3) ⇐⇒ c(y3) = TIMP1; (iv) V SIM (y4) = V INF (y4) ⇐⇒ c(y4)− τy4 = (1− β)CF .
In sum, this simple analysis shows that estimating IMP1’s average effect does notidentify the effect of reducing either registration costs nor taxes. This is so because theprogram eliminated entry costs but simultaneously increased tax expenditures for a sub-stantial share of eligible entrepreneurs. Hence, overall formalization costs increased forsome entrepreneurs (for those with y < y2 in Figure 4) but decreased for others. Theaverage IMP1 effect will be influenced by both groups, which implies that the net effectcaptured by the estimator will be ambiguous. Nevertheless, estimating IMP1’s effects fordifferent income levels identify the impact of eliminating registration costs, as tax ratesremained nearly constant or were slightly reduced for higher income entrepreneurs underIMP1. Thus, finding a positive effect on business registration for higher income infor-mal entrepreneurs can be interpreted as evidence that entry costs are indeed a bindingrestriction to formalization. Similarly, finding no effect provides evidence that reducingentry costs is not a sufficient condition to induce informal firms to formalize.
Under IMP2 most entrepreneurs perceived an actual reduction in tax rates. There-fore, estimating IMP2’s average effect should identify the impact of reducing the costsof remaining formal (TIMP1 → TIMP2), given that entry costs were already eliminated(Cf = 0). Moreover, if the ongoing costs of being formal are the main factor drivingentrepreneurs’ decisions, we should observe formalization effects that are increasing in
18

entrepreneurs’ income, as the relative cost of formalization is declining in income underIMP.
4 Results
4.1 Effects on Formalization of Informal Firms
We start by analyzing the effects of reducing entry costs (IMP1) and taxes (IMP2)on the formalization of informal entrepreneurs with up to one employee. Panel A ofTable 5 reports IMP1 effects, while Panel B reports IMP2 effects. The first columnincludes time, industry and region fixed-effects, as well as time-varying observables atthe entrepreneur level. Column 2 adds entrepreneur fixed-effects. The third columnadds controls for convergence in formalization rates, while the fourth specification addscontrols for fluctuations in economic activity. In column 5 we restrict the sample to thoseentrepreneurs who do not change industries between interviews, and in column 6 wecluster standard errors at the industry level, allowing for unrestricted residual correlationwithin industries. In all regressions our sample is restricted to entrepreneurs who wereinformal in their first interview, so that we estimate the effects of either IMP1 or IMP2on the formalization of the stock of informal entrepreneurs.
The results in Panel A (Table 5) show that IMP1 had no statistically significant ef-fect on the formalization of informal entrepreneurs, regardless of the specification used.Oppositely, Panel B shows positive and significant coefficients for all specifications con-sidered. The point estimate remains stable when we include entrepreneurs fixed effects(column 1 to 2) but drops to 0.05 once we control for convergence to the mean effects(column 3). From column 3 through 6, the estimated effect remains nearly unchanged,regardless of the specification used. In our preferred specification, which includes the fullset of fixed-effects and controls (column 4), the point estimate is 0.049. Since the averagetreatment intensity is 0.47, this result implies that IMP2 led to a 2.3 percentage pointsincrease in the average entrepreneur’s formalization rate (= 0.049× 0.47).
As discussed in Section 3.3, the estimates of IMP1 average effects do not identify theimpact on formalization of a reduction in registration costs nor in taxes. On the otherhand, IMP2 does identify the effect of reducing taxes on formalization, given that entrycosts had been previously eliminated. In order to isolate the effects of reducing entrycosts and taxes, we explore heterogeneous effects across entrepreneurs’ income levels. Inparticular, if reducing entry costs is not a sufficient condition to induce firms to formalize,then we should find no effect from IMP1 on higher-income entrepreneurs. Similarly, if allformalization effects observed in IMP2 come from lowering the costs of remaining formal,
19

Table 5: Effects on formalization of informal entrepreneurs
Dependent Variable: Formal Entrepreneur (0/1)
(1) (2) (3) (4) (5) (6)
Panel A
IMP1 -0.057 -0.012 -0.024 -0.027 -0.033 -0.033(0.049) (0.051) (0.051) (0.051) (0.058) (0.061)
Number of individuals 2,702 2,702 2,702 2,702 2,217 2,217R-squared 0.126 0.165 0.205 0.210 0.198 0.198
Panel B
IMP2 0.078 0.079 0.050 0.049 0.049 0.049(0.019)*** (0.020)*** (0.020)** (0.020)** (0.021)** (0.027)*
Number of individuals 2,336 2,336 2,336 2,336 1,916 1,916R-squared 0.140 0.203 0.231 0.234 0.231 0.231
Time, region and industry FE Yes Yes Yes Yes Yes YesEntrepreneur FE No Yes Yes Yes Yes YesControl convergence No No Yes Yes Yes YesControl economic fluctuation No No No Yes Yes YesRestrict to same industry No No No No Yes YesCluster at industry-level No No No No No Yes
Notes: Significance *** p<0.01, ** p<0.05, * p<0.1. IMP1 corresponds to the estimated coefficient β̂1
of the interaction Post1rt × Intenses in (2). It corresponds to the effect of the program’s first phase(IMP1), which reduced entry costs but failed to effectively reduce tax rates. IMP2 corresponds to theestimated coefficient β̂2 of the interaction Post2t × Intenses in (3). It corresponds to the effect of theprogram’s second phase (IMP2), which maintained the benefits from IMP1 and effectively reduced the taxrate for most eligible entrepreneurs. All regressions control for time, region, and industry fixed effects.The different specifications are the following: (1) time, industry and region fixed effects, and time-varyingobservables at the entrepreneur level; (2) adds entrepreneur fixed effects; (3) adds controls for convergencein formalization rates; (4) controls for fluctuations in economic activity; (5) we restrict the sample tothose entrepreneurs who do not change industries between interviews; (6) clustered standard errors at theindustry level, allowing for unrestricted residual correlation within industries.
the effects across income levels should follow the pattern implied by IMP’s tax structure.That is, we should observe stronger formalization effects for upper income entrepreneursand lower or zero effects for lower income ones.
To examine these hypotheses, we divide the sample into quartiles of entrepreneurs’ an-nual income and estimate our preferred specification for each quartile.25 Table 6 presentsthe results. We observe in Panel A that IMP1 did not have any significant effect onformalization, irrespective of the income quartile considered. In particular, we observe
25The benchmark specification corresponds to the fourth column of Table 5.
20

no effect for entrepreneurs in higher quartiles, for whom tax rates remained roughly con-stant or were reduced. This result thus implies that reducing entry costs is not a sufficientcondition to induce firms to register. If it was, we should observe positive effects of IMP1on formalization amongst higher income entrepreneurs.
Table 6: Effects on Formalization of Informal Entrepreneurs: Heterogeneity byIncome Level
Dependent Variable: Formal Entrepreneur (0/1)
(1) (2) (3) (4) (5)
Panel A
IMP1 0.045 0.025 -0.183 -0.145 -0.111(0.039) (0.057) (0.119) (0.219) (0.221)
Number of individuals 2,702 673 674 674 681R-squared 0.230 0.232 0.243 0.393 0.394
Panel B
IMP2 0.049 0.024 0.036 0.076 0.115(0.020)** (0.031) (0.034) (0.041)* (0.056)**
Number of individuals 2,336 585 582 580 589R-squared 0.234 0.235 0.236 0.342 0.403
Sample Benchmark 1st Income 2nd Income 3rd Income 4th IncomeQuartile Quartile Quartile Quartile
Notes: Significance *** p<0.01, ** p<0.05, * p<0.1. IMP1 corresponds to the estimatedeffect of the program’s first phase (IMP1), which reduced entry costs but failed to effectivelyreduce tax rates. IMP2 corresponds to the estimated effect of the program’s second phase(IMP2), which maintained the benefits from IMP1 and effectively reduced the tax rate formost eligible entrepreneurs. The benchmark specification corresponds to the fifth column inTable 5: time, industry, region and entrepreneur fixed effects; time-varying observables at theentrepreneur level; controls for convergence in formalization rates; controls for fluctuations ineconomic activity; sample restricted to those who never change industries.
Turning to IMP2 (Panel B in Table 6), we find that formalization effects vary sub-stantially across income levels, and in the expected direction. The results show that thepositive average effect (first column) is entirely driven by entrepreneurs in upper incomequartiles. The point estimate increases monotonically as we move from the lowest to thehighest income quartile, although the effects for those below the median are not statisti-cally significant. In Table 7 we compute the mean effect on formalization rates for eachincome quartile. As expected, the effects for the 3rd and 4th quartiles are higher than
21
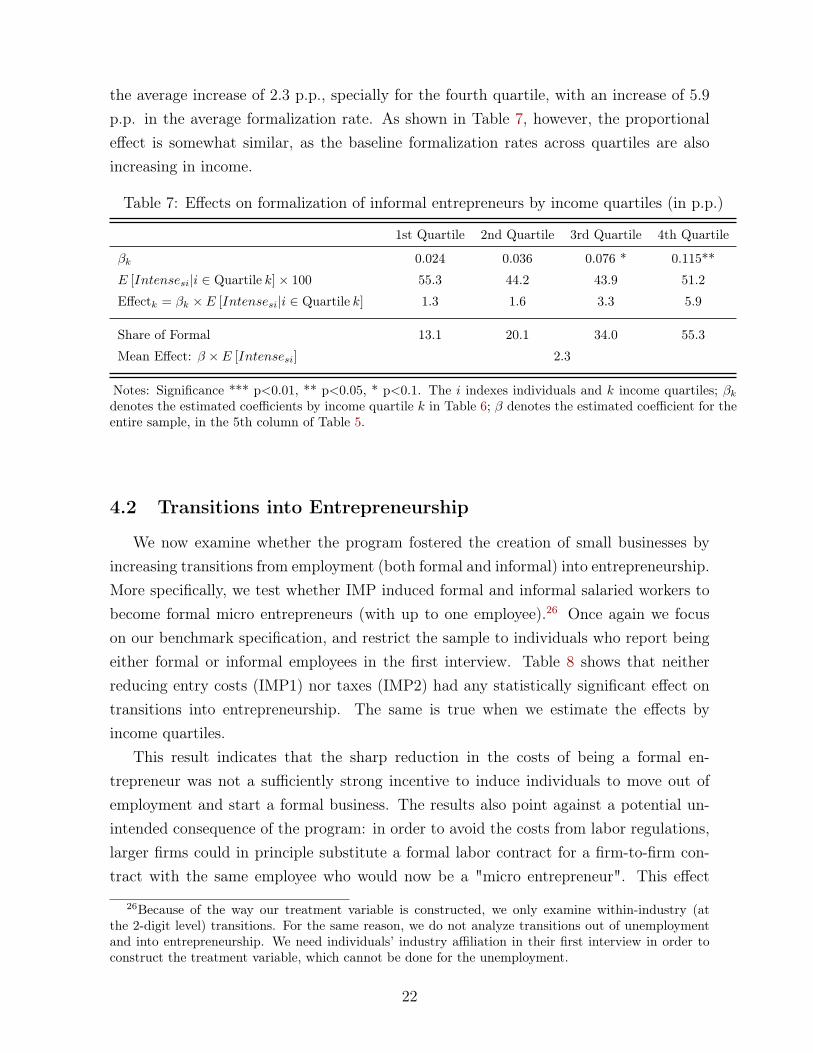
the average increase of 2.3 p.p., specially for the fourth quartile, with an increase of 5.9p.p. in the average formalization rate. As shown in Table 7, however, the proportionaleffect is somewhat similar, as the baseline formalization rates across quartiles are alsoincreasing in income.
Table 7: Effects on formalization of informal entrepreneurs by income quartiles (in p.p.)
1st Quartile 2nd Quartile 3rd Quartile 4th Quartile
βk 0.024 0.036 0.076 * 0.115**
E [Intensesi|i ∈ Quartile k]× 100 55.3 44.2 43.9 51.2
Effectk = βk × E [Intensesi|i ∈ Quartile k] 1.3 1.6 3.3 5.9
Share of Formal 13.1 20.1 34.0 55.3
Mean Effect: β × E [Intensesi] 2.3
Notes: Significance *** p<0.01, ** p<0.05, * p<0.1. The i indexes individuals and k income quartiles; βk
denotes the estimated coefficients by income quartile k in Table 6; β denotes the estimated coefficient for theentire sample, in the 5th column of Table 5.
4.2 Transitions into Entrepreneurship
We now examine whether the program fostered the creation of small businesses byincreasing transitions from employment (both formal and informal) into entrepreneurship.More specifically, we test whether IMP induced formal and informal salaried workers tobecome formal micro entrepreneurs (with up to one employee).26 Once again we focuson our benchmark specification, and restrict the sample to individuals who report beingeither formal or informal employees in the first interview. Table 8 shows that neitherreducing entry costs (IMP1) nor taxes (IMP2) had any statistically significant effect ontransitions into entrepreneurship. The same is true when we estimate the effects byincome quartiles.
This result indicates that the sharp reduction in the costs of being a formal en-trepreneur was not a sufficiently strong incentive to induce individuals to move out ofemployment and start a formal business. The results also point against a potential un-intended consequence of the program: in order to avoid the costs from labor regulations,larger firms could in principle substitute a formal labor contract for a firm-to-firm con-tract with the same employee who would now be a "micro entrepreneur". This effect
26Because of the way our treatment variable is constructed, we only examine within-industry (atthe 2-digit level) transitions. For the same reason, we do not analyze transitions out of unemploymentand into entrepreneurship. We need individuals’ industry affiliation in their first interview in order toconstruct the treatment variable, which cannot be done for the unemployment.
22

Table 8: Effects on Firm Creation by Income Level
Dependent Variable: Formal Entrepreneur (0/1)
(1) (2) (3) (4) (5)
Panel A - Formal Employee in 1st Interview
IMP1 0.012 -0.002 0.011 0.038 0.046(0.008) (0.003) (0.008) (0.050) (0.024)*
Number of individuals 9,458 2,364 2,351 2,353 2,390R-squared 0.031 0.046 0.076 0.077 0.112
Panel B - Formal Employee in 1st Interview
IMP2 -0.003 -0.002 -0.000 -0.000 -0.002(0.003) (0.004) (0.004) (0.004) (0.007)
Number of individuals 10,084 2,510 2,516 2,510 2,548R-squared 0.022 0.032 0.043 0.065 0.071
Panel C - Informal Employee in 1st Interview
IMP1 0.034 0.009 -0.137 0.245 0.130(0.036) (0.012) (0.113) (0.158) (0.100)
Number of individuals 2,103 523 522 523 535R-squared 0.111 0.359 0.174 0.296 0.299
Panel D - Informal Employee in 1st Interview
IMP2 -0.024 0.017 -0.034 -0.023 -0.086(0.018) (0.011) (0.022) (0.034) (0.056)
Number of individuals 1,908 477 473 475 483R-squared 0.138 0.250 0.217 0.255 0.342
Sample Benchmark 1st Income 2nd Income 3rd Income 4th IncomeQuartile Quartile Quartile Quartile
Notes: Significance *** p<0.01, ** p<0.05, * p<0.1. IMP1 corresponds to the estimatedcoefficient β̂1 of the interaction Post1rt × Intenses in (2). It corresponds to the effect of theprogram’s first phase (IMP1), which reduced entry costs but failed to effectively reduce taxrates. IMP2 corresponds to the estimated coefficient β̂2 of the interaction Post2t × Intenses in(3). It corresponds to the effect of the program’s second phase (IMP2), which maintained thebenefits from IMP1 and effectively reduced the tax rate for most eligible entrepreneurs. Thebenchmark specification corresponds to the fourth column of Table 5: time, industry, regionand entrepreneur fixed effects; time-varying observables at the entrepreneur level; controls forconvergence in formalization rates; controls for fluctuations in economic activity.
23

would show up in the data as transitions from employment to entrepreneurship, and wewould not be able to separate these competing stories. We find no evidence in supportof either interpretation.
4.3 Discussion
In Section 3.3 we argued that estimating IMP1 average effects does not allow us totest whether reducing entry costs is a sufficient condition to induce firms to formalize.Due to the regressive structure of IMP taxation, however, the tax rates for upper in-come entrepreneurs remained roughly constant or decreased slightly in IMP1. Thus, ifregistration costs alone are a binding restriction to formalization, we should observe for-malization effects in the upper income quartiles, in particular the fourth. As we do notobserve formalization effects in any income quartile, our results indicate that reducingentry costs is not a sufficient condition to induce informal firms to formalize.
In IMP2 the ongoing costs of being formal were de facto reduced for most eligibleentrepreneurs and therefore the average effect captures the impacts of reducing taxes,given that entry costs were already set to zero. Our results indicate that reducing thecosts of remaining formal does have positive effects on informal entrepreneurs’ decisionto formalize. The effects are stronger for entrepreneurs in upper income quartiles, whoperceived the highest reductions in tax rates. Nevertheless, we do not find any impacton firm creation.
Given that the program introduced strong incentives to formalization, the estimatedeffects are arguably low in magnitude. IMP1 brought registration costs to nearly zerowhile IMP2 established very low monthly tax expenditures. Moreover, it is important tomention that IMP2 introduced a de facto subsidy to social security contribution, since itremained at 11% of the minimum wage for self-employed and entrepreneurs with up toone employee outside IMP.
The natural question is thus why small business owners do not formalize in a largerscale. An increasingly frequent argument in the literature is that the perceived benefitsof formalization are very low for small-scale entrepreneurs [e.g. Bruhn and McKenzie(2014)]. We assess this hypothesis in our context by directly estimating IMP’s effectson entrepreneurs’ income. This exercise corresponds to a reduced-form estimation of theeffect of formalization on income. We repeat the same series of specifications as in Table5, but use as dependent variable the log of entrepreneurs’ income. As Table 9 shows, wedo not find any significant effect of IMP1 nor IMP2 on income. This is consistent withperceived benefits from formalization being low for small firms.
These results are also consistent with and provide further insights to the findings of
24

Table 9: Effects on Income
Dependent Variable: Log(Income)
(1) (2) (3) (4) (5) (6)
Panel A
IMP1 -0.405 -0.142 -0.106 -0.040 0.109 0.109(0.239)* (0.279) (0.280) (0.280) (0.347) (0.313)
Number of individuals 2,702 2,702 2,702 2,702 2,217 2,217R-squared 0.071 0.040 0.043 0.049 0.030 0.030
Panel B
IMP2 0.122 0.100 0.071 0.069 0.086 0.086(0.106) (0.103) (0.101) (0.104) (0.110) (0.081)
Number of individuals 2,336 2,336 2,336 2,336 1,916 1,916R-squared 0.076 0.055 0.059 0.062 0.050 0.050
Time, region and industry FE Yes Yes Yes Yes Yes YesEntrepreneur FE No Yes Yes Yes Yes YesControl convergence No No Yes Yes Yes YesControl economic fluctuation No No No Yes Yes YesRestrict to same industry No No No No Yes YesCluster at industry-level No No No No No Yes
Notes: Significance *** p<0.01, ** p<0.05, * p<0.1. IMP1 corresponds to the estimatedeffect of the program’s first phase (IMP1), which reduced entry costs but failed to effectivelyreduce tax rates. IMP2 corresponds to the estimated effect of the program’s second phase(IMP2), which maintained the benefits from IMP1 and effectively reduced the tax rate formost eligible entrepreneurs. All regressions control for time, region, and industry fixed effects.The different specifications are the following: (1) time, industry and region fixed effects, andtime-varying observables at the entrepreneur level; (2) adds entrepreneur fixed effects; (3)adds controls for convergence in formalization rates; (4) controls for fluctuations in economicactivity; (5) we restrict the sample to those entrepreneurs who do not change industries be-tween interviews; (6) clustered standard errors at the industry level, allowing for unrestrictedresidual correlation within industries.
De Mel et al. (2013). In their experimental setting, the authors find that eliminatingformal sector’s entry costs alone does not induce firms to formalize; only when providedwith substantial monetary payments some entrepreneurs decide to register their business.Accordingly, our results indicate that the main restriction to formalization are not entrycosts, but the costs of remaining formal. Hence, it is natural that entrepreneurs wouldrequire to be compensated beyond entry costs in order to formalize. Moreover, since redtape associated with tax payments was already eliminated under IMP1, our results showthat the monetary costs are an important restriction to formalization.
25

Finally, we observe no effect of IMP1 and IMP2 on firm creation. This result indicatesthat a substantial reduction in formalization costs – both in the costs of entering theformal sector as well as in the costs of staying formal – is not a sufficient condition tofoster the creation of new businesses. It is worth noting that before IMP these individualsalready had the option to become informal entrepreneurs but chose to be employees. Ifformal and informal entrepreneurship are close substitutes for these individuals, thenreducing the costs of formal entrepreneurship is indeed unlikely to have any effect onoccupational choice.
5 Robustness Checks
We start our robustness analysis by performing falsification tests. For that, we arti-ficially change the timing of IMP implementation, considering lags of one, two and threeyears relatively to the actual start date. For each false implementation date, we re-definethe time window accordingly, using the same procedure as in our benchmark model.For example, in the first column in Table 10, Panel A, we present the coefficient of atriple-interaction between the potential of treatment intensity, time and region eligibilitylagged one year relatively to IMP1’s starting date. Panel B reports analogous estimatesfor IMP2, although in this case we do not have a clear placebo test since the coefficientsare also partially capturing the effects of IMP1 over 2010. The second and third columnsreport the results from analogous regressions considering two and three years lags, respec-tively.27 The higher-order lags allow for a true placebo test for IMP2, as the relevant timewindow in both cases is defined before the actual start date of the program. As Table 10shows, we find no statistically significant effect in any of these regressions. Thus, there isno association between our variables of interest and formalization rates before the actualIMP implementation. This result reduces our concerns about the potential influence ofconfounding effects driven by unobserved trends, or even by heterogeneity in economicshocks and their consequences across industries and regions.
Table 11 provides an additional test for the potential influence of unobservable trendsin our results. We repeat the same sequence of specifications as in Table 5, but nowsimultaneously include the variables IMP1 and IMP2 in the regressions, and do not imposeany time restriction to our sample. We thus use the full sample of entrepreneurs with up toone employee, who were informal in their first interview, and who were interviewed twiceover the 2006-2012 period. This specification allows us to capture the influence of time-trends with more precision, as we are able to explore the entire sample (6 years of monthly
27We are not able to build the placebo for IMP1 lagged three years because our sample begins inJanuary 2006.
26

Table 10: Placebo Tests on Formalization of Informal En-trepreneurs
Dep Var: Formal Entrepreneur (0/1)
(1) (2) (3)Lag 1 Year Lag 2 Years Lag 3 Years
Panel A
IMP1 0.032 -0.068 -(0.029) (0.044) -
Number of individuals 2,721 2,778 -R-squared 0.187 0.178 -
Panel B
IMP2 -0.003 -0.003 0.020(0.017) (0.015) (0.016)
Number of individuals 2,556 2,792 2,698R-squared 0.213 0.218 0.194
Notes: Significance *** p<0.01, ** p<0.05, * p<0.1. Regressionsinclude time, industry, region and entrepreneur fixed effects; time-varying observables at the entrepreneur level; controls for conver-gence in formalization rates; and controls for fluctuations in economicactivity.
data) rather than a time window around the program’s implementation date. It also testswhether our results are robust to the way specify our sample in the main regressions. AsTable 11 shows, the results display a similar pattern: we find no relationship betweenIMP1 and formalization, while IMP2 effects remain positive albeit slightly smaller inmagnitude.
We also examine whether the results change if we relax the constraint of only lookingat entrepreneurs with at most one employee. Even though this is a (potentially) sharpeligibility criterion, many small formal firms hire informal workers [see Ulyssea (2013)],who are invisible to the government. It is therefore possible that firms registered in IMPhave more than one employee if they hire informal workers as well.28 We run the samespecification as in Table 5, but considering entrepreneurs with at most five employees.As Table 12 shows, the same patterns arise but the point estimates are slightly largerthan in our main results. In the preferred specification the coefficient increases to 0.053
28Unfortunately the PME data set is not matched employer-employee, and therefore we cannot identifyhow many formal and informal workers each firm hires.
27

Table 11: Effects on Formalization of Informal Entrepreneurs: Full sample
Dependent Variable: Formal Entrepreneur (0/1)
(1) (2) (3) (4) (5) (6)
IMP1 -0.019 -0.020 -0.013 -0.014 -0.037 -0.037(0.022) (0.033) (0.033) (0.032) (0.035) (0.037)
IMP2 0.029 0.058 0.045 0.034 0.044 0.044(0.014)** (0.017)*** (0.017)*** (0.018)* (0.021)** (0.020)**
Number of individuals 16,944 16,944 16,943 16,943 13,835 13,835R-squared 0.067 0.134 0.152 0.169 0.189 0.189Time, region and industry FE Yes Yes Yes Yes Yes YesEntrepreneur FE No Yes Yes Yes Yes YesControl convergence No No Yes Yes Yes YesControl economic fluctuation No No No Yes Yes YesRestrict to same industry No No No No Yes YesCluster at industry-level No No No No No Yes
Notes: Significance *** p<0.01, ** p<0.05, * p<0.1. IMP1 corresponds to the estimated effect of theprogram’s first phase (IMP1), which reduced entry costs but failed to effectively reduce tax rates. IMP2corresponds to the estimated effect of the program’s second phase (IMP2), which maintained the benefitsfrom IMP1 and effectively reduced the tax rate for most eligible entrepreneurs. All regressions control fortime, region, and industry fixed effects. The different specifications are the following: (1) time, industryand region fixed effects, and time-varying observables at the entrepreneur level; (2) adds entrepreneur fixedeffects; (3) adds controls for convergence in formalization rates; (4) controls for fluctuations in economicactivity; (5) we restrict the sample to those entrepreneurs who do not change industries between interviews;(6) clustered standard errors at the industry level, allowing for unrestricted residual correlation withinindustries.
against 0.049 observed in our benchmark sample.Finally, we only look at entrepreneurs with annual income below the eligibility thresh-
old (below R$36,000 up to November 2011, and below R$60,000 after that). Again, weshould not expect the income threshold to be binding since firms may register in IMPbut easily under-report earnings. We follow the same specification as in Table 5, butonly considering entrepreneurs below the income threshold. Table 13 presents the re-sults. The same patterns arise but the point estimates are now slightly smaller than inour main results. In the preferred specification the coefficient decreases to 0.046 against0.049 observed in our benchmark sample. This is expected once we excluded from thesample entrepreneurs from upper income quartiles, those who benefited the most fromthe IMP’s regressive tax scheme.
28

Table 12: Effects on Formalization of Informal Entrepreneurs: Entrepreneurs with up to 5Employees
Dependent Variable: Formal Entrepreneur (0/1)
(1) (2) (3) (4) (5) (6)
Panel A
IMP1 -0.080 -0.054 -0.058 -0.061 -0.065 -0.065(0.054) (0.058) (0.056) (0.056) (0.066) (0.070)
Number of individuals 2,922 2,922 2,922 2,922 2,396 2,396R-squared 0.161 0.187 0.230 0.235 0.231 0.231
Panel B
IMP2 0.085 0.088 0.055 0.053 0.055 0.055(0.019)*** (0.020)*** (0.020)*** (0.020)*** (0.021)** (0.025)**
Number of individuals 2,516 2,516 2,516 2,516 2,057 2,057R-squared 0.166 0.229 0.258 0.261 0.251 0.251
Time, region and industry FE Yes Yes Yes Yes Yes YesEntrepreneur FE No Yes Yes Yes Yes YesControl convergence No No Yes Yes Yes YesControl economic fluctuation No No No Yes Yes YesRestrict to same industry No No No No Yes YesCluster at industry-level No No No No No Yes
Notes: Significance *** p<0.01, ** p<0.05, * p<0.1. IMP1 corresponds to the estimated effect of the program’sfirst phase (IMP1), which reduced entry costs but failed to effectively reduce tax rates. IMP2 correspondsto the estimated effect of the program’s second phase (IMP2), which maintained the benefits from IMP1 andeffectively reduced the tax rate for most eligible entrepreneurs. All regressions control for time, region, andindustry fixed effects. The different specifications are the following: (1) time, industry and region fixed effects,and time-varying observables at the entrepreneur level; (2) adds entrepreneur fixed effects; (3) adds controlsfor convergence in formalization rates; (4) controls for fluctuations in economic activity; (5) we restrict thesample to those entrepreneurs who do not change industries between interviews; (6) clustered standard errorsat the industry level, allowing for unrestricted residual correlation within industries.
29

Table 13: Effects on Formalization of Informal Entrepreneurs – Eligibility Criterion usingAnnual Income
Dependent Variable: Formal Entrepreneur (0/1)
(1) (2) (3) (4) (5) (6)
Panel A
IMP1 -0.083 -0.041 -0.047 -0.051 -0.057 -0.057(0.049)* (0.050) (0.050) (0.049) (0.057) (0.058)
Observations 5,122 5,122 5,120 5,120 4,194 4,194R-squared 0.107 0.151 0.178 0.182 0.169 0.169
Panel B
IMP2 0.064 0.070 0.047 0.046 0.042 0.042(0.018)*** (0.019)*** (0.019)** (0.020)** (0.021)** (0.026)
Observations 4,397 4,397 4,397 4,397 3,587 3,587R-squared 0.132 0.191 0.210 0.214 0.199 0.199
Time, region and industry FE Yes Yes Yes Yes Yes YesEntrepreneur FE No Yes Yes Yes Yes YesControl convergence No No Yes Yes Yes YesControl economic fluctuation No No No Yes Yes YesRestrict to same industry No No No No Yes YesCluster at industry-level No No No No No Yes
Notes: Significance *** p<0.01, ** p<0.05, * p<0.1. IMP1 corresponds to the estimated effect of theprogram’s first phase (IMP1), which reduced entry costs but failed to effectively reduce tax rates. IMP2corresponds to the estimated effect of the program’s second phase (IMP2), which maintained the benefitsfrom IMP1 and effectively reduced the tax rate for most eligible entrepreneurs. All regressions control fortime, region, and industry fixed effects. The different specifications are the following: (1) time, industryand region fixed effects, and time-varying observables at the entrepreneur level; (2) adds entrepreneurfixed effects; (3) adds controls for convergence in formalization rates; (4) controls for fluctuations ineconomic activity; (5) we restrict the sample to those entrepreneurs who do not change industries betweeninterviews; (6) clustered standard errors at the industry level, allowing for unrestricted residual correlationwithin industries.
30

6 Final Remarks
In this paper we test whether entry regulation and taxes hinder firm creation andformalization in developing countries. To this end, we estimate the effects of a large scaleformalization program in Brazil, the Individual Micro-Entrepreneur Program (IMP). Webuild a panel of entrepreneurs to exploit time, inter-industry and inter-region exogenousvariations in access to the program to separately identify the causal effect of reducingregistration costs and taxes on formal firm creation. Contrary to most of the literature,we are able to discriminate whether the effects come from new formal businesses beingcreated or simply informal firms moving into formality.
Taken together, our results indicate that registration costs and taxes are not themain barriers to firm creation nor to formalization of small informal businesses. We showthat reducing registration costs is not a sufficient condition to induce small informalentrepreneurs to formalize nor to spur the creation of new formal businesses. We arealso able to identify the impact of reducing the ongoing costs of formality in a contextwhere registration costs had already been nearly eliminated. The results show thatsubstantially reducing the tax burden for small formal businesses has modest effectson the formalization of existing informal firms and none on the creation of new formalbusinesses.
Our results are thus consistent with the view that a large fraction of low productivityinformal firms perceive very small or no benefits at all from formality. Therefore, theydo not choose to enter the formal sector even when formalization costs are substantiallyreduced. Indeed, a large fraction of firms in developing countries have only one or twoemployees,29 and informality rates are highest among these firms. Thus, from a policystand point, our results imply that policies aimed at reducing the costs of formality forsmall firms are likely to have limited effects on formalization rates in developing countries.
29In Brazil, entrepreneurs with at most one employee correspond to 89% of all entrepreneurs [datafrom the 2012 National Household Survey (PNAD), our own tabulation]. Bruhn and McKenzie (2014)provide evidence for other developing countries.
31

References
Besley, T. and R. Burgess (2004). Can labor regulation hinder economic performance?evidence from india. The Quarterly Journal of Economics 119 (1), pp. 91–134.
Bleakley, H. (2007). Disease and development: Evidence from hookworm eradication inthe american south. The Quarterly Journal of Economics 122 (1), 73–117.
Botero, J. C., S. Djankov, R. L. Porta, F. Lopez-de Silanes, and A. Shleifer (2004). Theregulation of labor*. The Quarterly Journal of Economics 119 (4), 1339–1382.
Bruhn, M. (2011). License to sell: The effect of business registration reform on en-trepreneurial activity in mexico. Review of Economics and Statistics 93 (1), 382–386.
Bruhn, M. and D. McKenzie (2014). Entry regulation and the formalization of microen-terprises in developing countries. The World Bank Research Observer 29 (2), 186–201.
De Andrade, G. H., M. Bruhn, and D. McKenzie (2013). A helping hand or the longarm of the law? experimental evidence on what governments can do to formalize firms.Mimeo.
De Giorgi, G. and A. Rahman (2013). Sme’s registration: Evidence from an rct inbangladesh. Economics Letters 120 (3), 573 – 578.
De Mel, S., D. McKenzie, and C. Woodruff (2013). The demand for, and consequences of,formalization among informal firms in sri lanka. American Economic Journal: AppliedEconomics 5 (2), 122–50.
de Paula, A. and J. A. Scheinkman (2010). Value-added taxes, chain effects, and infor-mality. American Economic Journal: Macroeconomics 2 (4), 195–221.
Djankov, S., T. Ganser, C. McLiesh, R. Ramalho, and A. Shleifer (2010). The effectof corporate taxes on investment and entrepreneurship. American Economic Journal:Macroeconomics 3 (2), 31–64.
Djankov, S., R. L. Porta, F. Lopez-de Silanes, and A. Shleifer (2002). The regulation ofentry. The Quarterly Journal of Economics 117 (1), pp. 1–37.
Fajnzylber, P., W. F. Maloney, and G. V. Montes-Rojas (2011). Does formality improvemicro-firm performance? evidence from the brazilian simples program. Journal ofDevelopment Economics 94 (2), 262 – 276.
32

Kaplan, D. S., E. Piedra, and E. Seira (2011). Entry regulation and business start-ups:Evidence from mexico. Journal of Public Economics 95 (11), 1501–1515.
Monteiro, J. and J. J. Assunção (2012). Coming out of the shadows? estimating theimpact of bureaucracy simplification and tax cut on formality in brazilian microenter-prises. Journal of Development Economics 99 (1), 105–115.
Ulyssea, G. (2013). Firms, informality and welfare. University of Chicago, mimeo.
33