doctoral dissertation aliester crowley, "the book of lies", 1913. many thanks are due to...
TRANSCRIPT

MIT/WHOI 2002-04
Massachusetts Institute of Technology Woods Hole Oceanographic Institution
F S^lfc
O Joint Program
in Oceanography/ Applied Ocean
Science and Engineering
§ i /Am %
1930
DOCTORAL DISSERTATION
The Role of Denitrification in the Nitrogen Cycle of New England Salt Marshes
by
Michael Robert Hamersley
February 2002 DISTRIBUTION STATEMENT A
Approved for Public Release Distribution Unlimited
20020924 013

MITAVHOI
2002-04
The Role of Denitrification in the Nitrogen Cycle of New England Salt Marshes
by
Michael Robert Hamersley
Massachusetts Institute of Technology Cambridge, Massachusetts 02139
and
Woods Hole Oceanographic Institution Woods Hole, Massachusetts 02543
February 2002
DOCTORAL DISSERTATION
Financial support came through the generosity of the Education Department at the Woods Hole Oceanographic Institution, the Coastal Systems Group at the School for Marine Science and
Technology, University of Massachusetts, the Reinhart Coastal Research Center, and the Biology Department at WHOI.
Reproduction in whole or in part is permitted for any purpose of the United States Government. This thesis should be cited as: Michael Robert Hamersley, 2002. The Role of Denitrification in the
Nitrogen Cycle of New England Salt Marshes. Ph.D. Thesis. MIT/WHOI, 2002-04.
Approved for publication; distribution unlimited.
Approved for Distribution:
John J. Stegeman, Chair
Department of Biology
x^JbupJb^M^ Paola Malanotte-Rizzoli
MIT Director of Joint Program John W. Farrington
WHOI Dean of Graduate Studies
THE ROLE OF DENITRIFICATION IN THE NITROGEN CYCLE
OF NEW ENGLAND SALT MARSHES
By
Michael Robert Hamersley
B.Sc., University of Victoria, 1991 M. E. Des., University of Calgary, 1996
Submitted in partial fulfillment of the requirements for the degree of
Doctor of Philosophy
at the
MASSACHUSETTS INSTITUTE OF TECHNOLOGY
and the
WOODS HOLE OCEANOGRAPHIC INSTITUTION
December, 2001
© 2001 M. Robert Hamersley All rights reserved.
The author hereby grants to MIT and WHOI permission to reproduce paper and electronic copies of this thesis in whole or in part and to distribute them publicly.
Signature of Author, t& '/fam* / /^Joint Program in Oceanography
.^Massachusetts Institute of Technology d Woods Hole Oceanographic Institution
December 2001
Certified by
Accepted by_
Craig Taylor Thesis Supervisor
Mark Hahn Chair, Joint Committee for Biology
Woods Hole Oceanographic Institution

ACKNOWLEDGEMENTS
All that we know of Man, Nature, God, is just that which they
are not; it is that which they throw off as repugnant.
Aliester Crowley, "The Book of Lies", 1913.
Many thanks are due to my two major advisors, Brian Howes and Craig Taylor.
Brian Howes took me into his lab originally as a guest student, encouraged me to apply to
the Joint Program, and was my principal WHOI advisor during my first two years as a
student, and continued to be my main source of direction and research funding
throughout my time in the Joint Program. Brian is a wizard, a continual reminder of what
I have to shoot for in scientific thinking. Craig Taylor gave help, advice, and office space
from the beginning, and later took on the task of principal WHOI advisor. His laid-back
attitude and humor helped me keep my cool on many an occasion. The other members of
my committee have also been very supportive and encouraging. Thanks to John
Waterbury, and to Jon King for reaching across the gulf from MIT. Lauren Mullineaux
gave encouragement and graciously agreed to serve as the Chair for my Thesis Defense.
I am grateful to Mark Hahn for his official and personal support. A special thanks goes
to Julia Westwater in the Education office for her help. I also owe thanks to Richard
Harbison for Chairing my Thesis Proposal Defense.
I had many collaborators in data collection, analysis, and interpretation. Brian's
work in salt marsh biogeochemistry for the last 20 years formed the foundation of this
research. Many members of his laboratory made important contributions. David White

deserves special mention for his mentoring during my first years at WHOI. His work
with 15N isotopes was the antecessor of my work in Chapter 4. Kirsten Smith and I
collaborated on research in Mashapaquit Marsh, and she contributed her sediment carbon
data. Her work is published in a thesis: Salt marsh uptake of watershed nitrate (Smith,
1999). George Hampson identified the benthic macrofauna and provided field support on
the coldest day, the single January sampling (Figure 3.3). Paul Henderson analyzed the
nitrate samples and contributed in many other ways. Other members of the lab that
played an influential role were Dale Goehringer and David Schlezinger. Susan Brown-
Leger and Marie Evans gave valuable technical and analytical support. Many volunteers
and interns helped me in the field and laboratory. Michael DeLeo, in particular,
volunteered months of his time processing the l5N samples and in dedicated and effective
field and laboratory support. Other volunteers that helped me in the field and the lab are
my good friends: Rebecca Green, Matthew Juli, Lisbeth Kimbell, Jennifer Loose and
Patrick Miller, my father, Michael Hamersley, and two of my brothers, Shannon and
Tristan Hamersley, intern Staci Jasin, and numerous other volunteers and interns. My
thanks to Jennifer Loose for the loan of the computer which enabled me to write at home.
I am grateful to my mother, Denise Forest, for many different kinds of help and support.
Financial support came through the generosity of the Education Department at
WHOI, the Coastal Systems Group at the School for Marine Science and Technology,
University of Massachusetts, the Reinhart Coastal Research Center, and the Biology
Department at WHOI. I owe them some good science in return, I guess! More than
anything, this work was inspired by the insight and support of Brian Howes and his
passion for salt marsh biogeochemistry. My thanks.
BIOGRAPHY
M. Robert Hamersley
EDUCATION
Dec. 2001 Doctor of Philosophy - Biological Oceanography. Massachusetts Institute of Technology / Woods Hole Oceanographic Institution, Massachusetts, USA
Dissertation: The role of denitrification in the nitrogen cycle of New England salt marshes.
Advisors: Dr. Craig T. Taylor, Dr. Brian L. Howes
1996 Master of Environmental Design - Environmental Science. University of Calgary, Alberta, Canada
Thesis: A biogeochemical evaluation of ecotechnology for nitrogen removal from concentrated wastewater.
Advisors: Dr. Richard Revel, Dr. Brian L. Howes
1991 Bachelor of Science - Biology. University of Victoria, British Columbia, Canada
Thesis: Isozyme electrophoresis of an amphidiploid Aster and its progenitors. Advisor: Dr. Geraldine A. Allen
EXPERIENCE
1998 - present Guest Investigator, School for Marine Science and Technology, University of Massachusetts, New Bedford, Massachusetts, USA Supervisor: Dr. Brian L. Howes
1994 - 1996 Guest Student, Woods Hole Oceanographic Institution, Woods Hole, Massachusetts, USA
Supervisor: Dr. Brian L. Howes
1993 Research Assistant, Department of Biology, University of Calgary, Alberta, Canada
Supervisor: Dr. Robert Barclay
1990 - 1991 Research Assistant, Department of Biology, University of Victoria, British Columbia, Canada
Supervisor: Yussef Ibrahim
PUBLICATIONS
Hamersley, M.R., Howes, B.L., White, D.S., Johnke, S., Young, D., Peterson, S.B. and J.M. Teal. 2001. Nitrogen balance and cycling in an ecologically engineered septage treatment system. Ecological Engineering. 18:61-75.
PUBLICATIONS IN SUBMISSION
Hamersley, M.R. and B.L. Howes. Paniculate organic carbon availability controls denitrification in a septage-treating artificial wetland. Water Research (in submission).
Hamersley, M.R., Howes, B.L., and D.S. White. The contribution of floating plants to ammonium and nitrogen removal via nitrification/denitrification in a septage-treating artificial wetland. Journal of Environmental Quality (in submission).
PUBLICATIONS IN PREPARATION
Hamersley, M.R. and B.L. Howes. Contribution of denitrification to C, N, and O cycling in sediments of a New England salt marsh, (in preparation for submission to Marine Ecological Progress Series).
Hamersley, M.R. and B.L. Howes. Evaluation of the N2 flux approach for measuring sediment denitrification. (in preparation for submission to Applied Environmental Microbiology).
Hamersley, M.R. and B.L. Howes. Coupled nitrification-denitrification in vegetated salt marsh sediments measured in situ using a l5NH4
+ tracer, (in preparation for submission to Limnology and Oceanography).
Hamersley, M.R. and B.L. Howes. Competition between plant uptake and coupled nitrification-denitrification for NH4
+ measured in situ in salt marsh sediments, (in preparation for submission to Limnology and Oceanography).
CONFERENCES AND PRESENTATIONS
Estuarine Research Federation International Conference, Providence, Rhode Island. October 15, 1997. The Role of Floating Plants in Nitrification and Nitrogen Removal in an Aerated Septage Treatment System.
Ecological Society of America 80th Annual Meeting, Snowbird, Utah. August 3, 1995. Nitrogen Removal in an Ecologically Engineered Septage Treatment System.
Woods Hole Oceanographic Institution Summer Lecture Series, Woods Hole, MA. July 27, 1995. Nitrogen Cycling in an Artificial Wetland Designed for ' Septage Treatment.
AWARDS, GRANTS, AND HONORS
1997 - 2001 Fellowship (stipend and tuition), Education Department, Woods Hole Oceanographic Institution
2000 Research grant ($4000), Reinhart Coastal Research Center, Woods Hole Oceanographic Institution
1997 Honorable Mention - Conference Presentation, Estuarine Research Federation International Conference
1992 - 1994 Scholarship (stipend and tuition), Natural Sciences and Engineering Research Council (Canada)
1991 Graduated (B.Sc.)with Is' Class Honors, University of Victoria

ABSTRACT
I used direct measurements of nitrogen gas (N2) fluxes and a 15N stable isotope
tracer to determine the contribution of denitrification to salt marsh sediment N cycling.
Denitrification in salt marsh tidal creekbottoms is a major sink for groundwater nitrate of
terrestrial origin. I studied creekbottom denitrification by direct measurements of N2
fluxes in closed chambers against a I0W-N2 background. I undertook experiments and
simulation modeling of sediment N2 fluxes in closed chambers to optimize the key
experimental parameters of this approach. Denitrification in these sediments was driven
by the degradation of labile organic matter pools which are depleted during long
incubations. Sediment thickness was the most important parameter controlling the
required incubation time. Errors of up to 13% with gas headspaces and 80% with water
headspaces resulted from headspace N2 accumulation and the resulting collapse of the
sediment-water diffusion gradient. These errors could be eliminated by using headspaces
of sufficient thickness. Headspace flushing to reduce ammonium accumulation did not
affect denitrification rates, but caused transient disturbance of N2 flux rates. Direct
measurements of O2, CO2, N2, and inorganic N fluxes from the sediments of a salt marsh
tidal creek were made in order to examine the interaction of denitrification with the
carbon, oxygen, and N cycles. Organic carbon concentration and lability were the
primary controls on metabolic rates. CO2/N flux ratios averaged 6.1, indicating
respiration driven by algal biomass. Allochthonous denitrification accounted for 39% of
total sediment denitrification (2.7 mol N m 2 yr"1). 46% of remineralized ammonium was
denitrified, while the contribution of autochthonous denitrification to O2 and CO2 fluxes
was 18% and 10%, respectively. A 15N-ammonium tracer was used to study competition
between plants and nitrifying bacteria for remineralized ammonium. In undisturbed
sediments of Spartina alterniflora, plant uptake out-competed nitrification-
denitrification, with plant uptake accounting for 66% of remineralized ammonium during
the growing season. Under N fertilization (15.5 mol m~2 yr'), both plant N uptake and
denitrification increased, but denitrification dominated, accounting for 72% of the
available N. When plant uptake was hydrologically suppressed, nitrification-
denitrification was stimulated by the excess N, shifting the competitive balance toward
denitrification.
TABLE OF CONTENTS
Title Page 2
Acknowledgements 3
Biography 5
Abstract 7
Table of Contents g
List of Tables 20
List of Figures 21
Chapter 1: Introduction 24
Chapter 2: Evaluation of the N2 flux approach for measuring sediment
denitrification 24
Abstract 25
Introduction 26
Methods 32
Results 40
Discussion 44
Chapter 3: Contribution to denitrification to C, O, and N cycling in sediments of a
New England salt marsh 67
Abstract 6g
Introduction 59
Methods 71
Results 77
Discussion 96
Chapter 4: Competition Between Plant Uptake and Coupled Nitrification-Denitrification
for NH4+Measured in situ'm Salt Marsh Sediments 104
Abstract 105
Introduction 105
Methods 110
Results 119
Discussion 135
Chapter 5: Conclusions 143
References 153
Appendix 1: Algorithm for modeling of N2 flux 162

LIST OF TABLES
Table 2.1 Experimental procedures for N2 gas flux measurements of
denitrification 28
Table 2.2 N2 flux calculations and symbols 37
Table 2.3 Effects of two experimental manipulations of headspace NH4+
concentrations on sediment metabolism 45
Table 3.1 Metabolic fluxes in Mashapaquit Marsh creek sediments 80
Table 3.2 Characteristics of sandy and muddy creek sediments from
Mashapaquit Marsh gj
Table 4.1 Characteristics of unfertilized and XF fertilized vegetated salt marsh
Plots 1U
Table 4.2 T0 recovery of injected ,5N tracer in vegetated salt marsh sediment
cores ]14
Table 4.3 Loss and retention of l5NH4+ tracer from unfertilized and XF
fertilized vegetated salt marsh plots 121
LIST OF FIGURES
Figure 2.1 Diagram of sediment flux chamber 34
Figure 2.2 Calibration of N2 flux model and paired aerobic/anaerobic flux
chambers 41
Figure 2.3 Change in metabolic rates of salt marsh creek sediments through
time 43
Figure 2.4 Modeled sediment porewater N2 off-gassing from a single aerobic
flux chamber 49
Figure 2.5 Modeled effect of sediment thickness on denitrification N2 fluxes
calculated with paired aerobic/anaerobic flux chambers 51
Figure 2.6 Modeled underestimation of sediment denitrification with flux
chamber headspaces of various thicknesses 53
Figure 2.7 Modeled sediment N2 flux into a water headspace as a result of the
collapse of sediment-water concentration gradients 55
Figure 2.8 Modeled effect of headspace flushing during incubation on sediment
N2 fluxes 58
Figure 2.9 Modeled macrofaunal irrigation effects on denitrification N2 fluxes
calculated with paired aerobic/anaerobic flux chambers 62
Figure 3.1 Location of the Mashapaquit Marsh with in the sandy outwash
aquifer of Cape Cod, Massachusetts, USA 72
Figure 3.2 Gas fluxes from sediment cores during incubation in flux chambers 78
11

Figure 3.3 Seasonal cycles of sediment-watercolumn fluxes measured in sandy
and muddy salt marsh creek sediments 84
Figure 3.4 Relationship between field temperature and salt marsh creek
sediment metabolic rates 86
Figure 3.5 Relationship between sediment organic carbon content and
metabolic rates in salt marsh creek sediments 87
Figure 3.6 Carbon-specific sediment C, O, and N fluxes at 4 sites along the
salinity gradient of a salt marsh tidal creek 88
Figure 3.7 Watercolumn N03"-driven denitrification in aerobic salt marsh creek
sediment microcosms 90
Figure 3.8 Inhibition of sediment N03" uptake by presence of 02 decreases with
increasing sediment 02 consumption 92
Figure 3.9 Elemental ratios of C, N, and 02 fluxes across the sediment-water
interface in salt marsh creek sediment microcosms 93
Figure 3.10 Contribution of autochthonous denitrification to C, O, and N fluxes
in salt marsh creek sediments 95
Figure 4.1 Example of l5NH4+ tracer recovery from undisturbed vegetated salt
marsh sediments 120
Figure 4.2 Seasonal denitrification rates in S. alterniflora salt marsh sediments 123
Figure 4.3 Uptake of l5NH4+ tracer by S. alterniflora 125
Figure 4.4 Porewater S"2 and S. alterniflora biomass in hydrologically-
controlled laboratory lysimeters and reference field site 128
12
Figure 4.5 Relationship of porewater S"2 to aboveground S. alterniflora biomass
in hydrologically-controlled lysimeters and reference field site 130
Figure 4.6 NHU+ and biomass in hydrologically-controlled lysimeters 131
Figure 4.7 Short-term fate of 15N for top 15 cm of sediment in hydrologically-
controlled lysimeters 134
Figure 4.8 Loss of 15N tracer by coupled nitrification-denitrification in
hydrologically-controlled lysimeters 136
Figure 4.9 Peak aboveground biomass and denitrification in fertilized and
unfertilized vegetated salt marsh plots 138
13

CHAPTER 1
Introduction
14

Nitrogen (N) limits productivity in coastal waters and excessive N inputs can lead
to eutrophication, causing watercolumn anoxia, loss of submerged aquatic vegetation,
and damage to coastal fisheries (Ryther and Officer, 1981; Kautsky et al, 1986).
Denitrification, the microbial loss of N through conversion to N2 gas, plays an important
role in controlling N availability to support coastal production & eutrophication.
Estuarine denitrification removes as much as 40 - 50% of terrestrial N before it reaches
shelf and oceanic waters (Seitzinger, 1988). On the Atlantic coast of the U.S., salt
marshes also play an important role in intercepting N as it flows from terrestrial to
aquatic environments (Harvey and Odum, 1990; Howes et al, 1996).
Nitrogen enters salt marshes primarily via groundwater, freshwater streams and
tidal water (Valiela and Teal, 1979; Wolaver et al, 1983). In glacial outwash soils such
as those of Cape Cod,. Massachusetts, groundwater nitrate (NO3") from fertilizers and
soil-based sewage disposal techniques is the primary source of N to salt marshes (Valiela
et al, 1990; Howes et al. 1996). Groundwater flows also contribute a substantial portion
of the anthropogenic N load to coastal embayments (19% in Buzzards Bay,
Massachusetts; Howes and Goehringer, 1996). However, up to 80% of the influent
groundwater N03"may be removed during transit through a salt marsh (Howes et al,
1996). The disappearance of groundwater NO3" results from microbial denitrification, the
anaerobic heterotrophic respiratory pathway in which NO3" is converted to biologically
less available N2 gas. Salt marshes and estuaries therefore may act as buffers against the
transport of potentially eutrophicating groundwater N into coastal waters.
15
Although the term denitrification had already been coined to describe the loss of
N03" to gaseous products, in a landmark 1886 study, Gayon and Dupetit (reviewed in
Zumft, 1992) identified the intermediate species nitric oxide and nitrous oxide in studies
of pure bacterial cultures. Denitrification received early attention because it was
responsible for the loss of fertilizer N applied in agriculture. By the mid-twentieth
century, experiments in natural soils had demonstrated high losses of N in aerated
systems due to coupled nitrification-denitrification (Chapman et ai, 1949; Wijler and
Delwiche, 1954). Direct evidence of denitrification in marine sediments came in 1971
(Goering and Pamatmat, 1971), and the highest marine denitrification rates have been
reported from eutrophic estuarine and coastal sediments (reviewed in: Seitzinger, 1988).
At present, the global oceanic N cycle appears to be unbalanced, with denitrification
losses exceeding gains by 60 - 90% (Christensen et ai, 1987).
The N03" substrate for denitrification is produced in nature from ammonium
(NH4+) by nitrifying bacteria. The obligately aerobic chemoautotrophic oxidation of
NH4+ first produces nitrite (NOV) via an unstable hydroxylamine intermediate. Further
chemoautotrophic oxidation converts NO3" to NO3". Bacterial genera known to nitrify
include Nitrospira, Nitrospina, Nitrobacter, Nitrosovibrio, Nitrosoloba, Nitrosomonas,
Nitrosococcus, and Nitwcoccus (McCaig et ai, 1994; Teske et ai, 1994; Stephen et al,
1996). The abundance of nitrifying bacteria in natural waters and sediments is usually
determined by culturing on specialized media and MPN methods (Matulewich and
Finstein, 1978; Schmidt and Belser, 1982). Densities of nitrifying bacteria determined in
this manner are <3 times lower than total bacterial densities, a figure which appears too
16

low to account for the contribution of nitrification to sediment 02 and N cycling (18%
and 46%, respectively: Chapter 3) (Cheneby et al., 2000). Since these methods only
register obligate NH4+ oxidizers, it is probable that much of the nitrification taking place
in natural environments is mediated by facultative nitrifiers. The advent of 16S rDNA
probes for key genes involved in nitrification has demonstrated the large diversity of
nitrifying bacteria. Nitrification has been found in four Proteobacterial subdivisions (a
through 5) and one new bacterial phylum (Nitrospira) has been created baased on 16S
rRNA sequences (Teste et al, 1994). Analyses of samples from diverse environments
are continually increasing the known diversity of nitrifying bacteria (McCaig et al., 1994;
Teske et al, 1994; Stephen et al, 1996).
Denitrification itself is not really a single metabolic process, but a series of
reductions, each coupled to oxidative phosphorylation in heterotrophic bacteria. The
complete denitrification of NO3" requires four steps (NO3" -> N02" -> NO -> N20 -» N2),
each of which may be active to a greater or lesser degree in different bacterial strains. In
nature, however, the intermediate products tend not to accumulate (reviewed in:
Ferguson, 1994), and the bulk process may be described as the conversion of NO3" to N2
gas. In natural environments, the production of N2 from NO3" likely results from the
action of consortia of denitrifying bacteria capable of carrying out one or more of these
steps. Denitrification is inhibited by oxygen, although the precise mechanism of this
inhibition is not well characterized. Oxygen only appears to inhibit cellular NO3" uptake
and transport and the reduction of N02" to NO (Ferguson, 1994). However, with only
disputable exceptions, all denitrifying bacteria are facultative anaerobes, also capable of
17

aerobic heterotrophy. Denitrifiers are found in nearly all environments, from aquatic
water columns to sediments, terrestrial soils, polluted environments, and within plants
and animals. Although most denitrifiers are mesophilic, two psychrophilic and two
moderately thermophilic strains are known. Although many denitrifiers are halotolerant,
halophiles are found only among the denitrifying Archaebacteria. Denitrifying bacteria
are even more diverse than nitrifying bacteria, and though represented largely by the
eubacteria, also include members of the Archaea (reviewed in Zumft, 1992). A recent
review notes 130 species distributed over 50 genera (Zumft, 1992). Among the
Proteobacteria, the a, ß, and y subclasses are represented, as are Gram-positive bacteria
of the genera Bacillus and Streptomyces (Zumft, 1992; Chenby, 2000). Denitrification is
also known from one species of fungi (although the reactions are not coupled to ATP
production) (Ferguson, 1994). A variety of novel metabolic pathways of N
transformation have recently been investigated in pure culture. Briefly, these include
anaerobic NH4+ oxidation, aerobic denitrification, and nitrifier denitrification, the
production of N2 from NH4+ and N03" (reviewed in Jetten et al., 1997). However, the
ecological and geochemical significance of these pathways is still unknown.
Nitrification and denitrification, though they are adjacent stages in the N cycle,
spatially may occur proximately or separately. Nitrification takes place in aerobic surface
layers of sediments where NH4+ released by mineralization or diffusing from deeper in
the sediments is available (Patrick and Reddy, 1976). Anaerobic conditions within
sediments and soils also make them ideal environments to support denitrification.
Although denitrification is inhibited by 02, it can occur in anaerobic microniches in
otherwise aerobic soils and sediments, allowing close association with nitrifying bacteria
(J0rgensen, 1978; Jenkins and Kemp, 1984; Bonin et ai, 1986). Similarly, O2 released
by the roots of aquatic macrophytes supports coupled nitrification-denitrification in
deeper layers of the sediment (Reddy et ah, 1989). Such spatially coupled nitrification-
denitrification is termed autochthonous denitrification. Based on the diffusion rate of
NO3", Jenkins and Kemp (1984) calculated a distance between nitrifiers and denitrifiers
averaging 80 mm, indicating very tightly associated consortia operating in fine scale
concentration gradients, most likely within labile organic particles (J0rgensen, 1977).
Denitrification which is dependent on NO3" produced elsewhere (by watercolumn
nitrification, advected fertilizer NO3", nitrified wastewater, or other sources) is termed
allochthonous denitrification.
Both allochthonous and autochthonous denitrification are controlled by complex
feedbacks between the availability of substrate (organic carbon) supporting
denitrification and the diffusion of 02, NH4+, and NO3" (reviewed in: Meyer-Reil, 1994;
Paerl and Pinckney, 1996). Thus denitrification is highly dependent on the physical
structure of the sediments, and on the proximity of aerobic and anaerobic environments to
each other (limiting diffusion rates). Although physical factors play a dominant role,
community-specific bacterial physiology may also be important, as the metabolic
capabilities of bacterial consortia may differ from site to site (Cavigelli and Robertson,
2000; Braker et ai, 2001).
The gaseous loss of N2 is one of the most difficult N fluxes to measure, and in
constructing N budgets for natural environments, denitrification has often been calculated
19

by difference between other, more easily measurable terms (reviewed in Seitzinger,
1988). The summing of multiple terms leaves large uncertainties in denitrification rates
calculated in this way. A variety of techniques for measuring or estimating in situ
denitrification rates have been developed over the last 25 years, but of most note are
techniques which can be used in situ or in intact sediments (reviewed in: Seitzinger,
1988;Cornwell^a/., 1999).
Measuring denitrification in salt marsh sediments requires consideration of the
unique features of these sediments. The regularly flooded marsh includes two divergent
environments: the vegetated marsh, usually covered with salt-tolerant grasses like
Spartina spp., and muddy or sandy creekbottoms: narrow channels through the vegetated
marsh which merge to create wider channels and shallow embayments. Denitrification in
unvegetated salt marsh tidal creek sediments is supported by both autochthonous and
allochthonous NOV. The lack of vegetation permits direct measurement of N2 fluxes
from sediments in enclosed flux chambers. N2 flux measurements of denitrification have
been applied in a variety of freshwater and marine sediments (see citations in Chapter 3).
However, because of the high concentration of N2 in the atmosphere, the small fluxes due
to denitrification are difficult to measure (Seitzinger et ai, 1980; Lamontagne and
Valiela, 1995). N2 fluxes can be measured in closed chambers with a Iow-N2 headspace,
but initially, diffusive fluxes from porewater N2 pools in equilibrium with atmospheric N2
dominate over denitrification fluxes. Thus long incubations are required for sediment
"off-gassing" before denitrification can be measured (Seitzinger et ai, 1980; Nowicki,
1994).
20

In some sediments, the depletion of labile organic matter may cause metabolic
rates to slow during long incubations. Another potential limitation of N2 flux
measurements in closed incubation chambers is disturbance of sediment-water diffusion
gradients by changes in the gas headspace N2 concentration (Jury et ah, 1982; Devol,
1987). Changes in the concentration of headspace N2 primarily result from accumulation
of N2 during incubation and from mid-incubation flushing of the headspace, undertaken
to reduce headspace water NH4+ accumulation. In order to optimize protocols for
measuring denitrification N2 flux, I combined experimental observations of N2 flux with
a simulation model of N2 diffusion in order to minimize incubation times and
disturbances of diffusion gradients. Sensitivity analysis revealed the key parameters
affecting the accuracy of denitrification measurements made by the N2 flux approach, and
using the model, a general approach to optimizing the protocol for different sediments
was developed (Chapter 2).
Although the importance of denitrification to the salt marsh N cycle is well
established (Valiela and Teal, 1979; White and Howes, 1994a), denitrification also
affects the cycling of C and 02. Sediment nitrification is dependent on NH4+ regenerated
through the heterotrophic degradation of organic matter and on the diffusion rate of 02
into the sediments. Denitrification requires labile organic matter for its own
heterotrophic requirements; in addition, the anaerobic niches required to support
denitrification are created through heterotrophic 02 consumption. I investigated the links
between the C, O, and N cycles in an unvegetated salt marsh tidal creek by
simultaneously measuring fluxes of 02, C02, and inorganic N species across the sediment
21

water interface in closed flux chambers over seasonal cycles. I studied the influence of
sediment organic matter content and composition on metabolic rates in two sediment
types, and determined the contribution of denitrification to the overall cycling of C, O,
and N, in these salt marsh creek sediments (Chapter 3).
Nitrogen cycling in the vegetated marsh is structured by plant-sediment
interactions, and large fluxes of nitrogen are internally recycled (White and Howes
1994a). NH4+ is released in the sediments by biomass degradation, making it available
for re-uptake by plants. However, coupled nitrification-denitrification competes with
plants for available NH4+. The partitioning of NH4
+ between plants and nitrifying
bacteria is controlled by complex feedbacks involving the oxidation state of the sediment
and NH4+ availability.
Much of the productivity of the marshes along the Atlantic coast of North
America is due to Spartina alterniflora Loisel, but the growth of this grass is limited by
N availability (Turner, 1976; Sullivan and Daiber, 1974; Valiela and Teal, 1974). In the
low marsh, short-form Spartina rarely grows above 10 - 30 cm, but near the creekbanks,
the tall form grows to 1 - 3 m (Howes et al, 1986). In the short-form Spartina swards
away from the creekbanks, poor drainage of tidal water results in more reducing sediment
conditions and the accumulation of S"2, which limits plant N uptake rates (Morris and
Dacey, 1984). Along creekbanks, porewater drainage is improved, resulting in air entry
into the sediments. The flux of air in and out of the sediments leads to more oxidizing
conditions, low sulfide (S2) levels, and increased ability of plants to incorporate N
(Howes etal., 1986; Howes and Goehringer, 1994). The limitation of Spartina growth
22
by N availability can be over come by fertilization. Increased plant growth increases
evapotranspiration, which results in air entry into the sediments, increased sediment
oxidation, and further increases in plant growth in a positive feedback cycle.
The dependence of N cycling in vegetated salt marsh sediments on tidal cycles
and plant/sediment interactions makes it desirable to study these processes in situ. 15N
tracers have previously been used to study the remineralization of NH4+ from plant
biomass and the long-term retention of 15N in salt marsh sediments (White and Howes,
1994a, 1994b). In this study, I developed techniques using in situ injections of 15NH4+ to
examine short-term competition between plant N incorporation and nitrification-
denitrification for remineralized NtLf1". The partitioning of NH4+ between plants and
nitrifiers was studied under conditions where plant N uptake was stimulated by N
fertilization, and inhibited by reducing conditions in the sediment created by
experimental flooding of hydrologically-controlled lysimeters (Chapter 4).
Linkages between denitrification and other salt marsh biogeochemical processes
can be studied by adaptations of methods used to study denitrification in aquatic
sediments. Denitrification in the salt marsh takes place within the context of linked
biogeochemical fluxes of C, O, and N, and is structured by physical processes and the N
metabolism of salt marsh primary producers. Knowledge of the interaction of
denitrification with other salt marsh processes will increase our understanding of the
unique role of salt marshes as intermediaries in the flux of nutrients from terrestrial to
coastal environments.
23
CHAPTER 2
Evaluation of the N2 Flux Approach for Measuring Sediment Denitrification
24

Abstract
N2 production in aquatic ecosystems has been used as a direct measure of
denitrification which avoids many of the artifacts and complexities associated with
indirect approaches and tracer techniques. A variety of approaches for measuring
sediment denitrification by N2 gas flux are currently being applied. However,
measurement protocols are typically determined based upon initial results or previous
studies. I present a process level study and general model for evaluating and optimizing
N2 gas flux approaches in closed chamber incubations. Experimental manipulations of
artificial and natural sediments were used to conduct a sensitivity analysis of key design
parameters in N2 flux measurements. Results indicated that the lowering of N2
concentrations within the headspace overlying sediments to increase measurement
sensitivity requires incubations of several days to weeks for diffusive off-gassing of
porewater N2 pools before the denitrification supported N2 flux can be measured.
However long incubations can result in underestimates of denitrification in some systems,
due to a depletion of labile organic matter. Sediment thickness was found to be the
primary determinant of off-gassing time. Attempts to increase measurement sensitivity
and shorten incubation times by reducing the headspace thickness to 1 - 2 cm were found
to result in underestimates of denitrification by 3 - 13% for gas headspaces to nearly 80%
for water headspaces, but errors were negligible with thicknesses above 10 cm (gas) or 15
cm (water). Accumulation of dissolved inorganic N in the overlying water during
incubation was not sufficiently reduced by periodic flushing to affect denitrification rates,
but caused transient sharp fluctuations in N? flux. Parallel incubations of cores with
25
aerobic and anaerobic headspaces have also been attempted to reduce incubation time.
However, faster off-gassing rates in aerobic chambers with active macrofaunal irrigation
made anaerobic chambers poor controls for diffusive fluxes. The best approach found to
minimize incubation time and reduce errors was to select the minimum sediment
thickness necessary to include the entire depth distribution of nitrification-denitrification
for a particular sediment system. Disturbance of sediment gas profiles by headspace
flushing should be avoided where possible. Gas headspaces should be close to 10 cm
thick, particularly when incubating thick sediment cores. Anaerobic cores to control for
diffusive N2 fluxes shorten incubation time, but should not be used in sediments with
macrofaunal irrigation extending below 6 cm.
Introduction
Denitrification, the microbial reduction of nitrite (N02) and nitrate (N03) to N2
gas, plays an important role in the N cycle as it removes N from pools available to plant
uptake. Accurate measurement of denitrification rates plays an important role in the
construction of N budgets for natural environments, and is essential to understanding the
ecological effects of anthropogenic N enrichment (Valiela and Teal, 1979; Smith, 1999).
Aquatic sediments have emerged as major sites of denitrification activity, accounting for
up to 85% of total global denitrification (Christensen etal, 1987; Schlesinger, 1991;
Middelburg et al., 1996). However, measuring denitrification presents special problems,
since substrates for denitrification are produced and consumed by a variety of microbial
26

processes, and N2 production rates are small relative to background N2 concentrations
(Wijler and Delwiche, 1954; Blackburn, 1979; Seitzinger, 1988).
Denitrification in marine sediments has been inferred from porewater N03~
profiles (Vanderborght and Billen, 1975) and deviations from expected stochiometries of
N and P regeneration (Nixon et al, 1975). However, broad application of denitrification
measurements in ecological and biogeochemical studies of aquatic sediments did not take
place until the adaptation of l5N tracer methods and acetylene block techniques
developed in the soil sciences (Yoshinari and Knowles, 1976; van Kessel, 1977;
S0rensen, 1978). Early work with these techniques was often restricted to the
measurement of sediment denitrification of watercolumn NO3" (allochthonous
denitrification), while studies of denitrification of NO3" produced in situ by nitrification
of regenerated NH4+ (autochthonous denitrification) were under-represented (Jenkins and
Kemp, 1984).
While refinements of the l5N isotope techniques continue to be developed
(Nielsen, 1992), it was the development of techniques for measurement of sediment N2
production that enabled simple and direct measurements of autochthonous denitrification
in intact sediments with inexpensive equipment (Seitzinger et al., 1980; for reviews see
Seitzinger et al, 1993; van Luijn, 1996). Sediment N2 flux measurements are typically
made in intact sediment cores incubated in closed chambers with a low-N2 headspace,
allowing the relatively small denitrification fluxes to be measured against a low-N2
background. In the past decade, N2 flux approaches have been broadly applied (see Table
2.1 for references). Autochthonous denitrification is measured with low NO3" headspace
27

C/D CD
o c
<u
in
CD
>N X)
OO <D
c o cd o
c <ü
CD
E <D
OX) c
CD -a
</3
-a o o ■_
a CD
E 'C a ex. X
W
CN
Js c
u o c u I-
<o oK o
OS
CO
C L»
3 C u
53 <u U
XI
E a
3 CO E
oo
CS •a
U u
w c X) u c .-— E _g *T3
P 00 cs C >,
5 X Cü! cs </> 3 <D
-a CS o <U 3 E s
oo V- 3 c on <s> CO P3 >* CS _C es CO 3 ■o
e+- O ct- c o
co CO U :—
E o
a> o CS D oo
T3 CS < E
o O
ac w c u jr
E c E •*~ t> o a) -a
00
P o es E U '-5 o
T3 O
■S
>n oo ON
o 00
ON o\ r- "
c o r- x oo
g2
CN ON ON m — ON ■ - ON
00 ON
ON ON
§.S
W 00
oo oo
cs ^ pQ cu t- nt uT _-. u- C
.a c
00 00 Ü
X) o u. u es 3 cs
u
-o c es c o o
X) o
60 00
U c c 0) m
■o c es C CS
E E
NO ON ON ON ON ON
•c a
•- •- E 2 oo oo N
-* 3 3
c es
0)
C .2 O -o
CS X)
CS u
.E es — 3
U 00
T3 CS
a) oo u
'S I es 3
■-3 es
TJ- —" — Cl — —
<n ^ i/-i "^
m i — •<t ■* O o o
o2z°S2722» ON
S = o N rt it - "O — ^P — Cl O * in CO Tf
N ^ -*
r-pr^icnioioO^OO 00 — — —• ^t ■*'
Tf >o r~ r~ r- vo NO r-~
OoooqoqoooocNloooooo o6r-^r^r^NO\dr~-NÖ,ONO
3 « 3 i_
XI
1" T tN CN
NO NO
o
£ 2 CS
ON
ON
ON '—* ■<t r ON "~ ON a
<u >> ---.—. XI M M 3 O CJ 4-i
U5
'?'? VD
o o 15 2 £ H
o o o X X) X o o o L* U. Ui
u u O es es CS C C c es es cS
ly-i in i i r~
rn rj-
>n in i -*
■*
r-i CN en
o ON ON
<n in NO
NO
o ^ "*. ^~* —^ ^ NO
NO
CN
«^S 1
oo
p o OO "
oo oo OO
x; >! 3 .H t= •o
■§.a CO
h -o u u o es t-
X E
•a c^ 1J C « ™ "o a
Q
ON ON ON
CT cs
?l "" es d> 11 -a c c 2 a "a
cj 5 2. ^ c «o o -C O ON -c c p ON S
-1 z
u <u u c c c o o o 3 C C
_J o
_; o
ON in
o ö
CJ CS
1- °- PT3 ■> es
3 c jB 1U
n (/: rv|
F. ~^; <
00 3
c o 3
n es X 3 o 3 o
CS X
o 3
CO
3
T3 3 CS
CO 3
u CJ CS n,
CS
CO CO ; ™ U CS ■n CS
o CS X
OU
It: CS
"c > o 3
o o 3 cu 3
CS
00 3 CO
CS oo
O
3 CS
3
ON
E 3 o
a) X) u u 3 CO
_o o
a. CS
D. O o x:
oo CS
3 O
E CS
w X 3
'J5 a. O C) Xl 5J u
NO m
C P CS
x: «j
x: s E u 3
CJ es
J3 CJ X
CO
3 o
CO 3 Xj
en CO
3 U
CS o 1)
E o C/3
3
n o >N CJ h
u E
*CS
O H
3 O
3
a
1^ o a u. C
Xi CS
X 3
1Ü C3 3 cr
00
28

water, while total denitrification (autochthonous + allochthonous) can be measured by
using headspace water containing NO3" near in situ levels. In addition, this method
allows denitrification to be measured simultaneously with other sediment-water fluxes
such as O2, CO2, ammonium (NH4+), and NO3" for integrated investigations of sediment
C, O and N cycling (e.g. Zimmerman and Benner, 1994; Chapter 3). However, the
limitations of the N2 flux method must be understood in order for it to be applied
correctly.
The measurement of N2 fluxes from flooded sediments presents a number of
problems, including: separation of the initial diffusive flux of porewater N2 into a low-N2
headspace from denitrification-derived N2 production, departures of the closed chamber
environment from in situ conditions during incubation, and the inhibition of sediment N2
flux rates by the decline in the concentration gradient across the sediment-water interface
due to headspace N2 accumulation.
Since sediment porewater N2 pools are in near equilibrium with atmospheric N2
concentrations, sediments incubated with a I0W-N2 headspace support an initially large
diffusive N2 efflux from the sediments. This porewater "off-gassing" continues until
initial porewater N2 pools are depleted, whereupon the underlying denitrification fluxes
can be measured (Seitzinger et al., 1980). The period required for sufficient N2 off-
gassing to occur and N2 flux to reflect N2 production by denitrification can vary from 9 -
28 days (Table 2.1), raising the possibility of temporal changes in sediment conditions,
macrofaunal irrigation, or the labile organic matter pool. Although in some coastal
sediments, long core holding times do not appear to result in changes in metabolic rates
29

(Nowicki, 1994), in sediments dependent on continuous inputs of fresh algal biomass
nutrient cycling may decline over the course of long incubations. Also, during long
incubations, headspace water NH4+ and N03" may rise to well above in situ levels.
Potential stimulation of natural rates of nitrification and/or denitrification by elevated
headspace water N03" concentrations can be diminished by frequent replacement of
headspace water. However, this approach also affects the accumulation of N2 required
for measurement of denitrification, and introduces the potential for N2 contamination and
disturbance of sediment N2 profiles. The problems of long incubation times have
recently been addressed by a modification of the N2 flux approach using parallel
incubation of pairs of cores, one with an aerobic and one with an anaerobic headspace.
This approach attempts to provide a control for diffusive porewater N2 off-gassing
through anaerobic suppression of coupled nitrification-denitrification, and significantly
reduces the incubation time required to obtain accurate denitrification rates (Nowicki,
1994) However, potential alteration of macrofaunal irrigation, hence rates of N2 off-
gassing, is of concern.
Simulation models can be used to understand the dynamics of diffusive N2 flux in
closed flux chambers in order to optimize protocols for denitrification rate
determinations. Models of diffusion and denitrification in sediments held in closed flux
chambers differ in important respects from the diagenetic models developed by Berner
(1980) and applied to porewater NH4+ and N03" profiles in marine sediments
(Vanderborght and Billen, 1975; Soetaert et al., 1996). Unlike the steady state, open
systems modeled in the diagenetic equations, N2 concentration profiles in sediment
30

systems in closed flux chambers are not in equilibrium. Organic particle fluxes to the
sediments from the water column may also be ignored. Therefore, in flux chamber
incubation of sediments, a sufficient understanding of N2 fluxes need consider the
production and diffusion of N2 alone. Some workers have modeled diffusive N2 fluxes in
closed chambers in order to put constraints on sediment off-gassing times for specific
systems (Nowicki, 1994; van Luijn, 1996), but a general treatment of the problem as it
relates to shortening incubation times and reducing errors has not been attempted.
Flux models have been developed for field chamber measurements of N2O fluxes
out of soils (Matthias, et al., 1978; Jury et ai, 1982). These models investigated the
inhibition of N2O sediment fluxes by headspace N2O accumulation during incubation,
resulting from the decline in the concentration gradient which drives the N2O emission.
Various mathematical methods were proposed to correct for this underestimation.
However, these models are not directly applicable to closed chamber methods for
measuring denitrification, since field chambers used for N20 flux measurements have no
bottom boundary and no off-gassing flux. In addition, these models used two-
dimensional diffusion equations to describe the diffusion of gas from below the field
chamber, and equations describing diffusional fluxes in unsaturated soils, which differ
from those in submerged sediments.
In the present study, I tested a general model of N? diffusion and production in
closed chambers with low N2-headspaces in order to optimize the key parameters of N2
flux measurement protocols and potentially expand the utility of this method,. I also
experimentally investigated the effects of long incubation times on measured
31

denitrification rates. In my analysis, the importance of minimizing incubation time by
optimizing sediment depth and flux chamber dimensions is emphasized, and the
effectiveness of various methods of determining denitrification N2 fluxes is evaluated.
Methods
Experimental
Experiments were conducted to examine the effects on measured denitrification
rates a) of long incubation times resulting in either lower rates due to depletion of labile
organic matter pools or stimulation due to accumulation of NH4+ in overlying water and
b) measurement protocols relating to selection of headspace volume or matrix (water
and/or gas) or thickness of sediment cores. Denitrification was measured using N2 flux in
closed chambers (N = 2) containing intact sediment cores and using parallel incubations
with aerobic and anaerobic headspaces (Nowicki, 1994). The anaerobic cores acted as
control for diffusive N2 off-gassing as well as potential N2 contamination. Sandy (density
1.22 g cm'3, C content 0.55 mol C em"3) and muddy (density 0.39 g cm'3, C content 1.2
mol C cm"') sediments were collected from the unvegetated tidal creek at Mashapaquit
Marsh, Cape Cod, Massachusetts, USA (see Figure 3.1) as described in Chapter 3.
In order to determine the effect of NH4+ accumulation on sediment metabolism
during incubations, sediments from sandy and muddy sites were subjected to treatments
designed to lower NH4+ accumulation. In one experiment in muddy sediments,
headspace water was replaced daily with fresh half-strength seawater and the
32
denitrification rate determined from the difference between initial N2 concentration (after
gas and water headspace flushing and core closure) and final concentration (just before
the next headspace flush). Controls received the same treatment except that after
flushing, the original headspace water was replaced. All water was removed and
replaced under an Ar atmosphere. A second experiment was conducted where NH4+
concentrations were reduced, but without introducing the potential for N2 contamination
or disturbance of sediments. Mesh bags of zeolite pellets (6 mesh) were suspended in the
headspace water of flux chambers to adsorb dissolved NH4+, while control chambers
contained bags of polyethylene disks. Headspace water was not flushed for either
treatment. NH4"1" concentration in the headspace water was determined on samples
collected through the valved port and analyzed immediately for NH4+ by a colorimetric
indophenol method (Scheiner, 1976).
In order to evaluate the distribution of denitrification with depth in the sediment,
denitrification rates were measured using cores of four thicknesses (0 - 2, 0 - 4, 0 - 6, 0 -
10 cm. Sediments were collected from the sandy site, with 4 chambers established for
each sediment thickness (2 aerobic and 2 anaerobic, as above).
For all experiments, sediments (8 - 12 cm thick) were collected in glass cylinders
(8.8 cm dia. x 25 cm). Overlying water was replaced with 7-10 cm of half-strength
filtered (0.45 [im) seawater, leaving a 7 - 10 cm gas headspace. A magnetic stir bar in a
cage (60 rpm) was fitted into the cylinder at the gas-water interface. The top and bottom
33

Gas *=^=*
^
f4Siy«^'*B«*J5-:Vi 38Ki'!>--f'"flSVffWr-:
Water i>.:«S
FS^JS*35S>*!
■V*' •'*&!
Sampling Port
PVC Plate Stopper
Stir Bar
Figure 2.1 Diagram of chamber for measuring N2 flux from sediments. Sediments are collected and incubated in a glass core tube (8.8 cm) with a headspace consisting equally of gas and water phases. Gas samples are witdrawn through the top butyl stopper and water samples through the valved sampling port.
34
of the flux chamber were sealed with two butyl stoppers compressed onto the chamber by
a press (Figure 2.1). The top stopper was fitted with a valved port for sampling
headspace water. Each flux chamber was held completely immersed in a water bath (at
field temperatures) to minimize diffusion of atmospheric gas into the chamber. The
valved port and tubing were kept filled with headspace water to further minimize
contamination by atmospheric gas.
Four replicate chambers were established for each sediment site, with 2 each
incubated with an aerobic or anaerobic headspace. The gas phase of the flux chamber
was flushed for 30 minutes at 1 L min"1 with either a mixture of 80% He/20% O2
(aerobic) or 100% He (anaerobic). The flush gas was introduced through the valved port
and bubbled through the headspace water, then vented through a flowmeter and water
trap. After 30 min, each cylinder was pressurized to 1.3 atm using a low-pressure
regulator attached to the gas cylinder. This overpressure allowed gas samples to be
withdrawn and compensated for pressure losses from O2 consumption and DIC
production.
Before each headspace gas measurement the pressure of each chamber's
headspace was measured with a electronic pressure gauge (Cole-Parmer). Gas samples
(5 mL) were then withdrawn using a He flushed gas-tight locking syringe with a non-
coring septum needle. Gas samples were analyzed for N2 using a Shimadzu GC-14A gas
Chromatograph equipped with a thermal conductivity detector and calibrated with a
certified N2 standard (3%) (O2 was measured similarly). Measurements were made daily
35

for the first week; and less frequently during the second week. At the end of the
experiment the volume of the gas and water headspaces were measured.
Calculations
Sediment denitrification rates were calculated using Equations 2.1 - 2.6 (Table
2.2). Sediment N2 flux was calculated from the change in total headspace mass over time
(Equation 2.1). Gas concentration measurements (C, as % gas composition by volume)
were converted to masses using the ideal gas law, and the measured pressure (P,),
temperature (T) and volume (V) of the gas headspace. The cumulative headspace N2
mass produced was calculated using Equation 2.2, by summing the N2 mass present in the
headspace at timepoint i, the cumulative mass withdrawn for sampling up to the last
sampling period (WM), and the cumulative mass lost via leaks to the atmosphere (L,).
Since the headspace water and gas phases were well mixed, they were assumed to be in
equilibrium, and since dissolved N2 accounted for <1% of total N2, only the gas portion
was considered. W, was calculated using Equation 2.3, and L, was calculated by
Equation 2.4 using the difference between the expected headspace pressure and P,.
During incubation of aerobic cores, significant 02 uptake occurs due to aerobic
respiration and oxidation of reduced end products of metabolism. Although equivalent
amounts of C02 are released from the sediments, much of the C02 remains dissolved in
the headspace water, resulting in a net drop in headspace gas pressure. The expected
pressure is calculated by Equation 2.5 from the net changes in the partial pressures of 02
and C02. Flux rates across the sediment/water interface were calculated from regressions
of the linear parts of the curve of mass over time, using 3-5 timepoints and expressed as
36

Table 2.2. N2 flux calculations and symbols
Equations:
F- A" a PVC
RT ' '
y SfP,Ct
^=X(/(o/-/,i) r=0
v(c,. + c,_,) 2RT
Sv? ;=0
(<;•)/ V \"(O2)0 "(02)ij \"(CO2)0 "(C02)/J
F„ = F - F. o a
(2.1)
(2.2)
(2.3)
(2.4)
(2.5)
(2.6)
Symbols:
Symbol Description Units
A area of core C concentration of N2 in headspace Fd denitrification N2 flux from sediments Fa N2 flux (anaerobic) F„ N2 flux (aerobic) / timepoint (numbered sequentially from 0) L cumulative N2 lost through leaks TV N2 mass in headspace P pressure of headspace P(e) expected pressure calculated from known losses P(co,) partial pressure of C02 in headspace
P(0i) partial pressure of 02 in headspace
R gas constant S total volume of gas withdrawn for assay T temperature t time V total volume of gas phase of headspace W cumulative N? mass withdrawn in gas sampling
m mLmL" mmol N m"2 d"1
mmol N m"2 d"1
9 1
mmol N m" d"
mmolN mmol N atm atm atm
atm ■7
atm cm mmol" °K 3 cm
°K d cm3
mmolN
37
,-2 j-1 mmol m- d" (Nowicki, 1994). Corrections for the diffusion of porewater N2 into the
low-N2 headspace were made by subtraction of the N2 fluxes in chambers where coupled
nitrification-denitrification was anaerobically inhibited (Equation 2.6).
Modeling Diffusion-Driven N2 Fluxes
A model was developed to allow optimization of experimental protocols to
minimize the incubation time needed to accommodate sediment off-gassing and minimize
declines in sediment N2 efflux resulting from N2 accumulation in the chamber headspace
during incubation. The model is based on a simplified version of the general diagenetic
equation (Berner, 1980), considering only the diffusion and reaction terms in one
dimension:
St " ÖT D.. — + R (2.7)
where C is the concentration of N2, t is time, Da is the apparent diffusion coefficient (see
below), z is the depth in the sediment, and R is the N2 production term.
The sediment was divided into 1 cm layers with an overlying headspace layer and
hClht for the bottom and top boundaries boundary was set to 0. Sensitivity analysis
showed that finer division of the sediment column had no effect on modeled rates. Based
on experimental evidence, N2 production from denitrification was assigned to the top 2
cm of sediment alone (see below). No denitrification was ascribed to the filter-sterilized
(0.22 u.m) headspace water. Since the stirred headspace water and gas phases were in
equilibrium, and the mass of dissolved gas in the headspace water phase was very small
38

(<1%) relative to the gas phase, the model functions as if the gas phase is directly over
the sediments, with N2 diffusing across the sediment-gas interface according the
concentration gradient calculated from the Bunsen coefficient (Weiss, 1970).
The model was calibrated with data from experimental measurements of diffusive
N2 flux from anaerobic sediments and combusted mineral sand. All terms were explicit
(temperature, salinity, porosity, and thickness of sediment and headspace gas). The
initial concentration of N2 in the porewater was determined from the equilibrium
concentration of N2 in the headspace gas of anaerobic (no denitrification) chambers,
divided by the water content of the sediment (porosity). The model was coded for
numerical simulation of the timecourse of incubation (Appendix 1), with a time step of
one minute (chosen after sensitivity analysis). The apparent diffusion coefficient (Da)
was then adjusted to fit the observations of N2 flux. Da was considered to be a composite
of a number of terms, including diffusion, porosity, tortuosity, and advection by
headspace water flow.
After calibration, the model was run under conditions of varying sediment
thickness and porosity, and gas headspace thicknesses. Since the results of the model are
independent of the area of the sediments incubated, the term "headspace thickness" is
used to describe the one-dimensional component of headspace volume independent of the
core area. Although the specific results of these runs are dependent on the value of Da
used, the experimentally determined value (0.00012 cm s" ) was used for all model runs.
The results were weakly dependent on temperature and salinity, since these parameters
only apply to calculation of the Bunsen coefficient, and therefore the initial concentration
39

of porewater N2. Temperature was held at 20°C, and salinity at 32 ppt for all model runs.
For all simulations, the model was first allowed to come to steady state with an infinite
headspace at atmospheric N2 concentrations to calculate the initial sediment N2
concentration. Since most investigators replace the headspace gas and water after the
initial off-gassing incubation, and in order to separate off-gassing effects on measured
rates from subsequent effects, model runs examining measurement incubations on
previously off-gassed sediments were started with sediment N2 pools set at equilibrium
with a 0.01 atm N2 headspace.
Results
In sediments without denitrification (anaerobic), N2 efflux into a low-N2
headspace was initially high, as a result of the large N2 concentration gradient between
sediment and headspace (Figure 2.2a). As the sediment N2 pool is depleted, diffusion
slows until equilibrium is attained. In sediments with denitrification (aerobic), after the
initial period of rapid N2 off-gassing, the continuous input of N2 from denitrification
maintains a flux out of the sediment (Figure 2.2a). Accurate denitrification rates could be
calculated after a 3 day incubation by subtracting the N2 off-gassing flux in anaerobic
chambers from the N2 fluxes in aerobic chambers (Figure 2.2b).
40

<r .&-
„. ,,□—~A_ -n
^o-
-S-
— B— Saltmarsh creek sediment (aerobic) • O ■• Saltmarsh creek sediment (anaerobic) —A— Combusted sand
b)
o E E^ x
H—
CO co
0
10
8
6
4
2 f-
0
10 15 20
\ —
\
\ « , x —
\ \
Aerobic Anaerobic Difference (aerobic - anaerobic) Actual denitrification rate
0 5 10 15
Time since closure (days)
20
Figure 2.2 N2 fluxes from sediments incubated in flux chambers (leak-corrected) and verification of N2 flux model and paired aerobic/anaerobic chamber calculations of denitrification rates, a) N2 flux into low-Na headspace from combusted (carbon-free) mineral sand, and saltmarsh creek sediment incubated aerobically and anaerobically (points). Model results are plotted as lines. All inputs to model are measured
parameters except the diffusion coefficient, which was selected to fit curve to points. N2 effluxes from anaerobic sediment and combusted sand are due to diffusion from sediment pools alone, excess (> 100%) evolution of N2 from aerobic sediment is due to denitrification of nitrate generated in situ by nitrification of mineralized N. b) Calculation of denitrification as the difference between N2 fluxes in aerobic versus anaerobic incubations. Modeled N2 flux plotted as lines; points represent flux calculated from experimental data.
41

Effect of Incubation Time
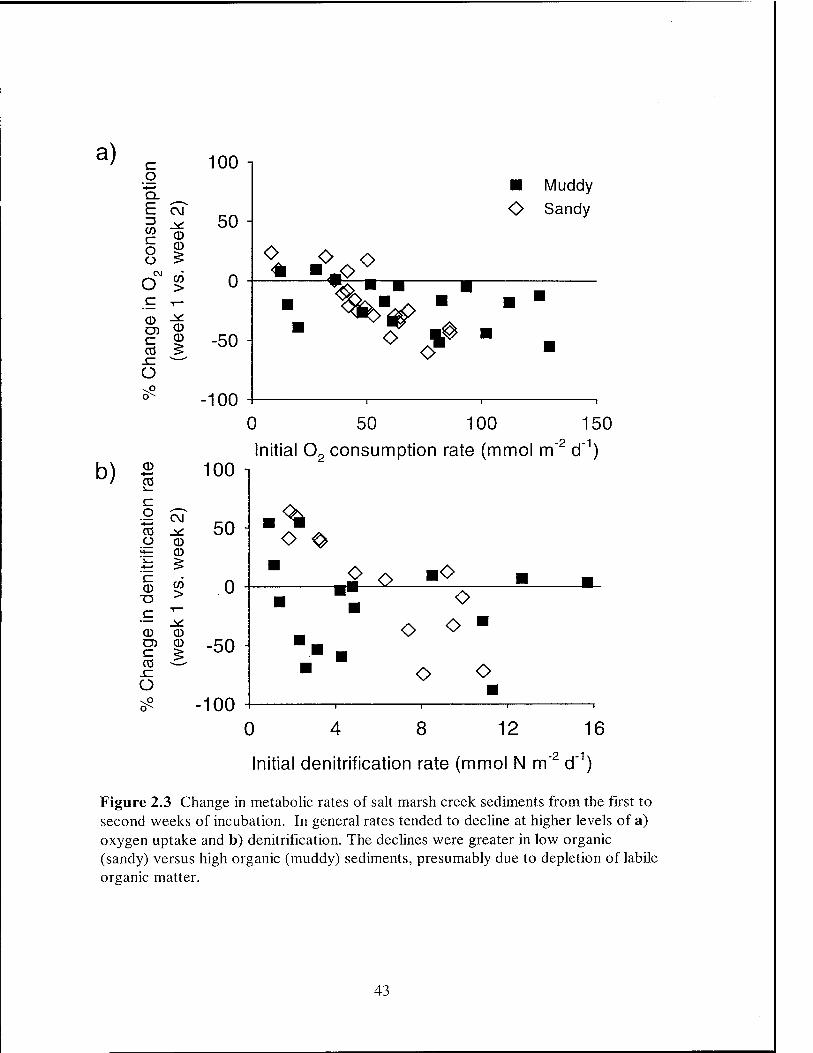
Rates of 02 consumption and denitrification in the salt marsh creek sediments of
this study in most cases declined during incubation times of 2 weeks (Figure 2.3). In
metabolically active sediments with high 02 consumption rates (mean 58 mmol m"2 d"1),
the 02 consumption rate in the second week of incubation changed by +24% to -60%
from the rate observed during the first week after collection (Figure 2.3a). On average,
02 consumption fell by 19% from week 1 to week 2 (t-test, N = 39; p < 0.001). The
relationship between changes in 02 consumption and the initial rate was most pronounced
for sandy sediments (r = -0.82, N = 21; p < 0.001) versus muddy sediments (r = -0.43, N
= 18; p = 0.075). Similarly, denitrification rates also tended to decline from week 1 to
week 2 of incubation in sandy and muddy sediments with high denitrification rates,
although the response was highly variable (Figure 2.3b). Denitrification in muddy
sediments fell by an average of 14%, although the change was not significant (t-test, N =
16; p = 0.09). In sandy sediments, denitrification fell by up to 88% when denitrification
rates were high (r = -0.82, N = 13; p < 0.001), but appeared to increase in sediments with
low initial denitrification rates.
Sediment Thickness and Ammonium Accumulation
No significant relationship was found between incubated sediment thickness (2, 4,
6, or 10 cm) and sediment carbon-adjusted 02 consumption (linear regression, r = 0.004,
N = 8). Likewise denitrification was poorly correlated with sediment thickness (linear
regression, r2 = 0.28, N = 8), indicating that both 02 consumption and denitrification in
these sandy sediments were active predominately in the top 2 cm of the sediment.
42
a)
b)
£= O
-1—»
Q. E CM =3 CO £Z O Ü
0
o CO >
c T-
o> ^ m <i) r~ (D CO £ sz O ^o
100
50
-50
-100
O Muddy
Sandy
o f>
0 50 100 150
CD -|—i
01 s_
C o CM cd _i£ o 0)
H— a> 5
CD "O >
c i—
._— Jsi CD CD Ü) CD c ^ CO _c Ü ^o
100 i
50 -
Initial 02 consumption rate (mmol m"2 d"1)
o ^ ■ o o ■o ■ ■ ■
■
o o o ■
o o ■
0
-50
•100 0 4 8 12 16
Initial denitrification rate (mmol N m"2 d"1)
Figure 2.3 Change in metabolic rates of salt marsh creek sediments from the first to second weeks of incubation. In general rates tended to decline at higher levels of a) oxygen uptake and b) denitrification. The declines were greater in low organic (sandy) versus high organic (muddy) sediments, presumably due to depletion of labile organic matter.
43

Reducing NH4+ accumulation by either daily changes of headspace water or
adsorption with zeolite had no discernable effect on rates of denitrification or 02
consumption. Daily flushing reduced NH4+ concentrations nearly 5-fold, from a mean of
260 to 58 (J.M, compared to the in situ porewater concentration of 6 |iM (Table 2.3).
However, denitrification and 02 consumption rates did not significantly differ between
the treatments (2-tailed t test, p > 0.18). Similarly, the zeolite treatment reduced NH4+
concentrations by 3-fold, from 440 \M to 140-170 \M, but again there was no significant
difference in either 02 consumption or denitrification rates (2-tailed t test, p > 0.18).
Discussion
Placing a low N2 atmosphere over sediments to increase the detection of N2 efflux
for determination of denitrification rates necessitates long incubation times to allow off-
gassing of the sediment N2 pool. However, a simple model can be used to adjust
measurement protocols to optimize the key parameters of sediment thickness and
headspace gas thickness.
Model Verification
The simulation model was successfully used to model diffusive fluxes in estuarine
sediments and combusted sand (Figure 2.2a). The model accurately represented the high
initial N2 efflux in both aerobic and anaerobic chambers based upon a slowing of
diffusion due to the declining concentration gradient within the sediment as the porewater
N2 pool off-gasses. The apparent diffusion coefficient (Da) was calculated by a fit of the
44

Table 2.3. Effects of two experimental manipulations of headspace NH4+ concentrations
on sediment metabolism. Values are mean ± SE (N = 2).
Experiment A NH4+ Denitrificationa O2 consumptiona
Headspace water change (fiM) (mmol m'2 d"1) (mmol m"2 d"')
Control (unchanged) 260 (41) 3.4 (1.5) 69 (4)
Flushed daily 58 (7) 3.8 (1.9) 70 (7)
Ratio 4.5 0.9 1.0
Experiment B Zeolite adsorption of NH4+
Control - muddy 440 (10) 2.2 (0.4) 81 (16)
Zeolite - muddy 140 (40) 2.5 (0.1) 84 (4)
Ratio 3.1 0.9 1.0
Control - sandy 440 (70) 1.7 (0.5) 106 (2)
Zeolite - sandy 170 (30) 1.3 (0.8) 100 (36)
Ratio 2.6 1.3 1.1 No significant differences between treatments (2-tailed t test; p > 0.18)
45
model to the data. Although the relative importance of the factors which contribute to Da
(porosity, tortuosity, macrofaunal irrigation) were not determined, for the purposes of this
study, it was only necessary to determine their composite effect on diffusion, and that this
composite Da could be applied consistently to all of the sediment systems in question. D„
was found to be 0.00012 cm2 s'1 for both sandy and muddy sediments (N = 8), and
0.00017 cm2 s"1 for combusted sand (N = 4). The apparent diffusion coefficients were
about 5 times the molecular diffusion coefficient (Broeker and Peng, 1982). Similar
differences between Dcl and molecular diffusion coefficients have been observed by other
researchers in both artificial and marine sediments, and the difference may be due to
advection of headspace water through the sediments by stirring, irregular surface
characteristics, and variations in effective sediment porosity (Boynton, 1981; Giiss,
1998). The higher D« in the artificial sediment may be due to the absence of the layer of
fine organic material at the sediment surface found in sandy and muddy sediments which
would have facilitated advection of headspace water through the sediments.
N2 fluxes in both the aerobic and anaerobic cores could be modeled using the
same Du, indicating a minor role for macrofaunal irrigation in these aerobic sediments.
Macrofauna in these sediments were primarily amphipods known to irrigate only the top
1 cm of sediment (George Hampson, pers. coram.). The visual redox discontinuity
(depth of light-colored, oxidized sediment) was -0.5 cm, with oxidized macrofaunal
burrows and tubes extending below this zone were rare (pers. obs.)
46
1
Off-gassing Incubation Times
The long incubations needed to accommodate sediment off-gassing were found to
affect metabolic rates in some sediments, although the effect was variable and depended
on the overall metabolic activity of the sediment at the onset of measurement (Figure
2.3). Although Nowicki (1994) found no change in denitrification rates from days 3-5 to
days 7-11 in shallow bay sediments, Gardner et al. (1987) observed a decline in N2 flux
rates well into the 4th week of incubation in lake sediments. Changes in metabolic rates
of sediments over time could result from the depletion of labile algal organic carbon
pools, which are important contributors to sediments which lie within the euphotic zone
or below unstratified waters. In such sediments, labile organic carbon pools within
sediments held in vitro may become depleted, leaving more recalcitrant carbon pools
with lower metabolic rates. In the present study, the decline in metabolic rates associated
with the higher activity sediments is consistent with this process (Figure 2.3). Higher
initial metabolic rates were also associated with spring and summer incubations (Chapter
3) when labile carbon may play a more important role in sediment metabolism. Thus,
particularly in sediments where algal carbon plays a significant role in sediment
metabolism, minimizing core holding and incubation times may be important in obtaining
accurate denitrification measurements.
Clearly, procedures which reduce the incubation time of metabolic measurements
will help to avoid artifacts and improve accuracy. The N2 efflux simulation model
provides an approach for optimizing protocols specific to a sediment system aimed at
reducing incubation time. The primary factors controlling off-gassing, hence the time
47

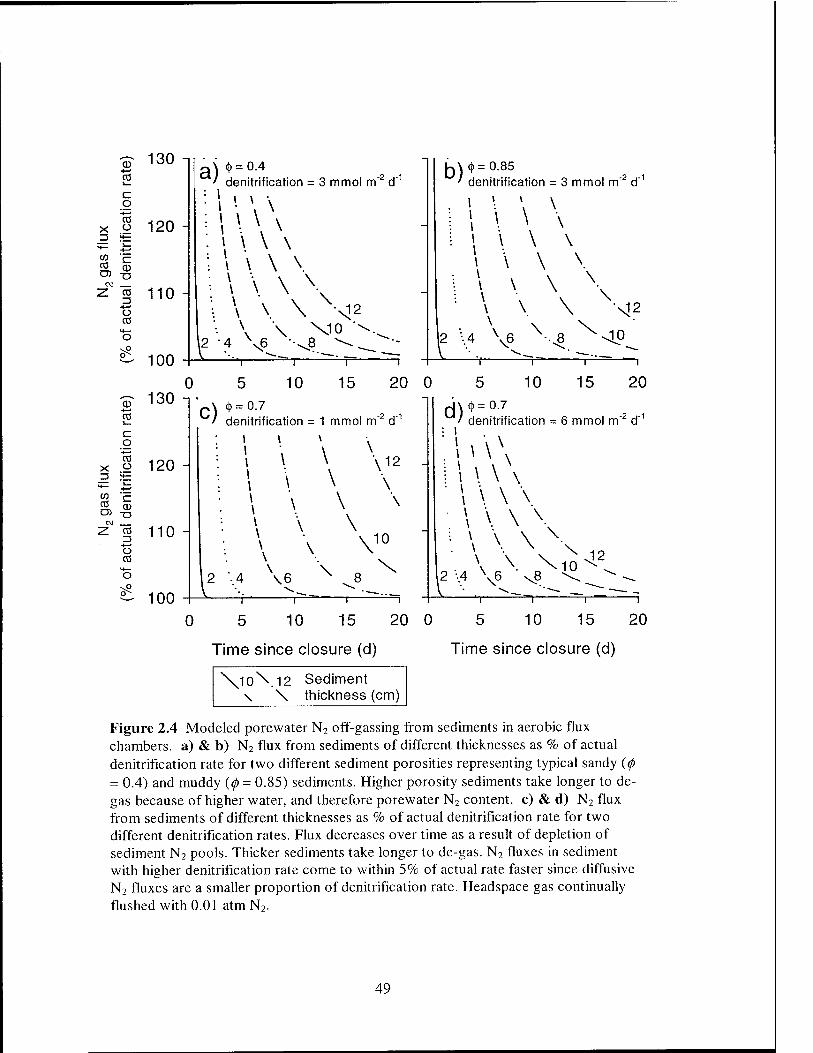
required before denitrification rates can be obtained, are sediment thickness and porosity.
The time required for porewater N2 off-gassing is primarily dependent on the size of the
sediment N2 pool. Thin sediment cores off-gas quickly both because of their low N2
mass and because the diffusion path is shorter. Porosity (0) also affects the time required
for sediment off-gassing since high porosity sediments contain more water and more N2
and therefore take longer to off-gas (Figures 2.4a and 2.4b). For purposes of
denitrification measurement, it is sufficient that the sediment should off-gas to the point
where the diffusive flux is an acceptable percentage of the denitrification flux. For
illustrative purposes, an error in the denitrification rate of ± 5% was chosen. In general,
longer off-gassing incubations are required for accurate measurement of small
denitrification fluxes because the diffusive flux must be allowed to attenuate to a lower
level (Figures 2.4c and 2.4d). A check on the applicability of the model can be made by
comparing modeled off-gassing times with those reported in the literature (see references
in Table 2.1). A typical 5 - 7 cm thick sediment requires a 10 day off-gassing incubation,
similar to the modeled off-gassing times in Figure 2.4.
The paired aerobic/anaerobic flux chamber approach (Nowicki, 1994) was
designed to shorten incubation times by using an anaerobic chamber as a control for
diffusion-driven N2 fluxes. Figure 2.2b illustrates the application of the paired cores to
determining denitrification rates. The "aerobic" and "anaerobic" curves are the first
derivatives (slopes) of the model curves in Figure 2.2a. N2 fluxes calculated by
difference (aerobic flux - anaerobic flux) approach the actual denitrification rate (2.0
mmol N m'1 d"1) faster than the N2 flux out of the aerobic core alone. In this instance,
48
CD
CO
c o To
X .2 3 ;*=
^ •4—'
o CO
3 CO
c: o CO
=3 ;t=
<N CO 13 -*—» o CO
M— o
130
120 -
5 110
100
130
a\ .(. = 0.4 ' denitrification = 3 mmol m"2 d"1
\W\\ ; \ \ \ \
l -. \ \ \10 \
A i^—r^=^ —■ f-, ,
b) <)> = 0.85 denitrification = 3 mmol m"2 d"1
0 5 10 15
c)* = 0-7 20 0
120 -
110 -
100
denitrification = 1 mmol m"2 d"1 d)
15 20
denitrification = 6 mmol m"2 d"1
\ \ \ \ \ \
. \ \ \ \
. \ \ \ \ \
\
2 -4 \ \D \c 8
10 J2
5
=-=-r 0 5 10 15 20 0 5 10 15 20
Time since closure (d) Time since closure (d)
\lo\.12 Sediment \ \ thickness (cm)
Figure 2.4 Modeled porewater N2 off-gassing from sediments in aerobic flux chambers, a) & b) N2 flux from sediments of different thicknesses as % of actual denitrification rate for two different sediment porosities representing typical sandy (<f> - 0.4) and muddy {(f> = 0.85) sediments. Higher porosity sediments take longer to de- gas because of higher water, and therefore porewater N2 content, c) & d) N2 flux from sediments of different thicknesses as % of actual denitrification rate for two different denitrification rates. Flux decreases over time as a result of depletion of sediment N2 pools. Thicker sediments take longer to de-gas. N2 fluxes in sediment with higher denitrification rate come to within 5% of actual rate faster since diffusive N2 fluxes are a smaller proportion of denitrification rate. Headspace gas continually flushed with 0.01 atm N2.
49

paired aerobic/anaerobic cores allowed the calculation of the denitrification rate ~ 5 days
earlier than a single aerobic flux chamber would have allowed.
However, this technique is not free from diffusion-induced errors. Porewater N2
concentrations in denitrifying sediments in the field are out of equilibrium with the
atmosphere due to the excess N2 production of denitrification. At steady state, and with
no consumption of N2 within the sediments, porewater in the entire sediment column will
be enriched in N2 above atmospheric equilibrium levels. With paired flux chambers,
although coupled nitrification-denitrification is stopped in the anaerobic core, this excess
N2 is still present, so that when the aerobic and the anaerobic cores are overlain with a
low-N2 headspace, the N2 flux out of the sediments is initially the same for both cores.
As both sediments off-gas, the N2 flux rates diverge, until the difference between them
approximates the denitrification N2 flux (Figures 2.2 and 2.5). Denitrification N2 fluxes
calculated by difference (aerobic - anaerobic) approach the actual denitrification rate
more rapidly the thinner the sediment core that can be used.
Inhibition ofN2 Efflux by Headspace Accumulation
Another approach to reducing incubation time has been to use very small
headspaces overlying the sediments in order to more rapidly accumulate N2, reducing the
interval required to obtain measurable changes. However, if too small a headspace is
employed, the N2 concentration gradient driving N2 emission is reduced and an
artificially low denitrification rate is measured. This underestimation is a function of the
50
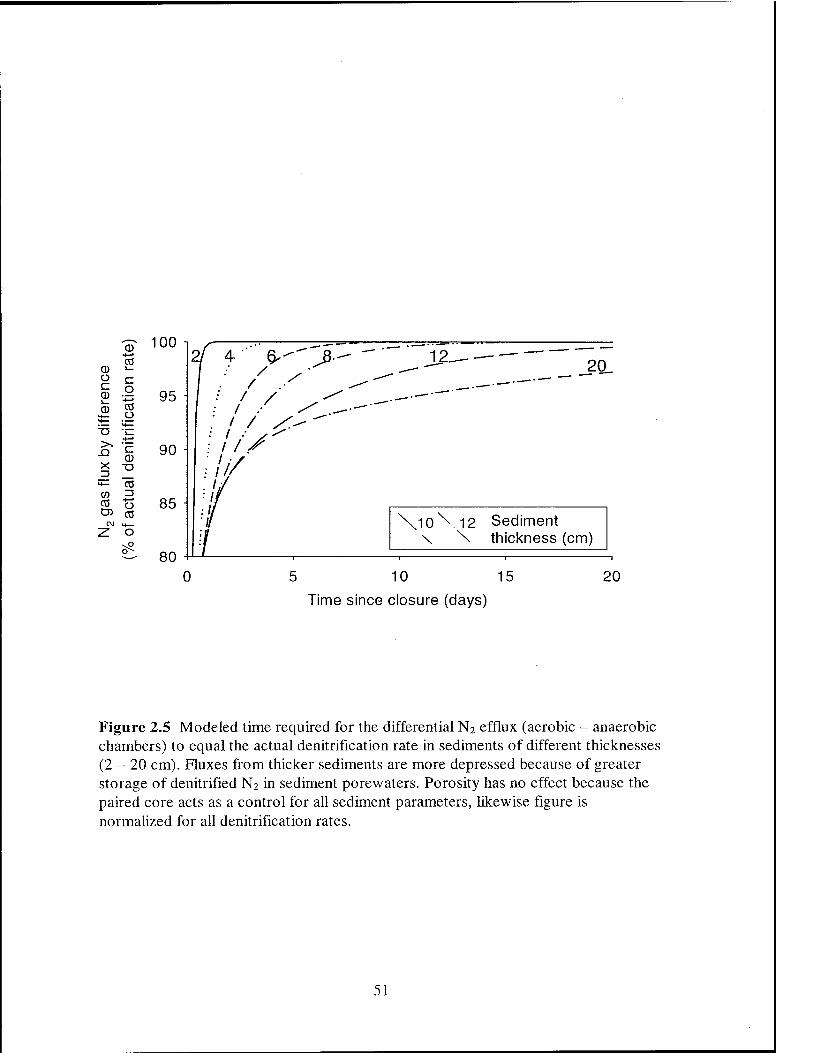
0 •*—• cfl
0 i—
ü r~ 0
o 0 CG
O
T3 V...
>> -Q 0) X TS _}
»4— CO CO 13 CO (1 O) CO
c\j «4—
<L O vO
100
£ 95
90 ■
85
80 0
10X12 Sediment \ \ thickness (cm)
5 10 15
Time since closure (days)
20
Figure 2.5 Modeled time required for the differential N2 efflux (aerobic - anaerobic chambers) to equal the actual denitrification rate in sediments of different thicknesses (2 - 20 cm). Fluxes from thicker sediments are more depressed because of greater storage of denitrified N2 in sediment porewaters. Porosity has no effect because the paired core acts as a control for all sediment parameters, likewise figure is normalized for all denitrification rates.
51

ratio of the headspace volume to the gas storage capacity of the sediments (porosity x
sediment volume) (Figure 2.6).
In typical protocols, after sediment off-gassing, the flux chamber is flushed and
sealed and denitrification can be determined from the accumulation of N2 in the
headspace. As N2 accumulates, and the concentration gradient across the sediment
surface decreases, the excess denitrification N2 which does not escape to the headspace is
stored in the sediment. Underestimation of denitrification is greatest with small
headspaces, since N2 accumulates faster, causing the concentration gradient across the
sediment surface to collapse faster (Figure 2.6). This process is only of concern at very
small headspaces thickness (1 or 2 cm - Table 2.1), while increasing headspace thickness
over 10 cm has no discernable benefit. Because the N2 storage capacity of thin sediments
is low, the underestimation is lowest for thin sediments. In thicker sediments,
denitrification N2 continues to diffuse into deeper layers of the sediment as headspace N2
concentrations increase, further reducing the concentration gradient across the sediment
surface and reducing the N2 flux rate. Higher water content (porosity) of sediments has
the same effect as greater sediment thickness due to greater storage capacity (examples in
Figures 2.6a and 2.6b are for 0= 0.85, illustrating a near maximum underestimation of
denitrification).
Underestimation of denitrification due to artificial lowering of N2 efflux by
headspace N2 accumulation can also occur with the paired aerobic/anaerobic flux
chamber protocol (Figure 2.6b), even though it might be thought that the anaerobic core
flux would control for this effect. However, because N2 production by denitrification in
52
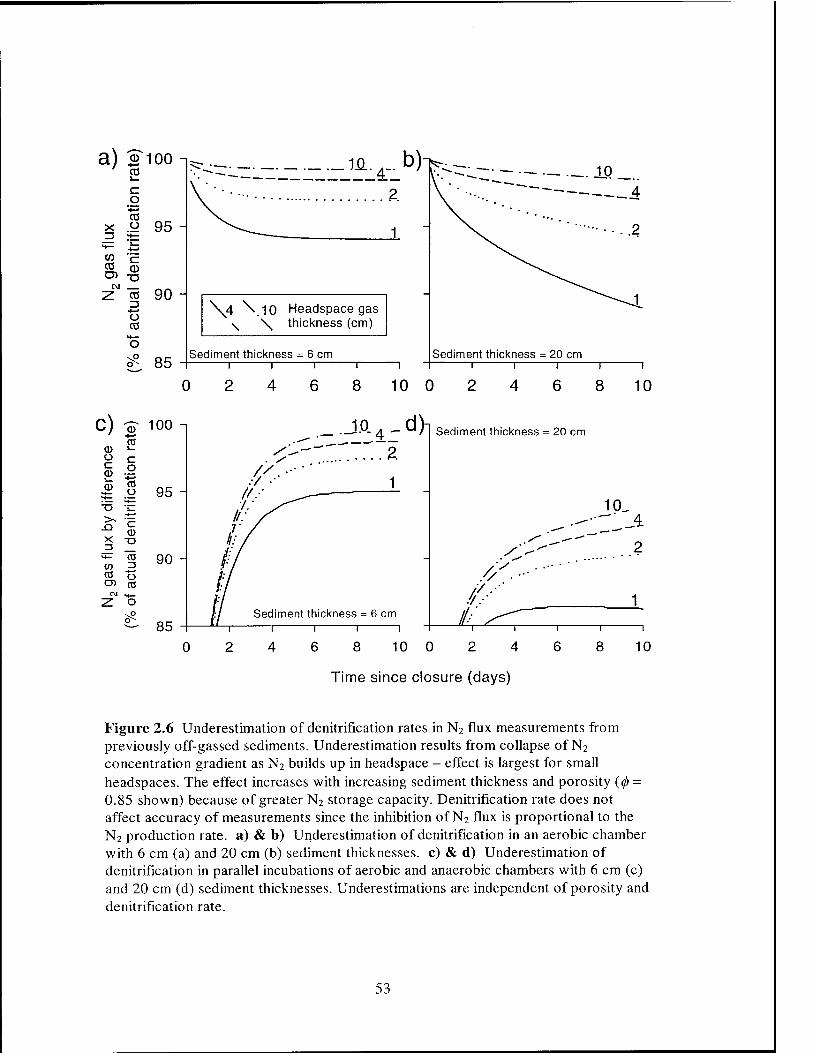
a) & 100 1 CO
o "■♦—»
CO x o 95 13 S=
CM Z co
•4—» o CO
o
90
85
\4 \.10 Headspace gas \ \ thickness (cm'
Sediment thickness = 6 cm —I
0 —V
2
~T"
4
C) ^ CD O !Z CD
CD
CO
c o CO o
T3 -JI
■° ©
J - H— CO
co o CO CO
CM ^_ Z o
100
95
90
85
2
Sediment thickness = 6 cm 1 1 1 1
Sediment thickness = 20 cm
/y V
V
A 10 0 4
10.
6 8
4,
2
10
Time since closure (days)
Figure 2.6 Underestimation of denitrification rates in N2 flux measurements from previously off-gassed sediments. Underestimation results from collapse of N2
concentration gradient as N2 builds up in headspace - effect is largest for small headspaces. The effect increases with increasing sediment thickness and porosity (0- 0.85 shown) because of greater N2 storage capacity. Denitrification rate does not affect accuracy of measurements since the inhibition of N2 flux is proportional to the N2 production rate, a) & b) Underestimation of denitrification in an aerobic chamber with 6 cm (a) and 20 cm (b) sediment thicknesses, c) & d) Underestimation of denitrification in parallel incubations of aerobic and anaerobic chambers with 6 cm (c) and 20 cm (d) sediment thicknesses. Underestimations are independent of porosity and denitrification rate.
53
the aerobic core causes aerobic headspace N2 concentrations to rise faster than anaerobic
headspace N2 concentrations, inhibition of the aerobic flux relative to the anaerobic flux
can occur. As with aerobic chamber fluxes the effect is controlled by the headspace gas
thickness. Thick sediments and thin headspaces lead to the largest underestimations of
denitrification rates (up to 13%) (Figure 2.6d).
Advances in gas Chromatographie techniques have permitted some workers to
measure N2 gas fluxes against an ambient N2 background (Devol, 1991; Devol and
Christensen, 1993; Lamontagne and Valiela, 1995; Nowicki, 1999; see Table 2.1). In
order to be able to make these measurements, a water-only headspace is used, so that
small denitrification fluxes measurably affect headspace N2 concentrations. Measuring
N2 fluxes against an ambient N2 background has the advantage of avoiding the necessity
for sediment off-gassing, and can be employed in the field for in situ measurements.
However, a number of problems have been noted by workers, including large
measurement errors (Lamontagne and Valiela, 1995) and headspace 02 depletion before
significant N2 accumulation occurs (Devol, 1991; Lamontagne and Valiela, 1995;
Nowicki, 1999). In addition, the use of a water-only headspace results in
underestimations of denitrification much more severe than that noted for gas headspaces
(as discussed by Devol and Christensen [1993]) because of the very small capacity for N2
storage in the headspace compared with a gas headspace.
The simulation model can be used to examine the measurement of denitrification
against ambient N2 concentrations in water-only headspaces (Figure 2.7). As with the
gas + water phase incubations, denitrification underestimation is minimized with thick
54
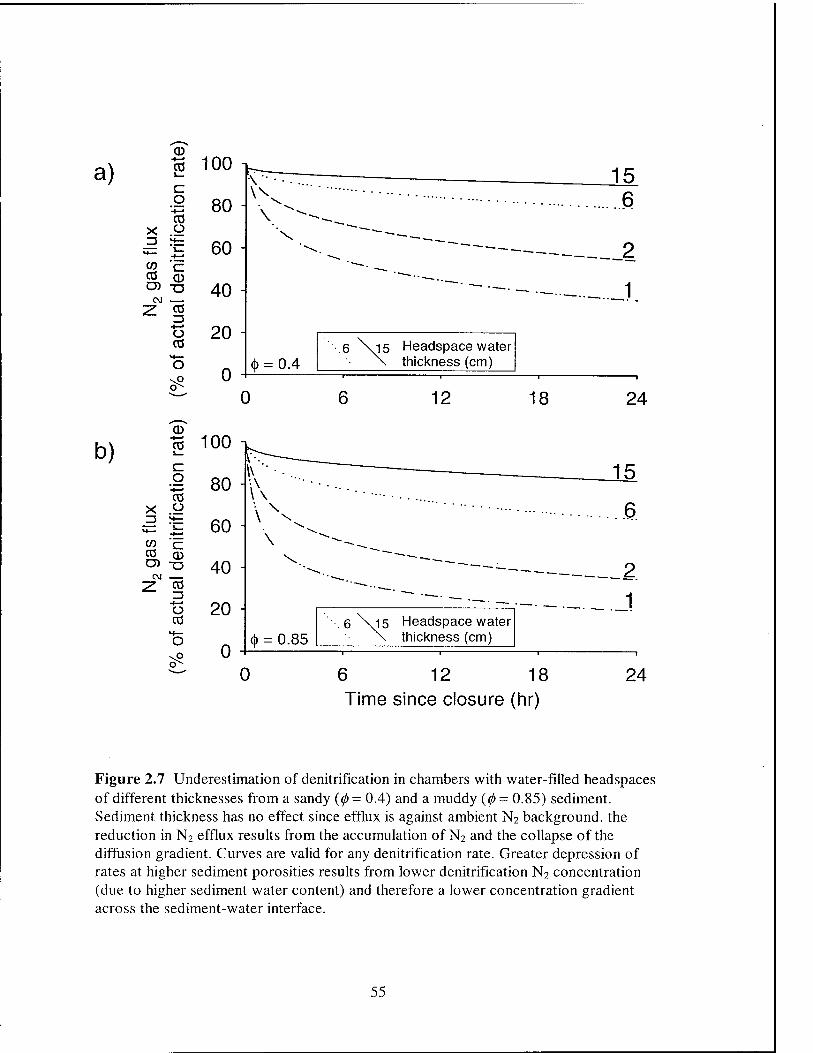
a)
b)
X Z3
to CO
X 13
to CO
CD •4—>
CO v_ C o CO Ü
c CD
CM
Z CO
Ü CO
o
CD
CO
CO o
CD
CM — 7 CO - =3
Ü CO
O
100
£ 80
^5 60
40 -
20
0
100
40
20
0
15 \ ■ • - -...
-~-__
1 w»
- • ■—...
1
<t> = 0.4 -.6 \l5 Headspace water
\ thickness (cm)
0 12 18
■B 80
^ -c 60
24
<|> = 0.85 6 \15 Headspace water
thickness (cm)
2 1
0 6 12 18 Time since closure (hr)
24
Figure 2.7 Underestimation of denitrification in chambers with water-filled headspaces of different thicknesses from a sandy {</> = 0.4) and a muddy (0 = 0.85) sediment. Sediment thickness has no effect since efflux is against ambient N2 background, the reduction in N2 efflux results from the accumulation of N2 and the collapse of the diffusion gradient. Curves are valid for any denitrification rate. Greater depression of rates at higher sediment porosities results from lower denitrification N2 concentration (due to higher sediment water content) and therefore a lower concentration gradient across the sediment-water interface.
55

headspaces, as is the possibility of 02 depletion during the course of the incubation.
However, a larger headspace means that denitrification N2 fluxes are more diluted and
difficult to measure. Porosity also affects the degree of N2 flux inhibition, as noted for
incubations with gas + water headspaces in Figure 2.6, with high porosity sediments
suffering the largest underestimations (up to 80%).
Devol and Christensen (1993) were among the first to recognize this potential
problem and corrected for it by only using the first 3 timepoints - taken over ~4 hours -
in their N2 flux measurements. It appears that they greatly reduced their underestimation
(compared to 24 hr) with this approach, but in muddy sediments with a 4 - 8 cm
headspace (Table 2.1), a 10 - 25% underestimate may still have occurred (Figure 2.7).
The use of a 15 cm headspace results in a 8 - 18% underestimation of denitrification after
24 hours (Lamontagne and Valiela, 1995). Nowicki (1994) noted that measurements
made with in situ water-filled benthic flux chambers at ambient N2 levels were less than
half of parallel measurements made with the paired aerobic/anaerobic flux chambers.
This is consistent with my prediction from the simulation model for a 1 cm water-filled
chamber of an underestimate of 32 - 40% (averaged over 24 hr) (Figure 2.7).
Disturbances ofN2 Flux by Headspace Flushing
Most coastal and shelf sediments have positive NH4+ fluxes (Middelburg et al.,
1996), which result in headspace NH4+ accumulation during chamber incubations, and
potentially stimulate nitrification and denitrification rates (Seitzinger et al., 1993).
Therefore, most investigators flush the headspace water and gas every 1 - 2 days to
restore the water phase to in situ conditions (Chamber closure time, Table 2.1).
56

Typically, this process must be repeated 4 or more times for an accurate estimate of flux
rates. Although frequent flushing of water and gas headspaces restores surface
conditions to near in situ levels, up to twice as many gas concentration measurements
must be made than if chambers are kept closed because an extra initial measurement must
be made in between each flush. However, in the sediments used in the present study,
neither daily headspace flushes nor zeolite reduced NH4+ concentrations to in situ levels
and neither treatment affected sediment metabolism (Table 2.3).
Further, flushing introduces perturbations in the N2 flux rate (Figure 2.8) and the
possibility of contamination of headspace gas by dissolved N2 introduced in the new
headspace water (Nowicki, 1994; van Luijn, 1996). In an example modeled after the
protocols of Seitzinger (1980) and others (Table 2.1), an aerobic core is flushed every
two days (Figure 2.8a). After two days of closed incubation, N2 gas fluxes remain close
to true denitrification fluxes. During this time, N2 accumulates in the headspace and in
the sediments. When the headspace is flushed, a new low- N2 gas phase is established.
The concentration gradient is now increased, and a sharp spike of off-gassing occurs,
followed by a gradual return to pre-flush conditions. As expected, the fluctuation is
greatest in flux chambers with small headspaces, because the accumulation of N2 in the
headspace, and the associated sediment storage, is also greater. Headspace flushing has
the same effect on paired aerobic/anaerobic chamber flux measurements (Figure 2.8b and
2.8c). The spike of sediment off-gassing probably accounts for some of the flux increase
noted by Nowicki (1994) and attributed to atmospheric N2 introduced during headspace
flushing.
57

(1) CO I—
c o 1 ■
05 X O 3 H—
*+— •4—»
CO <r CO 01 O) ~a
CM . S as
3 -•—» O as
~ 120 -,
110 -
\4 \l0 Headspace gas \ \ thickness (cm
Headspace flush
90
~ 110
1 2 3 Time since closure (d)
x 13
C O
V-* CO Ü a 100 -
CM
Z co rj o co
90
80 // Sediment thickness = 20 cm
02468 10 02468 10
Time since closure (d)
Figure 2.8 Modeled gas fluxes during incubation with headspace flush (low N2 gas - arrows). N2 flux spikes result from build-up of N2 in sediment porewaters as a result of inhibition of N2 flux (due to headspace N2 accumulation) prior to flushing a) Aerobic flux chamber. After off-gassing incubation, core is closed from day 0-2, headspace is flushed, and chamber is closed again from day 2 - 4 (as in Seitzinger, 1987 and others). Fluctuations are larger for small headspaces. Sediment storage during closed period is released after headspace flushing because concentration gradient increases when headspace gas is replaced by low-N2 headspace gas. Sediment thickness = 6cm. Compare to Figure 2.6a. b) & c) Denitrification calculated with paired aerobic/anaerobic flux chambers. Chambers are closed from day 0-5, headspace is flushed, and chambers are closed again from day 5 - 10 (as in Nowicki, 1994). Two sediment thicknesses are shown. Compare to Figures 2 4b & 2.4c.
58
During periods of chamber closure, O2 concentrations decline, and with long
closures or small headspaces, metabolic rates my be affected if hypoxic conditions
develop in the chamber. Hypoxia is frequently cited as a problem in incubations with
water-filled headspaces (Devol and Christensen, 1993; Lamontagne and Valiela, 1995;
Nowicki et ah, 1999), but can be avoided with large headspaces and/or shorter incubation
times. Pressure changes resulting from O2 consumption also can significantly affect the
measurement of denitrification fluxes (Equation 2.2). During incubations, 02
consumption is accompanied by CO2 production, but 80% or more of the total C02 pool
may remain in dissolved forms, and headspace pressure falls due to molar gas reduction.
During incubations of salt marsh sediment cores (this study), molar gas reduction ranged
to 0.03 atm d"1, which without correction, results in an overestimation of the
denitrification flux of up to 15% over the course of a 5 day incubation. Since leaks and
sample withdrawals can also change the chamber headspace pressure, accurate
measurements of gas flux necessitate regular measurements of the headspace pressure.
Headspace flushing may not reduce headspace NHU"1" concentrations sufficiently to
affect coupled nitrification-denitrification, but instead may introduce artifacts as a result
of the disturbance of sediment N2 profiles. On the other hand, long periods of chamber
closure raise the possibility of inhibition of N2 flux by headspace accumulation, depletion
of headspace 02, and pressure changes as a result of molar gas reduction. However, these
problems can be overcome by good experimental design, including sufficiently large
headspaces and pressure measurements, and the problems introduced by flushing the
headspace provide little significant benefit to N2 flux protocols.
59
Sediment Thickness and Depth Distribution of Denitrification
Whether aerobic flux chambers or paired aerobic/anaerobic chambers are used to
determine denitrification N2 fluxes, the incubated sediment thickness is the key
experimental parameter that has the greatest effect on off-gassing incubation times and
along with headspace thickness, the inhibition in N2 efflux due to N2 accumulation in the
headspace. Sediment thicknesses should therefore be minimized, but the chosen
sediment thicknesses must reflect the depth distribution of denitrification. Sediment
thicknesses of 2-20 cm have been used by various researchers (Table 2.2), but the depth
distribution of denitrification depends on the penetration of 02 (redox structure of
sediment column) and the availability of organic C. In most sediments, from the deep sea
to the continental shelves, total organic carbon content decreases through the top 10-15
cm of the sediments before becoming constant (Soetaert et al, 1996). Since little further
carbon respiration is taking place, denitrification is typically not significant below this
depth. In estuarine and salt marsh sediments, most C respiration takes place in the upper
2 cm (J0rgensen, 1982; Howes et al, 1985). Thus it is again unlikely that significant
denitrification takes place below 10-15 cm. In many cases, most of the denitrification
appears to be taking place in the top 2-4 cm, where 02 penetration supports nitrification
and beyond which little N03 is found (Henriksen and Kemp, 1988).
In the present study, denitrification and 02 consumption rates in 2 cm cores were
not significantly different from those of thicker cores. Similarly, a model study was done
in which total denitrification was distributed across the top 1 - 8 cm of sediment,
increasing by 1 cm at a time. The best fit was obtained with denitrification distributed
60

within the top 2 cm of sediment (Figure 2.2). Although the minimum thickness of
sediment required for an accurate denitrification measurement likely varies among
sediment systems, in general, the thicknesses typically used (2-7 cm; Table 2.1) may
depth-integrate sediment processes while shortening off-gassing incubation times.
Macrofaunal Irrigation of the Sediments
Calculation of denitrification with parallel incubations of aerobic and anaerobic
chambers assumes that the only difference between N2 flux out of anaerobic and aerobic
cores results from N2 inputs from denitrification. However, in sediments with high
macrofaunal densities, irrigation of the sediments by macrofaunal activity tends to
increase the flux of porewater N2 in aerobic cores above the diffusional flux observed in
anaerobic cores, where macrofauna are killed or inactivated by anoxia. Since the
resulting anaerobic off-gassing correction would then be too small, denitrification rates so
determined would be too large. The result is that incubation times would need to be
increased to allow diffusive fluxes in aerobic and anaerobic chambers to come into
equilibrium. The effects of macrofaunal irrigation can be modeled by increasing the
apparent diffusion coefficient for the aerobic core. A simplified example is shown in
Figure 2.9a, where Da for the aerobic core has been increased by a factor of 1.5. Figure
2.9a should be compared to Figure 2.5, where Da is the same for both the aerobic and the
anaerobic core. In Figure 2.9a, the initial calculated N2 flux (by difference) exceeds the
denitrification rate as predicted. In contrast, in Figure 2.5, the calculated flux begins
lower than the denitrification flux. In thin sediments, the larger Da means that the initial
porewater N2 is quickly exhausted, causing N2 flux rates to rapidly drop below those of
61

a) a) -•-' (T! i_
w r CO n O) ID
u CO —7 1_ O
<S) 0)
03 3 O ;t i_ (11 ■D Ü) c >. Ü CU XI "rS £_ X -i CO 13 O C/> H— cO i=
O
140
120
b)
E £ 100
-.4 ^.6 Sediment ''• N thickness (cm)
c o o *=
T3 CD i_
13 CX CD i_
C g "co XI :3 o c CD
CO ^~.
•d CO
■is
£ CD
CT-
+l ^ ^ C/>
CO CD
CO
o o CO
4 6 8
Time since closure (days)
10
&* *V
&°
10 20 30 40
Enhancement of D. by irrigation (%)
50
Figure 2.9 Modeled macrofaunal irrigation effects on denitrification fluxes calculated with paired aerobic/anaerobic flux chambers, a) N2 flux as a % of denitrification rate after chamber closure for a variety of sediment thicknesses. Irrigation enhancement of porewater N2 flux in aerobic chamber is 1.5 times the anaerobic D„. Compare to Figure 2.5a but note difference in scale, b) Effect of irrigation-enhanced D„ on the preincubation time required for accurate (± 5%) denitrification measurements. Off- gassing incubation times with paired flux chambers can quickly exceed those required for aerobic flux chambers. This figure serves as an example only, since the shape of such a figure is highly depended on factors like porosity, denitrification rate, and diffusion coefficient.
62
the anaerobic core, where diffusion of porewater N2 pools is still taking place. This
effect is transient, and eventually N2 pools in the anaerobic core are exhausted as well,
and the calculated flux returns toward the actual denitrification value. In thicker
sediments with deep macrofaunal irrigation, porewater N2 pools are not quickly
exhausted, even with the higher Da. The calculated flux remains elevated above the
actual level for many days, and may extend the off-gassing incubation time beyond that
required for aerobic flux chambers (Figure 2.9b). The effect of macrofaunal
enhancement of Da varies with the degree of enhancement (Figure 2.9b). Since the
enhancement of Da is not likely to be known, denitrification fluxes calculated with paired
aerobic/anaerobic flux chambers on sediments with deep irrigation (such as by the
presence of large numbers of polychaetes) may not have any advantage in incubation
time over single aerobic chambers.
Optimization ofN2 Flux Protocols
N2 gas flux measurement of denitrification offer a simple yet accurate way to
directly measure denitrification fluxes of N2 from flooded sediments. Artifacts and errors
can be avoided with proper preparation. Although some of the potential errors are small,
the sum of multiple sources of error could become significant. Sediments for N2 flux
measurements should be collected to depths which include all macrofaunal and
respiratory activity. Initially, the extent of macrofaunal irrigation should be investigated.
Cores of representative sediments should be collected in clear-sided core tubes and the
presence of macrofaunal burrows and the depth of the redox discontinuity (visually the
beginning of dark reduced sediment) should be noted. If possible, macrofaunal densities
63
and identification of species can help evaluate the depth and extent of irrigation. The
need to capture all sediment metabolic activity must be balanced against lengthening
incubation times and potential depletion of labile organic matter. The minimum sediment
thickness required to capture all of the denitrification or 02 consumption may be
determined experimentally with incubations of sediments of different thicknesses.
Sediments should be collected in the same chambers they are to be incubated in if the
original porewater and labile C profiles are to be retained.
If macrofaunal activity is determined to be significant at deep levels, aerobic flux
chambers should be used. Measurements can be made until rates are linear, but by then
labile organic pools may have been depleted. Paired aerobic/anaerobic chambers are
preferable if macrofaunal activity is restricted or absent. The chamber design should
have space for adequate headspace thicknesses. A thick water layer prevents NH4+ or
other metabolites from accumulating to high concentrations, and does not interfere with
the gas measurements if adequately stirred. Headspace gas thicknesses should be -10 cm
to prevent accumulation of N2 and inhibition of flux rates, and to provide an adequate
supply of oxygen.
Incubations against ambient N2 concentrations require no off-gassing incubation
but require the greatest measurement sensitivity, whereas incubations against an N2-free
headspace require the longest off-gassing incubation and the least measurement
sensitivity. It is possible to incubate sediments with lowered headspace N2
concentrations, decreasing the off-gassing incubation time, but still retaining adequate
sensitivity.
64

I found that the entire incubation could be done without flushing the headspace.
In my protocol, freshly collected cores are sealed in the chambers with the I0W-N2
headspace, and no measurements made until day 4. By this time, the N2 efflux rates from
both the aerobic and anaerobic sediments could be fit well by a linear regression (Figure
2.2a). However, investigators may want to determine the sensitivity of their systems to
NH4+ accumulation and design appropriate flushing procedures. While most errors can
be reduced by following the above guidelines, finer optimization of particular sediment
systems can be accomplished by modeling (Methods, Appendix 1). Modeling might be
especially important with thick sediments, or sediments with very low rates of N2 flux,
where it may be desirable to reduce the headspace thickness from 10 cm to increase
measurement sensitivity.
The use of paired aerobic/anaerobic flux chambers can significantly shorten off-
gassing incubation times, and therefore reduce the risk of depletion of labile organic
material, and associated changes in metabolic rates. However, the inhibition of
macrofaunal irrigation in anaerobic control cores can contribute an unknown amount of
error to denitrification measurements. The off-gassing incubation time required for
determination of accurate N2 fluxes with either aerobic flux chambers or paired
aerobic/anaerobic chambers is highly dependent on the sediment thickness used, since
thicker sediments require longer to off-gas. Most of the metabolic activity of sediments
may be taking place in the upper 2-4 cm, so minimizing sediment thickness can shorten
off-gassing incubation time. Inhibition of N2 fluxes by headspace N2 accumulation
occurs at small headspace gas thicknesses with either method., but significant
65

underestimations of denitrification (> 3%) only occur at headspace thicknesses of <2 cm,
and with long chamber closure times. N2 flux protocols using water only headspaces at
ambient N2 concentrations are particularly susceptible to underestimation of
denitrification , which may reach 80% in 24 hr with headspaces under 2 cm, but can be
avoided by the used of a 15 cm headspace. Although the results of this study are
generalizable to many sediment types, model studies of particular sediment systems are
required in order to determine the appropriate off-gassing incubations and understand
potential errors.
66

CHAPTER 3
Contribution of denitrification to N, C, and O cycling in sediments
of a New England Salt Marsh
67
Abstract
The metabolism of sediments from a small Cape Cod, USA salt marsh receiving
high nitrate (N03") loads in groundwater (32 mmol N m"2 d"1) was studied in laboratory
microcosms. Simultaneous measurements of the fluxes of 02, C02, N2, and dissolved
inorganic N from both sandy and muddy sediments were made over annual cycles.
Sediment organic C content and quality were the primary controls on metabolic rates,
followed by seasonal effects, including temperature. Although the C content of muddy
sediments was twice that of sandy sediments, the sandy sediment C was twice as labile,
and mean metabolic rates did not differ from muddy sediments (mean 02 consumption =
60 mmol m"2 d"', C02 production = 52 mmol m"2 d"1, and autochthonous denitrification =
5.2 mmol m"2 d"1). The average C02/N flux ratio (6.1), and sediment 813C (-19.4) at both
sites, similar to algal biomass, support a sediment metabolism based primarily on algal
biomass. 46% of the NH4+ remineralized within the sediments was lost to N2 by coupled
nitrification-denitrification. Autochthonous denitrification accounted for 61% of the total
annual denitrification (2.7 mol m"2 y'); the balance was denitrification of watercolumn
N03~. However, the only significant source of N to benthic alga in the saltmarsh
creekbottom was groundwater N03". Total denitrification, therefore gives the true size of
the allochthonous, groundwater N03" - driven denitrification flux.
68
Introduction
Salt marsh primary productivity is limited by the availability of nitrogen (N)
(Sullivan and Daiber, 1974; Valiela and Teal, 1974). N sources to the salt marsh include
tidal water, rain, N fixation, and riverine and groundwater terrestrial inputs (Valiela and
Teal, 1979; Capone and Bautista, 1985). However, in populated areas, terrestrial N
inputs, primarily nitrate (NO3"), dominate salt marsh N budgets as a result of sewage
disposal and agricultural runoff (Sewell, 1982; Valiela et al, 1990; Smith, 1999). Salt
marshes have the capacity to intercept terrestrial N, thereby limiting its availability to
support primary productivity and eutrophication in coastal aquatic environments (Fujita
etal, 1989; Harvey and Odum, 1990; Howes et al, 1996).
A New England, USA salt marsh environment typically consists of intermittently-
flooded vegetated peats of halophilic macrophytes such as Spartina spp. and the usually-
flooded unvegetated sediments of the creeks which drain the marsh and comprise about
one third of its total area (Valiela and Teal, 1979; Howes et al., 1996). Creekbottom
sediments are the primary site of contact with terrestrial nutrient inputs through riverine
and groundwater flows (Weiskel et al., 1996; Howes et al. 1996). Allochthonous NO3"
entering a salt marsh is subject to loss or retention by competing processes. It may be
retained by algal uptake or it can be lost through direct denitrification or export. If it
retained in biomass, then it is subject to losses through burial or export or
remineralization of NH4+. Remineralized NH4
+ can be retained by algal uptake or lost
through nitrification-denitrification to N2.
69
The high productivity of salt marsh creekbottoms, further supported by high N
inputs, results in the accumulation of organic material, most of which forms the basis for
detrital food chains (Teal, 1962; Vince et al., 1981). Anaerobic metabolism (especially
sulfate reduction) plays a dominant role in subtidal sediments (J0rgensen, 1982),
although denitrification is also significant.
I studied the contribution of denitrification to fluxes of N, C, and O in the
sediments of Mashapaquit Marsh, located in West Falmouth, Cape Cod, Massachusetts,
USA, a small (5.7 ha) salt marsh which was the subject of an earlier study using mass
balance and hydrological methods to determine the fate of groundwater N03" inputs
(Figure 3.1; Smith, 1999). Two thirds of the marsh's area consists of vegetated peats of
5. patens and S. altemiflora. The remaining third is occupied by the usually-flooded
sediments of the salt marsh creek. Mashapaquit Marsh receives freshwater flows (via
Mashapaquit Creek and groundwater seepage faces) from a 284 ha watershed of highly
permeable glacial outwash deposits (Smith, 1999). Watershed flows (2.21 x 10⁶ m3 y"1)
are predominantly as groundwater, with 0.21 x 10⁶ m3 y"1 resulting from land disposal of
treated wastewater from a regional wastewater treatment facility. Total N fluxes into the
salt marsh are 32 mmol N m"2 d"1, of which 87% derives from wastewater disposal (64%
from the wastewater treatment facility and 23% from septic wastewater disposal). Smith
(1999) showed that 40 - 50% of the influent N was removed before being exported via
tidal flows, and that creekbottom denitrification of watercolumn N03" accounted for 70%
of this N loss.
70
The purpose of the present study was to determine the contribution of
denitrification to the overall fate of N, C, and 02, within the salt marsh sediments.
Simultaneous measurements were made of the fluxes of O2, CO2, N2, and dissolved
inorganic N species across the sediment-water interface of salt marsh creek sediments
over spatial gradients and seasonal cycles. The source of the organic N supporting
autochthonous denitrification was determined through the analysis of biogeochemical
flux ratios and the isotopic signatures and characteristics of sediments.
Methods
Study Site
Mashapaquit Marsh is a 5.7 ha marsh with tidal exchanges with West Falmouth
Harbor, a shallow embayment of Buzzards Bay, on the west side of Cape Cod,
Massachusetts, USA (Figure 3.1). This creek is flushed by semi-diurnal tides with a mean
range of 1.2 m, with nearly complete drainage during spring tides. Work was focused on
a sandy and a muddy site (sites S & M) at the upper end of the marsh, areas receiving
groundwater N fluxes (Smith, 1999). Two more sites (sites 3 & 4) were sampled on two
summer dates for comparison.
Sediment Mapping
The characteristics of creekbottom sediments were determined on samples (top 2
cm) collected every 5 m along 8 transects across the marsh creek. Known volumes of
sediment were weighed wet, then dried to constant weight at 60 °C to determine porosity
71
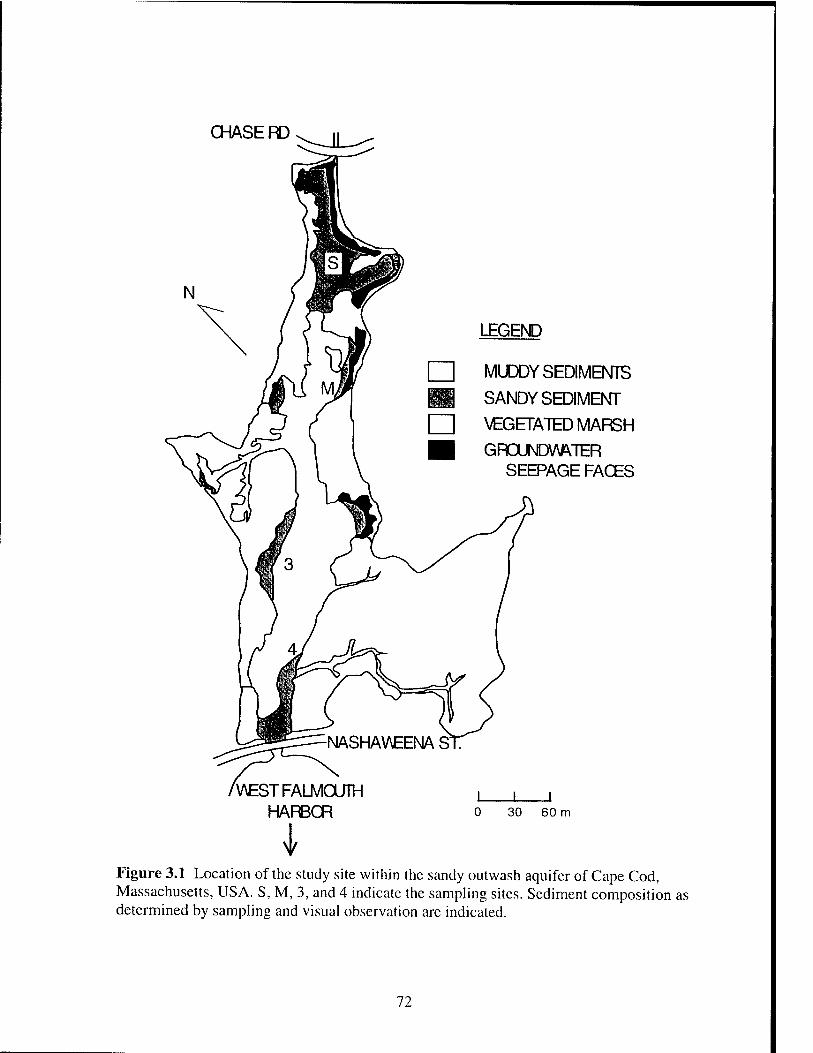
CHASE RD
LEGEND
MUDDY SEDIMENTS
SANDY SEDIMEMT
\€GETA7ED MARSH
GFCUNDWVTER SEEPAGE FACES
MESTFALMOJIH HARBCR
J 30 60 m
\
Figure 3.1 Location of the study site within the sandy outwash aquifer of Cape Cod, Massachusetts, USA. S, M, 3, and 4 indicate the sampling sites. Sediment composition as determined by sampling and visual observation are indicated.
72

and density. Dried samples were ground, and analyzed for particulate organic C and N
on a Perkin-Elmer 2400 elemental analyzer. Sediment carbonate content analysis (see
below) showed that carbonate accounted for < 0.01% of total sediment C.
Sediment Core Collection
Sediment cores were collected to 8-12 cm deep at low tide in glass core tubes (8.8
cm dia.) in shallow water (30 cm) at low tide. The sediments were handled carefully to
avoid disturbance of sediment structure or porewater substrate profiles. Samples were
immediately transported at in situ temperatures and with headspace water aeration to the
laboratory (1 hr).
At time of core collection, surface water and sediment temperature were
measured. Surface water and sediment porewater (at 2 and 10 cm depth) was collected
and filtered (0.45 pirn Millipore) in the field. 15 cc of surface sediment (2 cm depth) were
collected in a dark container for sediment pigment (chl a and pheophytin) determination.
All samples were placed on ice for immediate transport to the laboratory.
Sediment Incubations
Denitrification was measured on intact sediments in closed chambers using an N2
gas flux approach modified from Nowicki (1994) (described in detail in Chapter 2).
Chambers were incubated with N2-free headspace gas to increase sensitivity. Parallel
incubations of anaerobic microcosms(no nitrification) were made to control for diffusion-
driven N2 gas fluxes out of the sediments and introduction of atmospheric N2 into the
chambers. Fluxes of 02, C02, NH4+, and NOx" were measured simultaneously with N2
73
flux. Each measurement was made with 2 aerobic and 2 anaerobic microcosms. The
sediments were overlaid with 8 cm of filtered (0.22 ^m Millipore) half-strength seawater
(mean salinity of Mashapaquit Marsh water). The use of filtered, low-nitrate (< 2 uM)
headspace water allowed the separation of watercolumn from benthic processes. An
externally-driven (60 rpm) magnetic stirbar in a cage was placed at the water-gas
interface. Over the headspace water was a gas headspace of ~ 10 cm, of either 80% He
/20% 02 (aerobic microcosms) or 100% He (anaerobic microcosms) initially at 1.3 atm to
prevent mass fluxes of atmospheric N2 into the microcosms. The whole apparatus was
sealed top and bottom with rubber stoppers held together in a press (Figure 2.1).
On each sampling date, a 5 mL gas sample was withdrawn through the top
stopper with a gas-tight valved syringe. The gas sample was analyzed for 02, CO,, and
N2 with a Shimadzu GC-14A gas Chromatograph. A water sample was withdrawn from
the valved port through a 0.22 mm syringe filter (Dynatech). Water samples were
analyzed for ammonium (NH/), nitrite and nitrate (NOx"), and dissolved C02 (see
below). An equal volume of He-sparged half-strength filtered seawater was reintroduced
through the valved port to restore headspace water volume. The first sample date was on
day four of microcosm closure, to allow initial rapid off-gassing of porewater dissolved
gas pools (Chapter 2). Samples were typically taken for four consecutive days (days 4 -
7), followed by a fifth sample on day 10. Dissolved C02 pools were typically only
measured on days 4, 6, and 10. After the incubation, sediments were sectioned (0-2 cm,
2 - 4 cm, and remainder) for porosity, density, and sediment organic C and N
determination.
74

Measured headspace gas concentrations were converted to masses using the
measured headspace volume and pressure, and corrected for losses due to gas
withdrawals and leaks of atmospheric N2 into the chambers (calculations in Table 2.2).
Leaks were determined from the difference between the measured headspace pressure
and the pressure expected after gas sample withdrawals and molar gas reduction (Loss of
02 and accumulation of dissolved CO2).
02, NH/, and NOx" flux were calculated by a linear regression of their
concentrations over days 4-7. CO2 flux was calculated by a linear regression over the
three points for which both gas and dissolved concentrations were measured.
Denitrification N2 flux was calculated as the difference between linear regressions of N2
flux in the two aerobic cores and in the two anaerobic cores, which controlled for
sediment porewater off-gassing or diffusion of atmospheric N2 into the microcosms. All
other flux measurements were the mean of measurements made on two aerobic cores.
Nitrate uptake: In order to determine the sediment N03" uptake constants and to
compare autochthonous with allochthonous denitrification, cores collected from each of
sites S and M were subjected to two treatments. Half of the cores from each site were
incubated as usual with NOx-free headspace water, while in the other half a solution of
KNO3 was added to bring the headspace water NO3" concentration in both aerobic and
anaerobic microcosms up to ~ 600 |im. N2 flux from denitrification of headspace water
NO3" was calculated by subtracting the denitrification N2 flux in the microcosms
receiving ambient headspace water from the total N2 flux in the aerobic microcosms
75
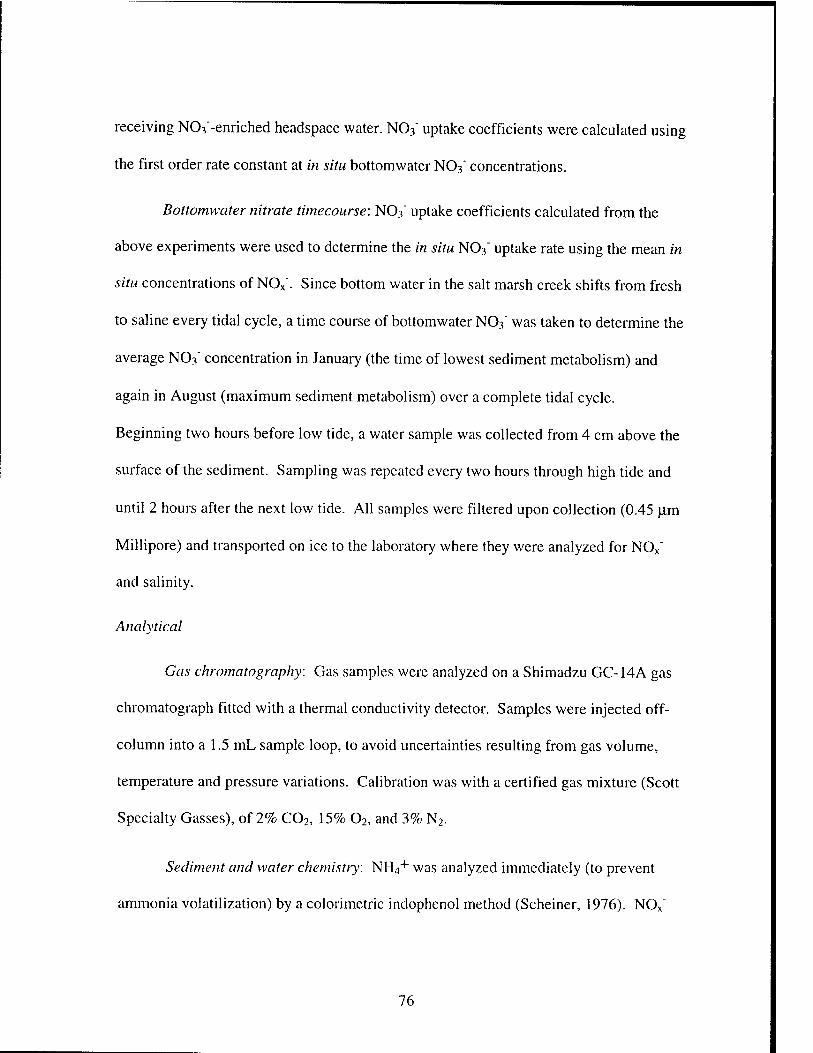
receiving N03"-enriched headspace water. N03" uptake coefficients were calculated using
the first order rate constant at in situ bottomwater N03" concentrations.
Bottomwater nitrate timecourse: N03" uptake coefficients calculated from the
above experiments were used to determine the in situ N03" uptake rate using the mean in
situ concentrations of NOx". Since bottom water in the salt marsh creek shifts from fresh
to saline every tidal cycle, a time course of bottomwater N03" was taken to determine the
average N03" concentration in January (the time of lowest sediment metabolism) and
again in August (maximum sediment metabolism) over a complete tidal cycle.
Beginning two hours before low tide, a water sample was collected from 4 cm above the
surface of the sediment. Sampling was repeated every two hours through high tide and
until 2 hours after the next low tide. All samples were filtered upon collection (0.45 |im
Millipore) and transported on ice to the laboratory where they were analyzed for NOx"
and salinity.
Analytical
Gas chromatography: Gas samples were analyzed on a Shimadzu GC-14A gas
Chromatograph fitted with a thermal conductivity detector. Samples were injected off-
column into a 1.5 mL sample loop, to avoid uncertainties resulting from gas volume,
temperature and pressure variations. Calibration was with a certified gas mixture (Scott
Specialty Gasses), of 2% C02, 15% 02, and 3% N2.
Sediment and water chemistry: NH4+ was analyzed immediately (to prevent
ammonia volatilization) by a colorimetric indophenol method (Scheiner, 1976). NOx"
76
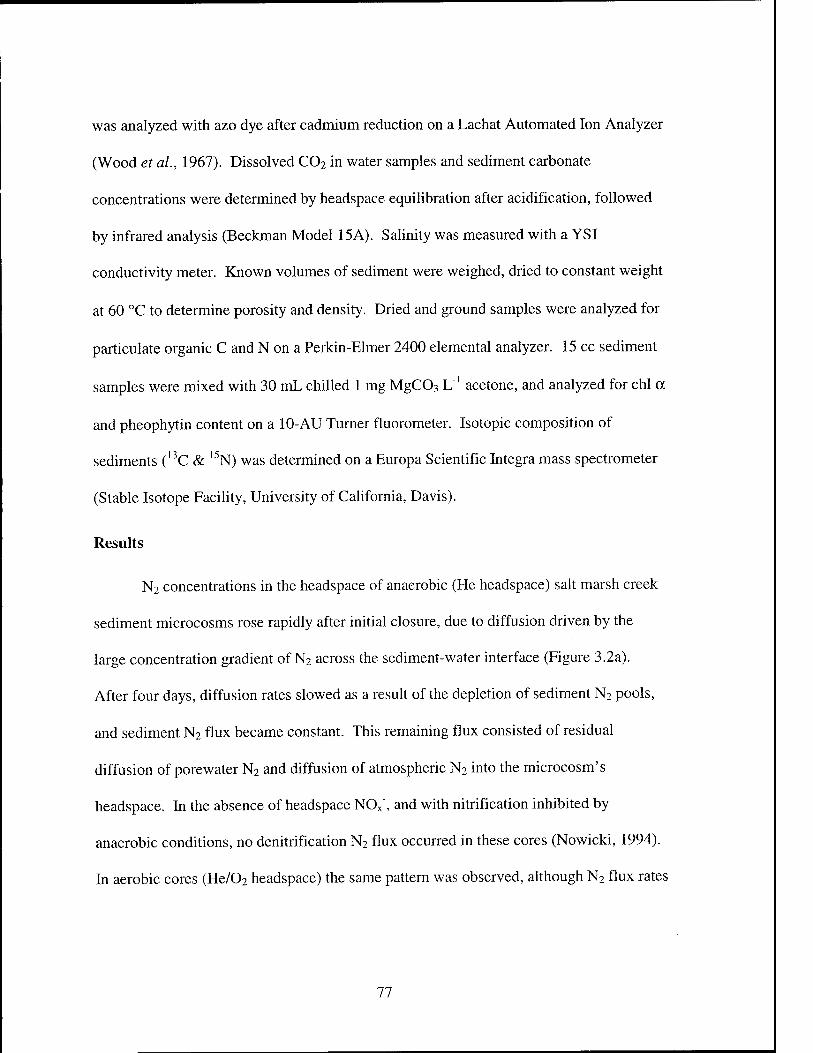
was analyzed with azo dye after cadmium reduction on a Lachat Automated Ion Analyzer
(Wood et ah, 1967). Dissolved CO2 in water samples and sediment carbonate
concentrations were determined by headspace equilibration after acidification, followed
by infrared analysis (Beckman Model 15A). Salinity was measured with a YSI
conductivity meter. Known volumes of sediment were weighed, dried to constant weight
at 60 °C to determine porosity and density. Dried and ground samples were analyzed for
particulate organic C and N on a Perkin-Elmer 2400 elemental analyzer. 15 cc sediment
samples were mixed with 30 mL chilled 1 mg MgC03 L"1 acetone, and analyzed for chl a
and pheophytin content on a 10-AU Turner fluorometer. Isotopic composition of
sediments (13C & l5N) was determined on a Europa Scientific Integra mass spectrometer
(Stable Isotope Facility, University of California, Davis).
Results
N2 concentrations in the headspace of anaerobic (He headspace) salt marsh creek
sediment microcosms rose rapidly after initial closure, due to diffusion driven by the
large concentration gradient of N2 across the sediment-water interface (Figure 3.2a).
After four days, diffusion rates slowed as a result of the depletion of sediment N2 pools,
and sediment N2 flux became constant. This remaining flux consisted of residual
diffusion of porewater N2 and diffusion of atmospheric N2 into the microcosm's
headspace. In the absence of headspace NOx", and with nitrification inhibited by
anaerobic conditions, no denitrification N2 flux occurred in these cores (Nowicki, 1994).
In aerobic cores (He/02 headspace) the same pattern was observed, although N2 flux rates
77
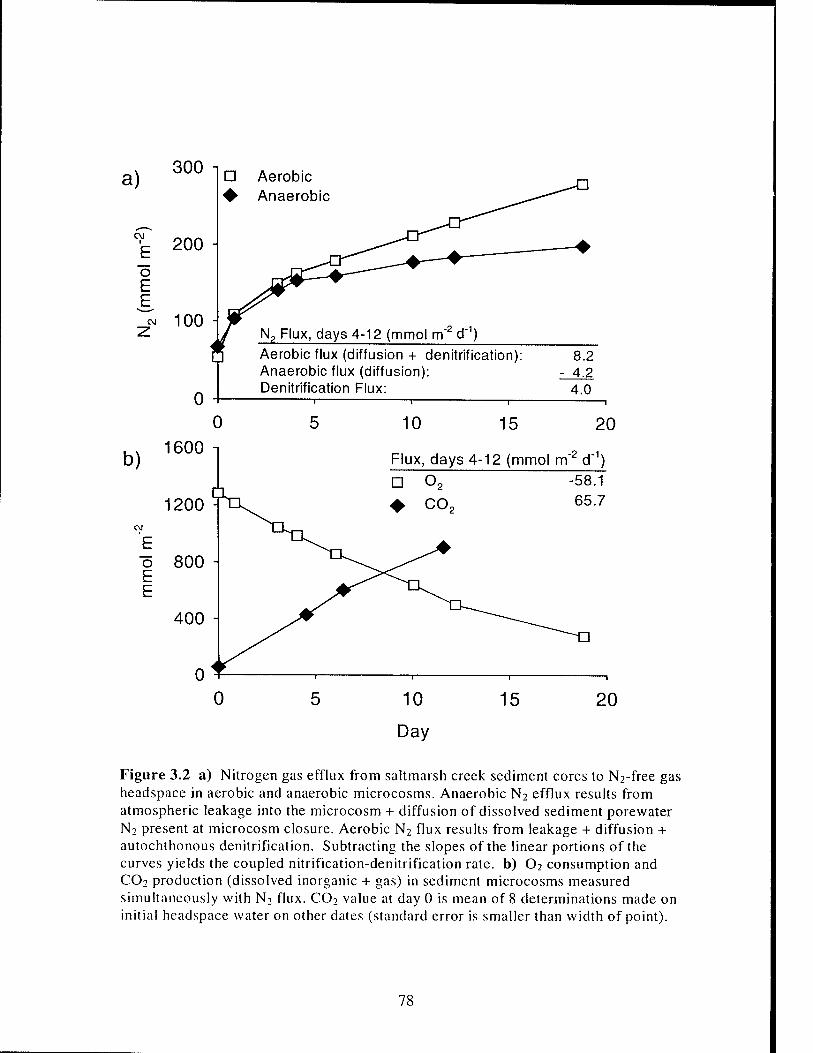
a)
CM
o E E
300 i
200 -
100
D Aerobic ♦ Anaerobic
0
Aerobic flux (diffusion + denitrification): Anaerobic flux (diffusion): Denitrification Flux:
8.2 4.2 4.0
Flux, days 4-12 (mmol m" -58.1 65.7
20
10
Day
15 20
Figure 3.2 a) Nitrogen gas efflux from saltmarsh creek sediment cores to N2-free gas headspace in aerobic and anaerobic microcosms. Anaerobic N2 efflux results from atmospheric leakage into the microcosm + diffusion of dissolved sediment porewater N2 present at microcosm closure. Aerobic N2 flux results from leakage + diffusion + autochthonous denitrification. Subtracting the slopes of the linear portions of the curves yields the coupled nitrification-denitrification rate, b) 02 consumption and C02 production (dissolved inorganic + gas) in sediment microcosms measured simultaneously with N2 flux. C02 value at day 0 is mean of 8 determinations made on initial headspace water on other dates (standard error is smaller than width of point).
78
after 4 days were greater than anaerobic N2 fluxes due to additional N2 generated by
autochthonous denitrification of NO3" produced in situ through nitrification. NH4+ fluxes
were always out of the sediments (Table 3.1), while NOx" fluxes were inconsiderable, < 2
% of N mineralization rates.
Denitrification and 02 fluxes were determined on sediments collected on 14 dates,
from 9/17/97 to 11/9/00 (Table 3.1). C02, NH4+, and NOx" fluxes (in microcosms with
no added headspace NO3") were determined on only some of these dates as shown in
Table 3.1. Headspace 02 concentrations decreased due to aerobic heterotrophy and the
oxidation of reduced metabolic products such as NH4+ and S"2. 02 consumption rates
remained constant as long as 02 concentrations remained above 10% vol, and 02
consumption was determined from measurements taken while 02 concentrations were
above 30%. Concomitantly, C02 concentrations in the headspace (~ 80% as dissolved
C02) increased as a result of the heterotrophic degradation of organic matter. Although
gas Chromatographie measurements for S"2 and CH4 were not calibrated, these
metabolites were occasionally observed in the headspace above summer anaerobic cores.
However, S"2 and CH4 peaks were never observed above aerobic cores, indicating that
these species were oxidized before escaping the sediments.
Sandy and muddy sediments were markedly different in porosity, density, and
organic content (Table 3.2; p < 0.001). Sandy sediments were coarse-grained, with
densities averaging 1.22 ± 0.05 g cm"3, while muddy sediments were fine-grained and
only one third as dense as sandy sediments (0.39 ± 0.04 g cm"3). Surficial sediment
organic C in the sandy site averaged 0.55 ± 0.05 mmol cm"3, less than one half the
79
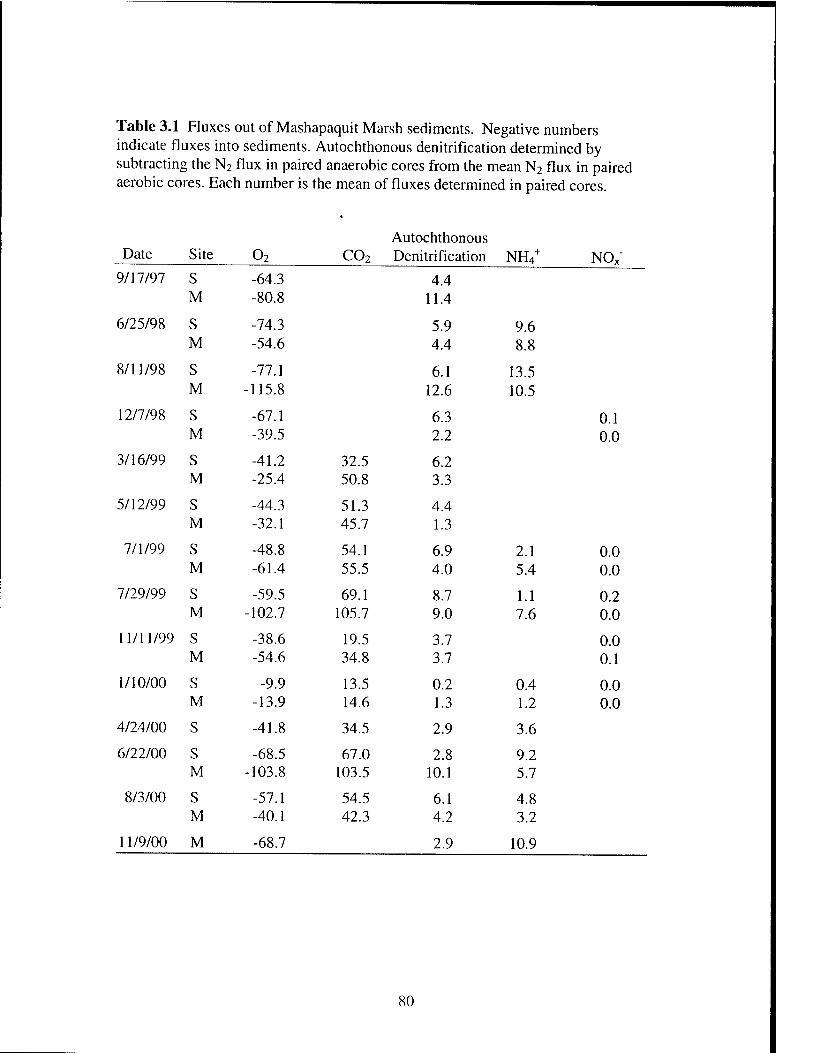
Table 3.1 Fluxes out of Mashapaquit Marsh sediments. Negative numbers indicate fluxes into sediments. Autochthonous denitrification determined by subtracting the N2 flux in paired anaerobic cores from the mean N2 flux in paired aerobic cores. Each number is the mean of fluxes determined in paired cores.
Autochthonous Date Site o2 co2 Denitrification
4.4
NH4+ NOx-
9/17/97 S -64.3 M -80.8 11.4
6/25/98 S -74.3 5.9 9.6 M -54.6 4.4 8.8
8/11/98 S -77.1 6.1 13.5 M -115.8 12.6 10.5
12/7/98 S -67.1 6.3 0.1 M -39.5 2.2 0.0
3/16/99 S -41.2 32.5 6.2 M -25.4 50.8 3.3
5/12/99 S -44.3 51.3 4.4 M -32.1 45.7 1.3
7/1/99 S -48.8 54.1 6.9 2.1 0.0 M -61.4 55.5 4.0 5.4 0.0
7/29/99 S -59.5 69.1 8.7 1.1 0.2 M -102.7 105.7 9.0 7.6 0.0
11/11/99 S -38.6 19.5 3.7 0.0 M -54.6 34.8 3.7 0.1
1/10/00 S -9.9 13.5 0.2 0.4 0.0 M -13.9 14.6 1.3 1.2 0.0
4/24/00 S -41.8 34.5 2.9 3.6
6/22/00 S -68.5 67.0 2.8 9.2 M -103.8 103.5 10.1 5.7
8/3/00 S -57.1 54.5 6.1 4.8 M -40.1 42.3 4.2 3.2
11/9/00 M -68.7 2.9 10.9
80

J3 oo l-H
3
a CU
J3 CO OS
O
«a
G co
T3 CD oo
CO
-a
G OS
CO CD
4—>
>^ T3 e a 00
O
S-i CO
4—»
o aj
U
CN
co
03 H
CD -t—»
CO
(D oo
C o3
CO
co c
CO S
CO O a a o
t-t—i
e 1—< bl (-1 •i-H
3 CO
o3
a -*—»
G
CO CD
o3
& O
*-» as e vo pq
i—i i—i i—i i—i i—i "^" OOOOCN^HOO^j-'—IOOVOOV") OOOOO OOOOcoOcoOO ÖÖÖÖÖÖÖÖÖOÖÖÖÖ V V V V V
^l-^t-xj-Tt^vo^o^i-^i-cooococNr^ tS N N N M >—< T—i ,—i
o ^ Ö <N
co
O <N (N
en O O o
o o o o © o
o 00
oo
—< Ö Ö 00 Ö
co 1—I
<N —i r-
Ö o\
OO
CO Ö 00
^ VO
o —i <N oo wo CN r- MD vo VO
ooooi>oO'si-MD^O'^-'^-<noomcsr^ M N N Ol N '—' r-Mr-<
wo o Ö
CN CN
C
co •4—)
_G
03
CL,
o
a\ o o CN O O
CN uo >n
ö
co vo ö
o Ö
CO O
,-*, o 00 o Ö Ö
CN ON vo
oo co ö Ö CN
O CO en
m \o r-~ d ö o
r-
CO
ö
CO CN ■3-
r-
ö
00 0O M ifl \f
WO -*3-
ON CO
T3 "O
in co h M wo -st-
u
O m S —, —, S 6 " 9 g c ü •—I G G
^ w OO a a a
— m
u « m 03
«3 tM ± 1
-r O U bß _ _ Ö O O 0 a s
a a
cJ _-
O v o bß bß
O
a a c r) o ^J
J =L
03
JüP 13 ü
bß CO
O <N
o .
a (N Cu O
CN U
2 g
> O o
<4-H
o
1)
C OS c
a o
-a
u z T3
co
e o a
o
>>
c
c
a - - « ^ ^ 5 u z
<Ö:QCL.COCOU2 2
c CD
a "o
bß
"a.
O
c
a öß
&1 o a ^ 3 T3
o3 O
c <D
T3 co 3 O C o
X5
a t3
C O
G 03 4-» CO
C O o o 03
& O
O 3
fi | 3 co C o o
O Z i-i
OS
<u o
U-i l-l 3
3^ co -3
OH O U < O O z
c OS
a o
'S o
cfn •^H S-i
-4—»
'3 -a
CO
3 O e o
Ü O
S <
3 bß 3 <
e OS
G OS
o 13
03 ■-*
> O
CD +—i O CD
"o O
co
a o3
CU co CD , G Öß
OO c+—I
O
+ o OS
Ö o (1> CO >
T>i 3 o3
r) T3 & S-H
01 CD
i-i o o .G bß
U CO
81
organic C content of the muddy site (1.2 ± 0.1 mmol cm"3). Stable isotope ratios of C and
N also differed between the sites. The 813C of sediment carbon in the two sites was
-20.8 ± 0.8 (sandy), and -18.5 ± 0.2 (muddy) in contrast to the 5I3C of Spartina
alterniflora vegetation (-12.6) and peats (-15.0). Total pigment content (chlorophyll a +
pheophytin) in sandy sediments (1010 ± 330 ng cm"3) was twice that of muddy sediments
(590 ± 100 fig cm'3). Normalizing the pigment content to sediment organic C gave a
measure of the relative amount of sediment organic C associated with labile algal
biomass. Sandy sediments contained 8.8 ± 3.1 \xg pigment mg"1 C, while muddy
sediments contained 1.8 ± 0.7 u.g pigment mg"1 C.
Although significant differences in composition were found between the sediment
types, metabolic rates were not significantly different (p > 0.25). The mean sediment 02
consumption of sandy sediments was 58 ± 6 mmol 02 m"2 d"1, the same as the rate
measured in muddy sediments (62 ± 9 mmol m"2 d"1). No significant differences were
found in C02 production rates (46 ± 7 vs. 58 ± 10 mmol m"2 d"1), or denitrification (4.9 ±
0.6 vs. 5.4+1.1 mmol N m" d"1). However, when these metabolic rates were normalized
to the organic C content of the sediments, the difference in the metabolic activity of the
constituent organic matter becomes apparent. Sandy sediments were twice as reactive
(5.3 ± 0.6 mmol 02 mol"1 C d"1) as muddy sediments (2.6 ± 0.3 mmol 02 mol"1 C d"1).
Analysis of sediments collected along 8 transects was combined with field
mapping to classify Mashapaquit Marsh creckbottom sediments into muddy and sandy
based on their density (Figure 3.1). Sandy sediments were coarse and light in
82
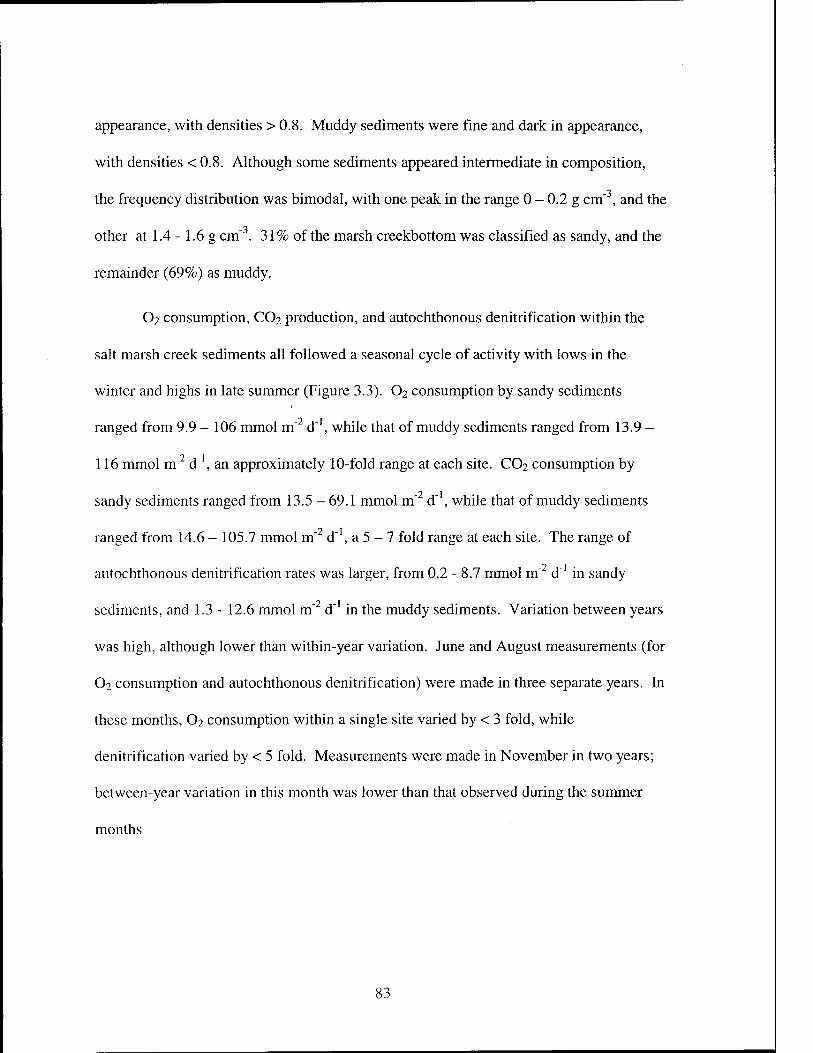
appearance, with densities > 0.8. Muddy sediments were fine and dark in appearance,
with densities < 0.8. Although some sediments appeared intermediate in composition,
the frequency distribution was bimodal, with one peak in the range 0 - 0.2 g cm"3, and the
other at 1.4 - 1.6 g cm" . 31% of the marsh creekbottom was classified as sandy, and the
remainder (69%) as muddy.
O2 consumption, CO2 production, and autochthonous denitrification within the
salt marsh creek sediments all followed a seasonal cycle of activity with lows in the
winter and highs in late summer (Figure 3.3). 02 consumption by sandy sediments
ranged from 9.9 - 106 mmol m"2 d"1, while that of muddy sediments ranged from 13.9 -
116 mmol m"2 d"1, an approximately 10-fold range at each site. CO2 consumption by
sandy sediments ranged from 13.5 - 69.1 mmol m"2 d"1, while that of muddy sediments
-7 -1 ranged from 14.6 - 105.7 mmol m" d" , a 5 - 7 fold range at each site. The range of
autochthonous denitrification rates was larger, from 0.2 - 8.7 mmol m"2 d"1 in sandy
7 1 sediments, and 1.3 - 12.6 mmol m" d" in the muddy sediments. Variation between years
was high, although lower than within-year variation. June and August measurements (for
02 consumption and autochthonous denitrification) were made in three separate years. In
these months, O2 consumption within a single site varied by < 3 fold, while
denitrification varied by < 5 fold. Measurements were made in November in two years;
between-year variation in this month was lower than that observed during the summer
months
83
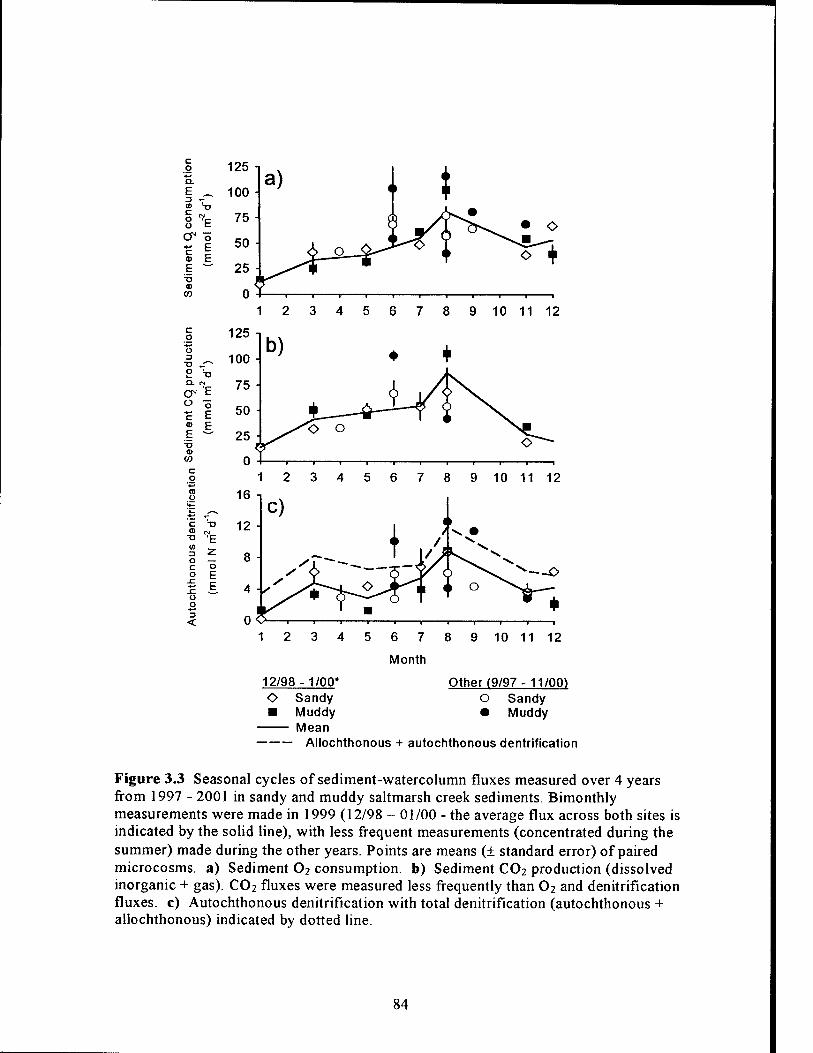
o 125 -I
E _ 3 -- CO XI
o -V o t
100 ■
75 ■
er ö
<D E E ~
50 ■
25 ■ 73 ID
V)
1 2 3 4 5 6 7 8 9 10 11 12
12/98-1/00* O Sandy ■ Muddy Mean
Other (9/97- 11/00) O Sandy • Muddy
Allochlhonous + autochthonous dentrification
Figure 3.3 Seasonal cycles of sediment-watercolumn fluxes measured over 4 years from 1997 - 2001 in sandy and muddy saltmarsh creek sediments. Bimonthly measurements were made in 1999 (12/98 - 01/00 - the average flux across both sites is indicated by the solid line), with less frequent measurements (concentrated during the summer) made during the other years. Points are means (± standard error) of paired microcosms, a) Sediment O2 consumption, b) Sediment C02 production (dissolved inorganic + gas). C02 fluxes were measured less frequently than 02 and denitrification fluxes, c) Autochthonous denitrification with total denitrification (autochthonous + allochthonous) indicated by dotted line.
84
Sediment fluxes of O2 and CO2 were both correlated with temperature (Figures 3.4a and
3.4b), although the correlations were strongest for CO2. Autochthonous denitrification
rates showed no strong relationship to temperature (r2 < 0.37), although the highest rates
in the muddy sediments occurred at the upper end of the temperature range (Figure 3.4c).
Metabolic rates were highly correlated with sediment C concentrations (Figure
3.5). Sediment O2 demand rose with increasing sediment C for both sandy and muddy
sediments, but the sediment C of muddy sediments was less metabolically active than that
of sandy sediments, requiring a higher sediment C concentration to achieve the same
Sediment 02 uptake rate. The same pattern was repeated for C02 production,
autochthonous denitrification, and sediment NO3" uptake. Sediment C was most highly
correlated with autochthonous denitrification (Pearson product moment con-elation
coefficient r = 0.87), in sandy sediments, whereas in muddy sediments, it was most
highly correlated with C02 production (r = 0.85). Sandy sediments had highly variable
sediment C contents, as demonstrated by the size of the standard error bars. Each point is
the mean of two cores collected within 1 m of each other. Muddy sediments, on the other
hand, were more homogenous in sediment C content.
Summer denitrification rates were determined on two occasions at four sites along
the marsh creek (Figure 3.1). Sites 3 and 4 consisted of muddy sediments with similar
characteristics to site M, and had similar sediment C-specific 02 and C02 flux rates
(Figure 3.6a). However, N fluxes differed between the sites (Figure 3.6b). As discussed
85
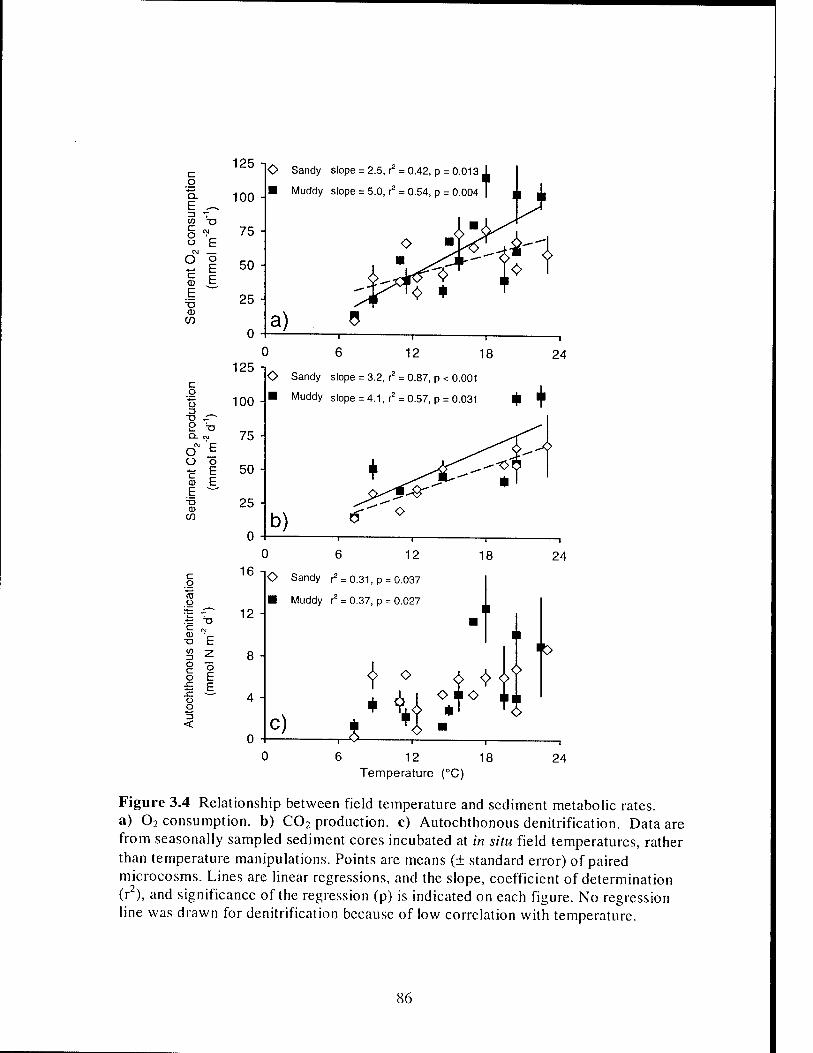
c .o Q. E ~ 3 v w "D
u E CNJ
o c
E r> <D
CO
o E E
c g o 3
Q- ™
o Ü c a> E
T3 CD
CO
C g 03 O
1/5
O c o
o o 3 <
125
100
75
50
25
0
125
O Sandy slope = 2.5, r2 = 0.42, p = 0.013
■ Muddy slope = 5.0, r2 = 0.54, p = 0.004
a) 0 12 18
—i
24
O Sandy slope = 3.2, r2 = 0.87, p < 0.001
100 -m MuddV slope = 4.1, r2 = 0.57, p = 0.031 f
75 -
50
25
0
16
12
8
4
b) 0 12 18 24
<> Sandy r2 = 0.31, p = 0.037
■ Muddy r2 = 0.37, p = 0.027
c)
■0
6 12 18 Temperature (°C)
24
Figure 3.4 Relationship between field temperature and sediment metabolic rates. a) 02 consumption, b) C02 production, c) Autochthonous denitrification. Data are from seasonally sampled sediment cores incubated at in situ field temperatures, rather than temperature manipulations. Points are means (± standard error) of paired microcosms. Lines are linear regressions, and the slope, coefficient of determination (r ), and significance of the regression (p) is indicated on each figure. No regression line was drawn for denitrification because of low correlation with temperature.
86

m
O
IT) d
o d
m CM
o o m I--
o LO
(t p z_oi lOtuai)
uoipnpojd 2oO lueunpes
m
(t.p 2_ai |OWW)
uojidainsuoo Eo luaanpes
i—
CD
O CM
*~ E a ö E
o £ ■^ ü
CD
E m o Ö w
o d
CM
(t.p Z.LU loaiai)
8>|B}dn EON }U9iiiipes
,— o o O o o o V II a. Q.
00 CO
o o
in II II
o
TJ C C8
CO
>> "O •a 2
o CD
(lP g.uJ N loaiui)
uoueojjujiuep snouoiiupoyiv
87
o E E, ü c CD E
T3 CD
C/5
(5 U 13
G "^ ° •a oc d
n en
•S 6 §^ 3 oo 00 •—' s ^ Ü ctf c^ Q
o ^ «s .2
. t3 00 In cu -ä 4-j S3 cö (D
O O
O
'S
§:§ <-! ft
oo ccj a 13
S s "£ Is
1 I "> t> Ö ■§ 4-» O
-G ft
3 o a & oo (D
O OH
""" 42 cu ,G 3 H
ä g oo O 4> O
3 .S
i ^ öß .
s R <** G <+_,
T3 'S 4} -^ oo G
CD ^ 0) oo
~ 2 £ § ft-5 ^ o S 2 •2 5 S < 13 /—v Pi u
V) G ri .2 «- 3
So o ?"■ *-«
G X$ <+-■
tu rt *-• w ft C (U ^ o
_ t: o t> -Ö .G
^ ^ P G aj ^^
■ft! ft O O G
i o G
03
+1 1) oo C G c3 c3 O Ü yn
<U öß J3 'S
G ."tn o3 oo -y
C G -SH • —^ •"-; O & &S E S ü G3 P3 O oo oo O

a) T3
o ö E ö E
b)
o "5 E "o E E
c)
CL a.
'c.
en
Sediment carbon-specific: &■■■•■ i 02 consumption
■■ C02 production
BJlJl M
Sediment carbon-specific: r~~1 NH4
+ efflux
Autochthonous denitrification
n^m rn^
Figure 3.6 Carbon-specific fluxes at 4 sites along a salinity gradient (see Figure 3.1). a) Carbon specific 02 consumption and C02 production, b) Carbon-specific NH4
+
efflux + autochthonous denitrification = N mineralization, c) Salinity.
88

above, sediment organic material at site S was more labile than material at site M, and
therefore sediment C-specific mineralization (NH41" efflux + denitrification, Figure 3.6a)
was higher than at all the other sites. C-specific mineralization and denitrification rates
were lower at sites 3 and 4 than at site M. The sites were located along a salinity
gradient, with mean bottom water salinity rising from the head to the mouth of the salt
marsh creek.
In aerobic microcosms receiving NC^'-enriched headspace water, NOx"
concentrations declined as a result of denitrification within the sediment (Figure 3.7a).
Algal NOx" uptake was inhibited in the dark incubations. A significant contribution of
dissimilatory NO3" reduction to NHU+ to NO3" uptake was ruled out because average
allochthonous N2 production equaled average NO3" uptake (Figure 3.7b; t test, p = 0.21).
Mean mineralization (NH4+ + N03" + N2) fluxes in N03"-free microcosms were not
greater than mineralization fluxes in NC^-amended microcosms (p = 0.9), further support
for the minor role of dissimilatory NO3" reduction to NH4"1" in these sediments. Since
NO3" uptake was due to denitrification alone and because of the high uncertainty
associated with the measurement of allochthonous N2 production (depending on N2 flux
rates from 3 microcosms [2 NCV-free and 1 NC^'-amended]), NO3" uptake was used as a
measure of allochthonous denitrification. The decrease in NOx" concentration was
substrate-limited, and could be modeled using the Monod equation (Figure 3.7a inset). In
some microcosms however, sediment NOx" uptake appeared to follow first-order kinetics.
First-order NOx" uptake rate coefficients were calculated for all microcosms using the
89

a) 100
C\J
E "5 E E
b) <v
o c o sz sz o o
Sediment N03" uptake (mmol m"2 d"1)
Figure 3.7 a) Example of watercolumn NOx~-driven denitrification in an aerobic saltmarsh creek sediment microcosm (5/12/99). Open diamonds show loss of NOx~ after spikes at 0 and 7 d. Closed squares show concomitant evolution of N2 from denitrification of watercolumn NC\~ (determined by subtracting N2 flux in NOx"-free from NOx"-containing microcosms.). 92 mmol m"2 of nitrate were consumed while 97 mmol m"2 N2 were generated (in excess ofthat generated by coupled nitrification- denitrification). Inset shows kinetics of NOx\ uptake for both NOx" spikes. Curve is based on least-squares fit after inversion transform of both axes (Lineweaver-Burke plot), b) Relationship of watercolumn NOx"-driven N2 production to loss of headspace NO?" for all cores incubated in study. Points are means of paired cores ± standard error.
90

initial linear part of the uptake curve, since field NOx" levels were within this range
(Table 3.2).
Allochthonous denitrification rates were determined from 12/98 to 1/01 (Figure
3.3c). Allochthonous denitrification rates ranged from 0.9 -3.9 mmol m" d" in sandy
sediments, and from 1.5 - 3.7 mmol m"2 d"1 in muddy sediments. No clear seasonality
was observed for allochthonous denitrification. However, because of the seasonality of
autochthonous denitrification, the contribution of allochthonous denitrification to total
denitrification peaked in January (78%), while the lowest proportion was found in July
(23%). The average annual integrated autochthonous denitrification rate was 1.6 mol N
9 1 -7-1 m~~ y" , while that of allochthonous denitrification was 1.0 mol N m" y" , or 39% of the
total denitrification (2.7 mol N m"2 y"1) in these salt marsh creekbottom sediments.
The first order rate constant (k) of NO3" uptake were lower in aerobic vs.
anaerobic microcosms (Figure 3.8). The difference in k between aerobic and anaeroibc
sediments gives a measure of the degree of inhibition of allochthonous denitrification
resulting from more oxic sediment conditions. In muddy sediments, the inhibition of the
denitrification of water column NO3" under aerobic conditions decreased at higher levels
of sediment oxygen demand, so that above 50 mmol 02 m"2 d"1, no difference was found
in NO3" uptake between aerobic and anaerobic microcosms.
The elemental ratios of C, O2 and N fluxes across the sediment-water interface
were highly consistent across all seasons and sediment types (Figure 3.9). Correlation
coefficients (r) ranged from r = 0.94 for the C02/02 ratio, to 0.97 for the C/N ratio. The
91

& -r 90 i
co E -t—>
R ~
CO
<D
Q.
CO
O
o E E
O
CO
30
o c _o
o !Q o a> cc c CO
0
Sandy O r = -0.37, p = 0.63
Muddy ■ r = -0.93, p = 0.024
Ü 20 40 ~ 60 80
Sediment 02 consumption (mmol m"2 d"1)
Figure 3.8 Inhibition of sediment NOx" uptake by presence of 02 decreases with increasing sediment 02 consumption. Inhibition of sediment NOx calculated by subtracting the first-order rate constant of aerobic NOx" uptake from that in anaerobic uptake. Points are means of paired cores ± standard error. Line represents a least squares fit to muddy points alone. Pearson product moment correlation coefficients (r), and significance (p) are indicated for both sediment types.
92
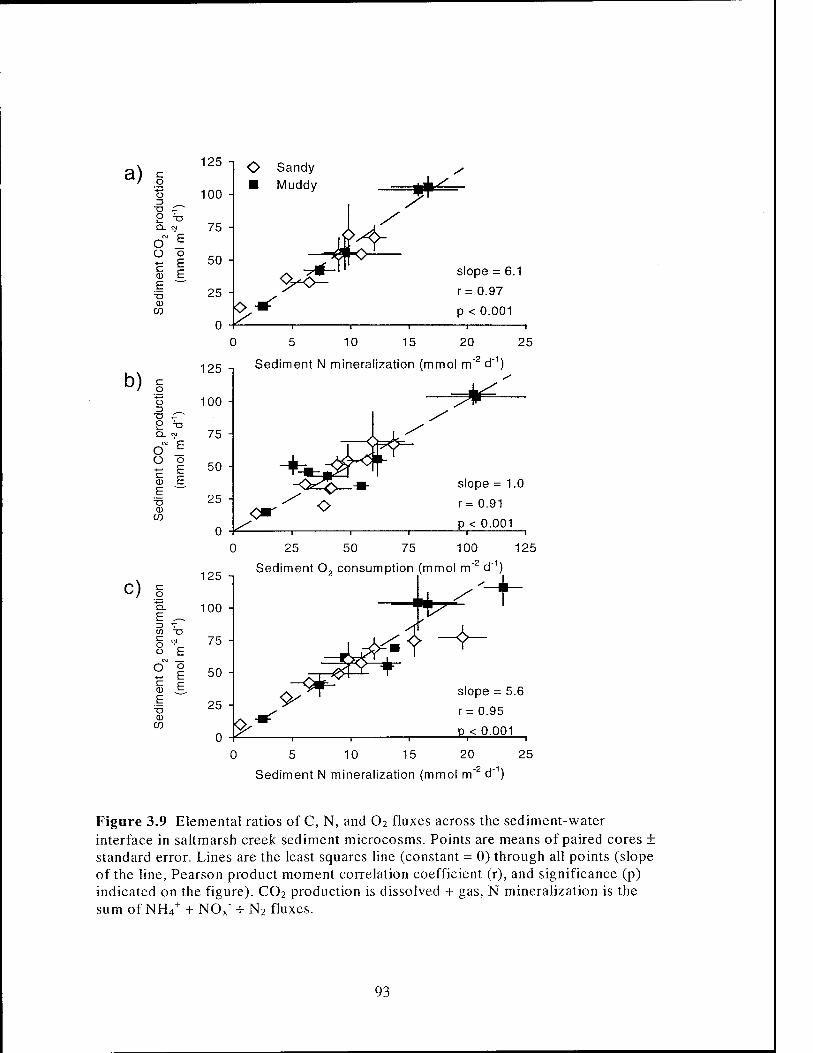
a)
b)
c)
125 r o
mn -I
TJ ^L -
Ü -a Q. CJ /h
C\J
o E () o c E
F bU
F "—"* Vi 2b a>
CO
0
125 c. o C3 100 "> TI ,1 " O T3 Q. CJ /b
CM
O E (> o
F bU Cl) E S= TI 2b CD
CO
0
r ü
a. E ~i »7 to T) !_ ( ) Ü b
c\] o ü
t- 1_ 0 E E
TJ a>
C/J
O Sandy ■ Muddy
o.
slope = 6.1
r= 0.97
p< 0.001 —i—
10 —i—
15 —i—
20 —i
25 -2,4-1\ Sediment N mineralization (mmol m" d
^
<*r
slope =1.0 r= 0.91 p < 0.001
125
100
75
50
25
0
i 1
0 25 50 75 100 125 2 ^-h Sediment 02 consumption (mmol m" d
o.
slope = 5.6 r= 0.95 p < 0.001
1 1 1 "-T-
0 5 10 15 20 25
Sediment N mineralization (mmol m" d" )
Figure 3.9 Elemental ratios of C, N, and O2 fluxes across the sediment-water interface in saltmarsh creek sediment microcosms. Points are means of paired cores ± standard error. Lines are the least squares line (constant = 0) through all points (slope of the line, Pearson product moment correlation coefficient (r), and significance (p) indicated on the figure). CO2 production is dissolved + gas, N mineralization is the sum of NH4
+ + NOx" + N2 fluxes.
93

slope of the least squares line (constant = 0) for the C/N ratio was 6.1, less than the C/N
ratio of sediment organic material (range 7.5 - 14.7), at the lower end of the range for
suspended particulate matter in the surface waters of the salt marsh creek (5.9-10.4), but
near to the Redfield ratio for algal biomass (6.6). The respiratory quotient (rq, or C02
consumed / 02 produced) at both sites S and M averaged 1.0, indicating complete
oxidation of S"2 and other reduced end-products of anaerobic metabolism. The absence
of S"" and CH4 in the headspaces of aerobic microcosms and supports the contention that
both of these anaerobic metabolites are oxidized before escaping from the sediments.
Nitrification accounted for an average of 18% (range 6 - 30%) of the total
sediment 02 consumption of the sediments (02 [nitrification] / 02 [total]) (Figure 3.10).
The sediment C02 flux attributable to coupled nitrification-denitrification reactions (C02
[nitrification-denitrification] / C02 [total]) was the sum of chemoautotrophic C02
consumption by nitrifiers and heterotrophic C02 production by denitrifiers, but the
direction of this summed flux was always out of the sediments. This C02 flux on average
accounted for 10% (2 - 22%) of the total C02 production of the sediments. The role of
coupled nitrification-denitrification in the total sedimentary N cycle (N [denitrified] / N
[mineralized]) was larger, accounting for 46% (21 - 89%) of the total NH4+ regenerated
in the sediments. The contributions of nitrification and denitrification fluxes to total
sediment metabolism (02, C02, and N) averaged a constant proportion over the entire
range of metabolic rates and across sediment types.
94
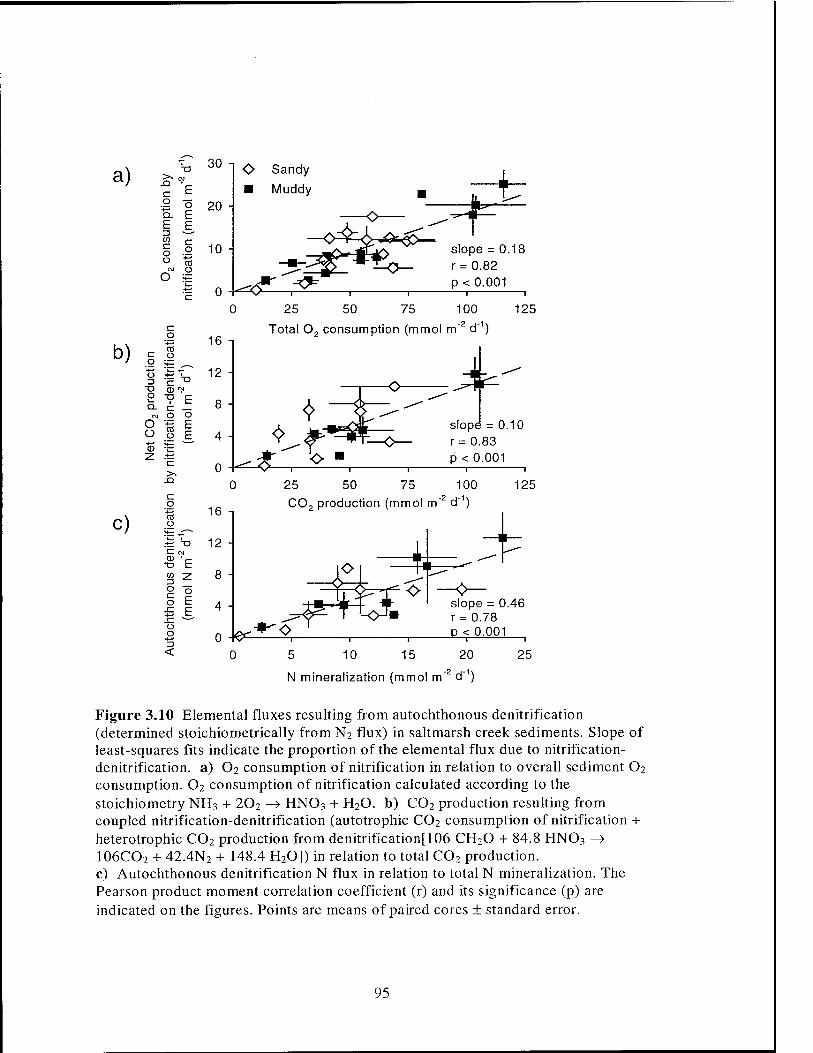
a)
b)
c)
-Q C o o
E E c o
3 CO
o u CO
CM Ü
O fE
C c_> O ^r o
O c CD '
_ T3 Q- £=
CM O
O "-e o g
c o CO o
C CM Q) V
C/>
O c o
o o 'S <
30
20
10
0
<> Sandy
■ Muddy
slope = 0.18 r = 0.82 p< 0.001
0 25 50 75 100 125 -2 ,H\ Total 02 consumption (mmol m" d" )
16
12
8
4
25 50 75 100 125
C02 production (mmol m"2 d"1)
0 \&- ■+-o
slope = 0.46 r = 0.78 p < 0.001
0 10 15 20 25
N mineralization (mmol m" d" )
Figure 3.10 Elemental fluxes resulting from autochthonous denitrification (determined stoichiometrically from N2 flux) in saltmarsh creek sediments. Slope of least-squares fits indicate the proportion of the elemental flux due to nitrification- denitrification. a) O2 consumption of nitrification in relation to overall sediment O2 consumption. O? consumption of nitrification calculated according to the stoichiometry NH3 + 2O2 —> HNO3 + H20. b) C02 production resulting from coupled nitrification-denitrification (autotrophic C02 consumption of nitrification + heterotrophic C02 production from denitrification[106 CH20 + 84.8 HNO3 -> IO6CO2 + 42.4N2 + 148.4 H20]) in relation to total C02 production, c) Autochthonous denitrification N flux in relation to total N mineralization. The Pearson product moment correlation coefficient (r) and its significance (p) are indicated on the figures. Points are means of paired cores ± standard error.
95

Discussion
Metabolic cycling of 02, C02, and N in creekbottom sediments of Mashapaquit
Marsh appeared to be controlled primarily by sediment organic C content and quality,
along with seasonal effects, including temperature. Autochthonous denitrification was a
significant contributor to the overall cycling of N, C, and 02 in these saltmarsh
sediments.
02 consumption by nitrification in these sediments averaged 18%. Other studies
of inner estuaries found contributions (recalculated from published data) of 17%
(Seitzinger et al, 1984), 26% (Yoon and Brenner, 1992), 35% (Zimmerman and Brenner,
1994), and 38% (Seitzinger, 1987). Similarly, in deep-sea sediments from the North
Atlantic, 02 consumption by nitrification was calculated to be 35% (Christensen and
Rowe, 1985). However, the stochiometries of organic matter degradation and
nitrification constrain the contribution of autochthonous denitrification to total sediment
02 fluxes. Even if 100% of the NH4+ generated by the degradation of Redfield organic
matter (C:N = 6.6) were nitrified and denitrified, nitrification could only account for a
maximum 30% of the total 02 flux. The higher contributions reported in the literature
might result from net import of allochthonous NH4+ into the sediments, changes in
sediment NH4+ storage, incomplete oxidation of reduced metabolites (S"\ CH4), or
alternate metabolic pathways whose contribution to N metabolism in natural
environments is still not known. A number of the newly described metabolic pathways
would have the effect of reducing the 02 demand of coupled nitrification-denitrification
(Jetten, et al, 1997). N2 gas can be produced anaerobically from NH4+ and nitrite, a
96

process known as nitrifier denitrification. In anaerobic NH4+ oxidation, NH/ is used
chemolithotrophically by denitrifying organisms, resulting in the anaerobic conversion of
N03" and NH4+ to N2 gas.
Carbon cycling by autochthonous denitrification in the present study was 10% of
the total dark cycling of sediment C (CO2 production by denitrification =11%;
autotrophic CO2 fixation by nitrification = 1%). Adding the CO2 production resulting
from allochthonous denitrification increases the average denitrification C cycling from
10% to 17%, similar to the effect of autochthonous nitrification on O2 consumption. An
early study of a Danish estuary found that denitrification accounted for only 3 - 4% of
sediment C cycling (J0rgensen and S0rensen, 1985), but denitrification was determined
using the acetylene block assay, which is known to underestimate denitrification rates
(Seitzinger et al., 1993). Other studies using either N2 flux or l5N isotope pairing
methods for measuring denitrification found contributions of from 1 - 5% in coastal
marine sediments (Trimmer et al, 2000) to values of 9.3% - 18.5% for estuarine
sediments (Yoon and Brenner, 1992; Zimmerman and Brenner, 1994; Trimmer et al,
2000).
Of the NH/ remineralized in the sediments, 46% was nitrified and denitrified,
within the range reported for estuaries and coastal marine sediments (15% - 75%)
(reviewed in Seitzinger, 1987). In Mashapaquit Marsh sediments, autochthonous
denitrification was limited by nitrification, rather than denitrification, since there was a
NOx" flux into the sediments, while in most estuaries, NOx" is effluxed from the sediment,
97
indicating that denitrification, rather than nitrification limits autochthonous denitrification
(Seitzinger, 1987).
Although groundwater NOx" is removed directly by denitrification, groundwater
NOx" is the probable source of remineralized sediment N as well. The sediment organic
material that drives creekbottom respiration and autochthonous denitrification in this
study was found to be primarily algal in origin. Export of macrophytic plant material
from the vegetated marsh to creekbottom sediments is known to be small (Wolaver et ai,
1983; White and Howes, 1994b). Further, in the present study, the molar C/N ratio of
C02 and N fluxes from the sediments (6.1; Figure 3.9a), and the 5I3C of sediment organic
C point to an algal source for mineralized N, consistent with recent findings in other salt
marshes based on stable isotope analysis (Page, 1997; Boschker et al., 1999). Exchanges
between creekbottom sediments and tidal water are small, though significant; but the
overall balance is toward export from the marsh (Valiela and Teal, 1979; Smith, 1999).
The only significant input of N to the marsh is groundwater NOx", and it must be this N
which supports creekbottom production of benthic algae, the primary source for labile
sediment organic material. Smith (1999) found that allochthonous denitrification of
groundwater NOx" was enough to account for only a maximum of 70% of N missing from
a tidal exchange budget of Mashapaquit Marsh. Although comparisons of day/night N
budgets and light/dark sediment flux incubations did not support significant
photosynthetic uptake of groundwater NOx", it is probable that benthic algal N uptake,
and subsequent N remineralization and autochthonous denitrification accounted for the
remaining missing N.
98
Since no NO3" efflux from the sediments was observed, autochthonous
denitrification must have been limited by the supply of NO3" through nitrification.
Autochthonous denitrification rates measured in this study (mean 5.2, range 0.2 - 12.6
mmol N m"2 d"1; Table 3.1) were at the high end of the range reported for estuarine
sediments (J0rgensen and S0rensen, 1985; Jenkins and Kemp, 1984; Seitzinger, 1987;
-9 1 Jensen et al., 1996), although rates of up to 5.0 mmol N m" d" have also been reported
from an unpolluted Florida estuary (Seitzinger, 1987). However, high denitrification
rates are most often found in systems receiving high N loads and in sediments with high
organic C contents (J0rgensen and S0rensen, 1985). Denitrification rates as high as 197
mmol N m"2 d"1 have been measured in sediments near a sewage outfall (Trimmer et al,
2000).
The Mashapaquit Marsh creekbottom sediments of this study receive 32 mmol N
m"2 d"1 from the surrounding watershed (Smith, 1999). Two other studies report
denitrification N2 flux rates for embayments in Cape Cod, Mass. Nowicki (1999) found
very low rates ranging from 0.05 - 0.58 mmol N m2 d"1 in an estuary (Towns Cove)
receiving 2.1 mmol N m"2 d"1 from the surrounding watershed (Giblin and Gaines, 1990),
while Lamontagne and Valiela (1995) measured rates up to 17 (mean -3.3) mmol N m"2
d"1 in another marsh estuarine system (Childs River) receiving 35 mmol N m"" d"
(Valiela et al., 1992), similar to denitrification rates in the Mashapaquit Marsh.
In sediments with high labile organic C content, such as in this study, the reducing
potential of the sediments is high, and all NOx" produced in situ is denitrified, while
watercolumn NOx" diffuses into the sediments and is denitrified as well. Nitrate uptake
99

rates in this study were limited by sediment C at high N0X" concentrations (> 300 |iM;
Figure 3.5d). However, there is sufficient labile organic carbon to denitrify in situ levels
of NOx" (43 \iM), and so allochthonous denitrification is primarily controlled by water
column NCV concentration (Figure 3.7a inset) (Smith, 1999).
NOx" uptake and denitrification by sediments only takes place in sediments with
higher 02 consumption rates (> 15 mmol 02 M"2 d"1) (Jensen et ai, 1996; Trimmer et ai,
2000; this study). The NOx" diffusion rate to anaerobic sediment zones in the sediment is
limited by the degree of sediment oxygenation. In muddy sediments, where diffusion
predominates over advection, 02 penetration is inversely related to the 02 uptake rate of
the sediments (Figure 3.8). In sediments with high 02 uptake rates, oxygen diffusiong
into the sediments is depleted quickly, and anaerobic zones are readily accessible to
diffusing NOx".
Within each site (S and M), metabolic rates were related to sediment C
concentrations, but sediment C quality differed between sites (Figure 3.5, Table 3.2).
The organic material at site S was about twice as reactive as that of site M (C-specific 02
consumption 5.3 vs. 2.6 mmol 02 mol"1 C d"'), though half as concentrated (0.55 vs. 1.19
mmol C cm"3), with the result that metabolic fluxes of 02, C02 and autochthonous
denitrification were not significantly different between the sites (p > 0.07). Organic C in
the sandy sediments contained higher proportions of algal C, as indicated by the higher
photosynthetic pigment content of sediment C (8.8 vs. 1.8 |ig mg"1 C). Fresh algal C
likely accounted for more than four times as much of the sediment C in sandy sediments
as in muddy sediments. However, molar C/N flux ratios (6.1) from both sediments were
100

similar to the Redfield algal ratio (6.6). Likewise the 813C valuse of both sediments were
similar and suggestive of algal biomass (Table 3.2). In addition, the slopes of the
responses of metabolic rates to sediment C were similar in both sediments, though the
intercepts were different (Figure 3.5), indicating a similar relationship between the labile
fraction of muddy sediment C and sandy C. Although the mean C/N ratio of sediment
organic materials at both sites was the same (10.1 - 10.7; Table 3.2), a plot of sediment
C/N ratio against sediment C content showed that the C/N ratio declined as sediment C
content declined (unpublished data). Extrapolating the trend back to 0 mmol C cm" for
sandy sediments gives a C/N ratio of 6.9, further confirmation of the elemental
composition of the labile fraction of organic material in these sediments. This pattern
suggests that although the source of the organic material in both sediments was likely
algal, muddy sediments contained a fraction of refractory material not subject to
degradation. Sandy sediments are sites of groundwater intrusion, and this flow likely
prevents the accumulation of refractory material.
Studies comparing "sandy" and "muddy" sediments have generally found lower
metabolic rates in sandy sediments (J0rgensen and S0rensen, 1985; Jensen et al, 1996;
Trimmer et al., 2000). These sediments are usually classified by porosity (mL H20 cm"
sediment) and organic C content (% C), however, these characteristics may be poor
indicators of sediment metabolic activity. Although the % C content of Mashapaquit
Marsh sandy sediments was ~ 10% of that of muddy sediments, the C content of sandy
sediments (mmol C cm"3) was 50% of the C content of muddy sediments (Table 3.2).
Even C content expressed on a volume basis does not adequately describe sediment C
101
characteristics, since as in the present study, the lability of organic C differed between the
sediment types (Table 3.2). My finding of similar rates in both sediment types illustrates
the inadequacy of rough descriptions of sediment characteristics. Two sediments with
the same C content by weight might have very different C contents by volume, especially
when comparing mineral with organic sediments. In this study, I calculated organic C
content as mmol C cm"3 (% C x sediment density). Sediment C lability expressed in units
of 02 or C02 flux per unit of sediment C content facilitates intersystem comparisons of
sediment metabolic potentials.
Temperature appeared to account for a significant proportion of the variability in
02 and C02 fluxes and in denitrification rates (Figure 3.4, r2 = 0.31 - 0.87), though it was
not possible to separate temperature from other seasonal effects. Although the absolute
concentration of sediment organic C did not vary seasonally (unpublished data), it is
likely that seasonal cycles of algal production had an effect on the lability of sediment C
pools. Other seasonal effects which could be confounded with temperature include
benthic irrigation and sediment redox state. Nonetheless, assuming that the temperature
effect was a direct one, it would correspond to a Q,0 for each reaction of from 1.6-2.0,
similar to those reported in the literature for estuarine sediments (Q10 for 02 consumption
= 2.7, J0rgensen and S0rensen, 1985; Q10 for denitrification = 2.1, Zimmerman and
Benner, 1994). Other studies have found spring maxima for denitrification, in contrast to
my late summer maximum (J0rgensen and S0rensen 1985; Nowicki 1999). A spring
maximum indicates the predominance of non-temperature seasonal factors in controlling
metabolism (i.e. spring algal blooms), whereas my findings may support the
102

predominance of temperature-driven seasonal effects in this salt marsh creekbottom.
Nonetheless, the temperature effect for denitrification was weak (r < 0.37), indicating a
greater potential role for seasonal or other effects.
High groundwater NOx~ loads to the creekbottom sediments of Mashapaquit
Marsh likely lead to high algal production rates and high concentrations of labile organic
matter in the sediments. Degradation of this organic material supports high rates of O2,
CO?, and N cycling, including denitrification of water column NOx" and half of the
regenerated N. Allochthonous denitrification contributes significantly to total
denitrification (39%). Denitrification is also a significant contributor to the total
metabolism of these salt marsh sediments, contributing nearly 20% to the cycling of C
andO.
103
CHAPTER 4
Competition Between Plant Uptake and Coupled Nitrification-Denitrification for
NH4+ Measured in situ in Salt Marsh Sediments
104
Abstract
Spartina alterniflora is the dominant plant of Atlantic coastal salt marshes of the
USA. The N cycle of the vegetated marsh tends to retain N through a close coupling of
remineralization and plant uptake, with denitrification a major pathway for N loss. I
studied the competition between plant uptake and nitrification-denitrification as it relates
to patterns of short-term nitrogen retention and loss in a New England S. alterniflora
marsh, Great Sippewissett Marsh, Massachusetts. An in situ 15-N ammonium (15NH4+)
tracer approach was used in natural marsh, in plots receiving long-term nitrogen loading
(>27 yr), and in hydrologically-controlled greenhouse lysimeters. In natural marsh areas
during the growing season, the short-term fate of NH4+ was dominated by plant uptake,
which accounted for 66%, while denitrification accounted for 34% of remineralized N.
However, in the winter the situation was reversed, with denitrification dominating.
Although N addition stimulated plant growth (3-fold), consequent sediment oxidation and
increased availability of NH4+ resulted in a competitive shift toward the bacterial
9 -1 nitrifying-denitrifying community. Under high N addition rates (15.5 mol m" yr" ),
denitrification accounted for 72% of the short-term fate of NH4+ and 95% over the long-
term. Based upon seasonal measurements of l5NH4+ loss, an approximate annual rate of
denitrification was calculated of 0.73 mol N m"2 yr"1 (0.7 - 12.2 mmol N m"2 d"1) and 12.6
mol N m"2 yr"1 (11.1 - 136 mmol m"2 d"1). Deeper water table excursions in
hydrologically-controlled laboratory lysimeters oxidized the sediment, increasing plant
growth rates by 2 - 3-fold. Plant growth was suppressed in flooded treatments by high
porewater S"2 (~ 5 mM), making the excess NH4+ available for coupled nitrification-
105

denitrification. The importance of plant growth and tidal inundation in controlling the N
cycle in regularly flooded salt marsh sediments emphasizes the need for in situ
techniques to measure denitrification and N cycling.
Introduction
High primary production and position at the interface between land and sea make
salt marshes important transformers of N (Nixon, 1980). Regularly flooded peats of the
rhizomatous grass Spartina alterniflora make up nearly 50% of the area of a New
England salt marsh, and plant-mediated transformations of N dominate the N cycle of
these areas (Valiela and Teal, 1979; White and Howes, 1994a). Nearly monospecific
stands of S. alterniflora colonize the tidal low marsh because S. alterniflora is
particularly well adapted to the stresses of salinity fluctuations and sediment anoxia
(McGovern et al., 1979; Howes and Teal, 1994). Although the marsh sediments are high
in NH4+, productivity is limited by N availability (Sullivan and Daiber, 1974; Valiela and
Teal, 1974). This apparent paradox stems from the inhibition of plant N uptake by S~2, a
by-product of microbial S04"2 reduction in the sediments (Howes et al, 1981;
Mendelssohn et al, 1981). This inhibition can be overcome by N fertilization, but within
the salt marsh, S. alterniflora productivity is naturally higher along the creek banks,
where porewater drainage promotes air entry leading sediment S~2 oxidation (Howes and
Goehringer, 1994). High productivity causes a shift in the growth form of the plant, from
the 10 cm high short form to the >lm high tall form. In long-term N fertilization
experiments, short-form S. alterniflora stands grew to resemble the tall form of the plant
106
(Valiela et al., 1978). Overcoming the N limitation of plant growth played a role in this
transformation, but growth was further stimulated by a positive feedback between plant
growth and sediment aeration (Howes et ah, 1986). In the short S. alterniflora marsh,
away from the creek banks, drainage of the peat sediments in between tidal inundations is
negligible. The main route for water loss from the sediments is evapotranspiration,
which allows air to enter and oxidize the sediment (Dacey and Howes, 1984). When
plant growth is stimulated by N addition, evapotranspiration increases sediment
oxidation, further stimulating plant growth (Howes et al 1986).
A recent N budget for the short S. alterniflora areas of Great Sippewissett Marsh,
Massachusetts, USA shows an N cycle dominated by N remineralization and plant uptake
with annual plant N demand twice the rate of N fixation, the dominant source of new N to
this marsh (White and Howes, 1994a). Remineralization of NH4+ from decaying plant
biomass in the sediments is the major source of substrate to support coupled nitrification-
denitrification, the largest N loss term (White and Howes, 1994a). Nitrification competes
with plant uptake for remineralized NH4+, accounting for as much as 25% of the -1.1
mol N m"2 yr' total remineralized in plant biomass, and removing it from the pool
available for plant uptake.
Denitrification is acknowledged as an important flux in salt marsh N cycling, but
measuring its contribution has proved difficult. Autochthonous denitrification in
vegetated marsh sediments involves the remineralization of NH4+ within the sediments,
diffusion to aerobic zones where nitrification can take place, followed by subsequent
diffusion of nitrification-produced N03" to anaerobic zones for denitrification (Patrick
107
and Reddy, 1976). Since denitrification represents a gaseous loss of N, it has often been
measured as the difference between inputs and outputs in a mass balance approach, but
the compounding of errors when many terms are summed makes this approach subject to
uncertainty (White and Howes, 1994a). Direct measurements of denitrification have
been made using a variety of in vitro techniques. The acetylene block technique was
sufficient to demonstrate denitrification potential in sediments, but because acetylene
blocks nitrification as well as denitrification, it is inadequate for measuring coupled
nitrification-denitrification rates (Van Raalte and Patriquin, 1979; Koch et al. 1992). In
addition, inhibition by acetylene is sometimes incomplete in the presence of S"2
(S0rensen et al, 1987). More recently, 15N isotopic tracer methods have been developed
which allow the measurement of nitrification and denitrification through isotope dilution
and recovery of reaction products. These techniques have been used on plant-free
sediment cores, but such studies leave out the important structuring effects of plant
metabolism on N cycling (Abd. Aziz and Nedwell, 1986; DeLaune et al, 1998). Oxygen
transport to the roots of aquatic macrophytes can create aerobic rhizospheres of high
surface area which promote coupled nitrification-denitrification (1989).
In order for measurements of coupled nitrification-denitrification rates to
accurately reflect rates in natural vegetated marsh sediments, the sensitivity of
nitrification-denitrification to plant N uptake rates, tidal inundation frequency and
sediment oxidation state must be considered. This requires in situ measures of
denitrification under normal conditions of tidal inundation, light, redox conditions, and
sub-surface hydrology. Kaplan et al (1979) measured N2 evolution into He headspaces
108

in sediments enclosed in bell jars (8 cm dia.), but their method involved the removal of
aboveground biomass, alteration of sediment hydrology, and short incubations in dark
enclosures. White and Howes (1994a), in their study of long-term N retention in salt
marsh sediments, used injected NH4+ as a tracer in undisturbed sediments. Comparing
losses in field and laboratory lysimeters, they found that losses to tidal waters and
through subsurface drainage were insignificant, and that losses were attributable to
denitrification. By the third day after labeling, the original label had been either
denitrified or taken up into biomass, and subsequent losses were slow and due to
remineralization of biomass-incorporated label. The picture that emerged supported the
contention that plants were able to out-compete the bacterial nitrifying-denitrifying
community for inorganic N, but that the bacterial pathway was significant in N removal
from vegetated sediments. However, the processes which controlled this competition
remained unclear.
In the present study, I use an in situ 15NH4+ tracer approach to determine the
seasonal pattern of the short-term (days) fate of inorganic nitrogen within S. alterniflora
sediments, primarily with regard to the partitioning of regenerated N between plant
uptake and nitrification-denitrification reactions. In addition, I assess the role of N
availability and sediment oxidation on this plant-nitrifier competition both in marsh plots
receiving long-term fertilization, and in lysimeters where sediment oxidation status was
manipulated through hydrological regimes.
109
Methods
Site Description
The study was conducted at Great Sippewissett Marsh (Cape Cod, Massachusetts,
USA). This marsh is dominated by short-form S. alterniflora growing in near
monospecific stands on the marsh plain and tall-form S. alterniflora growing along
creekbanks. The sediments consist of a highly organic peat (28.5% C) typical of New
England salt marshes (Redfield, 1972). Measurements were made in stands of 5.
alterniflora similar to those previously investigated in this salt marsh (Valiela and Teal,
1979; White and Howes, 1994a). Field measurements of coupled nitrification-
denitrification and plant N incorporation were made using an l5NH4+ tracer in
undisturbed sediments of short-form S. alterniflora and in plots receiving N fertilization
during the growing season for the past 27-31 years (Valiela et al., 1976; Valiela et al.
1985). Fertilized plots were treated with 1.7 (LF), 5.2 (HF), or 15.5 (XF) mol N m"2 yf\
71% as pelletized sewage sludge (Milorganite; 10% N) and 29% as urea ten times each
growing season (May-September).
Sediments of unfertilized and XF fertilized plots ("fertilized plots") differed in N
availability and sediment oxidation (Table 4.1). Mean KCl-extractable NH4+
concentrations in fertilized sediments were 5 times, and total N content was twice that of
unfertilized sediments. Water table excursions in fertilized sediments were > 3 times
those of control sediments, due to increased plant growth and evapotranspiration, while
porewater S" concentrations were reduced to more than one fifth the levels of
unfertilized sediments as a result of the concomitant air entry and sediment oxidation.
10
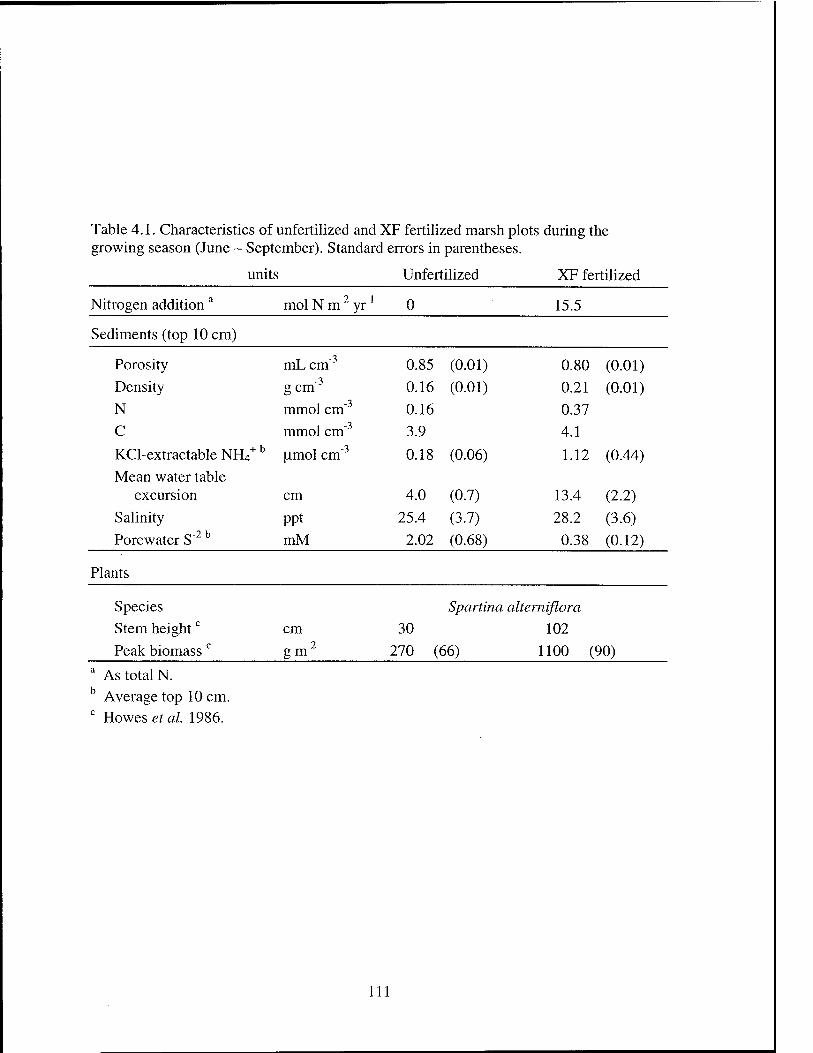
Table 4.1. Characteristics of unfertilized and XF fertilized marsh plots during the growing season (June - September). Standard errors in parentheses.
units Unfertilized XF fertilized
Nitrogen addition a mol N m"2 yr"1 0 15.5
Sediments (top 10 cm)
Porosity mL cm"3 0.85 (0.01) 0.80 (0.01) Density gem"3 0.16 (0.01) 0.21 (0.01) N mmol cm" 0.16 0.37 C mmol cm"' 3.9 4.1
KCl-extractable NH4+ b -3
[imol cm" 0.18 (0.06) 1.12 (0.44) Mean water table
excursion cm 4.0 (0.7) 13.4 (2.2) Salinity ppt 25.4 (3.7) 28.2 (3.6) Porewater S~2 b mM 2.02 (0.68) 0.38 (0.12)
Plants
Species Spartina alterniflora Stem heightc cm 30 102 Peak biomass c gm"2 270 (66) 1100 (90)
a As total N. b Average top 10 cm. c Howes et al. 1986.
Ill
In Situ Tracer Injection:
Field work: Denitrification was measured as coupled nitrification-denitrification
("denitrification") using 15NH4+ as a tracer, in a modification of the method of White and
Howes (1994a). The tracer was injected into undisturbed marsh sediments, and its
retention followed in sediment cores taken over a timecourse of 1 - 5 days, with
measurements concentrated in the first 24 hours. All work was performed from
boardwalks to avoid alteration of the marsh surface. Experiments were performed in
unfertilized sites on 7 dates; on 5 of these, simultaneous measurements were made in
fertilized plots. A solution of I5NH4C1 was line-injected (20 ga. needle), through the top
10 cm of sediment. Up to 14 such injections were made at each site -0.5 m apart, and the
injection point marked. At each time point, two injection sites were randomly chosen and
a 20 cm dia area of aboveground biomass centered on the injection site was harvested.
The sediment was collected using a piston corer (6.5 cm dia.) centered on the injection
site. In the field the sediment cores were immediately sectioned into 3 layers of 5 cm
thickness each, down to 15 cm depth. Each section was further cut into 4 pieces (to
increase surface area for freezing), placed in labeled bags, and immediately packed in dry
ice to stop biological activity. Two cores were taken immediately after tracer injection to
calibrate T0 tracer recovery. Another 2 uninjected cores were collected to measure the
natural abundance of 15N. Three replicate cores were collected for determination of KC1-
extractable NH4+. Porewater samples for salinity and S 2 determinations were collected
using sippers (Howes et al, 1985). The rate of water table drop due to evapotranspiration
was determined in 1 cm dia. wells (N = 3 per site) (Dacey and Howes 1984). All holes
12

created by core removal were immediately filled with sediment cores from an adjacent
area to prevent disturbance of the water table and air entry. However, since the specific
yield of sediment porewater is only 1 - 3% of the total water content of the sediments
(Dacey and Howes, 1984), and since injected I5NH4+ rapidly exchanges with "bound"
porewater and sorbed NH4+ pools (White and Howes, 1994a), significant advection of the
tracer due to disturbance of the water table is unlikely.
Method validation: The concentration and injection method of the 15N tracer were
chosen to minimize physical and biogeochemical disturbance of the sediment system.
"NH4+ solution (0.82 mL cm"1) was injected into the sediments, adding < 3% to the water
content of a 6.5 cm dia. sediment core. The solution contained 4.1 - 5.4 umol 15NH4+ cm"
', or about 0.1% of the total sediment N mass, sufficient to bring the 15N content of the
recovered sediment from 0.36 atoms % to ~ 0.46 at. %. Since the KCl-extractable NH4+
content of the sediments ranged from 0.06 - 0.23 umol N cm"3 in control sediments to
0.16 - 1.8 p.mol N cm"3 in fertilized sediments, it was necessary to increase the KCl-
extractable NH4+ pool by an average of 106 ± 22% in control and 36 ± 16% in fertilized
sediments in order to significantly affect the 15N ratio of the total sediment N pool.
Time 0 recovery of the tracer in 6.5 cm dia. cores harvested immediately after
injection was 95.5 ± 3.9% in unfertilized and 95.6 ± 1.3% in fertilized sediments (Table
4.2). Since the injection was started at 10 cm depth, some of the tracer was recovered at
the top of the lower 10 - 15 cm depth layer. The pattern of tracer recovery was
113

Table 4.2 T0 recovery (%) of injected l5N tracer in 6.5 cm dia. sediment cores in control and XF fertilized saltmarsh plots. Standard errors in parentheses.
% Controla XF fertilized' 0-5 35.4 (4.1) 39.5 (3.1)
5-10 42.0 (4.0) 51.5 (3.1)
10-15 18.5 (2.0) 5.8 (0.8)
Subtotal 95.5 (3.9) 95.6 (1.3)
Outerc 8.6 (3.8) 4.7 (1.3)
Total 104.1 100.3 a N = 12 b 15.5molNm"2yr''.N= 10
10 cm dia. outer core taken around 6.5 cm dia. inner core. N = 6.
14

consistent within sediment type (control or fertilized), with 18.5 + 5.5% recovered in the
10 - 15 cm depth interval in control sediments, and 5.8 ± 1.2% recovered at that interval
in fertilized sediments. The To recovery of tracer indicates that most of the injected tracer
is recovered within a 3.25 cm radius of the injection point and that no appreciable loss of
tracer due to denitrification or material loss takes place during sediment core sampling
and processing. This was confirmed by sampling a 10 cm dia. core with a 6.5 cm dia.
inner core on 3 sampling dates. At To, an average of 8.6 + 3.8% and 4.7 ± 1.3% of the
label was recovered outside of the 6.5 cm dia. sample core in control and fertilized
sediments respectively. At the end of the timecourse, another such set of 10 cm dia.
cores were taken, and the total amount of tracer which migrated out of the 6.5 cm dia.
sampling area was determined by extrapolation using the experimentally-determined
denitrification rate. Tracer migration averaged 3.9 ± 2.0 % d"1 (N = 6) in control
sediments, and 2.3 ±1.6% d"1 (N = 4) in fertilized sediments over the 1 - 2 d timecourse
of these experiments.
Another possible route for tracer loss is exchange across the sediment-water
interface during tidal inundation. Earlier work showed that losses and vertical
distribution of the tracer did not differ between field injections and laboratory lysimeters
where tidal losses could not occur (White and Howes, 1994a). In order to further
examine this possibility, tracer loss during periods of tidal inundation was compared with
the loss during low tide exposure of the marsh sediments. Losses during inundation were
only 0.6% d"1 higher than losses during exposure, and the difference was not significant
(paired t-test, 1 tailed, N = 7, p = 0.50).
115
Hydrologically-ControlledLysimeters
In the salt marsh, water table excursions result from evapotranspiration during
periods of tidal exposure of the vegetated marsh sediments. In this experiment, water
tables were allowed to drop to 5 predetermined levels, before distilled water was added to
return the water table to the surface. Sediment cores (20.3 cm dia.)were collected, tightly
fitted into lysimeters with side arms to monitor water-table level (White and Howes,
1994a), and maintained in a greenhouse. Five cores were randomly assigned to each of 5
hydrological treatments (0, 5, 10, 15, and 20 cm). These cycles of water table excursions
were repeated throughout the experiment. S. alterniflora leaves were periodically rinsed
with distilled water (and the water returned to the sediment) to remove accumulated salts.
Sediments were collected in May, and held in the greenhouse under water table
treatments for 55 days before addition of l5NH4+. On ten days during days 56 to 66,
' NH4+ (5.7 (imol cm"1) was line-injected into the top 15 cm of sediment as in the field
studies. Injections were made at three equally-spaced points within the lysimeter. On the
following day, the injection sites were shifted by 60° so that the label was distributed
evenly throughout the sediment. On day 67, the aboveground biomass was harvested and
prepared for l5N determination (see below). Porewater samples for S"2 analysis were
withdrawn at 5 cm intervals using sippers, and fixed immediately. Each lysimeter was
then sectioned at 5 cm intervals, and placed in a -20 °C freezer. Any porewater or
sediment that remained after core processing was retained for l3N determination. The
sediments were then prepared and assayed as in the field l5N studies.
116

Sample preparation
For all of the 15N experiments, frozen core sections were broken into <15 cm3
pieces, and placed in plastic cups. The pieces were covered with 0.2 N H2S04 and
extracted at 4 °C for 24 hours, lowering the pH of the thawed pieces to < 2. The acid
solution prevented volatilization of 15NH4+ during drying, and inhibited biological
activity during sample processing. After acidification, the cups were placed in a
convection oven at 60 °C and dried to constant weight (~ 48 h). Aboveground biomass
samples were dried (60 °C) and weighed. Acidified sediment and aboveground biomass
was ground in a Cyclotec mill to < 0.5 mm, and subsampled for total N and l5N content
determination on a mass spectrometer (Stable Isotope Facility, University of California,
Davis). Subsamples of sediments were assayed for KCl-extractable NH4+ (see below).
Calculations
All sediment core sections were weighed before and after drying to determine
porosity and dry density. The total mass of l5N recovered in the samples was determined
from the total N content and the abundance of l5N. The natural abundance of l5N,
determined from parallel unlabelled cores, was subtracted in order to determine the
amount of recovered tracer N. Uptake of tracer into aboveground biomass averaged
2.5%. For purposes of calculating the denitrification tracer loss, this translocated 15N was
assigned to each of three sediment depth horizons (0-5 cm, 5-10 cm, 10-15 cm)
according to the relative abundance of live biomass (80, 15, and 5%, decreasing with
depth), calculated from the data of White and Howes (1994a). Corrections were also
made for the migration of tracer outside of the 6.5 cm dia. sampling area (see above). As
117

15NH4+ is removed from the total NH4
+ pool, the rate of tracer loss would be expected to
decline, since over time, the tracer makes up a decreasing proportion of the total NH4+
pool. For this reason, on theoretical grounds, tracer loss should follow an exponential
decay curve:
N^Noe™ (1)
where N, is the amount of tracer remaining after time t, N0 is the initial amount, and k is
the rate constant. The linear transform of this equation:
N, = -kt + \n(N0) (2)
allows for a least squares fit to the data. The initial rate of tracer loss (R0) can then be
determined by taking the first derivative of (1) and solving for t = 0.
Ro = -k N0 Q)
However, in practice, a linear model was sometimes found to be a better fit to the initial
24 hr of data. Accordingly, the best fit model was used. Tracer loss (% d"1) was then
multiplied by the KCl-extractable NH4+ pool (in unamended sediments) to arrive at the
total coupled nitrification-denitrification rate.
Nitrogen Retention in Fertilized Marsh Plots
Just prior to the beginning of the yearly fertilization, two 30 cm long cores (6.5
cm dia.) were removed with a piston corer from pairs of experimental plots (control, and
3 levels of fertilization). The cores were sectioned (2 cm down to 10 cm depth, 5 cm
thereafter), dried (60 °C) to constant weight, and a subsample ground and analyzed for
118
particulate N (see Analytical, below). N retention was determined by subtracting the N
content of control sediments from fertilized sediments.
Analytical
Particulate carbon and N were determined on a Perkin-Elmer 2400 elemental
analyzer. Salinity was measured using a calibrated YSI conductivity meter. KC1-
extractable NH4+ was determined by extraction with 2N KC1 (adjusted to pH < 2) for 24
hr, followed by sterile filtration and analysis of NH4+ by a colorimetric indophenol
method (Scheiner, 1976). Porewater S~~ was analyzed colorimetrically (Cline 1969).
Results
In Situ NH/ Tracer Studies
Short-term timecourses of 15NH4+ tracer yielded a temporal pattern consistent
with coupled nitrification-denitrification losses, and were used to calculate in situ
denitrification rates (Figure 4.1, Table 4.3). Incorporation of 15NH4+ tracer into plant
biomass eventually removed all the 15N from the NH4+ pool, preventing further short-
term loss through nitrification-denitrification. Although tracer was injected (~6 - 19% of
total, Table 4.2) into the bottom (10-15 cm) sediment layer, mean tracer loss at this
depth was not significantly different from 0 (control sediments mean = -1.9 ± 2.0 % d1,
z test, p = 0.16, fertilized sediments mean = 4.6 ± 9.8 % d"1, z test, p = 0.08).
Partitioning of the label between the upper two depth layers was sometimes highly
variable (Figure 4.1a); however, when recoveries in the two layers were pooled, a good
119
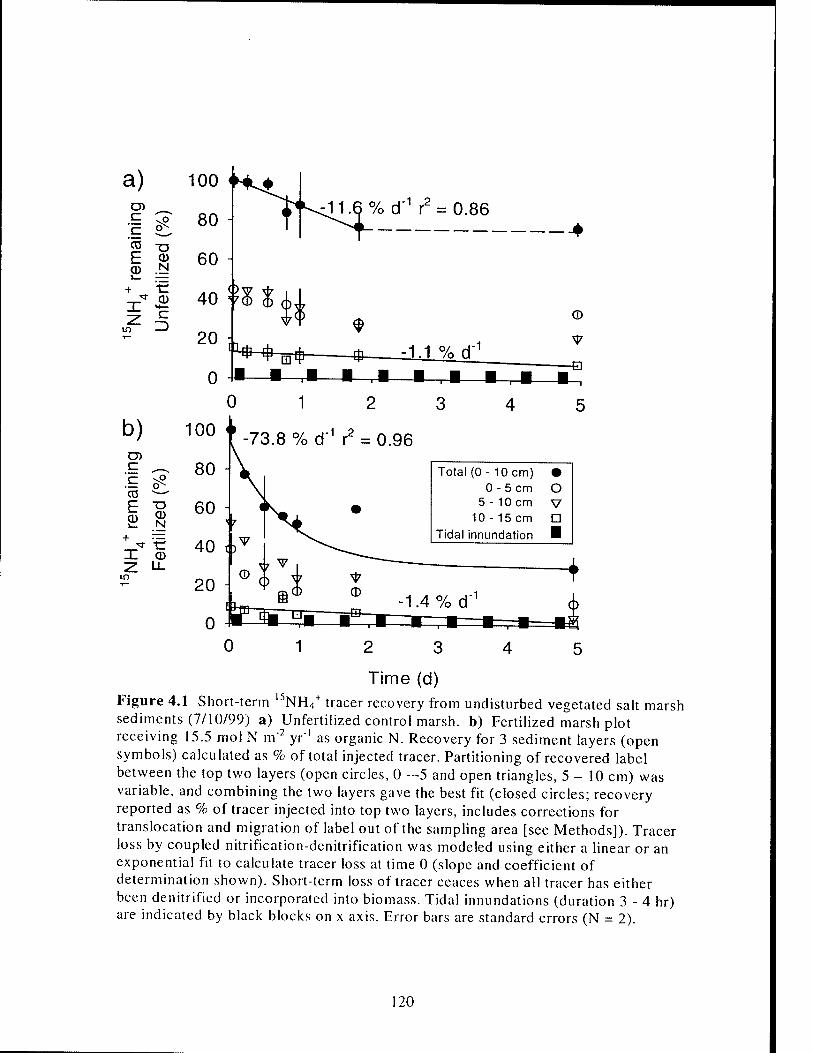
a) O)
CO T> r- CD <D N
— + ■c
^t CD
100
80
60
40
20
0
% d"1 r2 = 0.86
'^cb
IL*-*W+ zU%d"1
®
b) c
cd E CD
0 1 2
-73.8 % d"1 r2 = 0.96
CD N
X CD
in
Total (0- 10 cm) • 0 - 5 cm O
5 - 10 cm V 10 - 15 cm □
Tidal innundation ■
+
o 1
Time (d) Figure 4.1 Short-term 15NH4
+ tracer recovery from undisturbed vegetated salt marsh sediments (7/10/99) a) Unfertilized control marsh, b) Fertilized marsh plot receiving 15.5 mol N m"2 yr"1 as organic N. Recovery for 3 sediment layers (open symbols) calculated as % of total injected tracer. Partitioning of recovered label between the top two layers (open circles, 0 —5 and open triangles, 5-10 cm) was variable, and combining the two layers gave the best fit (closed circles; recovery reported as % of tracer injected into top two layers, includes corrections for translocation and migration of label out of the sampling area [see Methods]). Tracer loss by coupled nitrification-denitrification was modeled using either a linear or an exponential fit to calculate tracer loss at time 0 (slope and coefficient of determination shown). Short-term loss of tracer ceaces when all tracer has either been denitrified or incorporated into biomass. Tidal innundations (duration 3 - 4 hr) are indicated by black blocks on x axis. Error bars are standard errors (N = 2).
120
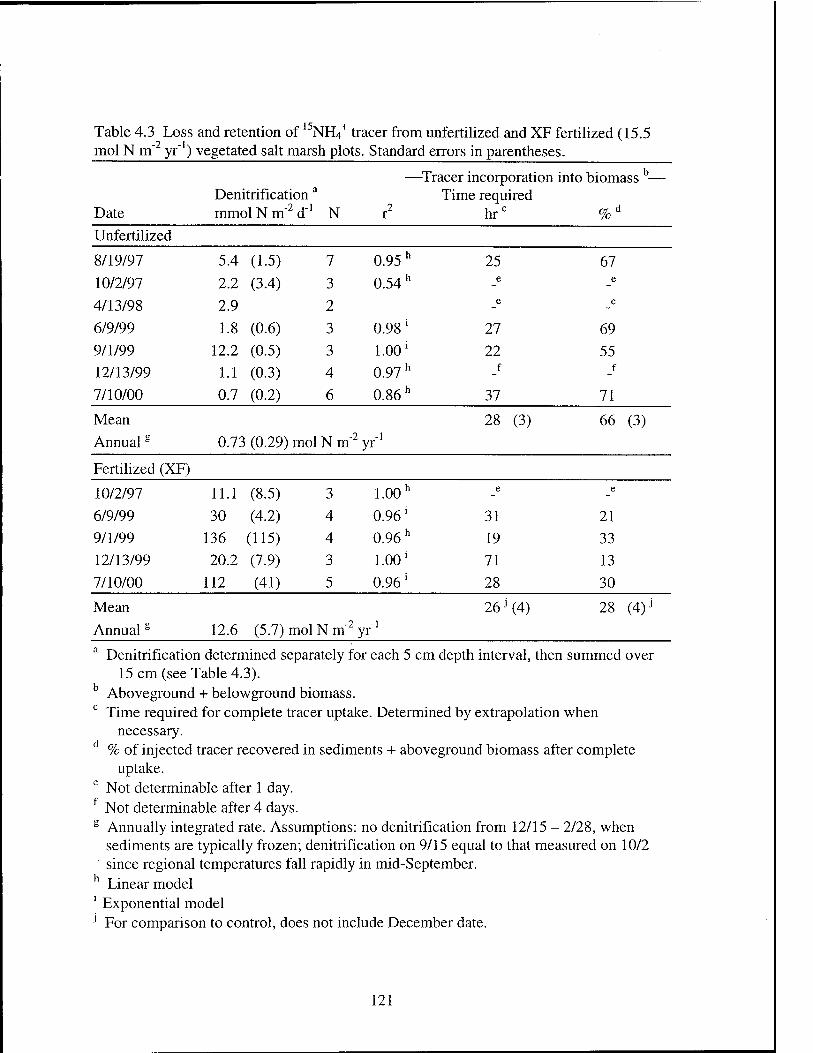
Table 4.3 Loss and retention of 15NH4+ tracer from unfertilized and XF fertilized (15.5
mol N m" yr" ) vegetated salt marsh plots. Standard errors in parentheses.
Date Denitrification £
mmol N m~2 d"1
i
N r2
-Tracer incorporation into biomass b— Time required
hrc %d
Unfertilized
8/19/97 5.4 (1.5) 7 0.95 h 25 67 10/2/97 2.2 (3.4) 3 0.54 h e e
4/13/98 2.9 2 e e
6/9/99 1.8 (0.6) 3 0.98* 27 69 9/1/99 12.2 (0.5) 3 1.00' 22 55 12/13/99 1.1 (0.3) 4 0.97 h f f
7/10/00 0.7 (0.2) 6 0.86 h 37 71
Mean 28 (3) 66 (3)
Annual s 0.73 (0.29) mol N m" V Fertilized (XF)
10/2/97 11.1 (8.5) 3 1.00 h e e
6/9/99 30 (4.2) 4 0.96' 31 21 9/1/99 136 (115) 4 0.96 h 19 33 12/13/99 20.2 (7.9) 3 1.00' 71 13 7/10/00 112 (41) 5 0.96' 28 30
Mean 26j (4) 28 (4)J
Annual s 12.6 (5.7) mol Nm"2 yr"1
a Denitrification determined separately for each 5 cm depth interval, then summed over 15 cm (see Table 4.3).
Aboveground + belowground biomass. c Time required for complete tracer uptake. Determined by extrapolation when
necessary. d % of injected tracer recovered in sediments + aboveground biomass after complete
uptake. e Not determinable after 1 day. f Not determinable after 4 days. g Annually integrated rate. Assumptions: no denitrification from 12/15 - 2/28, when
sediments are typically frozen; denitrification on 9/15 equal to that measured on 10/2 since regional temperatures fall rapidly in mid-September.
h Linear model 1 Exponential model 1 For comparison to control, does not include December date.
121
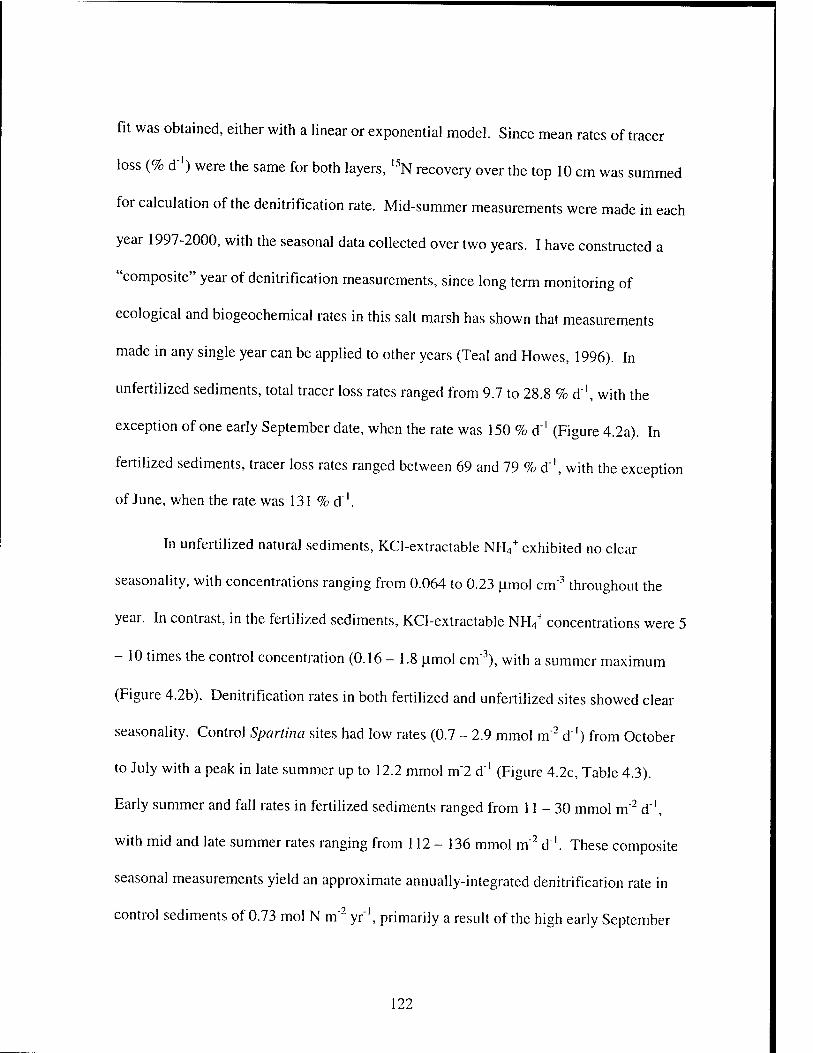
fit was obtained, either with a linear or exponential model. Since mean rates of tracer
loss (% d"1) were the same for both layers, l5N recovery over the top 10 cm was summed
for calculation of the denitrification rate. Mid-summer measurements were made in each
year 1997-2000, with the seasonal data collected over two years. I have constructed a
"composite" year of denitrification measurements, since long term monitoring of
ecological and biogeochemical rates in this salt marsh has shown that measurements
made in any single year can be applied to other years (Teal and Howes, 1996). In
unfertilized sediments, total tracer loss rates ranged from 9.7 to 28.8 % d"1, with the
exception of one early September date, when the rate was 150 % d"1 (Figure 4.2a). In
fertilized sediments, tracer loss rates ranged between 69 and 79 % d"1, with the exception
of June, when the rate was 131 % d"1.
In unfertilized natural sediments, KCl-extractable NH4+ exhibited no clear
seasonality, with concentrations ranging from 0.064 to 0.23 plmol cm"3 throughout the
year. In contrast, in the fertilized sediments, KCl-extractable NH4+ concentrations were 5
- 10 times the control concentration (0.16-1.8 pjnol cm'3), with a summer maximum
(Figure 4.2b). Denitrification rates in both fertilized and unfertilized sites showed clear
seasonality. Control Spartina sites had low rates (0.7 - 2.9 mmol m"2 d"1) from October
to July with a peak in late summer up to 12.2 mmol m"2 d"1 (Figure 4.2c, Table 4.3).
Early summer and fall rates in fertilized sediments ranged from 11 - 30 mmol m'2 d"1,
with mid and late summer rates ranging from 112 - 136 mmol m"2 d"1. These composite
seasonal measurements yield an approximate annually-integrated denitrification rate in
control sediments of 0.73 mol N m'2 yr"1, primarily a result of the high early September
122
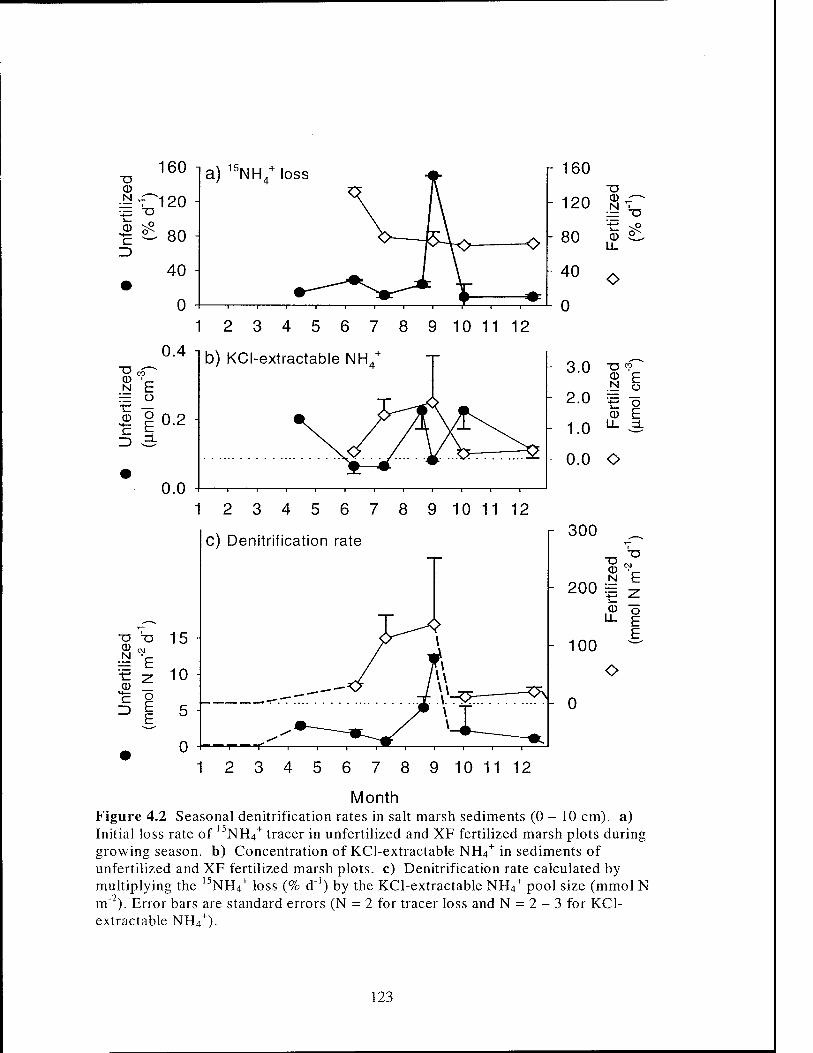
160 i„\ is U CD
1^80 3
1 2 3 4 5 6 7 8 9 10 11 12
0.4
CD '_ N E
r= O
® B 0.2 - C b
0.0
T3 "a 15 CD N F
-t—• T7 10 CD
3 o E 5
0
b) KCI-extractable NH4+
-| 1 1 r- "T r-
1 2 3 4 5 6 7 8 9 10 11 12
c) Denitrification rate
3.0
2.0
1.0
0.0
300
"O 9 CD F
■c o CD E
LL =L
o
200 ■= N E
- 100 E
O
0
1 2 3 4 5 6 7 8 9 10 11 12
Month Figure 4.2 Seasonal denitrification rates in salt marsh sediments (0 - 10 cm), a) Initial loss rate of 15NH4+ tracer in unfertilized and XF fertilized marsh plots during growing season, b) Concentration of KCI-extractable NH4+ in sediments of unfertilized and XF fertilized marsh plots, c) Denitrification rate calculated by multiplying the 15NH4
+ loss (% d"1) by the KCI-extractable NH4+ pool size (mmol N
m"~). Error bars are standard errors (N extractable NH4
+). 2 for tracer loss and N = 2 - 3 for KC1-
123
rate, and 12.6 mol N rn yf in the fertilizedgrass stands (receiving 15.5 mol N m"2 yr"1)
(see Table 4.3 for calculation of annual rate).
The time required for complete tracer uptake during the growing season averaged
slightly over 24 hr in both sediments (Table 4.3). Only incubations of sufficient duration
to "fix" the 15NH4+ (until recovery plateaued - Figure 4.1)) could be used in this analysis
(April and October incubations were excluded). Total short-term retention of tracer in
biomass (aboveground + belowground) was 66% in unfertilized plots during the growing
season, with the balance, 34%, being denitrified (Table 4.3). However, in the fertilized
plots, denitrification losses accounted for 72% of the available N, while only 28% was
retained in biomass. In unfertilized grass stands, summer short-term biomass N retention
was predominately (92%) in the below ground pool (Figures 4.3a and 4.3b). However, in
fertilized stands, translocation of N into aboveground biomass in late summer was high,
accounting for 34% of the total biomass retention. Short term belowground retention of
NH4+ during the growing season in fertilized plots averaged 21%, significantly lower
than the 61% retained in unfertilized plots (Figure 4.3a). There was no belowground
biomass l5N uptake in unfertilized marsh plots during the winter, but 17% of the tracer
was retained in fertilized sediments. Translocation of l5N into aboveground biomass was
higher in fertilized sediments than in unfertilized, but showed the same seasonality, with
low translocation early in the summer peaking in July, and declining to 0 by December
(Figure 4.3b).
In the l5N tracer injections in the field plots, the size of the KCl-extractable NH4+
pool was increased by 106% in unfertilized plots and by 36% in the fertilized plots by the
124

a) ■o ^5 3 o a5 rr> u ^ (.0 o "l—' en -z.
J3 LO
E o i_
ci> c o
-r -4—»
o 1_ SI CD CD
b) CD Ü CO \°
■4—» o -
z CO CO
»+— cc O b c o o _Q
en O C) C o 3 to o £_ m CD CD
-*—» > £ o
o CD CO
■4-* o tr r u SZ CO
75 1
50
15
12
0
Unfertilized Fertilized
25
0 6 8 10 11 12
7 8 9 10
Month
11 12
Figure 4.3 Short term retention of 15NH4+ tracer in biomass. a) Belowground
biomass. b) Aboveground biomass.
125

addition of the NH4+ tracer. This was necessary in order to have a sufficiently large
isotope signal against the large N background of the sediments. While this short-term
increase in N availability likely stimulated denitrification rates, neither the calculated
rates nor the partitioning of tracer measured in this study were affected by the increase in
the size of the NH4+ pool. The results of measurements in the fertilized plots show that
both plant N uptake and denitrification increase with increased N availability. However,
as shown above, the proportion of added N that is denitrified increases from 34% to 72%
as N loading increases from control levels to XF fertilized levels. In the unfertilized
sediments, the daily loading rate of remineralized N was 6 mmol m"2 d"1 (calculated from
the annual remineralization rate of White and Howes [1994a] adjusted for the growing
season based on the annual respiration curve of Howes et al. [1984]). The annual
fertilizer N loading to the XF plots was 15.5 mol N m"2 yr"1. This represents a daily N
load during the 100 d period of N fertilizer application of 155 mmol m"2 d"1, for a total of
161 mmol m"2 d"1 (fertilizer + remineralization N loading). This is a conservative
assumption, since sediment N remineralization in the fertilized plots is likely higher than
in the unfertilized plots). Therefore the increase in the partitioning of available N into
denitrification can be expressed as 0.25% per mmol m"2 d"1 increase in N loading.
Although the l5NH4+ injection increased the KCl-extractable NH4
+ pool by 36%, and may
have temporarily increased denitrification rates by a similar amount, this addition of
tracer represents an N load to the sediments of only 14 mmol rn 2 d"1, or a < 4% increase
in the partitioning of N to denitrification. Similarly, although the tracer injection
increased the KCl-extractable NH4+ pool in the unfertilized sediments by an average of
126
106%, the error introduced into measurements of N partitioning was, as for the fertilized
plots, < 4%.
In the short-term, increases in N availability result in increases in plant N uptake
and denitrification. As shown above, the partitioning of N between plants and nitrifiers is
not significantly altered by the tracer injection levels used in this study. Therefore, under
the conservative assumption that denitrification increases proportionally to the increase in
the KCl-extractable NH4+ pool caused by the tracer addition, the proportional loss of the
tracer (% d"1) will be the same as the loss in an unlabeled sediment. The proportional
tracer loss (% d"1) also remains constant despite probable heterogeneity in the distribution
of the injected 15NH4+ tracer because the same proportion of the label is lost regardless of
the ratio of labeled 15NH4+ to background I5NH4
+. Since the proportional loss of tracer is
a conservative property, the correct denitrification rate can be calculated simply by
multiplying the proportion of the tracer lost to denitrification by the original size of the
KCl-extractable NH4+ pool, the approach used in this study.
Hydrologically- Controlled Lysimeters
In hydrologically-controlled laboratory lysimeters, manipulation of water table
excursion levels affected sediment oxidation state which in turn affected aboveground
biomass growth rates (Figure 4.4). Sulfide concentrations in the top 5 cm of sediment
were highest in the continually flooded lysimeters (0 cm), but there was no clear effect of
the other treatments (5 - 20 cm) (Figure 4.4a) Although only the flooded hydrological
treatment had a clear effect on porewater S" in the upper 5 cm of sediment, S"
concentrations deeper in the sediment were affected by water table excursions greater
127
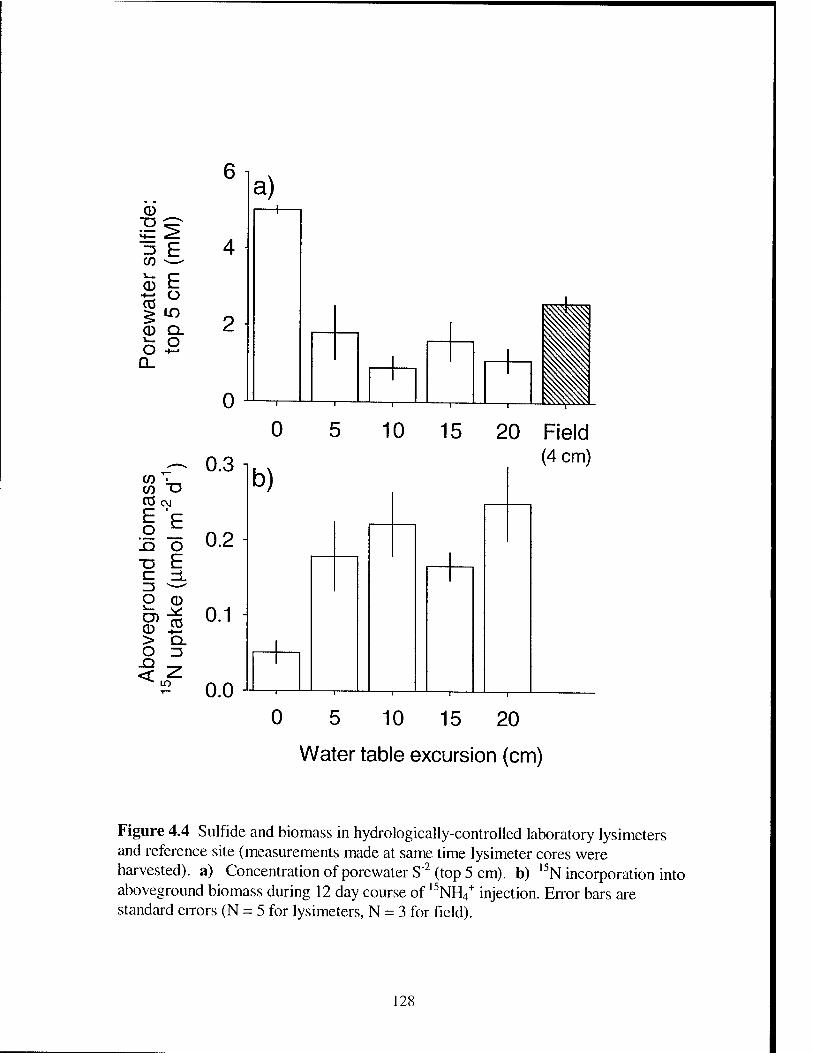
CD ■g <+— Z3 to
CO
CD
O Q_
E Ü in Q. o
D) CO CD -JÜ > Q_ O 13
< Z lO
0
0.1
0.0
a)
o 10 15
— 0.3 i CO T3 CO c\j
So 0.2 ^ ■o E c zi. Z5 ~—' O Q
b)
20 Field (4 cm)
0 5 10 15 20
Water table excursion (cm)
Figure 4.4 Sulfide and biomass in hydrologically-controlled laboratory lysimeters and reference site (measurements made at same time lysimeter cores were harvested), a) Concentration of porewater S'2 (top 5 cm), b) 15N incorporation into aboveground biomass during 12 day course of l5NH4
+ injection. Error bars are standard errors (N = 5 for lysimeters, N = 3 for field).
128
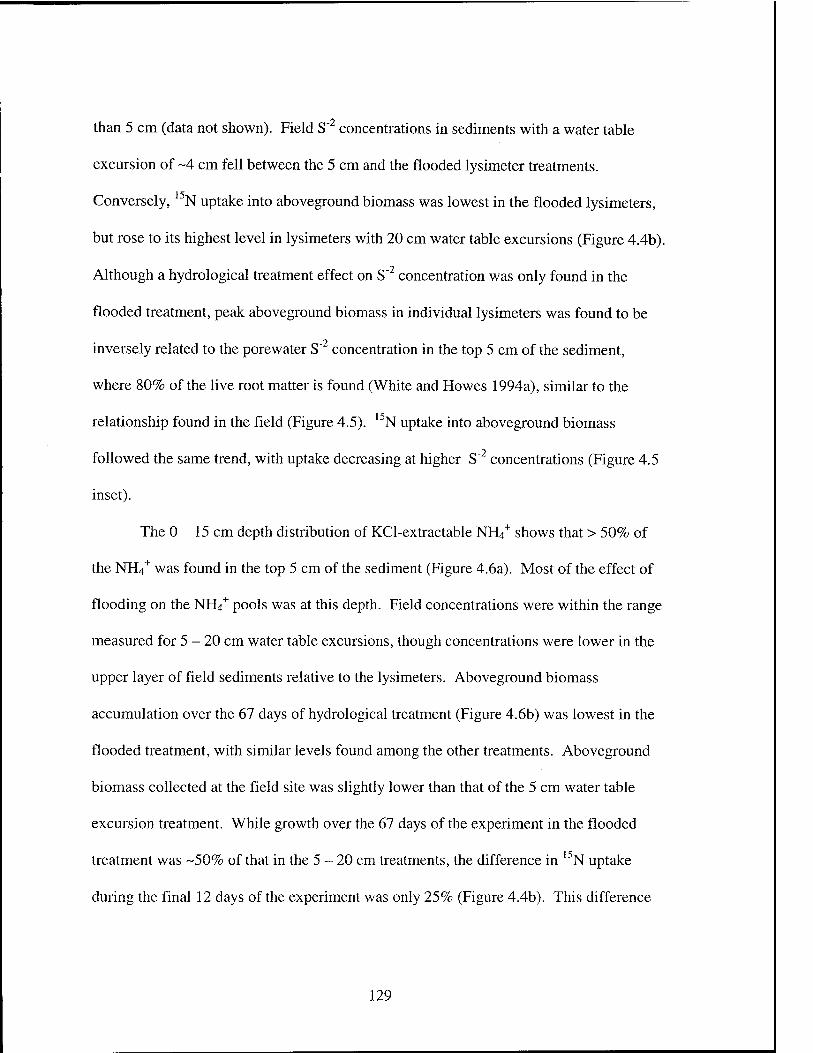
than 5 cm (data not shown). Field S"2 concentrations in sediments with a water table
excursion of ~4 cm fell between the 5 cm and the flooded lysimeter treatments.
Conversely, N uptake into aboveground biomass was lowest in the flooded lysimeters,
but rose to its highest level in lysimeters with 20 cm water table excursions (Figure 4.4b).
Although a hydrological treatment effect on S"2 concentration was only found in the
flooded treatment, peak aboveground biomass in individual lysimeters was found to be
inversely related to the porewater S"2 concentration in the top 5 cm of the sediment,
where 80% of the live root matter is found (White and Howes 1994a), similar to the
relationship found in the field (Figure 4.5). I5N uptake into aboveground biomass
followed the same trend, with uptake decreasing at higher S"2 concentrations (Figure 4.5
inset).
The 0 - 15 cm depth distribution of KCl-extractable NH4+ shows that > 50% of
the NH4+ was found in the top 5 cm of the sediment (Figure 4.6a). Most of the effect of
flooding on the NH4+ pools was at this depth. Field concentrations were within the range
measured for 5 - 20 cm water table excursions, though concentrations were lower in the
upper layer of field sediments relative to the lysimeters. Aboveground biomass
accumulation over the 67 days of hydrological treatment (Figure 4.6b) was lowest in the
flooded treatment, with similar levels found among the other treatments. Aboveground
biomass collected at the field site was slightly lower than that of the 5 cm water table
excursion treatment. While growth over the 67 days of the experiment in the flooded
treatment was -50% ofthat in the 5-20 cm treatments, the difference in 15N uptake
during the final 12 days of the experiment was only 25% (Figure 4.4b). This difference
129
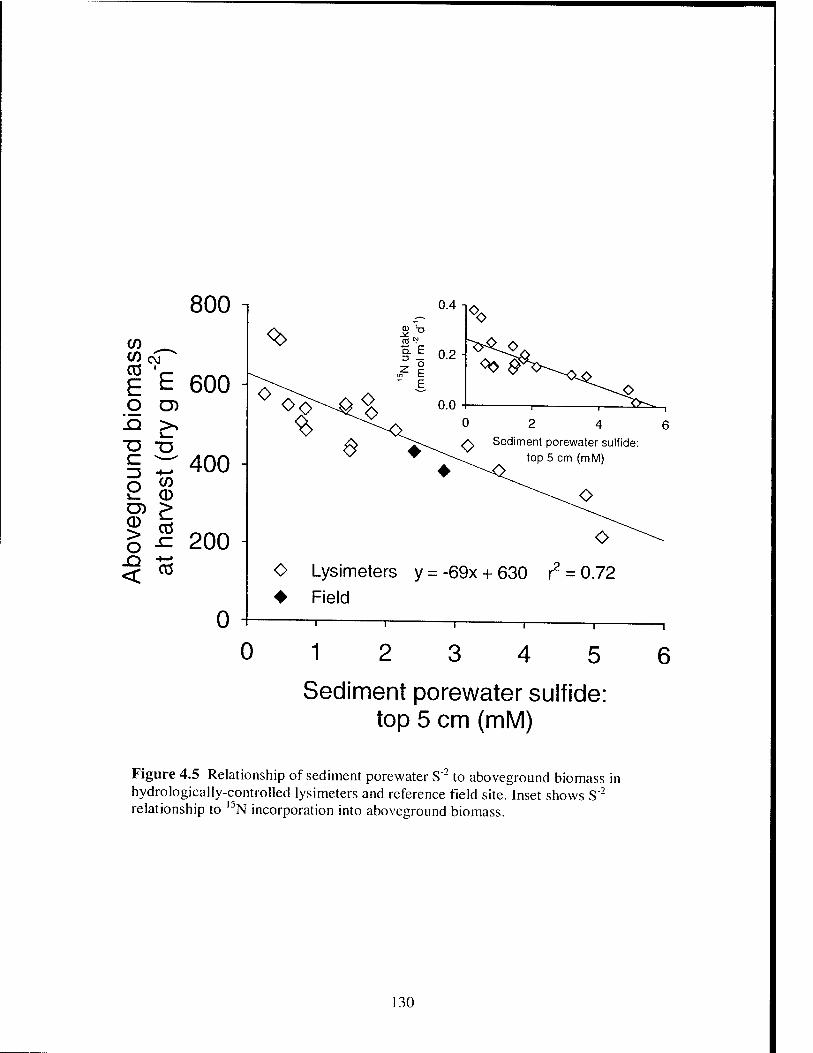
(/) 0) CM CO
E 1
E o CO .Q >.
i_
■D "U C -5 -t—'
O 0 CD CD > O
CO
.O <
CO
800 1
600
400
200
0
O Lysimeters y = -69x + 630 r2 = 0.72 ♦ Field
0 12 3 4 5
Sediment porewater sulfide: top 5 cm (mM)
Figure 4.5 Relationship of sediment porewater S"2 to aboveground biomass in hydrologically-controlled lysimeters and reference field site. Inset shows S 2
relationship to l5N incorporation into aboveground biomass.
130
_CD
.Q
o CO
">< 0
Ü
c CD E
T3 CD
to Cfl CO E
2 'E s s en 5, CD > O
-Q <
'^3 (M CO V
CD E Q E
0
Sediment depth (cm)
600
400
200 -
0
20 -i
15
10
5 -
0 10 15
c)
0 10 15
5 10 15 20 Field (4 cm)
20 Field (4 cm)
20 Field (4 cm)
Water table excursion (cm)
Figure 4.6 Sediment N availability and biomass N uptake in hydrologically- controlled lysimeters. a) Depth-specific concentration of KCl-extractable NH4
+. b) Aboveground dry biomass growth and total N translocation into aboveground biomass during 67 days of treatment. Error bars are standard errors (N = 5 for lysimeters, N = 3 for field), c) Denitrification rate (see text for calculations).
131

likely resulted from both a temporal lag from the onset of flooding to the buildup of S"2
and a late-season slowing of growth in the flooded lysimeters.
In lysimeters with 5 - 20 cm water table excursions, KC1 - extractable NH4+
pools and S"" levels were similar to those found in the field (Figures 4.4a and 4.6a),
where > 90% of the injected tracer was denitrified or taken up into biomass by 1 day
(Table 4.3). In the lysimeters, tracer was injected on ten consecutive days, and the
sediments processed 24 hours after the last injection. Thus a maximum of only 1% of the
total 15N tracer injected could have remained in the NH4+ pool of the 5 - 20 cm
lysimeters, and so all of the tracer recovered in the sediments must have been
incorporated into biomass. The denitrification rate in these lysimeters can then be
calculated in the same way as in the field injections, assuming that an equal proportion of
the injected tracer was lost on each of the ten days (Figure 4.6c). The lysimeter rates
calculated by this method, averaged 8.6 mmol N m"2 d'1, compared with 8.8 mmol N m"2
d" in the field (average of two field measurements made during the same season [8/19
and 9/1]. Table 4.3).
However, the calculation method used for the 5 - 20 cm lysimeters cannot be
used to calculate denitrification rates in the flooded lysimeters. In the flooded lysimeters,
NH4+ accumulates because denitrification and plant uptake are not sufficient to balance N
remineralization (Figure 4.6a). Therefore, during the 10 days of injection, 15NH4+ also
likely accumulated, making the total recoverable 15N a composite of the decay curves of
10 injections. The total proportion of tracer lost over 10 days is then an overestimate of
the amount lost on any 1 day. The difference in denitrification rates between the 5 cm
132
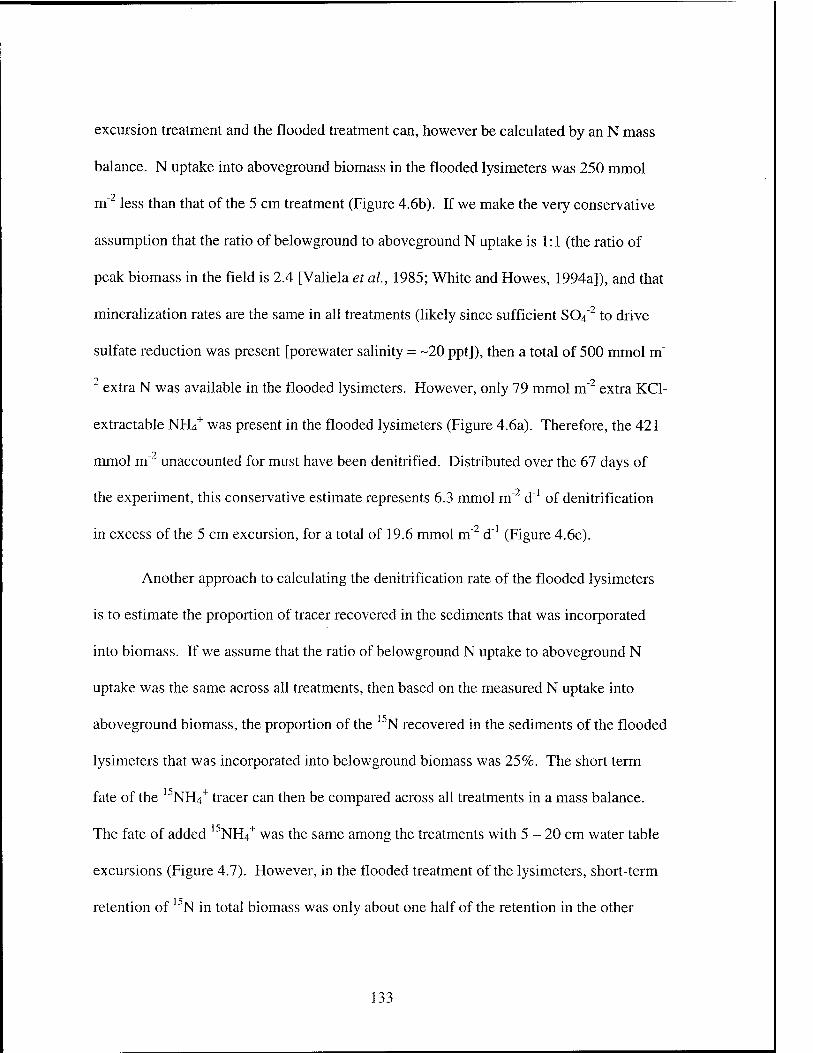
excursion treatment and the flooded treatment can, however be calculated by an N mass
balance. N uptake into aboveground biomass in the flooded lysimeters was 250 mmol
m" less than that of the 5 cm treatment (Figure 4.6b). If we make the very conservative
assumption that the ratio of belowground to aboveground N uptake is 1:1 (the ratio of
peak biomass in the field is 2.4 [Valiela et al., 1985; White and Howes, 1994a]), and that
mineralization rates are the same in all treatments (likely since sufficient S04"2 to drive
sulfate reduction was present [porewater salinity = -20 ppt]), then a total of 500 mmol m"
2 extra N was available in the flooded lysimeters. However, only 79 mmol m2 extra KC1-
extractable NH4+ was present in the flooded lysimeters (Figure 4.6a). Therefore, the 421
mmol m"2 unaccounted for must have been denitrified. Distributed over the 67 days of
the experiment, this conservative estimate represents 6.3 mmol m"2 d"1 of denitrification
in excess of the 5 cm excursion, for a total of 19.6 mmol m"2 d"1 (Figure 4.6c).
Another approach to calculating the denitrification rate of the flooded lysimeters
is to estimate the proportion of tracer recovered in the sediments that was incorporated
into biomass. If we assume that the ratio of belowground N uptake to aboveground N
uptake was the same across all treatments, then based on the measured N uptake into
aboveground biomass, the proportion of the 15N recovered in the sediments of the flooded
lysimeters that was incorporated into belowground biomass was 25%. The short term
fate of the 15NH4+ tracer can then be compared across all treatments in a mass balance.
The fate of added 15NH4+ was the same among the treatments with 5-20 cm water table
excursions (Figure 4.7). However, in the flooded treatment of the lysimeters, short-term
retention of 15N in total biomass was only about one half of the retention in the other
133
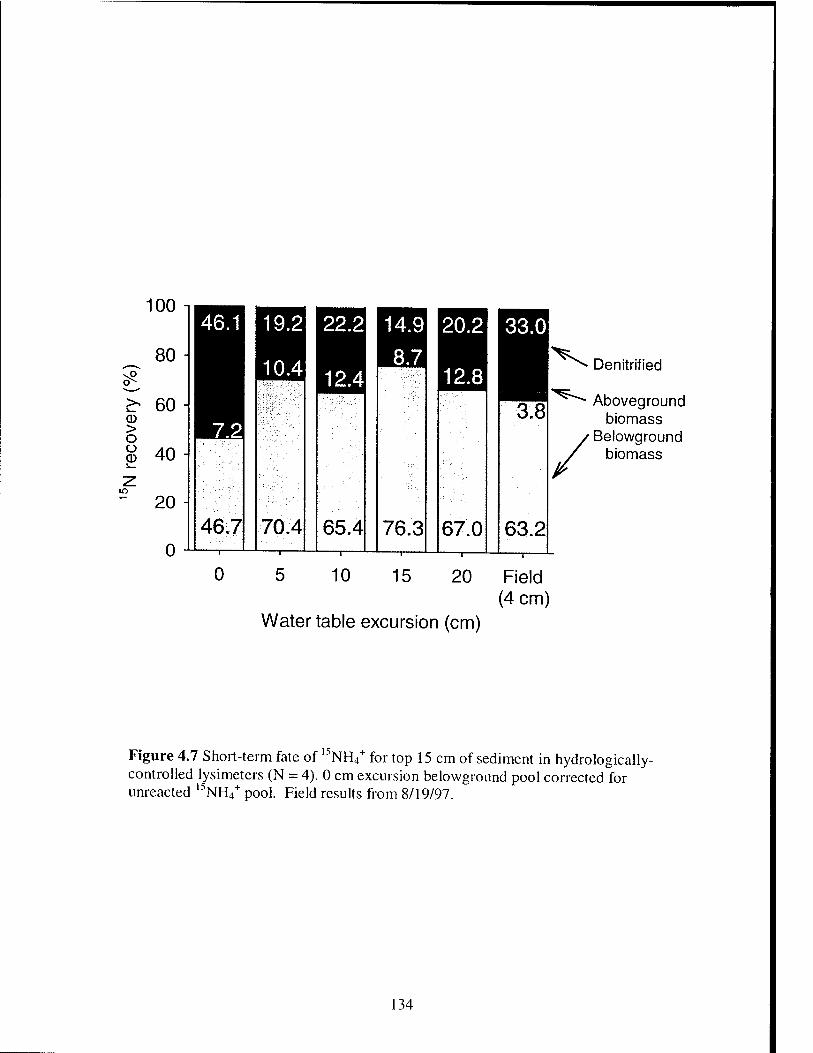
100
80
^ 60 CD > o g 40
20
0
E^Q 19.21 22.2
J°ill2.4
20.2
12.8
33.0
70.4 J—.—1_
65.4 76.3 67.0
3.8
63.2 46.7
^ Denitrified
0 10 15
^-~- Aboveground biomass
/Belowground biomass
20 Field (4 cm)
Water table excursion (cm)
Figure 4.7 Short-term fate of 15NH4+ for top 15 cm of sediment in hydrologically-
controlled lysimeters (N = 4). 0 cm excursion belowground pool corrected for Linreacted 15NH4
+ pool. Field results from 8/19/97.
134

treatments (Figure 4.7). Denitrification losses were correspondingly greater, at 2.5 times
the losses in the 5 - 20 cm treatments, and the denitrification rate estimated by the l5N
mass balance is 21.5 mmol m"2 d"1, equal to the rate calculated above from the N mass
balance. The short term fate of 15NH4+ added to lysimeters with 5 - 20 cm water table
excursions showed a similar pattern to field l5NH4+ injections. On a corresponding date
in mid-August, 67% of the injected tracer was recovered in biomass, while denitrification
losses accounted for the remaining 33% (Figure 4.3). Although the proportion of the
tracer recovered in the aboveground biomass was lower in the field than in the lysimeters,
this aboveground recovery was for a 25 hr experiment, while field experiments showed
that although incorporation of the tracer into biomass is complete after 28 hr, 15N
translocation continues for 4 -5 days. Denitrification in the field did account for a greater
proportion of the tracer, though since the field site had a water table excursion of only 4
cm, the short-term fate of added tracer would be expected to be intermediate between the
0 and 5 cm treatments. Further support for greater denitrification losses in the flooded
treatments comes from the apparent inverse relationship between l5N incorporation into
aboveground biomass and tracer loss by denitrification from the top 5 cm (Figure 4.8).
Discussion
Plant uptake was found to dominate short-term 15N retention during the growing
season in S. alterniflora marsh sediments. In contrast, during the winter, with no plant
growth or uptake, denitrification dominated the short-term fate N. Additions of N
135

15N uptake Into aboveground biomass (nmol m"2d"1)
Figure 4.8 Loss of 15N tracer by coupled nitrification-denitrification versus plant 15N uptake in hydrologically-controlled lysimeters. Line is least squares fit to data with equation: ' N loss = -247 (15N biomass uptake) + 94.
136

fertilizer increased both plant uptake and coupled nitrification-denitrification, but shifted
the dominance to denitrification. The pattern of loss and retention of N in lysimeters with
water table excursions was similar to that in field injections. However, in lysimeters
where plant N uptake was inhibited by flooding, denitrification was stimulated and the
competitive balance shifted toward denitrification.
In stands of short S. alterniflora during the growing season, plant N uptake
consumes 66% of regenerated NH41", while the remainder, 34% is available for coupled
nitrification-denitrification. This partitioning of remineralized N was also found in
earlier work in the same marsh (White and Howes, 1994a). While the annual availability
of N increased 15 times from control levels to the highest fertilization level, peak
aboveground biomass increased by only 4 times (Figure 4.9). The excess N not fixed
into plant biomass was then available for coupled nitrification-denitrification, which was
17 times greater annually in fertilized than in unfertilized plots. The differential effect of
N loading on plant uptake and denitrification is further supported by the long-term
retention of added N in the sediments of fertilized marsh plots. As total N loading
increased 6 times from the LF to the XF level of fertilization, plant biomass increased by
just over 2 fold, while denitrification losses increased by nearly 10 fold (Figure 4.9). The
increased nitrification in fertilized plots was a result of the increased availability of
substrate and the increased oxidation of the sediments via evapotranspiration stimulated
by plant growth (Table 4.1; Howes et ai, 1986).
From June to August, during the seasonal fertilization of the experimental plots,
KCl-extractable NH*"1" in the XF fertilized sediments was 13 times as high as in the
137
CO co cd E o !Q
C -~v
2 E CD > O
CO
_*: CO CD
O)
1200
900 -
600
300
0 C LF HF XF
25
20
0 4 8 12 16
Total N loading (mol m"2 yr"1)
ö 3
o
0 ^ CD Q
c: o
5 0) E
CO ^ (1) CO 0 (/3
0 o a F c r <D
.2f O)
"cdu? O
o
Figure 4.9 a) Peak aboveground biomass (Howes et ai, 1986; Valiela et al., 1976) and denitrification over a range of N loading to the sediment. Total N loading is N remineralization + fertilizer N loading. N remineralization from annualized data of White and Howes, 1994a. Levels of fertilizer N are (LF: 1.7, HF: 5.2, and XF: 15.5
-2 j-1 mol N m" d" ). Error bars are standard errors.
138

unfertilized plots (Figure 4.2b). However, during the remainder of the year, when the
plots were not being fertilized, KCl-extractable NH/ in the XF fertilized sediments was
only 1.2 times as high as in unfertilized sediment (Figure 4.2b), indicating that between
periods of fertilization, the increase in plant uptake and denitrification was sufficient to
remove most of the added N fertilizer. In December, when plant N incorporation was
low or 0, denitrification was also low in both unfertilized and fertilized plots. Under
winter conditions, denitrification dominated the N cycle of the sediments, and only in
fertilized sediments was there found a small (17%) partitioning of tracer into
belowground biomass (Figure 4.3a).
Similarly, in the hydrologically-controlled lysimeters, the suppression of plant N
uptake made enough N available to stimulate coupled nitrification-denitrification by at
least 50%, although the stimulation of denitrification was not enough to remove all of the
extra N made available by the inhibited plant uptake (Figure 4.6a). Although flooding
the sediment reduces sediment oxidation (Figure 4.4a), the diffusion of remineralized
NH4"1" to 02-containing zones in the upper sediment was rapid enough to support an
increased coupled nitrification-denitrification rate. However, the increase in
denitrification rates in the flooded lysimeters was not enough to shift the balance of
competition in favor of denitrification; plant N uptake accounted for 54% of the total
uptake, with the balance (46%) accounted for by denitrification.
Throughout most of the season (October to July) denitrification rates in
unfertilized sediments of the Great Sippewissett Marsh measured by the 15NH4+ tracer
method were < 3.0 mmol N m"2 d"1, while the annually integrated rate was 0.73 mol N m"2
139

yr"1 (Table 4.3), or an average daily rate of 2.0 mmol N m"2 d"1. The pattern of 15N
retention in sediments observed in this study is similar to that observed by White and
Howes (1994a) in the Great Sippewissett Marsh during the initial days of their long-term
retention study, hi their study, 25% of the tracer was denitrified and 75% incorporated
into plant biomass by their first timepoint, 3 days after injection. Further loss of the
incoiporated label was low, with remineralization controlling its availability for coupled
nitrification-denitrification. By averaging the initial loss over 3 days, they derived a
denitrification rate of 1.8 mmol N m'2 d"1 for a date in late May. Both their rate and most
of the rates measured in this study are at the upper end of the range cited in the literature
(reviewed in White and Howes, 1994a); however, the two late summer measurements in
the present study are the highest reported for these sediments (Figure 4.2).
Verification of denitrification rates calculated by the l5N tracer method can be had
from the long-term mass balance N in the fertilized plots. Annual denitrification losses in
the fertilized plots can be assessed relative to the known retention of fertilizer N within
the sediments. Long-term N retention in the XF plots was 4.4% of the fertilizer N
loading of 15.5 mol m"2 yr"1, or a loss of 14.8 mol m"2 yr'1, slightly higher than the annual
denitrification loss of 12.6 mol m"2 yr"1 calculated from the l5NH4+ tracer measurements
(Figure 4.9; Table 4.3). High S. alterniflora growth rates in fertilized sediments lead to
increased evapotranspiration, more rapid water table drops, and subsequent oxidation of
the sediment, as demonstrated by porewater S"2 concentrations (Howes et ai, 1986; Table
4.1). These conditions of high NH4+ availability and increased sediment oxidation
support the high denitrification rates in the fertilized sediments.
140

Experimental manipulations with hydrologically-controlled lysimeters support the
hypothesis that aboveground biomass growth in S. altemiflora is controlled by sediment
oxidation state (Mendelssohn et al, 1981; Howes et al, 1986). In zones of short-form S.
altemiflora, sediment oxidation status is a function of the degree of air entry, which
results from evapotranspiration of sediment porewater (Dacey and Howes, 1984).
Sediment oxidation state is therefore controlled by both the plant production rate and by
the length of time between tidal inundations. The hydrological manipulations of
lysimeters imitated this process by varying the length of time between additions of water
to the lysimeters, resulting in a variety of sediment oxidation states (Figure 4.4a). Both
aboveground biomass at harvest and translocation of 15N to aboveground biomass were
inversely and linearly related to S " concentration in the top 5 cm of the sediment (where
80% of the live roots are located; White and Howes, 1994a) (Figure 4.5). The same
relationship between porewater S" and plant growth was found both in the field and in
the laboratory lysimeters. Similarly, plant growth along the creekbanks is stimulated
because porewater drainage aerates the sediments, reducing S"2 levels (Howes and
Goehringer, 1994).
By injecting a ~NH4+ tracer into undisturbed vegetated salt marsh sediments,
short term in situ coupled nitrification-denitrification rates were obtained in sediments
undergoing natural fluctuations in sediment oxidation status as a result of tidal inundation
and evapotranspiration. Coupled denitrification in unfertilized salt marsh sediments was
controlled by plant N uptake rates. Results showed that during the growing season,
biomass uptake out-competed coupled denitrification for NH4+ in control sediments,
141
whereas at high fertilizer N loading, biomass N uptake of N did not increase
proportionally to N loading, but with increasing plant-mediated oxidation of the
sediment, excess N became available for coupled nitrification-denitrification. In
experiments with hydrologically-controlled laboratory lysimeters, suppression of plant N
uptake by flooding the sediment made more N available for coupled nitrification-
denitrification. Increasing water table excursions aerated the sediments, reducing
porewater S"2 concentrations and stimulating plant growth, removing N from pools
available for coupled denitrification.
142

CHAPTER 5
Conclusions
143

The research reported in this dissertation emphasizes the importance of salt
marshes in the nitrogen cycle of the coastal environment. The understanding of the
nitrogen cycle within salt marshes, their response to increased nitrogen loads, and the
ability of denitrification to remove potentially harmful nitrogen have significant practical
applications. Increased development along the Atlantic coast of the USA during the past
century has dramatically increased the nitrogen loads to coastal waters, leading to
eutrophication, with its attendant problems of water column anoxia, fish kills, loss of
shell fish habitat, odors, and potential contributions to harmful algal blooms such as red
tide. In order to control the harmful effects of excess nitrogen, state and municipal
governments are implementing regulations designed to reduce nitrogen effects on
sensitive environments. However, because of the expense of lowering nitrogen fluxes
from wastewater treatment plants, agriculture and on-site wastewater treatment, careful
planning and design, whether of new wastewater treatment facilities or of regulatory
frameworks is essential to managing nitrogen economically. An understanding of the
role of salt marshes in coastal watersheds and their abilities to remove nitrogen is a
valuable tool in regional nitrogen management.
Knowledge of salt marsh nitrogen cycling processes also plays an important role
in the development of artificial wetlands for nitrogen removal from contaminated water
and wastewater. Denitrification in these artificial systems is an important route of
nitrogen loss (Hamersley et al., 2001). The processes controlling denitrification in
natural and artificial wetlands are the same, and experiments in naturally or
experimentally enriched natural wetlands, such as this study, when combined with studies
144

of artificially wetlands receiving very high loads of nitrogen, enable the formation of a
complete picture of the interactions of high nitrogen loadings with the complex chemical
and biological environment of a salt marsh (Hamersley et ed., in submission a & b).
The contribution of salt marshes to the denitrification of terrestrial N during its
passage into marine environments is a function of the exposure of surface and
groundwater flows to salt marsh sediments. This contact takes place primarily within the
salt marsh tidal creek bottoms, whereas the vegetated marsh sediments are largely
uncoupled from terrestrial N sources. In this regard, salt marsh creek bottoms function in
the same manner as the better-studied estuaries. This similarity is supported by the
similarity of creek bottom metabolic and denitrification rates to rates reported from
estuaries receiving similar N loads (Chapter 3). Likewise, the removal of influent N via
denitrification (40 - 50%) in sediments of Mashapaquit Marsh was within the narrow
range (40 - 50%) reported from other estuaries (reviewed in: Seitzinger, 1988; Smith,
1999). Along the Atlantic coast of the United States, salt marshes border estuaries, salt
ponds, and other areas of surface or ground water influx to the marine environment. The
area covered by salt marshes increases from Maine to South Carolina and Georgia, along
with their contribution to coastal N cycling. However, the predominance of salt marsh
environments along sites of freshwater efflux into marine environments likely indicates
an important role in the glacial tills of the north Atlantic states. Salt marshes and
estuaries both play an important role in controlling the flux of N from terrestrial to
marine environments, and therefore the productivity of coastal embayments.
145
The creek bottom sediments of Mashapaquit Marsh, which received 32 mmol of
terrestrial N m"2 d"1, are at the upper end of the N loading range reported for estuarine
sediments. In the nearby Nauset Marsh Estuary, which receives only 2.1 mmol N m"2 d"1
(Nowicki, 1999), and denitrification rates in creek bottom and estuarine sediments,
averaged about 20 times lower than in Mashapaquit Marsh. Direct losses of groundwater
N03" by denitrification were also found to be low in this marsh. High fluxes of N into
salt marsh creek bottom sediments affect both primary production and denitrification.
Studies in nearby environments demonstrate increased primary productivity in coastal
salt ponds receiving high N inputs (Howes and Goehringer, 1996). Nearly half of the N
taken up by algal growth in Mashapaquit Marsh (Chapter 3), was subsequently denitrified
and denitrification was also driven directly by water column N03". However,
experiments in sediment mesocosms (Seitzinger and Nixon, 1985) and comparisons
among estuaries receiving different N loading (Seitzinger, 1988) indicate that as N
loading increases, denitrification can only account for a constant or diminishing fraction
of the influent N. The ability of denitrification to remove N is probably limited by the
residence time of N over the sediments, which limits both the direct denitrification of
NGy and the incorporation of N into benthic algal biomass.
Thus while salt marshes play an important role in mitigating the effects of
anthropogenic N on coastal environments, and while in quantitative terms, this mitigation
increases with increased N loading, the ability of salt marshes to remove terrestrial N has
limits. As states and municipalities seek to regulate the impact of development and its
associated N impacts on coastal resources, it is important to understand the role of salt
146

marshes in the N cycle of the coastal zone. Existing salt marshes provide important
benefits, ameliorating the need for expensive treatment solutions to wastewater NO3".
Salt marshes can also be constructed to fulfill this need where they have been destroyed
or are lacking. For each of these options, extensive knowledge of the dynamics of the
interaction of groundwater N with salt marsh environments is required for planning and
prediction of the effects of increased N loads on coastal environments (Howes et al.
1996).
In contrast, vegetated salt marsh sediments are largely uncoupled from external N
fluxes, being supported primarily by N fixation (Valiela and Teal, 1979). Although
denitrification losses are significant, up to 50% of inputs, contributions to the coastal N
cycle are small (-15%), mostly as NBU"1" and recalcitrant dissolved organic N (White and
Howes, 1994). This export may support some primary production in tidal creeks and
estuaries, though its importance as an N source is diminished in systems receiving high
terrestrial N inputs. However, the accretion of organic matter is supported and limited by
N inputs, and this accretion (as vegetated peats) plays an important role in the physical
structure of coastal environments, protecting upland areas from storm surges and erosion.
In this study, denitrification, N cycling, and sediment metabolism in the tidal
creeks and vegetated sediments of a New England salt marsh were studied with a number
of techniques. An experimental and model study was undertaken to optimize the
accuracy of N2 flux measurements of sediment denitrification made in closed chambers.
Denitrification and O2 consumption in salt marsh sediments were dependent on labile C
pools, which were depleted during long incubations, causing measured rates to decline.
147
The incubation time required for reduction of diffusive fluxes of sediment porewater N2
pools into a low-N2 headspace was highly dependent on sediment thickness. In these salt
marsh sediments, denitrification took place predominately in the top 2 cm, allowing rate
determinations to be made on thin sediment sections, shortening incubation times.
Inhibition of measured N2 fluxes due to accumulation of headspace N2 and the collapse of
the sediment-water diffusion gradient was as much as 13% in gas headspaces and 80% in
water headspaces, but could be eliminated by the use of headspace thicknesses of > 10
cm gas. Flushing of the headspace to remove accumulated NH4+ did not affect
denitrification rates, but did temporarily disturb N2 fluxes. Controlling for diffusive N2
fluxes with incubations of parallel anaerobic flux chambers where nitrification-
denitrification was inhibited shortened incubation times by 50% or more, but any
significant macrofaunal irrigation made anaerobic sediments poor controls, and
introduced significant errors into the calculation of denitrification fluxes.
N2 flux incubations should be made as short as possible by reducing sediment
thickness, and/or employing parallel anaerobic cores when macrofaunal irrigation is
minimal. Gas headspaces should be at least 10 cm in thickness, and incubations with
water headspaces should be very short (hours). Headspace flushing increases the effort
expended in the experiments, and may not have any effect on measured denitrification
rates. Limitations of the N2 flux method largely arise because conditions in closed
chambers are not at equilibrium. Improvements to the approach can be made by
shortening incubations or by maintaining headspace equilibrium by a continuous flow of
water over the headspace. However, accurate measurement of changes in N2 under these
148

conditions requires expensive equipment such as a mass spectrometer. The advantages
must be weighed against the retention of a method, which can be applied widely to
environmental decision-making.
Denitrification in tidal salt marsh creeks was found to be driven by the availability
of labile algal biomass as much as by seasonal factors such as temperature. Sandy
sediments had half the sediment C content of muddy sediments, but rates of O2
consumption, C02 production, and denitrification were the same in both sites. Sediment
metabolism in both sites was based on respiration of an organic source with a C/N molar
ratio of 6.1. Sandy sediments had a higher abundance of photosynthetic pigment-
associated C, while muddy sediments had in addition a pool of non-reactive C. The
respiration quotient at both sites was 1.0, indicating that the products of anaerobic
metabolism were oxidized before escaping the sediments. Coupled nitrification-
denitrification was a significant contributor to the cycling of C, O, and N. O2
consumption by nitrification was responsible for 18% of the total O2 flux into the
sediments. CO2 production by denitrification predominated over C02 fixation by
nitrification, and the net CO2 flux was 10% of the total heterotrophic CO2 flux from the
sediments. 46% of remineralized N was subject to coupled nitrification-denitrification.
Allochthonous denitrification of groundwater NCV accounted for 39% of the combined
total denitrification rate, which averaged 2.7 mol m"2 yr~'.
Since denitrification in the tidal creek sediments is driven by algal biomass, its N
source must be groundwater NO3", the dominant N source to the creek bottom. Since
autochthonous denitrification represents 61% of the total denitrification, NO3" uptake by
149
'3 benthic algae must exceed allochthonous denitrification. However, no difference in NO
uptake was seen either in field chamber incubations or in artificially-lit laboratory flux
chambers (Smith, 1999). Additionally, comparisons of tidal N03" fluxes during the day
and night revealed no differences (Smith, 1999). Visual observation suggests that much
of the benthic algal production takes place in mats of Enteromorpha intestinata, which
may not have been included in either the field or laboratory flux chambers. In addition,
photon flux densities at the sediment surface in either of the chamber incubations may not
have been as high as field levels, due to the obscuring effects of the chamber walls, or the
limitations of artificial lighting. Nitrate uptake by benthic algae could be measured in
large field enclosures of algal mats designed to minimize interference with solar
radiation. These measurements could be compared with measures of algal cover and
biomass production as a second measure of N incorporation into biomass. In the present
study, isotope ratios of l5N and l3C were consistent with an algal source for sediment
organic matter. Continued studies including 35S and separate analysis of the contributors
to sediment organic matter (benthic fauna, algal matter, humic matter, and Spartina
biomass) could serve to further elucidate the source of sediment C.
In undisturbed sediments of the vegetated marsh, plant N uptake out-competes
coupled nitrification-denitrification for remineralized NH4+ during the growing season.
Plant uptake accounts for 66% of remineralized N, while denitrification accounts for the
remainder. In the winter, however, plant uptake is 0, and denitrification predominates.
Both plant uptake and denitrification increase with increased N availability, but plant N
uptake does not increase as fast as denitrification, and at an N fertilization level of 15.5
150
mol m"2 yr"1, denitrification dominates the N cycle, accounting for 72% of the available
N, while plant uptake only accounts for 28%. Sediment hydrological conditions affect
plant growth via their effect on sediment oxidation. In flooded sediments, S~2
concentrations are elevated, inhibiting plant growth. Coupled nitrification-denitrification
responds to substrate availability, even under conditions of low sediment oxidation, for
when plant N uptake was suppressed by flooding, denitrification consumed at least 84%
of the excess N made available. Under conditions of sediment flooding, the competition
for remineralized NH4+ shifts in favor of denitrification, but plant uptake still accounts for
> 50% of remineralized N. Denitrification rates calculated with the 15NH4+ tracer ranged
from 0.7 - 12.2 mmol m"2 d"1 in unfertilized marsh, or 0.73 mol m"2 yr"J annually. In
fertilized sediments, denitrification rates were much higher, averaging 12.6 mol m"2 yr"1
(range 11.1 - 136 mmol m"2 d"').
With the understanding of the sediment N cycle gained in this study and with
understanding of the utility of l5N tracer methods for determining the partitioning of
remineralized N, a number of easy experiments can be envisioned. Although
denitrification rate measurements require an extremely laborious, and generate large
numbers of samples, measurements of plant/nitrifier partitioning can be made much more
simply. Since after the initial denitrification loss and incorporation of the tracer into
biomass, little further change takes place over 28 d (White and Howes, 1994a), only one
set of injected sediment cores need be harvested, 3 or more days after the initial injection.
The partitioning of N between plants and nitrifiers could then be easily determined in a
number of environments. Of interest would be differences in partitioning between stands
151

of different marsh grass species. Changes in the partitioning of N between plants and
nitrifiers in swards of different species could result from differences in sediment
oxidation (high marsh vs. low marsh) or from differences in the growth rate of the plant
species. Determining plant/nitrifier N partitioning at all of the different fertilizer levels of
the long-term fertilization plots would fill in a scheme that at present has only two end
members. Also of interest is the differential effect of long-term vs. short term N
additions. Long-term N additions change plant growth form and sediment oxidation,
whereas short-term N additions would have little effect, allowing separation of the effects
of sediment oxidation from N availability. Measurements in the present study were
concentrated during the summer, but the dynamics of the seasonal crossover from
denitrification to plant dominance of uptake during spring and summer would answer
questions about the relative seasonal cycles of plant N uptake and denitrification as
affected by seasonally-varying sediment oxidation states.
Denitrification in the varying environments of the salt marsh is best studied with a
combination of techniques. Closed flux chambers are useful for simultaneous
determinations of a variety of biogeochemical fluxes, however, sediments incubated in
vitro are not subject to the diurnal tidal, solar, and temperature cycles found in situ.
Stable isotope studies can be done in situ, but are best combined with other measures of
biogeochemical fluxes for a complete understanding of elemental fluxes of the salt
marsh.
152
REFERENCES
Abd. Aziz, S. A. and D.B. Nedwell. 1986. The nitrogen cycle of an East Coast, U.K. saltmarsh: II. Nitrogen fixation, nitrification, denitrification, tidal exchange. Estuar. Coast. Shelf Sei. 22:689-704.
Berner, R.A. 1980. Early Diagenesis. Princeton University Press, Princeton, NJ. 241 pp.
Blackburn, H.T. 1979. Method for measuring rates of NH4+ turnover in anoxic marine
sediments, using a 15N-NH.4+ dilution technique. Appl. Environ. Microbiol. 37:760-765.
Braker, G., Alaya-del-Rio, H.L., Devol, A.J., Fesefeldt, A., and J.M. Tiedje. 2001. Community structure of denitrifiers, Bacteria, and Archaea along redox gradients in Pacific Northwest Marine Sediments by Terminal Restriction Fragment Length Polymorphism analysis of amplified nitrite reductase (nirS) and 16S rRNA genes. Appl. Env. Microbiol. 67:1893-1901.
Bonin, P., Barbotin, J.N., Dhulster, P., and J.-C. Bertrand. 1986. Nitrate reduction in simulated microniches by a denitrifying marine bacterium. Can. J. Microbiol. 33:276-279.
Boschker, H.T.S., de Brouwer, J.F.C., and T.E. Cappenberg. 1999. The contribution of macrophyte-derived organic matter to microbial biomass in salt-marsh sediments: Stable carbon isotope analysis of microbial biomarkers. Limnol. Oceanogr. 44:309-319.
Bow den, W.D. 1986. Gaseous nitrogen emissions from undisturbed terrestrial ecosystems: An assessment of their impacts on local and global nitrogen budgets. Bio geochemistry 2:249-279.
Bowden, W.D. 1987. The biogeochemistry of nitrogen in freshwater wetlands. Biogeochemistry 4:313-348.
Boynton, W.R., Kemp, W.M., Osborne, CG., Kaumeyer, K.R., and M.C. Jenkins. 1981. Influence of water circulation rate on in situ measurements of benthic community respiration. Mar. Biol. 65:185-190.
Broeker, W. and T.-H. Peng. 1982. Tracers in the Sea. Lamont-Doherty Geological Observatory, New York. 690 pp.
Capone, D.G. and M.F. Bautista. 1985. A groundwater source of nitrate in nearshore marine sediments. Nature 313:214-216.
Cavigelli, M.A. and G. P. Robertson. 2000. The functional significance of denitrifier community composition in a terrestrial ecosystem. Ecology. 81:1402-1414.
Chapman, H.D., Liebig, G.F. and D.S. Rayner. 1949. A lysimeter investigation of nitrogen gains and losses under various systems of covercropping and fertilization, and a discussion of error sources. Hilgardia 19:3.
153
Cheneby, D., Philippot, L., Hartmann, A., Henault, C, and J.-C. Germon. 2000. 16S rDNA analysis for characterization of denitrifying bacteria isolated from three agricultural soils. FEMS Microbiol. Ecol. 34:121-128.
Christensen, J.P. and G.T. Rowe. 1984. Nitrification and oxygen consumption in northwest Atlantic deep-sea sediments. J. Mar. Res. 42:1099-1116.
Christensen, J.P., Murray, J.W., Devol, A.H., and L.A. Codispoti. 1987. Denitrification in continental shelf sediments has major impact on the oceanic nitrogen budget. Global Biogeochem. Cycles. 1:97-116.
Cline, J.D. 1969. Spectrophotometric determination of hydrogen sulfide in natural waters. Limnol. Oceanogr. 14:454-458.
Cornwell, J.C., Kemp, W.M., and T.M. Kana. 1999. Denitrification in coastal ecosystems: methods, environmental controls, and ecosystem level controls, a review. Aquatic Ecol 33:41-54.
Dacey, J.W. and B.L. Howes. 1984. Water uptake by roots controls water table movement and sediment oxidation in short Spartina marsh. Science. 224:487-489.
DeLaune, R.D., Lindau, C.W., Sulaeman, E., and A. Jugsujinda. 1998. Nitrification and denitrification estimates in a Louisiana forest soil as assessed by 15N isotope dilution and direct gaseous measurements. Water Air Soil Pollut. 106:149-161.
D'Elia, C.F., Steudler, P.A. and N. Corwin. 1977. Determination of total N in aqueous samples using persulfate digestion. Limnol. Oceanogr. 22:760-764.
Devol, A.H. 1987. Verification of flux measurements made with in situ benthic chambers. Deep-Sea Res. 34:1007-1026.
Devol, A.H. 1991. Direct measurement of nitrogen gas fluxes from continental shelf sediments. Nature. 349:319-321.
Devol, A.H. and J.P. Christensen. 1993. Benthic fluxes and nitrogen cycling in sediments of the continental margin of the eastern North Pacific. J. Mar. Res. 51:345-372.
Ferguson, S.J. 1994. Denitrification and its control. Antonnie van Leeuwenhoek 66-89- 110.
Fujita, R.M., Wheeler, P.A., and R.L. Edwards. 1980. Assessment of macroalgal nitrogen limitation in a seasonal upwelling region. Mar. Ecol. Prog. Ser. 53:293-303.
Gardner, W.S., T.F. Nalepa and J.M. Malczyk. 1987. Nitrogen mineralization and denitrification in Lake Michigan sediments. Limnol. Oceanogr. 32:1226-1238.
Giblin, A.E. and A.G. Gaines. 1990. Nitrogen inputs to a marine embayment: The importance of groundwater. Biogeochemistry 10:309-328.
Goering, J.J. and M.M. Pamatmat. 1971. Denitrification in sediments of the sea off Peru. Invest. Pesq. 35:233-242.
154

Güss, S. 1998. Oxygen uptake at the sediment-water interface simultaneously measured using a flux chamber method and microelectrodes: Must a diffusive boundary layer exist? Est. Coast. Shelf Sei. 46:143-156.
Hamersley, M.R., Howes, B.L., White, D.S., Johnke, S., Young, D., Peterson, S.B., and J.M. Teal. 2001. Nitrogen balance and cycling in an ecologically engineered septage treatment system. Ecological Engineering. 18:61-75.
Hamersley, M.R., Howes, B.L., and D.S. White. Particulate organic carbon availability controls denitrification in a septage-treating artificial wetland. Water Research (in submission a).
Hamersley, M.R., Howes, B.L., and D.S. White. The contribution of floating plants to ammonium and nitrogen removal via nitrification/denitrification in a septage- treating artificial wetland. Journal of Environmental Quality (in submission b).
Harvey, J.W. and W.E. Odum. 1990. The influence of tidal marshes on upland groundwater discharge to estuaries. Bio geochemistry 10:217-236.
Henriksen, K. and W.M. Kemp. 1988. Nitrification in estuarine and coastal marine sediments, pp. 207-249. In: T.H. Blackburn and J. S0rensen, eds. Nitrogen Cycling in Coastal Marine Environments. John Wiley & Sons. New York.
Howes, B.L. and D.D. Goehringer. 1994. Porewater drainage and dissolved organic carbon and nutrient losses through the intertidal creekbanks of a New England salt marsh. Mar. Ecol. Prog. Ser. 114:289-301.
Howes, B.L. and D.D. Goehringer. 1996. Ecology of Buzzards Bay: An estuarine profile. National Biological Service Biological Report 31. vi+141 pp.
Howes, B.L. and J.M. Teal. 1994. Oxygen loss from Spartina alterniflora and its relationship to salt marsh oxygen balance. Oecologia 97:431-438.
Howes, B.L., Howarth, R.W., Teal, J.M. and I. Valiela. 1981. Oxidation-reduction potentials in a salt marsh: Spatial patterns and interactions with primary production. Limnol. Oceanogr. 26:350-360.
Howes, B.L., Dacey, J.W.H. and G.M. King. 1984. Carbon flow through oxygen and sulfate reduction pathways in salt marsh sediments. Limnol. Oceanogr. 29:1037- 1051.
Howes, B.L., Dacey, J.W.H. and J.M. Teal. 1985. Annual carbon mineralization and belowground production of Spartina alterniflora in a New England salt marsh. Ecology 66:595-605.
Howes, B.L., Dacey, J.W.H. and D.D. Goehringer. 1986. Factors controlling the growth form of Spartina alterniflora: Feedbacks between above-ground production, sediment oxidation, nitrogen and salinity. J. Ecol. 74:881-898.
Howes, B.L., Weiskel, P.K., Goehringer, D.D. and J.M. Teal. 1996. Interception of freshwater and nitrogen transport from uplands to coastal waters: The role of
155

saltmarshes. pp. 287-310. In K.F. Nordstrom and C.T. Roman, eds., Estuarine Shores: Evolution, Environments and Human Alterations. John Wiley and Sons Ltd.
Jenkins, M.C. and W. M. Kemp. 1984. The coupling of nitrification and denitrification in two estuarine sediments. Limnol. Oceanogr. 29:609-619.
Jensen, K.M., M.H. Jensen and E. Kristensen. 1996. Nitrification and denitrification in Wadden Sea sediments (Konigshafen, Island of Sylt, Germany) as measured by nitrogen isotope pairing and isotope dilution. Aquat. Microb. Ecol. 11:181-191.
Jetten, M.S.M., Logemann, S., Muyzer, G., Robertson, L.A., de Vries, S., van Loosdrecht, M.C.M., and J.G.Kuenen. 1997. Novel principles in the microbial conversion of nitrogen compounds. Antonie van Leeuwenhoek 71:75-93.
J0rgensen, B.B. 1977. Bacterial sulfate reduction within reduced microniches of oxidized marine sediments. Mar. Biol. 41:7-17.
J0rgensen, B.B. 1978. A comparison of methods for the quantification of bacterial sulfate reduction in coastal marine sediments. 1. Measurements with radio-tracer techniques. Geomicrobiol. J. 1:11-27.
JOrgensen, B.B. 1982. Mineralization of organic matter in the sea bed: The role of sulphate reduction. Nature 296:643-645.
J0rgensen, B.B. and J. S0rensen. 1985. Seasonal cycles of 02, N03", and S04"2 reduction in estuarine sediments: the significance of an NOV reduction maximum in spring. Mar. Ecol. Prog. Ser. 24:65-74.
Joye, S.B., Smith, S.V., Holligaugh, J.T. and H.W. Paerl. 1996. Estimating denitrification rates in estuarine sediments: A comparison of stoichiometric and acetylene based methods. Biogeochemistry 33:197-215.
Jury, W.A., Letey, J. and T. Collins. 1982. Analysis of chamber methods used for measuring nitrous oxide production in the field. Soil Sei. Am. J. 46:250-256.
Kaplan, W., Valiela, I., and J.M. Teal. 1979. Denitrification in a salt marsh ecosystem. Limnol. Oceanogr. 24:726-734.
Kautsky, N., H. Kautsky, U. Kautsky and M. Waern. 1986. Decreased depth penetration of Fucus vesiculosus (L.) since the 1940's indicates eutrophication of the Baltic Sea. Mar. Ecol. Prog. Ser. 28:1-8.
Koch, M.S., Maltby, E., Oliver, G.A., and S.A. Bakker. 1992. Factors controlling denitrification rates of tidal mudflats and fringing salt marshes in South-west England. Estuar. Coastal. Shelf Sei. 34:471-485.
Lamontagne, M.G. and I. Valiela. 1995. Denitrification measured by a direct N2 flux method in sediments of Waquoit Bay, MA. Biogeochemistry. 31:63-83.
Matthias, A.D., Yarger, D.N., and R.S. Weinbeck. 1978. A numerical evaluation of chamber methods for determining gas fluxes. Geophys. Res. Let. 5:765-768.
156
Matulewich, V.A. and M.S. Finstein. 1978. Distribution of autotrophic nitrifying bacteria in a polluted river (the Passaic). Appl. Environ. Microbiol. 35:67-71.
McCaig, A.E., Embley, T.M., and J.I. Prosser. 1994. Molecular analysis of enrichment cultures of marine ammonia oxidisers. FEMS Microbiol. Lett. 120:363-368.
McGovern, T.A., Laber, L.J., and B.C. Gram. 1979. Characteristics of the salts secreted by Spartina alterniflora and their relation to estuarine production. Estuarine Coastal Mar. Sei. 9:351-356.
Mendelssohn, I.A., McKee, K.L., and W.H. Patrick, Jr. 1981. Oxygen deficiency in Spartina alterniflora roots: Metabolic adaptation to anoxia. Science 214:439-441.
Meyer-Reil, L.-A. 1994. Microbial life in sedimentary biofilms: The challenge to microbial ecologists. Mar. Ecol. Prog. Ser. 112:303-311.
Middelburg, J.J., Soetaert, K., Herman, P.M.J. and C.H.R. Heip. 1996. Denitrification in marine sediments: A model study. Global Biogeochem. Cycles. 10:661-673.
Morris, J.T. and J.W.J. Dacey. 1984. Effects of oxygen on ammonium uptake and root respiration by Spartina alterniflora. Am. J. Bot. 71:979-985.
Nielsen, L.P. 1992. Denitrification in sediment determined from nitrogen isotope pairing. FEMS Microbiol. Ecol. 86:357-362.
Nixon, S.W. 1980. Between coastal marshes and coastal waters: A review of twenty years of speculation and research on the role of salt marshes in estuarine productivity and water chemistry, pp. 437-525. In: P. Hamilton and K. MacDonald, eds. Estuarine and Wetland Processes with and Emphasis on Modeling. Plenum. *&•
Nixon, S.W., Oviatt, CA., and S.S. Hale. 1975. Nitrogen regeneration and the metabolism of coastal marine bottom communities. In: J. Anderson and M. MacFayden, eds., The Role of Terrestrial and Aquatic Organisms in Decomposition Processes. Blackwell Scientific. Coleraine. pp. 269-283. xxx
Nowicki, B.L. 1994. The effect of temperature, oxygen, salinity, and nutrient enrichment on estuarine denitrification rates measured with a modified nitrogen gas flux technique. Estuar. Coast. Shelf Sei. 38:137-156.
Nowicki, B.L., Requintina, E. Van Keuren, D. and J. Portnoy. 1999. The role of sediment denitrification in reducing groundwater-derived nitrate inputs to Nauset Marsh Estuary, Cape Cod, Massachusetts. Estuaries. 22:245-259.
Patrick, Jr., W.H. and K.R. Reddy. 1976. Nitrification-denitrification reactions in flooded soils and water bottoms: Dependence on oxygen supply and ammonium diffusion. J. Environ. Qual. 5:469-472.
Paerl, HW. and J.L. Pinckney. 1996. A mini-review of microbial consortia: Their roles in aquatic production and biogeochemical cycling. Microb. Ecol. 31:225-247.
157
Page, H.M. 1997. Importance of vascular plant and algal production to macro-invertebrate consumers in a southern California salt marsh. Estuar. Coast. Shelf Sei. 45:823-834.
Reddy, K.R., Patrick, Jr., W.H., and C.W. Lindau. 1989. Nitrification-denitrification at the plant root-sediment interface in wetlands. Limnol Oceanogr. 34:1004-1013.
Redfield, A.C. 1972. Development of a New England salt marsh. Ecological Monographs 42:201-237.
Ryther, J.H. and C.B. Officer. 1981. Impact of nutrient enrichment on water uses. In: B.J. Neilson and L.E. Cronin, eds. Estuaries and Nutrients. Humana. Clifton NJ pp 247-262.
Rysgaard, S., Thastum, P., Dalsgaard, T., Christensen, P.B. and N.P. Sloth. 1999. Effects of salinity on NH4
+ adsorption capacity, nitrification, and denitrification in Danish estuarine sediments. Estuaries. 22:21-30.
Scheiner, D. 1976. Determination of ammonia and Kjeldahl N by indophenol method Water Res. 10:31-36.
Schlesinger, W.H. 1991. Biogeochemistry: An Analysis of Global Change. Academic, London. 443 pp.
Schmidt, E.L. and L.W. Belser. 1982. Nitrifying bacteria. In: A.L. Page, R.H. Miller, and D.R. Keeney, eds., Methods of Soil Analysis, Part 2: Chemical and Microbiological Properties. American Society of Agronomy. Madison WI pp 1029-1031.
Seitzinger, S.P. 1987. Nitrogen biogeochemistry in an unpolluted estuary: the importance of benthic denitrification. Mar. Ecol. Prog. Ser. 41:177-186.
Seitzinger, S.P. 1988. Denitrification in freshwater and coastal marine ecosystems: Ecological and geochemical significance. Limnol. Oceanogr. 33:702-724.
Seitzinger, S.P. 1994. Linkages between organic matter mineralization and denitrification in eight riparian wetlands. Biogeochemistry. 25:19-39.
Seitzinger, S.P. and S.W. Nixon. 1985. Eutrophication and the rate of denitrification and N20 production in coastal marine sediments. Limnol. Oceanogr. 30:1332-1339.
Seitzinger, S.P., Nixon, S.W., Pilson, M.E.Q. and S. Burke. 1980. Denitrification and N20 production in near-shore marine sediments. Geochim. Cosmochim Acta 44:1853-1860.
Seitzinger, S.P., Nixon, S.W. and M.E.Q. Pilson. 1984. Denitrification and nitrous oxide production in a coastal marine ecosystem. Limnol. Oceanogr. 29:73-83.
Seitzinger, S.P., Nielsen, L.P., Caffrey, J. and P.B. Christensen. 1993. Denitrification measurements in aquatic sediments: A comparison of three methods. Biogeochemistry. 23:147-167.
;58
Sewell, P.L. 1982. Urban groundwater as a possible nutrient source for an estuarine benthic algal bloom. Estuarine Coastal Shelf Sei. 15:569-576.
Smith, K.N. 1999. Salt marsh uptake of watershed nitrate. Master's Thesis. Department of Geology, Graduate School of Arts and Sciences, Boston University, Boston, Massachusetts. 76 pp.
Soetaert, K., Herman, P.M.J. and J.J. Middelburg. 1996. A model of early diagenetic processes from the shelf to abyssal depths. Geochim. Cosmochim. Acta. 60:1019- 1040.
S0rensen, J. 1978. Capacity for denitrification and reduction of nitrate to ammonia in a coastal marine sediment. Appl. Env. Microb. 35:301-305.
S0rensen, J. Rasmussen, L.K, and I. Koike. 1987. Micromolar sulfide concentrations alleviate acetylene blockage of nitrous oxide reduction by denitrifying Pseudomonas flourescens. Can. J. Microbiol. 33:1001-1005.
Stephen, J.R., McCaig, A.E., Smith, Z., Prosser, J.I., and T.M. Embley. 1996. Molecular diversity of soil and marine 16S rRNA gene sequences related to ß-subgroup ammonia-oxidising bacteria. Appl. Environ. Microbiol. 62:4147-4154.
Sullivan, M.L., and F.C. Daiber. 1974. Response in production of cordgrass, Spartina alterniflora, to inorganic nitrogen and phosphorus fertilizer. Chesapeake Sei. 15:121-123.
Teal, J.M. 1962. Energy flow in the salt marsh ecosystem of Georgia. Ecology 43:614- 624.
Teal, J.M. and B.L. Howes. 1996. Interannual variability of a salt-marsh ecosystem. Limnol. Oceanogr. 41:802-809.
Teske, A., Aim, E., Regan, J.M., Toze, S., Rittman, B.E., and I. Stahl. 1994. Evolutionary relationships among ammonia- and nitrite-oxidizing bacteria. J. Bacteriol. 176:6623-6630.
Trimmer, M., Nedwell, D.B., Sivyer, D.B. and S.J. Malcolm. 2000. Seasonal benthic organic matter mineralization measured by oxygen uptake and denitrification along a transect of the inner and outer River Thames estuary, UK. Mar. Ecol. Progr.Ser. 197:103-119.
Turner, R.E. 1976. Geographic variations in salt marsh macrophyte production: a review. Contrib. Mar. Sei. 20:47-68.
Valiela, I. and J.M. Teal. 1974. Nutrient limitation in salt marsh vegetation, pp. 547-563. In: R.J. Reimold and W.H. Green, eds., Ecology of Halophytes. Academic. New York.
Valiela, I. and J.M. Teal. 1979. The nitrogen budget of a salt marsh ecosystem. Nature 280:652-656.
159
Valiela, I., Teal, J.M. and N.Y. Persson. 1976. Production and dynamics of experimentally enriched salt marsh vegetation: Belowground biomass Limnol Oceanogr. 21:245-252.
Valiela, I., Teal, J.M., and W.G. Deuser. 1978. The nature of growth forms in the salt marsh grass Spartina alterniflora. Amer. Natur. 112:461-470.
Valiela, I., Teal, J.M., Cogswell, C, Hartman, J., Allan, S., Van Etten, R. and D. Goehringer. 1985. Some long-term consequences of sewage contamination in salt marsh ecosystems, pp. 301-316. In: P.J. Godfrey, E.R. Kaynor, and J. Benforado, eds. Ecological Considerations in Wetland Treatment of Municipal Wastewater.' Van Nostrand Reinhold, NY.
Valiela, I., Costa, J., Foreman, K., Teal, J.M., Howes, B. and D. Aubrey. 1990. Transport of groundwater-borne nutrients from watersheds and their effects on coastal waters. Bio geochemistry 10:177-197.
Valiela, I., Foreman, K., LaMontagne, M., Hersh, D., Costa, J., Peckol, P., DeMeo- Andreson, B., D'Avanzo, C, Babione, M., Sham, C.-H., Brawley, J., Lajtha, K. 1992. Couplings of watersheds and coastal waters: Sources and consequences of nutrient enrichment in Waquoit Bay, Massachusetts. Estuaries 15:443-457.
van Kessel, J.F. 1977. Factors affecting the denitrification rate in two water-sediment systems. Wat. Res. 11:259-267.
van Luijn, F., Boers, P.C.M. and L. Lijklema. 1996. Comparison of denitrification rates obtained by the N2 flux method, the l5N isotope pairing technique and the mass balance approach. Wat. Res. 30:893-900.
van Luijn, F., Boers, P.C.M., Lijklema, L. and J.-P.R.A. Sweerts. 1999. Nitrogen fluxes and processes in sandy and muddy sediments from a shallow eutrophic lake Wat Res. 33:33-42.
Van Raalte, CD. and D.G. Patriquin. 1979. Use of the "acetylene blockage" technique for assaying denitrification in a salt marsh. Mar. Biol. 52:315-320.
Vanderborght, J.-P. and G. Billen. 1975. Vertical distribution of nitrate concentration in interstitial water of marine sediments with nitrification and denitrification. Limnol. Oceanogr. 20:953-961.
Vince, S.W., Valiela, I., and J.M Teal. 1981. An experimental study of the structure of herbivorous communities in a salt marsh. Ecology 62:1662-1678.
Weiskel, P.K., DeSimone, L.A. and B.L. Howes. 1996. Transport of wastewater nitrogen and phosphorus through a coastal watershed. Env. Sei. Tech. 26:352-360.
Weiss, R.F. 1970. The solubility of nitrogen, oxygen, and argon in water and seawater. Deep-Sea Res. 17:721-735.
White, D.S. and B.L. Howes. 1994a. Long-term l5N-nitrogen retention in the vegetated sediments of a New England salt marsh. Limnol. Oceanogr. 39:1878-1892.
160

White, D.S. and B.L. Howes. 1994b. Translocation, remineralization, and turnover of nitrogen in the roots and rhizomes of Spartina alterniflora (Gramineae). Am. J. Bot. 81:1225-1234.
Wiljer, J and C.C. Delwiche. 1954. Investigations on the denitrifying process in soil. Plant Soil. 5:155-169.
Wolaver, T.G., J.C. Zieman, R. Wetzel and K.L. Webb. 1983. Tidal exchange of nitrogen and phosphorus between a mesohaline vegetated marsh and the surrounding estuary in the Lower Chesapeake Bay. Est. Coast. Shelf Sei. 16:321-332.
Wood, E., F. Armstrong, and F. Richards. 1967. Determination of nitrate in sea water by cadmium copper reduction to nitrite. J. Mar. Bio. Ass. U.K. 47:23-31.
Yoon, W.B. and R. Benner. 1992. Denitrification and oxygen consumption in sediments of two south Texas estuaries. Mar. Ecol. Prog. Ser. 90:157-167.
Yoshinari, T. and R. Knowles. 1976. Acetylene inhibition of nitrous oxide reduction by denitrifying bacteria. Biochem. Biophys. Res. Commun. 69:705-710.
Zimmerman, A.R. and R. Benner. 1994. Denitrification, nutrient regeneration and carbon mineralization in sediments of Galveston Bay, Texas, USA. Mar. Ecol. Prog. Ser. 114:275-288.
Zumft, W.G. 1992. The denitrifying prokaryotes. pp. 554-582. In: A. Balows, ed. The prokaryotes: A handbook on the Biology of Bacteria: Ecophysiology, Isolation, Identification, Applications. Springer-Verlag, New York, NY.
161

APPENDIX 1
Algorithm for numerical modeling of N2 flux
(Chapter 2)
162
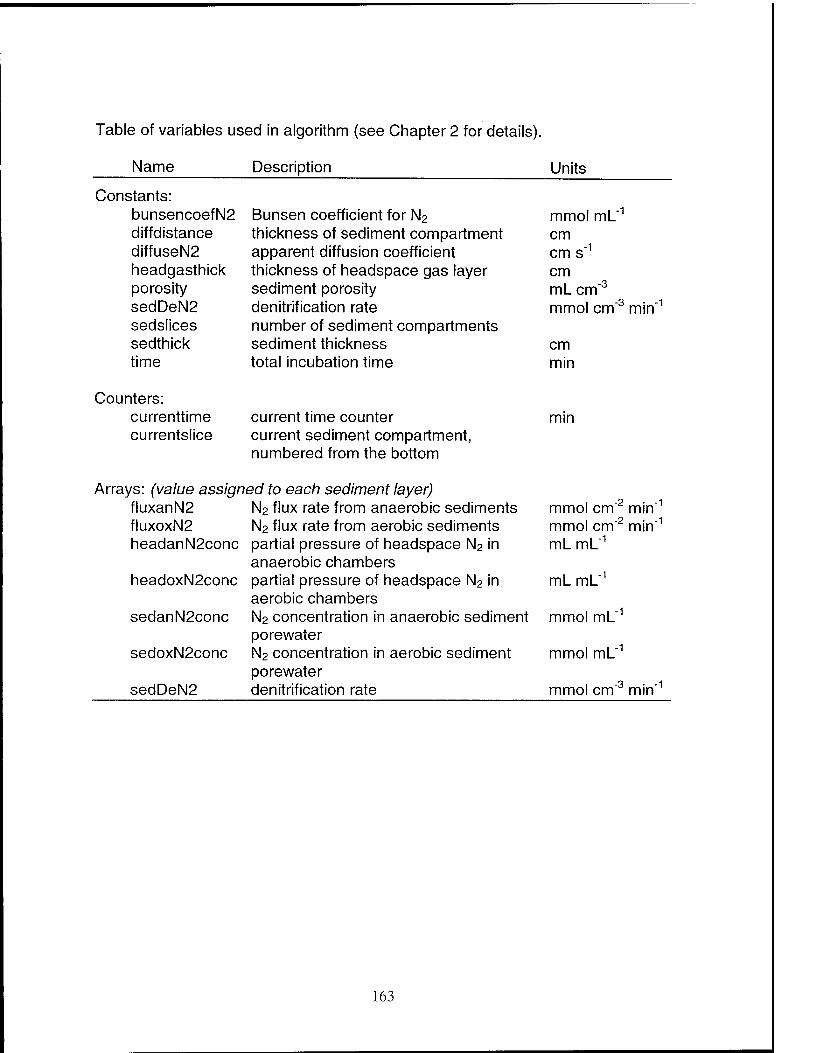
Table of variables used in algorithm (see Chapter 2 for details).
Name Description
Constants: bunsencoefN2 diffdistance diffuseN2 headgasthick porosity sedDeN2 sedslices sedthick time
Units
Bunsen coefficient for N2 mmol ml_"1
thickness of sediment compartment cm apparent diffusion coefficient cm s"1
thickness of headspace gas layer cm sediment porosity mL cm"3
denitrification rate mmol cm"3
number of sediment compartments sediment thickness cm total incubation time min
mm
Counters: currenttime currentslice
current time counter current sediment compartment, numbered from the bottom
mm
Arrays: (value assigned to each sediment layer) fluxanN2 fluxoxN2 headanN2conc
headoxN2conc
sedanN2conc
sedoxN2conc
sedDeN2
N2 flux rate from anaerobic sediments N2 flux rate from aerobic sediments partial pressure of headspace N2 in anaerobic chambers partial pressure of headspace N2 in aerobic chambers N2 concentration in anaerobic sediment porewate r N2 concentration in aerobic sediment porewater denitrification rate
mmol cm min mmol cm'2 min"1
mL mL"1
mL mL"1
mmol mL"1
mmol mL"1
mmol cm"3 min"1
163

GO W
52 =5"°
C\T<M
E CD
TJ CD
TJ CD O CD
CO O
CO
CD
CO
c CD
E E o o
CD T> O C_>
O D) CD
00
CO © O
"55 TJ CD CO
o
TJ CD CO O
II II CD CD
co £2 CO C
=5 £ «4— I—
:i= 3 TJ O
CD
E n v CD
E ■i—•
c CD i— i_ 3 O
CD
O Q
■J2 c CD
I CO
I o o c CD
■Q CD CO
c CD
i CD
-Q CO
CD
CD O o
CO w c
CD
"1
CD i_ i_ 3
Ü (J
C1 O r 1_ o o
CM
u Ü
CM
Z Z X t_ n CO
TJ u m CD co CO
_^_^ CD CD o O
77i co r i_ cii CD
l~
~J _J C> O
O o r c o o C) o
CM CM Z z X c o co
TJ Ü CD CD CO CO
CM CM
5 + CM b 3 O
CM
% A
.9 8 ■SI CD
CD ,- CO ^ 3
*♦— CD TJ
™ *
i2 >>
CD CO 3
O Q.
II II
O Q.
S CO p
CD Ö
— CD co =
II
CD ^->
2 o 3 3 Ü 5=
CD O
C CD
c\T z c CO X
_3
3 o
CD O
CD O CO
co •♦—
C CD
.5 •5 CD CO
CO co e o CO
CO
c Q. CD O t O 3
—I O
•~ TO
E CD
CC
CD ft
CD Ü
r t_
B to "co TJ TJ
CM CM Z *+— 01
Z CD
o (1
O O
r i_ cii CD (0 CO r s_ -i 3
X3 -U * * o o r L_ o O n O
(M CM
Z z X s_ o CO
TJ u m co CD CD
8 8 CM CM z z x c O co
TJ TJ CD CD CO CO
CM CM z z CD CD co co 3 3
H »*—
TJ T3 * *
co co 2 2 o o Q. Q. II II
22 CM CM z z x c o co X X 3 3
164

CD © O _o
"cö © CD
= 1 CO iS ■*—' rn
"cö c
CD ©
Z5 co .55 ^
CM T5 CD "a
CM © Ü
Z T5 «^ Z ro X ^ -»-• ^^ X o co ^. o co X 'aTx! © X T3 13 o 3= .2 _=3 «4—
1 i^i» i X!
^—.. V ^ c ^—^ ^
N2(
curr
et
rent
slic
e)
iN2(
curr
e © o "©■
M CO "cö -I—»
"co CO CO
© © 3»
© ■£ © © 5
3 x ^ b 3 o i_ o o o 3 CO
>< Ä * .2 CM J2 — z *r + c + ^~. CO ^
O^ 'sz 3£ CM Z © Q
CM Z © a
to CO O) •a CO ©
^CO Z O) C T3 CO CO
"O T- X T- "O X © © CO
+ CD "7 CD
© CO
+ 'S" o
^ CD "05 £.0 c ©
'aT o
~w
©
3
"cö -»—< ©
© co © fc c t 3,2 3, ©
co -t; c © © t b 3
3 o ri o Z! Q 3 o o c ° c O ÄCM 8^8
O 7 CO T3 "^ T3
C\T c o o
CM Z
^cT c o o
CM Z
z X o X
M—
8§ CM q z —
X o © 5 © co iS co c
X o + i +
co "O UJ ^-j o T3 o "D Ü
c © II © II © c © c o CO ,-^ CO ^^ CO CO o CO O
c CD O c o o
■
CD O
"co
II
'ST o
"cö
"^ II "^ I 1
© '© © O O Ü
co co co
C CD O c o
II
'ör g
o CM Z X o T3
»CM"
^ CO CO T3
T- CD c © ©
.!_» +-» -*-< c c c CD © © i i— i— ©
Ü
2?
*-• CD ©
CO © ©^ +
~£N + CM tu i_ o i: i- t- v- o s» ©
CO CD
A 13 Ü
Z5 _c^ c
CO
3 =3 Z3 "co
CD Ü
3 ^ c II
Ü 3 II E
CD o CD II o co C C C
o CO o C O c .£ "cö "w CD
O o o
T3 H—
O o O O © Ü
© •8 o u T3 H—
o CM
O © Ü CM
©
"5 © C "cö CM "O CM CM CM 13 CO CD
CM T3 Z CM Z 3 CD co
CO CD Z z z z o Z X Z c O II i_ cz X x c c II X o C CO ||
13 CD o O co co © o
^ o TS CO "O CD o o 1—
T3 T5 T3 "0 © TS CO TD CO ©
_© =5 © © © © c © © © © E ~U) O CO CO CO CO "to CO £Z CO SZ
CD !E CD •*-* +~j c c ■♦-j c -S? CD ^ Q. © -5 © =5 1_
1_ o t 3 1— 1—
.O co
ZS O
o Q
O 3 .o co
3 Ü
O O s £ 8" "a CD CD '~ o c cc DC Jj LU
165

Document Library Distribution List for Technical Report Exchange—November 1999
University of California, San Diego SIO Library 0175C 9500 Gilman Drive La Jolla, CA 92093-0175
Hancock Library of Biology & Oceanography Alan Hancock Laboratory University of Southern California University Park Los Angeles, CA 90089-0371
Gifts & Exchanges Library Bedford Institute of Oceanography P.O. Box 1006 Dartmouth, NS B2Y 4 A2 CANADA
NOAA/EDIS Miami Library Center 4301 Rickenbacker Causeway Miami, FL 33149
Research Library U.S. Army Corps of Engineers Waterways Experiment Station 3909 Halls Ferry Road Vicksburg, MS 39180-6199
Institute of Geophysics University of Hawaii Library Room 252 2525 Correa Road Honolulu, HI 96822
Marine Resources Information Center Building E38-320 MIT Cambridge, MA 02139
Library Lamont-Doherty Geological Observatory Columbia University Palisades, NY 10964
Library Serials Department Oregon State University Corvallis, OR 97331
Pell Marine Science Library University of Rhode Island Narragansett Bay Campus Narragansett, Rl 02882
Working Collection Texas A&M University Dept. of Oceanography College Station, TX 77843
Fisheries-Oceanography Library 151 Oceanography Teaching Bldg. University of Washington Seattle, WA 98195
Library R.S.M.A.S. University of Miami 4600 Rickenbacker Causeway Miami, FL 33149
Maury Oceanographic Library Naval Oceanographic Office Building 1003 South 1002 Balch Blvd. Stennis Space Center, MS 39522-5001
Library Institute of Ocean Sciences P.O. Box 6000 Sidney, B.C. V8L 4B2 CANADA
National Oceanographic Library Southampton Oceanography Centre European Way Southampton S014 3ZH UK
The Librarian CSIRO Marine Laboratories G.P.O. Box 1538 Hobart, Tasmania AUSTRALIA 7001
Library Proudman Oceanographic Laboratory Bidston Observatory Birkenhead Merseyside L43 7 RA UK
IFREMER Centre de Brest Service Documentation-Publications BP 70 29280 PLOUZANE FRANCE
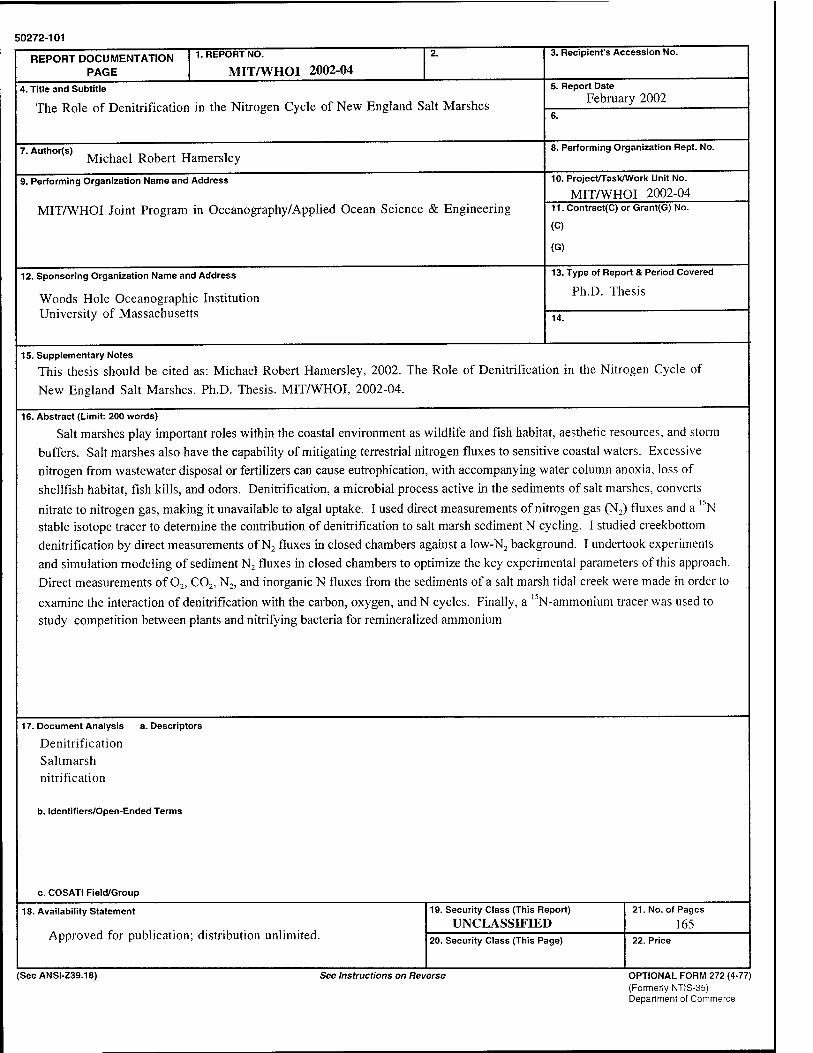
50272-101
REPORT DOCUMENTATION PAGE
1. REPORT NO.
MIT/WHOI 2002-04 2. 3. Recipient's Accession No.
4. Title and Subtitle
The Role of Denitrification in the Nitrogen Cycle of New England Salt Marshes
5. Report Date February 2002
6.
7. Authors) „. , , _ , TT , Michael Robert Hamersley
8. Performing Organization Rept. No.
9. Performing Organization Name and Address
MIT/WHOI Joint Program in Oceanography/Applied Ocean Science & Engineering
10. Project/Task/Work Unit No.
MIT/WHOI 2002-04 11. Contract(C) or Grant(G) No.
(C)
(G)
12. Sponsoring Organization Name and Address
Woods Hole Oceanographic Institution University of Massachusetts
13. Type of Report & Period Covered
Ph.D. Thesis
14.
15. Supplementary Notes
This thesis should be cited as: Michael Robert Hamersley, 2002. The Role of Denitrification in the Nitrogen Cycle of
New England Salt Marshes. Ph.D. Thesis. MIT/WHOI, 2002-04.
16. Abstract (Limit: 200 words)
Salt marshes play important roles within the coastal environment as wildlife and fish habitat, aesthetic resources, and storm
buffers. Salt marshes also have the capability of mitigating terrestrial nitrogen fluxes to sensitive coastal waters. Excessive nitrogen from wastewater disposal or fertilizers can cause eutrophication, with accompanying water column anoxia, loss of
shellfish habitat, fish kills, and odors. Denitrification, a microbial process active in the sediments of salt marshes, converts
nitrate to nitrogen gas, making it unavailable to algal uptake. I used direct measurements of nitrogen gas (N2) fluxes and a JN stable isotope tracer to determine the contribution of denitrification to salt marsh sediment N cycling. I studied creekbottom denitrification by direct measurements of N2 fluxes in closed chambers against a low-N2 background. I undertook experiments and simulation modeling of sediment N2 fluxes in closed chambers to optimize the key experimental parameters of this approach.
Direct measurements of 02, C02, N2, and inorganic N fluxes from the sediments of a salt marsh tidal creek were made in order to
examine the interaction of denitrification with the carbon, oxygen, and N cycles. Finally, a ' N-ammonium tracer was used to study competition between plants and nitrifying bacteria for remineralized ammonium
17. Document Analysis a. Descriptors
Denitrification Saltmarsh nitrification
b. Identifiers/Open-Ended Terms
c. COSATI Field/Group
18. Availability Statement 19. Security Class (This Report) UNCLASSIFIED
21. No. of Pages
165 Approvea ror puDiication ; custriDuiion unlimited. 20. Security Class (This Page) 22. Price
(SeeANSI-Z39.18) See Instructions on Reverse OPTIONAL FORM 272 (4-77) (Formerly NTIS-35) Department of Commerce