doctoral thesis 2019 drying process intensification …
TRANSCRIPT
DOCTORAL THESIS 2019
DRYING PROCESS INTENSIFICATION BY USING FREEZING PRE-TREATMENTS AND
ULTRASOUND APPLICATION AT HIGH AND LOW TEMPERATURE
Francisca Vallespir Torrens

DOCTORAL THESIS
2019
Doctoral Programme of Chemical Science and Technology
DRYING PROCESS INTENSIFICATION BY USING FREEZING PRE-TREATMENTS AND ULTRASOUND APPLICATION AT HIGH
AND LOW TEMPERATURE
Francisca Vallespir Torrens
Thesis Supervisor: Carmen Rosselló Matas
Thesis Supervisor: Susana Simal Florindo
Thesis tutor: Antoni Femenia Marroig
Doctor by the Universitat de les Illes Balears

Doctoral thesis Francisca Vallespir Torrens

Doctoral thesis Francisca Vallespir Torrens
Dr Carmen Rosselló Matas, of University of the Balearic Islands
I DECLARE:
That the thesis titles Drying process intensification by using freezing pre-treatments and ultrasound application at high and low temperature, presented by Francisca Vallespir Torrens to obtain a doctoral degree, has been completed under my supervision.
For all intents and purposes, I hereby sign this document.
Signature
Palma de Mallorca, 3rd June 2019
3
Doctoral thesis Francisca Vallespir Torrens
Dr Susana Simal Florindo, of University of the Balearic Islands
I DECLARE:
That the thesis titles Drying process intensification by using freezing pre-treatments and ultrasound application at high and low temperature, presented by Francisca Vallespir Torrens to obtain a doctoral degree, has been completed under my supervision.
For all intents and purposes, I hereby sign this document.
Signature
Palma de Mallorca, 3rd June 2019
4

Doctoral thesis Francisca Vallespir Torrens
PAPERS LIST
This doctoral thesis titled “Drying process intensification by using freezing pre-
treatments and ultrasound application at high and low temperature” whose author
is Francisca Vallespir Torrens, is presented as papers compendium, which are
listed below:
• Vallespir, F., Rodríguez, Ó., Eim, V. S., Rosselló, C., & Simal, S. (2018). Freezing pre-treatments on the intensification of the drying process of vegetables with different structures. Journal of Food Engineering, 239, 83-91. doi: 10.1016/j.jfoodeng.2018.07.008
• Vallespir, F., Rodríguez, Ó., Eim, V. S., Rosselló, C., & Simal, S. (2019). Effects of freezing treatments before convective drying on quality parameters: Vegetables with different microstructures. Journal of Food Engineering, 249, 15-24. doi: 10.1016/j.jfoodeng.2019.01.006
• Vallespir, F., Cárcel, J. A., Marra, F., Eim, V. S., & Simal, S. (2018). Improvement of mass transfer by freezing pre-treatment and ultrasound application on the convective drying of beetroot (Beta vulgaris L.). Food and Bioprocess Technology, 11(1), 72-83. doi: 10.1007/s11947-017-1999-8
• Vallespir, F., Rodríguez, Ó., Cárcel, J. A., Rosselló, C., & Simal, S. (2019). Ultrasound assisted low-temperature drying of kiwifruit: Effects on drying kinetics, bioactive compounds and antioxidant activity. Journal of the Science of Food and Agriculture, 99(6), 2901-2909. doi: 10.1002/jsfa.9503
• Vallespir, F., Crescenzo, L., Rodríguez, Ó., Marra, F., & Simal, S. (2019). Intensification of low-temperature drying of mushroom by means of power ultrasound: effects on drying kinetics and quality parameters. Food and Bioprocess Technology, 12(5), 839-851. doi: 10.1007/s11947-019-02263-5
Co-authors agreement letters are presented in Annex I.
Furthermore, the contributions to national and international congresses from the studies presented in this doctoral thesis have been collected in Annex II.
5

Doctoral thesis Francisca Vallespir Torrens
6
Doctoral thesis Francisca Vallespir Torrens
To my parents, my sister
and my soulmate, Miquel.
7

Doctoral thesis Francisca Vallespir Torrens
8
Doctoral thesis Francisca Vallespir Torrens
ACKNOWLEDGEMENT
I would like to acknowledge my directors, Carmen and Susana for their dedication and support as well as my laboratory colleagues, especially Valeria, Óscar and Rafa which I also consider my mentors.
Moreover, the author and the directors would like to acknowledge the Spanish government for the MINECO fellowship (BES-2013-064131) and the financial support for the following projects:
o “Aplicación de los ultrasonidos de potencia (UdP) en la intensificación de los procesos de secado a baja temperatura (DPI 2012-37466-C03-02)” of the Spanish government (MINECO).
o “Revalorización integral de subproductos en función de sus usos potenciales: Extracción de compuestos de interés mediante aplicación de US de potencia y estudios de bioaccesibilidad in vitro (RTA 2015-00060-C04-03)” of the National Institute of Research and Agro-Food Technology (INIA) and co-financed with ERDF funds.
9

Doctoral thesis Francisca Vallespir Torrens
10
Doctoral thesis Francisca Vallespir Torrens INDEX
INDEX
FIGURES INDEX ............................................................................................. 13
TABLES INDEX ................................................................................................ 17
ABSTRACT ...................................................................................................... 19
RESUMEN ....................................................................................................... 25
RESUM ............................................................................................................ 31
NOMENCLATURE ........................................................................................... 37
INTRODUCTION .............................................................................................. 41
1. Intensification of the drying process .................................................... 43
1.1. Convective drying process ............................................................... 44
1.1.1. Transport phenomena ............................................................ 44
1.1.2. Transport resistances of the mass transfer ............................ 45
1.1.3. Drying curve ........................................................................... 46
1.1.4. Volume shrinkage .................................................................. 47
1.2. Drying kinetics modelling and simulation ......................................... 48
1.2.1. Modelling steps in a diffusion model ...................................... 49
1.3. Quality parameters changes during convective drying ..................... 52
1.4. Low-temperature drying ................................................................... 54
2. Drying pre-treatments: freezing pre-treatment .................................... 55
2.1. Freezing pre-treatment characteristics ............................................. 55
2.1.1. Freezing rate .......................................................................... 55
2.1.2. Freezing equipment ............................................................... 55
2.2. Freezing pre-treatment and material structure ................................. 56
2.3. Freezing pre-treatment effects on drying kinetics ............................ 56
2.4. Freezing pre-treatment effects on dried product quality ................... 57
3. Energy assistance during drying process: ultrasound application ....... 57
3.1. Ultrasound characteristics ................................................................ 58
3.1.1. Ultrasound waves ................................................................... 58
3.1.2. High-intensity ultrasound equipment in drying process .......... 59
3.2. High-intensity ultrasound and material structure during drying process 60
3.3. High-intensity ultrasound effects on drying kinetics ......................... 61
3.4. High-intensity ultrasound effects on dried product quality ................ 62
4. Overall perspective.............................................................................. 63
5. Research hypotheses .......................................................................... 64
6. References .......................................................................................... 65
11
Doctoral thesis Francisca Vallespir Torrens INDEX
OBJECTIVES ................................................................................................... 73
WORKING PLAN ............................................................................................. 77
RESULTS AND DISCUSSION ......................................................................... 83
CHAPTER 1: Hot-air drying intensification by using freezing pre-treatments……………………………………………………………………..85
CHAPTER 2: Hot-air drying intensification by using freezing pre-treatment and ultrasound application…………………………………………………107
CHAPTER 3: Low-temperature drying intensification by ultrasound application……………………………………………………………………123
ADDITIONAL DISCUSSION……………………………………………………….149
CONCLUSIONS…………………………………………………………………….159
RECOMMENDATIONS…………………………………………………………….163
Annex 1……………………………………………………………………………....167
Annex 2……………………………………………………………………………....175
12
Doctoral thesis Francisca Vallespir Torrens FIGURES INDEX
FIGURES INDEX
INTRODUCTION
Figure 1. Mass and heat transfer processes during food materials drying ……..…………………………………………………………………………………..44
Figure 2. Mass transfer between two mediums. Double resistance concept ……….………………………………………………………………….……………..45
Figure 3. Representation of the drying rate vs the average moisture content of the solid. Drying periods: (A) Induction drying period; (B) constant rate drying period; (C) falling rate drying period.……………………………………………….46
Figure 4. Modelling steps scheme………………………………………………….49
Figure 5. Ultrasound drying system in convective drying of fruits and vegetables, adapted from Cárcel et al. (2007)…………………………………………………..60
Figure 6. Working plan structure. Legend: T=temperature; v= air velocity; US=ultrasound power density.……………………………………....……………...79
CHAPTER 1. Hot-air drying intensification by using freezing pre-treatments:
Freezing pre-treatments on the intensification of the drying process of vegetables with different structures
Figure 1. Schematic layout of the lab-scale convective drier. 1: Fan, 2: Digital anemometer, 3: Heating system, 4: Temperature sensor, 5: Three-way valve, 6: Sample tray, 7: Digital scale, 8: Lineal engine, 9: Controllers and data acquisition target and 10: Computer…………………………………………………………….89
Figure 2. Drying curves of untreated (U) and pre-frozen (F20, F80 and FLN) beetroot (a), apple (b) and eggplant (c) cubes (50 °C and 1 m/s). Average value ± standard deviation………………………………………………………………….90
Figure 3. Predicted vs. experimental average moisture content. Drying experiments carried out with untreated (U) and pre-frozen (F20, F80 and FLN) beetroot (a), apple (b) and eggplant (c) cubes (50 °C and 1 m/s)……………....92
Figure 4. Scanning electron micrographs of untreated (U) and frozen samples (F20, F80 and FLN) of beetroot, apple and eggplant before drying. ic=isodiametrical cells, d=disruptions, f=fissures…………………………………93
Figure 5. Scanning electron micrographs of untreated (U) and frozen samples (F20, F80 and FLN) of beetroot, apple and eggplant after drying (50 °C and 1 m/s). c=contraction, d=disruptions, f=fissures…………………………………….94
Effects of freezing treatments before convective drying on quality parameters: Vegetables with different microstructures
13
Doctoral thesis Francisca Vallespir Torrens FIGURES INDEX
Figure 1. Beetroot, apple and eggplant cubes freezing curves at −20 °C (F20), at
−80 °C (F80) and by liquid nitrogen immersion (FLN). Average values ± standard deviations……………………………………………………………………………..99
Figure 2. Light microscope photographs of untreated (U) and frozen (F20, F80 and FLN) beetroot, apple and eggplant. Legend: f=fissure, d=disruptions……101
Figure 3. Light microscope photographs of untreated (UD) and frozen (F20D, F80D and FLND) beetroot, apple and eggplant after drying (50 °C and 1 m/s). Legend: s=shrinkage, f=fissure, d=disruptions…………………………………101
Figure 4. Cell area percentile profiles of untreated (U) and frozen (F20, F80 and FLN) beetroot, apple and eggplant microstructure. Average values ± standard deviations……………………………………………………………………………102
Figure 5. Stress vs strain curves of untreated (U) and frozen (F20, F80 and FLN) beetroot, apple and eggplant cubes. Average values ± standard deviations…………………………………………………………………………....103
Figure 6. Total Polyphenol Content (TPC) (mg GAE/g d.m.) for samples of untreated (U), frozen (F20, F80 and FLN) and frozen-dried (UD, F20D, F80D and FLND) (50 °C and 1 m/s) beetroot, apple and eggplant. Average values ± standard deviations. Means with different letter in the same product showed significant differences according to Tukey’s test (p<0.05)……………………....104
Figure 7. Antioxidant activity (AA) (mg TE/g d.m.) determined by FRAP, CUPRAC and ABTS methods for samples of untreated (U), frozen (F20, F80 and FLN) and frozen-dried (UD, F20D, F80D and FLND) (50 °C and 1 m/s) beetroot, apple and eggplant. Average values ± standard deviations. Means with different letter for the same product and method showed significant differences according to Tukey’s test (p<0.05)…………………………………………………………….…104
CHAPTER 2. Hot-air drying intensification by using freezing pre-treatment and ultrasound application:
Improvement of mass transfer by freezing pre-treatment and ultrasound application on the convective drying of beetroot (Beta vulgaris L.)
Figure 1. Light microscope photographs of raw (R), pre-frozen (F) and dried beetroot cubes (40 °C and 1 m/s), without (0) and with ultrasound application at 16.4 kW/m3 (1) and 26.7 kW/m3 (2). Legend: is=intercellular spaces, s=shrinkage, f=fissure, d=disruptions, m=micro-channels……………………………….…….113
Figure 2. Drying curves of raw (R) and pre-frozen (F) beetroot cubes (40 °C and 1 m/s), without (0) and with ultrasound application at 16.4 kW/m3 (1) and 26.7 kW/m3 (2). Average value ± standard deviation…………………………………114
Figure 3. Variation of mass flux vs average moisture content during convective air-drying (40 °C, 1 m/s) of raw (R) and pre-frozen (F) beetroot cubes without (0) and with ultrasound application at 16.4 kW/m3 (1) and 26.7 kW/m3 (2). Average value ± standard deviation……………………………………………..………..…114
14
Doctoral thesis Francisca Vallespir Torrens FIGURES INDEX
Figure 4. Predicted vs. experimental average moisture content. Drying experiments carried out with raw (R) and pre-frozen (F) beetroot cubes (40 °C and 1 m/s), without (0) and with ultrasound application at 16.4 kW/m3 (1) and 26.7 kW/m3 (2)……………………………………………………………………….....…116
Figure 5. Total polyphenol (a), betaxanthins (b) and betacyanins (c) contents (mg GAE or IE or BE/g dm) of raw (R;---), pre-frozen (F;___) and dried (40 °C and 1 m/s) beetroot cubes, without (0) and with ultrasound application at 16.4 kW/m3 (1) and 26.7 kW/m3 (2). Average value ± standard deviation. Means with different letter for total polyphenol, betaxanthins or betacyanins contents show significant differences according to Tukey’s test (p<0.05)…………………………………...117
Figure 6. Antioxidant activity (AA) (mg TE/g dm) determined by FRAP (a), CUPRAC (b) and ABTS (c) methods for samples of raw (R;---), pre-frozen (F;____) and dried (40 °C and 1 m/s) beetroot cubes without (0) and with ultrasound application at 16.4 kW/m3 (1) and 26.7 kW/m3 (2). Average value ± standard deviation. Means with different letter for antioxidant activity show significant differences according to Tukey’s test (p<0.05)…………………………………...117
CHAPTER 3. Low-temperature drying intensification by ultrasound application:
Ultrasound assisted low-temperature drying of kiwifruit. Effects on kinetics, bioactive compounds and antioxidant activity
Figure 1. Schematic layout of the drying system. Arrows indicate the air blowing direction. A: Electronic scale, B: Drying chamber, C: Cylindrical radiator, D: Fan, E: Desiccant material, F: Humidity and temperature sensor, G: Flow sensor, H: Proportional-integral-derivative controller, I: Computer, J: Power ultrasonic transducer, K: Dynamic resonance controller and power amplifier………….....126
Figure 2. Experimental and predicted drying kinetics of kiwifruit without (AIR) and with 20.5 kW/m3 of acoustic assistance (AIR+US) at 5, 10 and 15 °C. Average values ± standard deviations……………………………………………….………128
Figure 3. Influence of drying air temperature on the average effective diffusion and external mass transfer coefficients identified for kiwifruit drying without (AIR) and with 20.5 kW/m3 of acoustic assistance (AIR+US) at 5, 10 and 15 °C. Average values ± standard deviations……………………………………………129
Figure 4. Kiwifruit losses (%) of ascorbic acid content (AAC), vitamin E content (VEC) and total polyphenol content (TPC) after drying at 5, 10 and 15 °C without (AIR, white bars) and with 20.5 kW/m3 of acoustic assistance (AIR+US, grey bars). Average values ± standard deviations. Means with different letters for AAC, VEC or TPC losses showed significant differences according to Tukey’s test (p<0.05)………………………………………………………………………………131
Figure 5. Kiwifruit losses (%) of antioxidant activity (AA), according to FRAP, CUPRAC and ABTS methods, after drying at 5, 10 and 15 °C without (AIR, white bars) and with 20.5 kW/m3 of acoustic assistance (AIR+US, grey bars). Average values ± standard deviations. Means with different letters for AA losses, according to FRAP, CUPRAC or ABTS methods, showed significant differences according to Tukey’s test (p<0.05)………………………………………..……….132
15
Doctoral thesis Francisca Vallespir Torrens FIGURES INDEX
Intensification of low-temperature drying of mushroom by means of power ultrasound: effects on drying kinetics and quality parameters
Figure 1. Mushroom experimental kinetics at 5, 10 and 15 °C without (AIR) and with 20.5 kW/m3 and 22 kHz of ultrasound application (AIR+US). Average values ± standard deviations………………………………………………………………140
Figure 2. Predicted vs experimental moisture content, linear regression (slope and y-intercept) and predicted bounds at 95% of confidence of mushroom drying kinetics at 5, 10 and 15 °C without and with 20.5 kW/m3 and 22 kHz of ultrasound application. Slope and y-intercept 95% of confidence limits are presented in brackets……………………………………………………………………….….….142
Figure 3. Light microscope photographs of dried samples at 5, 10 and 15 °C without (AIR) and with 20.5 kW/m3 and 22 kHz of ultrasound application (AIR+US). Legend: s=shrinkage, h=hollows, m=micro-channels……………..143
Figure 4. Ergosterol content (EC) and total polyphenol contents (TPC) (mg of ergosterol or GAE/g d.m.) in dried mushroom samples at 5, 10 and 15 °C without (AIR, white bars) and with 20.5 kW/m3 and 22 kHz of acoustic assistance (AIR+US, grey bars). Average values ± standard deviations. Means with different letter for EC or TPC showed significant differences according to Tukey’s test (p<0.05)………………………………………………………………………….….144
Figure 5. Antioxidant activity (AA) according to FRAP, CUPRAC and ABTS methods (mg TE/g d.m.) in dried mushroom samples at 5, 10 and 15 °C without (AIR, white bars) and with 20.5 kW/m3 and 22 kHz of acoustic assistance (AIR+US, grey bars). Average values ± standard deviations. Means with different letter for AA, according to FRAP, CUPRAC or ABTS methods, showed significant differences according to Tukey’s test (p<0.05)……………………….………...144
Figure 6. Browning Index (BI) of dried mushroom samples at 5, 10 and 15 °C without (AIR, white bars) and with 20.5 kW/m3 and 22 kHz of ultrasound application (AIR+US, grey bars). Average values ± standard deviations. Means with different letter for BI showed significant differences according to Tukey’s test (p<0.05)……………………………………………………………………………...145
Figure 7. Swelling (SW), water retention capacity (WRC) and fat adsorption capacity (FAC) of dried mushroom samples at 5, 10 and 15 °C without (AIR, white bars) and with 20.5 kW/m3 and 22 kHz of ultrasound application (AIR+US, grey bars). Average values ± standard deviations. Means with different letter for SW, WRC or FAC showed significant differences according to Tukey’s test (p<0.05)………………………………………………………………………………145
16

Doctoral thesis Francisca Vallespir Torrens TABLES INDEX
TABLES INDEX
INTRODUCTION
Table 1. Food quality changes, adapted from Chua and Chou (2014).………………………………………………………………………………...52
CHAPTER 1. Hot-air drying intensification by using freezing pre-treatments:
Freezing pre-treatments on the intensification of the drying process of vegetables with different structures
Table 1. Freezing pre-treatment conditions of beetroot, apple and eggplant….89
Table 2. Drying time (final moisture content of 0.6 kg/kg dm), identified De, MRE and var for beetroot, apple and eggplant drying kinetics. Average values ± standard deviations. Means with different letter in the same column for the same product mean significant differences according to Tukey’s test (p<0.05)………………………………………………………………………………..91
Table 3. Total colour change (ΔE) of untreated (U) and frozen (F20, F80 and FLN) beetroot, apple and eggplant cubes before and after drying. Average values ± standard deviations. Means with different letter for the same product mean significant differences according to Tukey’s test (p<0.05)………………….……93
Effects of freezing treatments before convective drying on quality parameters: Vegetables with different microstructures
Table 1. Drying time (h) of untreated (U) and frozen (F20, F80 and FLN) beetroot, apple and eggplant cubes (50 °C and 1 m/s) to reach a moisture content of 0.9 kg water/kg d.m……………………………………………………........................100
Table 2. Cell number per unit of tissue surface (Cell number/mm2) of the untreated (U) and frozen/thawed (F20, F80 and FLN) beetroot, apple and eggplant samples…………………………………………………………………...102
Table 3. Elastic modulus, E (kPa), obtained from texture tests of the untreated (U) and frozen/thawed (F20, F80 and FLN) beetroot, apple and eggplant samples before drying………………………………………………………………………...103
CHAPTER 2. Hot-air drying intensification by using freezing pre-treatment and ultrasound application:
Improvement of mass transfer by freezing pre-treatment and ultrasound application on the convective drying of beetroot (Beta vulgaris L.)
Table 1. Identified figures for the external mass transfer (hm) and the effective diffusion (De) coefficients, mean relative error (MRE) and percentage of explained variance (Var) obtained by comparison between the experimental and simulated drying curves of beetroot at 40 °C and 1 m/s.…………………………….….…115
17

Doctoral thesis Francisca Vallespir Torrens TABLES INDEX
CHAPTER 3. Low-temperature drying intensification by ultrasound application:
Ultrasound assisted low-temperature drying of kiwifruit. Effects on kinetics, bioactive compounds and antioxidant activity
Table 1. Identified effective diffusion (De) and external mass transfer (hm) coefficients together with the MRE and var, for each set of drying experiments without (AIR) and with 20.5 kW/m3 of acoustic assistance (AIR+US) at different temperatures.………………………………………………………………………..129
Intensification of low-temperature drying of mushroom by means of power ultrasound: effects on drying kinetics and quality parameters
Table 1. Identified effective diffusion coefficient (De) and the external mass transfer coefficient (hm) together with the MRE and var for each set of mushroom drying experiments without (AIR) and with 20.5 kW/m3 of acoustic assistance (AIR+US) at drying temperatures of 5, 10 and 15 °C. Average values ± standard deviations. Means with different letter for De or hm showed significant differences according to Tukey’s test (p<0.05)……………………………………….………..141
ADDITIONAL INFORMATION
Table 1. Shrinkage correlations used in Chapter 1 for apple, eggplant and beetroot drying diffusion models………………………………………..…………151
Table 2. Energy consumptions and specific energy consumption of experiments carried out with beetroot, apple and eggplant in Chapter 1…………………….153
Table 3. Energy consumptions and specific energy consumption of beetroot
experiments of Chapter 2……….…………………………………………………154
Table 4. Energy consumptions and specific energy consumption of experiments
carried out with kiwifruit and mushroom experiments in Chapter 3…...………155
18
Doctoral thesis Francisca Vallespir Torrens ABSTRACT
ABSTRACT
Drying process is commonly used to reduce fruits and vegetables moisture content in order to enlarge their shelf life. However, convective drying can promote product quality parameters losses due to thermal and air exposure. Low-
temperature drying at temperatures below 20 C but above 0 C usually produces high quality dried products but it may exhibit low mass transfer rates. In order to intensify convective drying, both freezing pre-treatment and ultrasound application have been used in this study with the aim of shortening drying time and preserving quality parameters. Freezing pre-treatments at different freezing rates as well as ultrasound application at different power densities and/or drying temperatures (hot-air and low-temperature drying) may have different effects on different products and few studies have been found about it.
Consequently, the two general objectives of this work were, on the one hand, to
study the drying process intensification at drying temperature above 20 C by using freezing pre-treatments and ultrasound application; and on the other hand, to study also the intensification of the low-temperature drying process (at
temperatures between 0 and 20 ) when ultrasound was applied. In order to reach these aims, the effects on both the drying kinetics and the quality parameters of the products were evaluated.
In Chapter 1, the effects of different freezing pre-treatments (at −20 C, at −80 C
and by liquid nitrogen immersion) on the hot-air drying kinetics (at 50 C), microstructure and quality parameters of three vegetal products with different initial microstructure (beetroot, apple and eggplant), were studied.
The results presented in this chapter indicated that freezing pre-treatments significantly reduced the drying time (12-34%). Freezing pre-treatment affected differently depending on both the original microstructure of the vegetal and the freezing rate. The original beetroot microstructure seemed to be more compact as it has a low porosity figure. Meanwhile, apple and eggplant have medium-high porosity figures and more fragile original microstructures. Thus, the magnitude of the drying time reduction was higher in the most porous vegetable (eggplant), and lower in the less porous one (beetroot). Moreover, freezing by immersion in
liquid nitrogen (freezing rate of −144±20 C/min) had less impact in the drying
time of beetroot and eggplant than freezing at −20 and −80 C probably because the freezing velocity was lower in these cases than in freezing by immersion in
liquid nitrogen (−0.8±0.2 ºC and −1.9±0.4 C/min, respectively). Drying time of apple was similarly affected by the three studied freezing methods.
After the analyses of the drying kinetics through the diffusion model, the identified effective diffusion coefficient significantly increased when the freezing pre-treatments were applied between 18 and 31% (beetroot), between 42 and 64% (apple), and between 18 and 72% (eggplant), and, in all cases, the higher figure
was observed when samples were frozen at −20 °C before drying.
19
Doctoral thesis Francisca Vallespir Torrens ABSTRACT
Microstructure of frozen beetroot, apple and eggplant was studied by scanning electron microscopy (SEM) and light microscopy techniques. Each product was affected differently by the freezing pre-treatments depending on their fresh tissue structure, which was very different among them. Moreover, comparing among different freezing treatments, the lower the freezing velocity the more important damage observed, probably because of larger ice crystals grown. After drying, shrinkage and collapse was observed in all samples. After drying, frozen samples presented the sum of freezing and drying effects, thus, a more damaged structure than the corresponding of the untreated samples was observed.
Regarding the physical properties, total colour change and texture were evaluated after freezing and also after drying. Total colour change of all frozen samples with regard to untreated samples before drying was higher than 2.3 which is a noticeable colour change. After drying, total colour change of frozen samples was significantly higher than that of untreated samples and differences were smaller in the case of beetroot (2-4 units) than in the case of apple and eggplant (15-22 units). Texture profiles, obtained by the compression of frozen and defrozen samples before drying, were significantly lower than corresponding untreated samples. However, no significant differences were observed among the texture of all frozen apple and eggplant samples, respectively, and only minor differences were observed in beetroot between samples frozen by liquid nitrogen
immersion and at −20 °C or at −80 °C.
Total polyphenol content and antioxidant activity of frozen samples were, in general, significantly lower than those of the corresponding untreated samples before and after drying. The freezing pre-treatment by liquid nitrogen immersion was the one which promoted the lowest losses, probably due to a lower degradation and oxidation of bioactive compounds since freezing rate was very fast and small crystals were grown. In fact, total polyphenol content and antioxidant activity of beetroot sample frozen by liquid nitrogen immersion were not significantly different to those of the untreated sample before (total polyphenol content and antioxidant activity) and after (antioxidant activity) drying.
To sum up, freezing pre-treatment promoted higher changes on high porosity products (eggplant and apple) than in low porosity products (beetroot). Thus, higher drying rate enhancement and quality parameters losses were observed in eggplant and apple than in beetroot. With regard to the different freezing pre-treatments studied, freezing by liquid nitrogen immersion seemed to promote minor structure damage, less drying rate enhancement and quality parameters losses probably due to its fast freezing rate and small crystals formation.
Meanwhile, freezing pre-treatments at −20 and −80 °C could not be distinguished among themselves in analysed parameters due their slow and similar freezing rates.
In Chapter 2, the effects of both freezing (at −20 C) prior to drying and the ultrasound assistance during drying (at acoustic power densities of 16.4 and 26.7
kW/m3) on the drying kinetics (at 40 C), microstructure and quality parameters of beetroot were evaluated.
From the obtained results, it has been observed that drying time of beetroot significantly decreased when ultrasound was applied during drying being higher
20
Doctoral thesis Francisca Vallespir Torrens ABSTRACT
the reduction when the highest acoustic density was applied (36 and 43% at 16.4 and 26.7 kW/m3, respectively). Higher beetroot drying time decreases were observed when samples were frozen before drying without (46%) or with ultrasound application being also slightly higher when the highest acoustic density was applied (55 and 58% at 16.4 and 26.7 kW/m3, respectively).
Analysing the drying curves by using a diffusion model, it was observed that freezing pre-treatment induced an increase in the effective diffusion coefficient by 158%. Moreover, ultrasound application during drying induced considerable increases in both the external mass transfer coefficient (28 and 49% at 16.4 and 26.7 kW/m3 of acoustic density, respectively) and the effective diffusion coefficient (60 and 73% at 16.4 and 26.7 kW/m3 of acoustic density, respectively). When freezing pre-treatment and ultrasound were both applied, higher increases of effective diffusion coefficient (204 and 211% at 16.4 and 26.7 kW/m3 of acoustic density, respectively) were observed and, as it was expected, no effect of the freezing pre-treatment on the external mass transfer coefficient was observed. Therefore, both freezing pre-treatment and ultrasound application during beetroot drying were suitable to significantly reduce the drying time and enhance the mass transfer.
Microstructure observations pointed out that disruptions and fissures occurred in beetroot tissue after freezing pre-treatment and shrinkage took place when samples were dried. Moreover, when drying was carried out by applying ultrasound, larger pores and micro-channels were observed.
With regard to the effects of processing, freezing caused significant bioactive compounds contents and antioxidant activity increases (between 16 and 57%), probably due to the release of free forms of active compounds from the food matrix, meanwhile drying had the opposite effect (decreases between 10 and 54%). Moreover, in general, when samples were frozen before drying or ultrasound was applied during drying, decreases were higher (28-58% and 39-81%, respectively), especially when they were applied simultaneously (decreases between 50 and 79%). However, in the case of betalain contents, no significant differences were observed between raw and frozen samples after drying and between frozen samples after drying when different acoustic densities were applied, probably due to thermal exposure time shortening.
In conclusion, freezing pre-treatment and ultrasound application enhanced beetroot drying but important changes in microstructure, bioactive compounds contents and antioxidant activity were promoted although drying time shortening preserved betalain contents in some cases.
Finally, in Chapter 3, the effects of the ultrasound application (at acoustic power density of 20.5 kW/m3) on the low-temperature drying kinetics (at 5, 10 and 15
C), microstructure and quality parameters of kiwifruit and mushroom were evaluated.
In kiwifruit drying assisted by ultrasound, drying time shortening of 55-65% was observed. From the drying kinetics analyses through the diffusion model, it was concluded that the acoustic energy caused an increment in the effective diffusion coefficient by up to 120-175% and in the external mass transfer coefficient by up to 103-231%, which indicates an important improvement in the drying rate. The
21
Doctoral thesis Francisca Vallespir Torrens ABSTRACT
rise of the drying temperature, decreased the ultrasound application effects on kiwifruit drying rate within the rage of temperatures studied.
Regarding mushroom drying, when ultrasound was applied, also significantly shorter drying times were observed (41-66% decrease) and significantly higher effective diffusion coefficient (76-184% increase) and external mass transfer coefficient (61-157% increase) were identified with the proposed diffusion model, compared with the drying without ultrasound application, within the studied temperature range (5-15 ºC). Thus, ultrasound enhanced also mushroom moisture removal during drying. Moreover, effects of ultrasound application in mushroom drying enhancement were higher at higher drying temperatures.
Comparing between the ultrasound effects on low-temperature drying process of kiwifruit and mushroom, similar drying rate enhancement was observed because similar drying time reductions and mass transfer coefficients increments were obtained. However, the drying temperature influence was higher in kiwifruit drying than in mushroom drying. Moreover, as the temperature rose, higher ultrasound application effects were observed in mushroom drying than in kiwifruit drying. Therefore, different products showed again, different behaviours under ultrasound application within the range of conditions considered.
After drying, significantly lower bioactive compounds contents (14-54% of loss) and antioxidant activity (23-69% of loss) were observed in all dried kiwifruit samples, compared with the fresh sample, being the sample dried at 15 ºC the
one that exhibited higher losses. Ultrasound applied during drying at 5 and 10 C promoted higher losses of both bioactive compounds contents (vitamin E and total polyphenol content) and antioxidant activity (35-65% and 43-62%, respectively) in comparison with samples dried without ultrasound application (14-43% and 23-50%, respectively). However, when drying was carried out at 15 °C, ultrasound contributed to the preservation of these bioactive compounds contents and antioxidant activity (30-47% and 47-58%, respectively) better than in samples obtained without using ultrasound (39-54% and 57-69%, respectively).
Mushroom microstructure presented tissue shrinkage and the formation of hollows after drying at 5, 10 and 15 °C being more pronounced as the temperature rose. Ultrasound application during drying promoted micro-channels formation due to sponge effect, which were wider when increasing the temperature.
When drying temperature increased up to 15 C, significantly higher losses of ergosterol content and antioxidant activity (according to FRAP and CUPRAC methods), browning index and water retention capacity were observed. However, when ultrasound was applied, compared with experiments without ultrasound application, significantly higher bioactive compounds contents and antioxidant
activity figures were observed although antioxidant activity at 5 C was not significantly different. Moreover, when ultrasound was applied, significantly lower losses of browning index (at 10 and 15 °C) and hydration properties and fat adsorption capacity values (at 15 °C) were obtained, compared with experiments without ultrasound application.
22

Doctoral thesis Francisca Vallespir Torrens ABSTRACT
Therefore, although the rise of the drying temperature from 5 to 15 ºC promoted higher kiwifruit and mushroom quality parameters losses, the use of ultrasound at 15 ºC allowed to obtain a shorter drying kinetic and better maintained the final bioactive compounds contents and antioxidant activity.
In overall, freezing pre-treatments enhanced hot-air drying of beetroot, apple and eggplant and freezing pre-treatment and ultrasound application enhanced also beetroot hot-air drying, but significant quality parameters losses were observed in both cases. Moreover, ultrasound application intensified the low-temperature drying of kiwifruit and mushroom promoting significant drying time reductions
together with quality parameters retention, especially at 15 C.
23

Doctoral thesis Francisca Vallespir Torrens ABSTRACT
24
Doctoral thesis Francisca Vallespir Torrens RESUMEN
RESUMEN
El proceso de secado se aplica en frutas y verduras para reducir el contenido en humedad, fundamentalmente con el objetivo de alargar su vida útil. Sin embargo, el secado convectivo provoca pérdidas en la calidad del producto debido a la degradación térmica y la exposición al aire. El secado a baja temperatura, por
debajo de 20 C pero por encima de 0 C, permite la obtención de productos deshidratados de alta calidad, aunque velocidad de transferencia de materia suele ser baja. Para intensificar el proceso de secado convectivo, es este trabajo se han utilizado el pretratamiento por congelación y los ultrasonidos de potencia durante el secado, con el objetivo de reducir el tiempo de secado, y preservar la calidad del producto. La congelación previa al secado a diferentes velocidades, así como la aplicación de ultrasonidos a diferentes densidades de potencia acústica durante el secado a alta o baja temperatura (secado con aire caliente o frío) pueden tener efectos diferentes sobre las distintas matrices alimentarias, habiendo sido dichos efectos, poco estudiados en la bibliografía.
Por tanto, los dos objetivos generales de este trabajo fueron, por una parte, el estudio de la intensificación del proceso de secado a temperaturas superiores a
20 C mediante pretratamientos de congelación y aplicación de ultrasonidos durante el secado y, por otra parte, el estudio también de la intensificación del
secado a baja temperatura (a temperaturas entre 0 y 20 C) mediante la aplicación de ultrasonidos durante el secado. Para alcanzar dichos objetivos, se evaluaron los efectos sobre las cinéticas de secado y sobre los parámetros de calidad de los productos.
En el Capítulo 1, se presenta el efecto de diferentes pretratamientos de
congelación (a −20 C, a −80 C y por inmersión en nitrógeno líquido) sobre las
cinéticas de secado convectivo a 50 C, la microestructura y los parámetros de calidad de tres matrices vegetales con diferente microestructura inicial (remolacha, manzana y berenjena).
Los resultados presentados en este capítulo indicaron que los pretratamientos de congelación redujeron significativamente el tiempo de secado (12-34%). Además, el pretratamiento de congelación afectó de forma diferente según la microestructura de la matriz vegetal y la velocidad de congelación. La microestructura original de la remolacha es compacta y presenta una baja porosidad. En cambio, la manzana y la berenjena presentan valores de porosidad medios-altos y tienen una microestructura original más frágil. Así, la mayor o menor reducción del tiempo de secado observada fue en función de su porosidad, superior en el producto más poroso (berenjena) e inferior en el producto menos poroso (remolacha). En cuanto a la velocidad de congelación, la congelación por inmersión en nitrógeno líquido (velocidad de congelación de
−144±20 C/min) tuvo menor impacto en el tiempo de secado de la remolacha y
la berenjena que la congelación a −20 C o a −80 C, probablemente debido a que en estas últimas condiciones la velocidad de congelación fue menor
(−0.8±0.2 ºC y −1.9±0.4 C/min, respectivamente). Los diferentes
25

Doctoral thesis Francisca Vallespir Torrens RESUMEN
pretratamientos de congelación afectaron de forma similar al tiempo de secado de la manzana.
Analizando las cinéticas de secado mediante el modelo difusivo propuesto, el coeficiente de difusión efectiva identificado aumentó significativamente al aplicar los diferentes pretratamientos, entre un 18 y un 31% (remolacha), un 42 y un 64% (manzana), y un 18 y un 72% (berenjena), y en todos los casos el valor más
elevado se observó cuando las muestras se congelaron antes del secado a −20 °C.
La microestructura de las muestras congeladas de remolacha, manzana y berenjena se analizó mediante microscopía electrónica de barrido (SEM) y microscopia óptica. Cada materia prima se vio afectada de forma diferente por los pretratamientos de congelación en función de su microestructura original. Además, comparando entre los diferentes métodos de congelación utilizados, cuanto más baja fue la velocidad de congelación más importante fue el daño observado en la microestructura, probablemente a causa del crecimiento de cristales de mayor tamaño. Después del secado, se observó contracción y colapso en la microestructura de todas las muestras; y todas las muestras congeladas previamente presentaron la suma de los efectos de la congelación y del secado, observándose una estructura más dañada que en las muestras sin congelar.
En relación a las propiedades físicas, se evaluaron el cambio total de color y de textura después de la congelación y también después del secado. Antes de secar, el cambio total de color de las muestras congeladas, respecto a la correspondiente muestra sin tratar, fue superior a 2.3 unidades, lo que supone un cambio de color perceptible. Después del secado, el cambio total de color de las muestras congeladas previamente fue significativamente mayor que en la correspondiente muestra sin tratar; las diferencias observadas fueron menores en remolacha (2-4 unidades) que en manzana y berenjena (15-22 unidades). Los perfiles de textura, obtenidos por compresión de las muestras congeladas antes del secado, fueron significativamente inferiores que los correspondientes a las muestras sin tratar. Sin embargo, no se observaron diferencias significativas en la textura de las muestras sometidas a los diferentes pretratamientos de congelación tanto de manzana como de berenjena, aunque se observaron pequeñas diferencias entre las muestras de remolacha congeladas por
inmersión en nitrógeno líquido y a −20 C o a −80 C.
El contenido total en polifenoles y la actividad antioxidante de las muestras sometidas a los diferentes pretratamientos de congelación fueron, en general, significativamente menores que las correspondientes muestras sin tratar, antes y después del secado. Las menores pérdidas en estos parámetros se observaron en las muestras sometidas al pretratamiento de congelación por inmersión en nitrógeno líquido, probablemente debido a la menor degradación y oxidación de los compuestos bioactivos a consecuencia de una velocidad de congelación rápida y el crecimiento de cristales de pequeño tamaño. De hecho, el contenido total en polifenoles y la actividad antioxidante de la muestra de remolacha congelada por inmersión en nitrógeno líquido no fueron significativamente diferentes a los correspondientes de la muestra sin tratar, antes (contenido total
26

Doctoral thesis Francisca Vallespir Torrens RESUMEN
en polifenoles y actividad antioxidante) y después (actividad antioxidante) del secado.
En resumen, el pretratamiento de congelación provocó mayores cambios en productos de alta porosidad (berenjena y manzana) que en productos de baja porosidad (remolacha). Por tanto, se observó un mayor incremento en la velocidad de secado y mayores pérdidas en los parámetros de calidad en berenjena y manzana que en remolacha. En cuanto a los diferentes pretratamientos de congelación estudiados, la congelación por inmersión en nitrógeno líquido provocó menor daño en la estructura, menor incremento de la velocidad de secado y menores pérdidas en los parámetros de calidad probablemente debido a su rápida velocidad de congelación y a la formación de
cristales de pequeño tamaño. Asimismo, los pretratamientos a −20 C y a −80 C no pudieron ser diferenciados entre sí en los parámetros analizados debido a sus lentas y similares velocidades de congelación.
En el Capítulo 2, se evaluaron los efectos de la congelación (a −20 C) previa al secado y de la asistencia acústica durante el secado (a densidades de potencia
acústica de 16.4 y 26.7 kW/m3) sobre las cinéticas de secado (a 40 C), la microestructura y los parámetros de calidad de la remolacha.
En los resultados obtenidos se observó que el tiempo de secado disminuyó significativamente cuando se aplicaron ultrasonidos durante el secado siendo mayor la reducción cuando se aplicó la mayor densidad acústica (36 y 43% a 16.4 y 26.7 kW/m3, respectivamente). Además, se observaron mayores reducciones del tiempo de secado cuando las muestras fueron congeladas previamente al secado sin (46%) o con la aplicación de ultrasonidos, siendo también la reducción ligeramente superior cuando se aplicó la mayor densidad acústica (55 y 58% a 16.4 y 26.7 kW/m3, respectivamente).
Analizando las curvas de secado mediante un modelo difusivo, se observó que el pretratamiento de congelación indujo un incremento en el coeficiente de difusión efectiva del 158%. Así mismo, la aplicación de ultrasonidos durante el secado indujo incrementos considerables en el coeficiente de transferencia externa de materia (28 y 49% a 16.4 y 26.7 kW/m3, respectivamente) y en el coeficiente de difusión efectiva (60 y 73% a 16.4 y 26.7 kW/m3, respectivamente). En los experimentos en que se aplicó el pretratamiento de congelación y ultrasonidos durante el secado, se observaron incrementos mayores del coeficiente de difusión efectiva (204 y 211% a 16.4 y 26.7 kW/m3, respectivamente), no viéndose afectado por la congelación, como era de esperar, el coeficiente de transferencia externa de materia. Es decir, tanto el pretratamiento de congelación como la aplicación de ultrasonidos durante el secado de remolacha permitieron reducir considerablemente el tiempo de secado y mejorar la transferencia de materia.
De acuerdo con las observaciones de la microestructura, se produjeron disrupciones y fisuras en la estructura celular de la remolacha después del pretratamiento de congelación y contracción de la misma durante del secado. Además, cuando el secado se llevó a cabo con la aplicación de ultrasonidos, se observó la aparición de poros y micro-canales de mayor tamaño.
27
Doctoral thesis Francisca Vallespir Torrens RESUMEN
La congelación causó un aumento significativo de los contenidos de compuestos bioactivos y de la actividad antioxidante (entre 16 y 57%), probablemente debido a la liberación de compuestos activos desde la matriz del alimento, a partir de moléculas más complejas sin actividad. El secado, en cambio, tuvo el efecto contrario, provocando reducciones de dichos parámetros (entre 10 y 54%). Además, al aplicar la congelación previa al secado o los ultrasonidos durante el secado, se observaron, en general, mayores pérdidas (28-58% y 39-81%, respectivamente), especialmente cuando se aplicaron ambos (reducciones entre 50 y 79%). Sin embargo, en el caso de los contenidos en betalainas, no se observaron diferencias significativas entre la muestra fresca y la congelada después de secar ni entre las muestras congeladas después de secar con asistencia acústica a diferentes densidades acústicas, probablemente debido a la reducción del tiempo de exposición térmica.
En conclusión, el pretratamiento de congelación y la aplicación de ultrasonidos aceleraron el secado de remolacha, pero se produjeron importantes cambios en la microestructura, los contenidos en compuestos bioactivos y la actividad antioxidante, si bien la reducción del tiempo de secado preservó los contenidos en betalainas en algunos casos.
Finalmente, en el Capítulo 3, se evaluaron los efectos de la aplicación de ultrasonidos (a una densidad de potencia acústica de 20.5 kW/m3) sobre el
secado a baja temperatura (a 5, 10 y 15 C), la microestructura y los parámetros de calidad de kiwi y champiñón.
En el secado acústico de kiwi, se observó una reducción del tiempo de secado de 55-65%. Tras el análisis de las cinéticas de secado mediante el modelo difusivo se concluyó que la energía acústica causó un incremento en el coeficiente de difusión efectiva de 120-175% y en el coeficiente de transferencia externa de materia de 103-231%, lo que indica importantes aumentos de la velocidad de secado. El efecto de los ultrasonidos sobre la velocidad de secado de kiwi fue menor al aumentar la temperatura de secado, dentro del rango de temperaturas estudiado.
En relación al secado de champiñón, cuando se aplicaron ultrasonidos, también se observaron reducciones significativas del tiempo de secado (41-66% de reducción) y se identificaron, mediante un modelo difusivo, valores significativamente superiores del coeficiente de difusión efectiva (76-184% de incremento) y del coeficiente de transferencia externa de materia (61-157% de incremento), comparado con el secado sin aplicación de ultrasonidos, en el rango
de temperaturas estudiado (5-15 C). Por tanto, la aplicación de ultrasonidos aceleró la eliminación del contenido en humedad del champiñón durante el secado. Además, en este caso, los efectos de los ultrasonidos en la velocidad de secado de champiñón fueron mayores a temperaturas de secado superiores.
Comparando el secado acústico a baja temperatura de kiwi y de champiñón, se observaron comportamientos similares en cuanto a la reducción del tiempo de secado y el incremento de los coeficientes de transferencia de materia. Sin embargo, la influencia de la temperatura de secado fue mayor en el secado de kiwi que en el de champiñón. Además, con el aumento de temperatura, se observaron mayores efectos de la aplicación de ultrasonidos en el secado de
28
Doctoral thesis Francisca Vallespir Torrens RESUMEN
champiñón que en el de kiwi. Por consiguiente, matrices vegetales diferentes mostraron de nuevo diferentes comportamientos durante la aplicación de ultrasonidos en el secado, dentro del rango de condiciones considerado.
Después del secado, se observaron valores significativamente inferiores de contenidos en compuestos bioactivos (14-54% de pérdida) y de actividad antioxidante (23-69% de pérdida) en todas las muestras de kiwi secas,
comparadas con la muestra fresca, siendo la muestra deshidratada a 15 C la que presentó mayores pérdidas. Cuando se aplicaron ultrasonidos en el secado
a 5 y 10 C se provocaron mayores pérdidas en los contenidos en compuestos bioactivos (vitamina E y contenido total en polifenoles) y de actividad antioxidante (35-65% y 43-62%, respectivamente) en comparación con las muestras secas sin aplicación de ultrasonidos (14-43% y 23-50%, respectivamente). Sin
embargo, cuando el secado se llevó a cabo a 15 C, los ultrasonidos contribuyeron preservar dichos contenidos en compuestos bioactivos y actividad antioxidante (30-47% y 47-58%, respectivamente) mejor que en el secado sin aplicación de ultrasonidos (39-54% y 57-69%, respectivamente).
La microestructura de champiñón presentó contracción del tejido y aparición de
oquedades después del secado a 5, 10 y 15 C siendo éstas de mayor tamaño en las muestras deshidratadas a temperaturas superiores. La aplicación de ultrasonidos durante el secado provocó la formación de micro-canales en el tejido de champiñón, los cuales fueron más profundos con el aumento de la temperatura.
Cuando se incrementó la temperatura de 5 a 15 C en el secado de champiñón, se observaron pérdidas significativas en el contenido en ergosterol y la actividad antioxidante (métodos FRAP y CUPRAC), en el índice de pardeamiento y en la capacidad de retención de agua. Sin embargo, cuando se aplicaron los ultrasonidos en el secado de champiñón, en comparación con los experimentos sin aplicación de ultrasonidos, se obtuvieron valores significativamente mayores de contenidos en compuestos bioactivos y de actividad antioxidante, aunque a 5
C la actividad antioxidante no fue significativamente diferente entre los experimentos con y sin aplicación de ultrasonidos. Además, cuando se aplicaron ultrasonidos, se observaron pérdidas significativamente menores en el índice de
pardeamiento (a 10 y 15 C) y en las propiedades de hidratación y en la
capacidad de adsorción de grasa (a 15 C), en comparación con los experimentos sin aplicación de ultrasonidos.
Por consiguiente, aunque el aumento de la temperatura de secado de 5 a 15 C provocó mayores pérdidas de los parámetros de calidad de kiwi y champiñón, la
aplicación de ultrasonidos a 15 C permitió obtener una cinética de secado más corta, y se conservaron mejor los contenidos en compuestos bioactivos y la actividad antioxidante.
En conclusión, los pretratamientos de congelación aceleraron el secado con aire caliente de remolacha, manzana y berenjena; el pretratamiento de congelación y la aplicación de ultrasonidos aceleraron también el secado con aire caliente de remolacha; se observaron pérdidas significativas de parámetros de calidad en ambos casos. Además, la aplicación de ultrasonidos intensificó el secado a baja temperatura de kiwi y champiñón provocando reducciones significativas del
29

Doctoral thesis Francisca Vallespir Torrens RESUMEN
tiempo de secado junto con la retención de los parámetros de calidad,
especialmente cuando el secado se llevó a cabo a 15 C.
30
Doctoral thesis Francisca Vallespir Torrens RESUM
RESUM
El procés d’assecat s’utilitza en fruites i verdures per a reduir el contingut en humitat, fonamentalment per allargar d’aquesta manera la seva vida útil. Però l’assecat convectiu provoca pèrdues en la qualitat del producte a causa de la degradació tèrmica i de l’exposició a l’aire. L’assecat a baixa temperatura, per
sota de 20 C però per sobre de 0 C, permet l’obtenció de productes deshidratats d’alta qualitat tot i que presenta la velocitat de transferència de matèria sol ésser baixa. Per a intensificar el procés d’assecat convectiu, en aquest treball, s’han utilitzat el pretractament de congelació i l’aplicació d’ultrasons de potència durant l’assecat amb l’objectiu de reduir el temps d’assecat i preservar la qualitat del producte. La congelació prèvia a l’assecat a diferents velocitats, així com l’aplicació d’ultrasons a diferents densitats de potència acústica durant l’assecat a alta i baixa temperatura (assecat amb aire calent i fred) poden tenir efectes diferents en les diverses matrius alimentàries, havent estat aquests efectes, poc estudiats en la bibliografia.
Conseqüentment, els dos objectius generals d’aquest treball foren, d’una banda,
l’estudi de la intensificació del procés d’assecat a temperatures superiors a 20 mitjançant pretractaments de congelació i aplicació d’ultrasons durant l’assecat i, per l’altra, l’estudi també de la intensificació de l’assecat a baixa temperatura
(a temperatures entre 0 i 20 ) mitjançant l’aplicació d’ultrasons durant l’assecat. Per a assolir aquests objectius, s’avaluaren els efectes en les cinètiques d’assecat i en el paràmetres de qualitat dels productes.
En el Capítol 1, es presenten els efectes de diferents pretractaments de
congelació (a −20 C, a −80 C i per immersió en nitrogen líquid) en les cinètiques
d’assecat convectiu a 50 C, la microestructura i els paràmetres de qualitat de tres matrius vegetals amb diferent microestructura inicial (remolatxa, poma i albergínia).
Els resultats presentats en aquest capítol indiquen que els pretractaments de congelació reduïren significativament el temps d’assecat (12-34%). A més, el pretractament de congelació va afectar de forma diferent segons la microestructura de la matriu vegetal i la velocitat de congelació. La microestructura original de la remolatxa és compacta ja que té una porositat baixa. En canvi, la poma i l’albergínia presenten valors de porositat mitjans-alts i una microestructura original més fràgil. Així, la major o menor reducció del temps d’assecat observada fou en funció de la porositat, superior en el producte més porós (albergínia) i menor en el producte menys porós (remolatxa). Quant a la velocitat de congelació, la congelació per immersió en nitrogen líquid (velocitat
de congelació de −144±20 C/min) va tenir menor impacte en el temps d’assecat
de la remolatxa i l’albergínia que la congelació a −20 C o a −80 C, probablement a causa de que en aquests últims casos la velocitat de congelació fou menor
(−0.8±0.2 ºC i −1.9±0.4 C/min, respectivament). Els diferents pretractaments de congelació afectaren de forma similar el temps d’assecat de la poma.
31
Doctoral thesis Francisca Vallespir Torrens RESUM
Analitzant les cinètiques d’assecat mitjançant el model difusiu proposat, el coeficient de difusió efectiva identificat augmentà significativament en aplicar els pretractaments de congelació entre un 18 i un 31% (remolatxa), un 42 i un 64% (poma), i un 18 i un 72% (albergínia), i en tots els casos el valor més elevat es
va obtenir quan les mostres es congelaren abans de l’assecat a −20 °C.
La microestructura de les mostres congelades de remolatxa, poma i albergínia, fou estudiada mitjançant microscòpia electrònica de escombrat (SEM) i microscòpia òptica. Cada matèria prima fou afectada de forma diferent per els pretractaments de congelació en funció de la seva microestructura. A més, comparant entre els diferents mètodes de congelació utilitzats, quan més baixa fou la velocitat de congelació més important fou el dany observat en la microestructura, probablement a causa del creixement de cristalls de major mida. Després de l’assecat, es va observar contracció i col·lapse en la microestructura de totes les mostres i totes les mostres congelades prèviament presentaren la suma del efectes de la congelació i de l’assecat, observant-se una estructura més danyada que en les mostres sense congelar.
En relació a les propietats físiques, s’avaluaren el canvi total de color i de textura després de la congelació i també després de l’assecat. Abans d’assecar, el canvi total de color de les mostres congelades, respecte a la corresponent mostra sense tractar, fou major a 2.3 unitats, la qual cosa suposa un canvi de color perceptible. Després de l’assecat, el canvi total de color de les mostres prèviament congelades fou significativament major que en la corresponent mostra sense tractar; les diferències observades foren menors en remolatxa (2-4 unitats) que en poma i albergínia (15-22 unitats). Els perfils de textura, obtinguts per la compressió de les mostres congelades (prèvia descongelació) abans de l’assecat, foren significativament inferiors que els corresponents a les mostres sense tractar. Tot i així, no s’observaren diferències significatives en la textura de les mostres sotmeses als diferents pretractaments de congelació de poma i albergínia, respectivament, però si s’observaren petites diferències entre
les mostres de remolatxa congelades per immersió en nitrogen líquid i a −20 C
o a −80 C.
El contingut total en polifenols i l’activitat antioxidant de les mostres sotmeses als pretractaments de congelació foren, en general, significativament menors que les corresponents mostres sense tractar, abans i després de l’assecat. Les menors pèrdues s’observaren en les mostres sotmeses al pretractament de congelació per immersió en nitrogen líquid, probablement a causa de la menor degradació i oxidació dels composts bioactius conseqüència d’una velocitat de congelació molt ràpida i el creixement de cristalls petits. De fet, el contingut total en polifenols i l’activitat antioxidant de la mostra de remolatxa congelada per immersió en nitrogen líquid no foren significativament diferents als de la corresponent de mostra sense tractar abans (contingut total en polifenols i activitat antioxidant) i després (activitat antioxidant) de l’assecat.
En resum, el pretractament de congelació va provocar majors canvis en productes d’alta porositat (albergínia i poma) que en productes de baixa porositat (remolatxa). Per tant, es va observar un major increment en la velocitat d’assecat i majors pèrdues en el paràmetres de qualitat en albergínia i poma que en remolatxa. Quant als diferents pretractaments de congelació estudiats, la
32
Doctoral thesis Francisca Vallespir Torrens RESUM
congelació per immersió en nitrogen líquid va provocar menor dany en l’estructura, menor increment de la velocitat d’assecat i menors pèrdues en el paràmetres de qualitat probablement degut a la seva ràpida velocitat de congelació i a la formació de cristalls de mida petita. Així mateix, els
pretractaments a −20 C i a −80 C no es pogueren distingir entre sí en els paràmetres analitzats a causa de les seves lentes i similars velocitats de congelació.
En el Capítol 2, s’avaluaren els efectes de la congelació (a −20 ºC) prèvia a l’assecat i l’assistència per ultrasons durant l’assecat (a densitats de potència
acústica de 16.4 i 26.7 kW/m3) en les cinètiques d’assecat (a 40 C), la microestructura i els paràmetres de qualitat de la remolatxa.
En els resultats obtinguts s’observa que el temps d’assecat va disminuir significativament quan s’aplicaren ultrasons durant l’assecat essent major la reducció quan es va aplicar la major densitat acústica (36 i 43% a 16.4 i 26.7 kW/m3, respectivament). S’observaren majors reduccions del temps d’assecat quan les mostres foren congelades abans de l’assecat sense (46%) o amb l’aplicació d’ultrasons essent també la reducció lleugerament superior quan es va aplicar la major densitat acústica (55 i 58% a 16.4 i 26.7 kW/m3, respectivament).
Analitzant les corbes d’assecat mitjançant un model difusiu, es va observar que el pretractament de congelació va induir un increment en el coeficient de difusió efectiva del 158%. Així mateix, l’aplicació d’ultrasons durant l’assecat va induir increments considerables en el coeficient de transferència externa de matèria (28 i 49% a 16.4 i 26.7 kW/m3, respectivament) i en el coeficient de difusió efectiva (60 i 73% a 16.4 i 26.7 kW/m3, respectivament). En els experiments en què es va aplicar el pretractament de congelació i els ultrasons, es varen observar increments majors del coeficient de difusió efectiva (204 i 211% a 16.4 i 26.7 kW/m3, respectivament), sense veure’s afectat per la congelació, com era d’esperar, el coeficient de transferència externa de matèria. És a dir, tant el pretractament de congelació com l’aplicació d’ultrasons durant l’assecat de remolatxa permeteren reduir el temps d’assecat considerablement i millorar la transferència de matèria.
D’acord amb les observacions de la microestructura indiquen, es produïren disrupcions i fissures en l’estructura cel·lular de la remolatxa després del pretractament de congelació i contracció de la mateixa durant l’assecat. A més, quan l’assecat es va dur a terme amb l’aplicació d’ultrasons, es va observar l’aparició de porus i micro-canals de major mida.
La congelació va causar un augment significatiu dels continguts de composts bioactius i de l’activitat antioxidant (entre 16 i 57%), probablement a causa de l’alliberació de composts actius de la matriu de l’aliment, a partir de molècules més complexes sense activitat. L’assecat, en canvi, va tenir l’efecte contrari, provocant reduccions d’aquests paràmetres (entre 10 i 54%). A més, en aplicar la congelació prèvia a l’assecat o els ultrasons durant l’assecat s’observaren, en general, majors pèrdues (28-58% i 39-81%, respectivament), especialment quan s’aplicaren ambdós (reduccions entre 50 i 79%). Tot i així, en el cas dels continguts en batalaines, no s’observaren diferències significatives entre la
33
Doctoral thesis Francisca Vallespir Torrens RESUM
mostra fresca i la congelada després d’assecar ni entre les mostres congelades després d’assecar amb assistència acústica a diferents densitats acústiques, probablement a causa de la reducció del temps d’exposició tèrmica.
En conclusió, el pretractament de congelació i l’aplicació d’ultrasons acceleraren l’assecat de remolatxa, però es produïren importants canvis en la microestructura, els continguts en composts bioactius i l’activitat antioxidant, tot i que la reducció del temps d’assecat va preservar els continguts en betalaines en alguns casos.
Finalment, en el Capítol 3, s’avaluaren els efectes de l’aplicació d’ultrasons (a una densitat de potència acústica de 20.5 kW/m3) en l’assecat a baixa
temperatura (a 5, 10 i 15 C), la microestructura i els paràmetres de qualitat de kiwi i xampinyó.
En l’assecat acústic de kiwi, es va observar un reducció del temps d’assecat de 55-65%. Després de l’anàlisi de les cinètiques d’assecat mitjançant el model difusiu es va concloure que l’energia acústica va causar un increment en el coeficient de difusió efectiva de 120-175% i en el coeficient de transferència externa de matèria de 103-231%, la qual cosa indica importants augments de la velocitat d’assecat. L’efecte dels ultrasons sobre la velocitat d’assecat de kiwi fou menor en augmentar la temperatura d’assecat, en el rang de temperatures estudiat.
En relació a l’assecat de xampinyó, quan s’aplicaren ultrasons, també s’observaren reduccions significatives del temps d’assecat (41-66% de reducció) i s’identificaren, mitjançant un model difusiu, valors significativament superiors del coeficient de difusió efectiva (76-184% d’increment) i del coeficient de transferència externa de matèria (61-157% d’increment), comparat amb l’assecat
sense aplicació d’ultrasons, en el rang de temperatures estudiat (5-15 C). Per tant, l’aplicació d’ultrasons va accelerar l’eliminació del contingut en humitat del xampinyó durant l’assecat. A més, en aquest cas, els efectes dels ultrasons en la velocitat d’assecat de xampinyó foren majors a temperatures d’assecat superiors.
Comparant l’assecat acústic a baixa temperatura de kiwi i xampinyó, s’observaren comportaments similars quant a la reduccion del temps d’assecat i l’increment dels coeficients de transferència de matèria. Tot i així, la influència de la temperatura d’assecat fou major en l’assecat de kiwi que en el de xampinyó. És més, amb l’augment de temperatura, s’observaren majors efectes de l’aplicació d’ultrasons en l’assecat de xampinyó que en el de kiwi. Per tant, diferents productes mostraren de nou diferents comportaments durant l’aplicació d’ultrasons durant l’assecat en el rang de condicions considerat.
Després de l’assecat, s’observaren valors significativament inferiors de continguts en composts bioactius (14-54% de pèrdua) i d’activitat antioxidant (23-69% de pèrdua) en totes les mostres de kiwi assecades, comparades amb la
mostra fresca, essent la mostra assecada a 15 C la que va presentar majors
pèrdues. Quan s’aplicaren ultrasons en l’assecat a 5 i 10 C es provocaren majors pèrdues de continguts en composts bioactius (vitamina E i contingut total en polifenols) i d’activitat antioxidant (35-65% i 43-62%, respectivament) en comparació a les mostres assecades sense aplicació d’ultrasons (14-43% i 23-
34

Doctoral thesis Francisca Vallespir Torrens RESUM
50%, respectivament). Tot i així, quan l’assecat es va dur a terme a 15 C, els ultrasons contribuïren a la preservació d’aquests continguts en composts bioactius i activitat antioxidant (30-47% i 47-58%, respectivament) millor que en l’assecat sense aplicació d’ultrasons (39-54% i 57-69%, respectivament).
La microestructura del xampinyó va presentar contracció del teixit i l’aparició de
buits després de l’assecat a 5, 10 i 15 C essent d’una major mida en les mostres assecades a temperatures superiors, mentrestant. L’aplicació d’ultrasons durant l’assecat va provocar la formació de micro-canals en el teixit de xampinyó, els quals foren més profunds amb l’augment de temperatura.
Quan es va incrementar la temperatura a 15 C en l’assecat de xampinyó, s’observaren pèrdues significatives en el contingut en ergosterol i en l’activitat antioxidant (mètodes FRAP i CUPRAC), en l’índex de pardejament i en la capacitat de retenció d’aigua. Tot i així, quan s’aplicaren els ultrasons en l’assecat del xampinyó, en comparació amb els experiments sense aplicació d’ultrasons, s’obtingueren valors significativament majors de continguts en
composts bioactius i d’activitat antioxidant , tot i que a 5 C l’activitat antioxidant no fou significativament diferent. A més, quan s’aplicaren ultrasons, s’observaren
pèrdues significativament menors en l’índex de pardejament (a 10 i 15 C) i en
les propietats d’hidratació i en la capacitat d’adsorció de grassa (a 15 C), en comparació amb els experiments sense aplicació d’ultrasons.
Per tant, tot i que l’augment de la temperatura d’assecat de 5 a 15 C va provocar majors pèrdues en els paràmetres de qualitat de kiwi i xampinyó, l’aplicació
d’ultrasons a 15 C va permetre obtenir una cinètica d’assecat més curta i es mantingueren millor els continguts en composts bioactius i l’activitat antioxidant.
En conclusió, els pretractaments de congelació acceleraren l’assecat amb aire calent de remolatxa, poma i albergínia; el pretractament de congelació i l’aplicació d’ultrasons acceleraren també l’assecat amb aire calent de remolatxa; s’observaren pèrdues significatives dels paràmetres de qualitat en ambdós casos. A més, l’aplicació d’ultrasons va intensificar l’assecat a baixa temperatura de kiwi i xampinyó provocant reduccions significatives del temps d’assecat juntament amb la retenció dels paràmetres de qualitat, especialment quan aquest
es va dur a terme a 15 C.
35

Doctoral thesis Francisca Vallespir Torrens RESUM
36
Doctoral thesis Francisca Vallespir Torrens NOMENCLATURE
NOMENCLATURE
Parameters
a* redness/greenness CIElab colour coordinate
A face area (m2)
AD acoustic density (kW/m3)
b* yellowness/blueness CIElab colour coordinate
BI browning index
𝐷𝑒 effective water diffusion coefficient (m2/s)
𝐷𝑜 parameter in the diffusion model (m2/s)
Def(t) deformation along the time (m)
dm dry matter (g or kg)
E elastic modulus (kPa)
𝐸𝑎 activation energy (kJ/mol)
F(t) force along the time (N)
H0 initial height of the sample (m)
ℎ𝑚 external mass transfer coefficient (kg/m2 s)
L length (m)
L* whiteness or brightness/darkness CIElab colour coordinate
n number of experimental data
MRE mean relative error (%)
p probability value
R universal gas constant (J/mol·K)
R2 correlation coefficient of a linear regression
𝑆𝑥 moisture content standard deviation (sample) (kg water/kg dm)
𝑆𝑦𝑥 moisture content standard deviation (calculated) (kg water/kg dm)
T temperature (C)
Th thickness (m)
t time (s or h)
37
Doctoral thesis Francisca Vallespir Torrens NOMENCLATURE
V sample volume (m3)
var percentage of explained variance (%)
W moisture content (kg water/kg dm)
𝑊 Toughness (mJ/m3)
x,y,z spatial coordinates (m)
Greek letters
α significance level
ΔE total colour change
𝜀 Henky strain
𝜌𝑑𝑚 dry matter density (kg dm/m3)
𝜎 true stress (kPa)
𝜑 relative humidity
Subscripts
0 initial
∞ drying air
cal calculated
e equilibrium
exp experimental
l local
R rupture point
Analyses abbreviations
AA antioxidant activity (mg TE/g dm)
AAC ascorbic acid content (mg L-ascorbic acid equivalent /g dm)
BCC betacyanin content (mg BE/g dm)
BXC betaxanthin content (mg IE/g dm)
EC ergosterol content (mg ergosterol/g dm)
FAC fat adsorption capacity (g/g dm)
SW swelling (mL/g dm)
TPC total polyphenol content (mg GAE/g dm)
38
Doctoral thesis Francisca Vallespir Torrens NOMENCLATURE
VEC vitamin E content (mg α-tocopherol equivalent/g dm)
WRC water retention capacity (g/g dm)
Samples
Chapter 1:
U untreated sample
F20 sample frozen at −20 °C
F80 sample frozen at −80 °C
FLN sample frozen by liquid nitrogen immersion
UD untreated sample dried at 50 C and 1 m/s
F20D sample frozen at −20 °C and dried at 50 C and 1 m/s
F80D sample frozen at −80 °C and dried at 50 C and 1 m/s
FLND sample frozen by liquid nitrogen immersion and dried at 50 C and 1 m/s
Chapter 2:
R raw sample
F sample frozen at −20 °C
R0 raw sample dried without ultrasound application
R1 raw sample dried with ultrasound application 1
R2 raw sample dried with ultrasound application 2
F0 sample frozen at −20 °C and dried without ultrasound application
F1 sample frozen at −20 °C and dried with ultrasound application 1
F2 sample frozen at −20 °C and dried with ultrasound application 2
Chapter 3:
5 C AIR sample dried at 5 C without ultrasound application
10 C AIR sample dried at 10 C without ultrasound application
15 C AIR sample dried at 15 C without ultrasound application
5 C AIR+US sample dried with ultrasound application
10 C AIR+US sample dried with ultrasound application
15 C AIR+US sample dried with ultrasound application
39

Doctoral thesis Francisca Vallespir Torrens NOMENCLATURE
40

INTRODUCTION
41

Doctoral thesis Francisca Vallespir Torrens INTRODUCTION
42

Doctoral thesis Francisca Vallespir Torrens INTRODUCTION
1. Intensification of the drying process
Fruits and vegetables are quickly perishable due to their high moisture, acidity and carbohydrate levels (Nanda, Reddy, Hunter, Dalai, and Kozinski, 2015). Drying is perhaps the oldest and widely used method of postharvest food preservation. It consists of the reduction, in the solid product, of the water activity, by removing the majority of its water content. Water activity is a measure of available water in a system to support biological and chemical reactions (Oliveira, Brandão, and Silva, 2016). Thus, after drying, the solid product obtained might have a low water activity in order to avoid microbial growth under room temperature (Oliveira et al., 2016). Moreover, drying improves postharvest handling and packaging, increases the ease of product transportation and improves other processing operations such as milling and mixing (Onwude et al., 2017). As an important unit in postharvest operation, especially for food and agricultural processing industries, it remains an area of incessant interest for food research.
Several drying methods have been proposed to preserve fruits and vegetables. The most antique and traditional drying method consists of placing the agricultural products on beaten earth, floor covering or floor exposed to sun. Although sun energy-based methods present economic advantages, being for this reason largely used in tropical countries, the product quality and food safety-related issues become often difficult to monitor and control. The products are vulnerable to contaminations by dirt and dust, insects infestation and loss by birds and animals (Janjai and Bala, 2012). Moreover, required drying time and the final moisture content of the product could not be estimated easily.
The foremost used drying techniques promote water vaporization from a food product by using heat through conduction, convection and radiation, being the formed vapour subsequently removed through forced air (Oliveira et al., 2016). Convective drying reduces drying time and provides homogeneous and better dried products when utilizing optimum conditions.
However, depending on the drying process conditions (temperature, air velocity, and relative humidity, among others), drying time and important product characteristics, such as texture, colour, antioxidant activity and the content of different bioactive compounds as carotenoids, phenolics, etc. could be affected (Onwude et al., 2017). Therefore, studies about the drying process are fundamental to provide increasingly a wider variety of fruits and vegetables with extended shelf life and with appreciable quality (Brasil and Siddiqui, 2018).
Chou and Chua (2001) reported that, nowadays, drying process research is mainly focused on its intensification. The drying process intensification should involve the mass transfer enhancement, which is related to energy consumption and cost reduction, together with the final quality of the product. In the literature, there have been significant developments in using novel techniques in the drying of agricultural crops in terms of pre-treatment or in combination with conventional techniques that will increase process efficiency and enhance the quality of the final dried products (Onwude, Hashim, and Chen, 2016).
43

Doctoral thesis Francisca Vallespir Torrens INTRODUCTION
1.1. Convective drying process
The convective drying process of food materials is based on the sample surface water evaporation due to a forced air flow with low relative humidity and its consequent water transport removal from the inside of the solid, which promotes the sample dehydration.
1.1.1. Transport phenomena
The process of food materials drying is complex, involving coupled transport phenomena of heat, mass and momentum transfer processes accompanied by physical, chemical and phase change transformation (Sabarez, 2012) as it is represented in Figure 1. Basically, the convective drying system consists of a gas phase (the air) and a solid phase (the sample being dried). Thus, the main different transport phenomena taking place simultaneously are:
▪ Heat transfer from the drying air to the solid promoting the solid heating and the surface water evaporation.
▪ Mass transfer of the water from the interior of the solid to its surface and then to the drying air in gas phase.
▪ Momentum transfer as a consequence of the air speed gradients created when the air goes around the solid.
Figure 1. Mass and heat transfer processes during food materials drying
Due to the high latent heat of vaporisation of water and the inherent inefficiency of using air as the drying medium, convective drying is a highly energy-consuming unit operation (Sabarez, 2015). Therefore, the three modes of energy transfer (convection, conduction and radiation) may be used alone or in combination to supply heat from the heat source to the solid.
The global rate of the process would be defined by the respective rates of those transfers. However, it is frequently considered that the mass transfer is the main transport phenomenon of the drying process because the heat and the momentum transfers are usually faster than the mass transfer.
44

Doctoral thesis Francisca Vallespir Torrens INTRODUCTION
On the one hand, the water movement through the solid depends on the characteristics of the solid and its moisture content and temperature. On the other hand, the surface water removal depends on the temperature, relative humidity and drying air flow together with the solid exposed surface and the pressure.
1.1.2. Transport resistances of the mass transfer
During a drying process, the mass transfer takes place until the equilibrium is reached when the chemical potentials differences are cancelled. When the concentration profile is represented along the distance, an interphase discontinuity between the solid and the gas phases is observed as it is presented in Figure 2. Thus, equilibrium does not mean that both phases have equal concentrations but it means that equal chemical potentials are reached. The interphase resistance to mass transfer is commonly neglected. Therefore, two resistances to water transport are observed, an internal resistance in the solid phase and an external resistance in the gas phase. The relative significance of both resistances would affect the global mass transfer process. In the case of higher significance of one of the resistances, the global process would be limited by this resistance. Thus, the process analysis may just consider this limiting resistance.
Figure 2. Mass transfer between two mediums. Double resistance concept
The internal resistance is related to the water transfer into the solid which is a complex process. It may be a combination of different mechanisms, such as capillary flow, surface diffusion or liquid diffusion, generating the total mass flow through the internal phase. In the literature, the internal mass transfer is frequently represented by the Fick’s law (Equation 1) which considers the diffusive mechanism as the main one (Crank, 1979). In Fick’s law, the mass flow (mx) is related to the water diffusion coefficient (De) and the moisture content gradient.
𝑚𝑥 = −𝐷𝑒𝜕𝑊
𝜕𝑥 Eq.1
In the literature, the diffusion coefficient (De) is usually considered as an effective parameter, representative of all the mechanisms involving the mass transfer through the solid (García-Pérez, Rosselló, Cárcel, De la Fuente, and Mulet, 2006). In general, the effective diffusion coefficient (De) varies with the
45
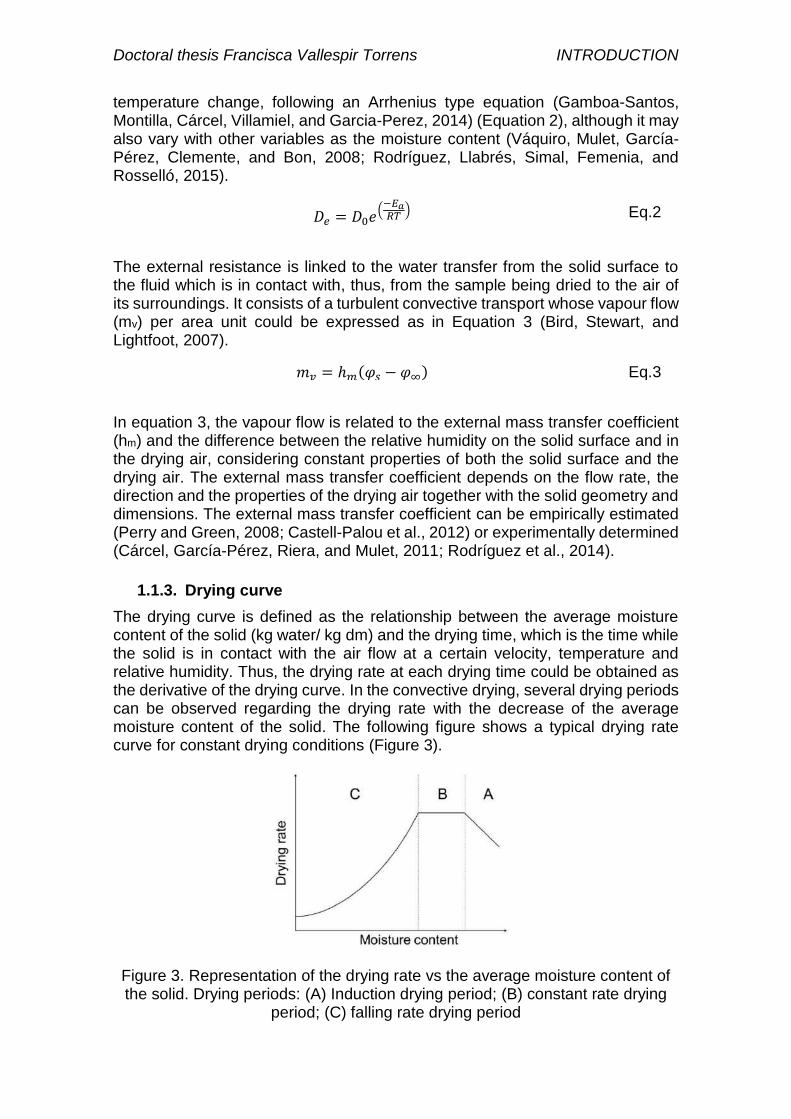
Doctoral thesis Francisca Vallespir Torrens INTRODUCTION
temperature change, following an Arrhenius type equation (Gamboa-Santos, Montilla, Cárcel, Villamiel, and Garcia-Perez, 2014) (Equation 2), although it may also vary with other variables as the moisture content (Váquiro, Mulet, García-Pérez, Clemente, and Bon, 2008; Rodríguez, Llabrés, Simal, Femenia, and Rosselló, 2015).
𝐷𝑒 = 𝐷0𝑒(−𝐸𝑎𝑅𝑇
) Eq.2
The external resistance is linked to the water transfer from the solid surface to the fluid which is in contact with, thus, from the sample being dried to the air of its surroundings. It consists of a turbulent convective transport whose vapour flow (mv) per area unit could be expressed as in Equation 3 (Bird, Stewart, and Lightfoot, 2007).
𝑚𝑣 = ℎ𝑚(𝜑𝑠 − 𝜑∞) Eq.3
In equation 3, the vapour flow is related to the external mass transfer coefficient (hm) and the difference between the relative humidity on the solid surface and in the drying air, considering constant properties of both the solid surface and the drying air. The external mass transfer coefficient depends on the flow rate, the direction and the properties of the drying air together with the solid geometry and dimensions. The external mass transfer coefficient can be empirically estimated (Perry and Green, 2008; Castell-Palou et al., 2012) or experimentally determined (Cárcel, García-Pérez, Riera, and Mulet, 2011; Rodríguez et al., 2014).
1.1.3. Drying curve
The drying curve is defined as the relationship between the average moisture content of the solid (kg water/ kg dm) and the drying time, which is the time while the solid is in contact with the air flow at a certain velocity, temperature and relative humidity. Thus, the drying rate at each drying time could be obtained as the derivative of the drying curve. In the convective drying, several drying periods can be observed regarding the drying rate with the decrease of the average moisture content of the solid. The following figure shows a typical drying rate curve for constant drying conditions (Figure 3).
Figure 3. Representation of the drying rate vs the average moisture content of the solid. Drying periods: (A) Induction drying period; (B) constant rate drying
period; (C) falling rate drying period
46
Doctoral thesis Francisca Vallespir Torrens INTRODUCTION
In the first drying moments, the solid sample is adapting to the drying conditions. Thus, during the induction period (A) the drying rate increases as the temperature of the solid rises and the water evaporation of the surface of the solid begins. Usually, this first period is undetectable in food materials drying.
Afterwards, the constant drying rate period starts (B). In this period, the drying rate is equal to the water evaporation rate and the energy is spent in the water phase change. Thus, the external mass transfer is the controlling resistance. This period continues until the moisture content of the solid decreases to the critical moisture content of the product. This critical moisture content is normally close to the initial moisture content of the product in food materials (Park et al., 2007). Consequently, this period is very short or non-existent.
When the moisture content is under the critical moisture content, the drying rate decreases until the equilibrium moisture content is reached in the falling rate period (C). During this period, the amount of water moved from inside of the solid to its surface can be smaller than the amount of water evaporated from the surface and transferred to the gas. Therefore, a moisture gradient is developed from the centre of the solid (with the maximum moisture content) to the solid surface (with the minimum moisture content which can reach the equilibrium moisture content).
1.1.4. Volume shrinkage
According to Mayor and Sereno (2004), one of the most important physical changes that food suffers during drying is the reduction of its external volume. The loss of water and the heating cause stresses in the cellular structure of the food leading to change in shape and decrease in dimension. These stresses in the cellular structure due to the loss of water and heating could be observed in the product microstructure as cell walls folding and tissue compression (Lewicki and Pawlak, 2003; Ramos, Silva, Sereno, and Aguilera, 2004; Mayor, Silva, and Sereno, 2005). Therefore, shrinkage of the dried products could be evaluated through sample microstructure observations by light microscopy (Bancroft, 2019) or by Scanning Electron Microscopy (SEM) (Reimer, 2013).
Moreover, the reduction of its external volume is related to the reduction of the transfer area of the solid which may affect the moisture removal from the solid surface. The moisture transport from the inside of the solid is also affected by the reduction of the solid dimensions. Therefore, both internal and external resistances are affected. Consequently, the study of the shrinkage is useful when modelling the drying transport phenomenon.
Volume shrinkage correlations could be theoretically or experimentally estimated. For instance, Rodríguez, Eim, Simal, Femenia, and Rosselló (2013) determined the area changes of the apple sample faces by using an image acquisition system and image analysis in order to measure the alterations of the sample dimensions during drying at different pre-set times. A linear correlation was obtained between the nominal dimension ratio and the average moisture content. Then, the shrinkage correlation could be considered as part of the mathematical model (De Lima, Queiroz, and Nebra, 2002; Ruiz-López and García-Alvarado, 2007; Eim et al., 2013; Rodríguez et al., 2013).
47
Doctoral thesis Francisca Vallespir Torrens INTRODUCTION
Among the factors affecting the volume shrinkage, according to Mayor and Sereno (2004), the main ones in convective drying are:
▪ The amount of water removed. As water is removed from the solid, the structural tensions increase. In some cases, the volume contraction is similar to the amount of water removed and an equilibrium is almost reached.
▪ The solid matrix mobility. The mobility of the solid structure is related to its physical properties under the drying conditions. A high mobility is presented when the solid has a viscoelastic behaviour and a low mobility is observed in a glassy performance. At the beginning of the drying process, the high moisture content is associated with a rubbery state and the moisture content decrease is balanced out by the volume contraction decreasing linearly. However, at low moisture content values, the material tends to present a rigid state and the contraction rate diminishes significantly.
▪ The drying rate. The drying rate is related to the solid properties and the drying conditions (temperature, air velocity and air relative humidity, among others) which may affect the moisture movement into the solid creating gradients. When significant moisture content gradients are promoted, the surface has a significantly lower moisture content than the interior of the solid. In this case, a quick transformation from a rubbery state to a rigid state of the exterior of the sample occurs, crusting of the sample is observed and pores can appear. Consequently, the volume of the sample is fixed and the drying of the interior of the sample, which is still in a rubbery state, is more difficult. However, when the moisture profiles into the solid tend to be less pronounced or nearly linear, the material decreases its volume almost constantly during the process.
1.2. Drying kinetics modelling and simulation
Although the traditional production methods are based on the experience through the years, nowadays the society demands new production methods which ensure safety, quality and health. Therefore, the prediction and control of the production results is now a requirement in every factory, especially when food products are manufactured. Thus, a mathematical model constitutes an essential tool which allows the analysis, estimation and control of the production processes. Therefore, the mathematical modelling of the processes represents a basic factor in new production systems in order to estimate the process development (Bon, Rosselló, Femenia, Eim, and Simal, 2007). According to Rathnayaka Mudiyanselage, Karunasena, Gu, Guan, and Senadeera (2017), numerical modelling is an effective resource to investigate the fundamental mechanisms of plant cellular structures and their dynamics. However, the modelling of drying processes becomes a challenge when biological materials are dried due to their heterogeneity, complexity and sensitivity (Chou and Chua, 2001). The level of the model complexity should be equalized to the cost and time needed to develop and set it up and, at the same time, a suitable accuracy must be reached. A model could be too much simple and represent an unlikely situation or it could be too much complex and become a useless application.
48
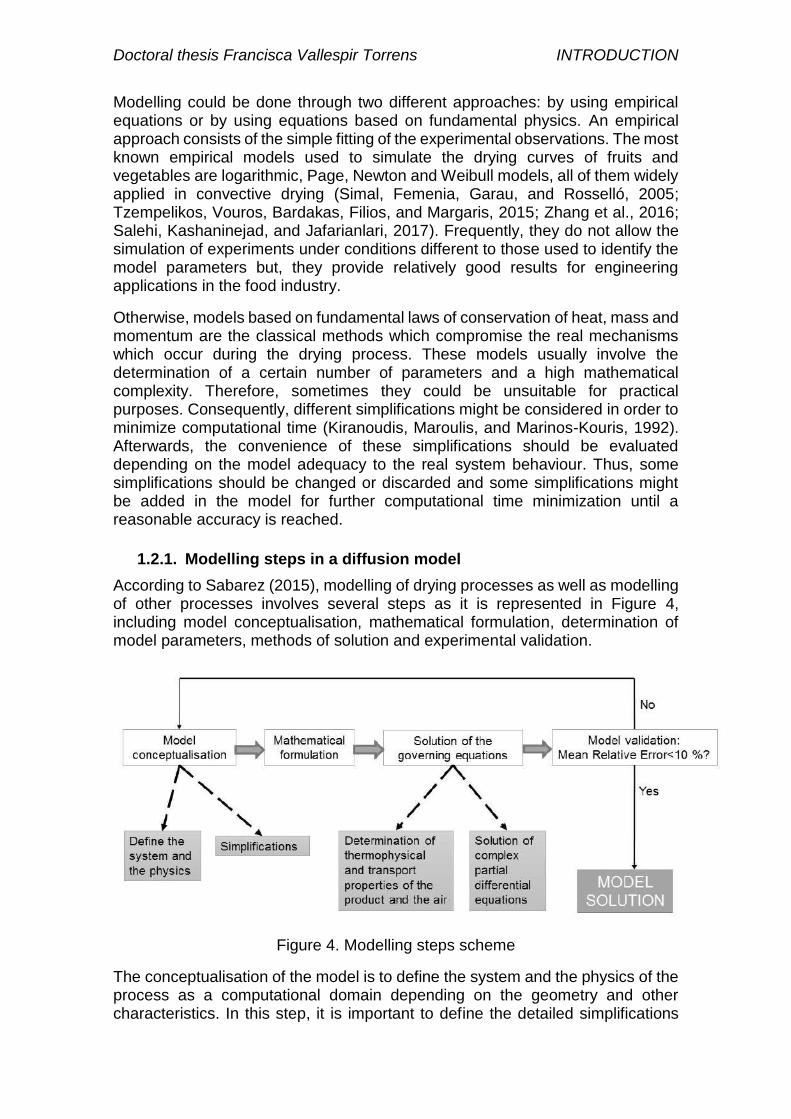
Doctoral thesis Francisca Vallespir Torrens INTRODUCTION
Modelling could be done through two different approaches: by using empirical equations or by using equations based on fundamental physics. An empirical approach consists of the simple fitting of the experimental observations. The most known empirical models used to simulate the drying curves of fruits and vegetables are logarithmic, Page, Newton and Weibull models, all of them widely applied in convective drying (Simal, Femenia, Garau, and Rosselló, 2005; Tzempelikos, Vouros, Bardakas, Filios, and Margaris, 2015; Zhang et al., 2016; Salehi, Kashaninejad, and Jafarianlari, 2017). Frequently, they do not allow the simulation of experiments under conditions different to those used to identify the model parameters but, they provide relatively good results for engineering applications in the food industry.
Otherwise, models based on fundamental laws of conservation of heat, mass and momentum are the classical methods which compromise the real mechanisms which occur during the drying process. These models usually involve the determination of a certain number of parameters and a high mathematical complexity. Therefore, sometimes they could be unsuitable for practical purposes. Consequently, different simplifications might be considered in order to minimize computational time (Kiranoudis, Maroulis, and Marinos-Kouris, 1992). Afterwards, the convenience of these simplifications should be evaluated depending on the model adequacy to the real system behaviour. Thus, some simplifications should be changed or discarded and some simplifications might be added in the model for further computational time minimization until a reasonable accuracy is reached.
1.2.1. Modelling steps in a diffusion model
According to Sabarez (2015), modelling of drying processes as well as modelling of other processes involves several steps as it is represented in Figure 4, including model conceptualisation, mathematical formulation, determination of model parameters, methods of solution and experimental validation.
Figure 4. Modelling steps scheme
The conceptualisation of the model is to define the system and the physics of the process as a computational domain depending on the geometry and other characteristics. In this step, it is important to define the detailed simplifications
49
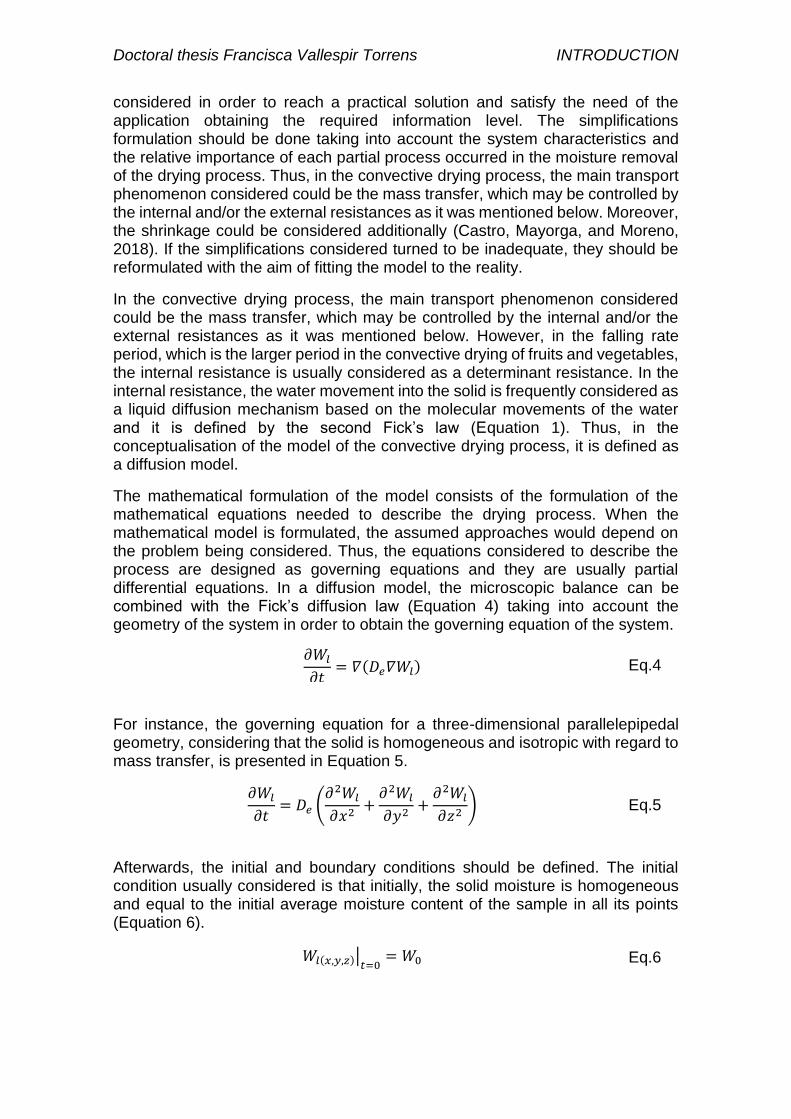
Doctoral thesis Francisca Vallespir Torrens INTRODUCTION
considered in order to reach a practical solution and satisfy the need of the application obtaining the required information level. The simplifications formulation should be done taking into account the system characteristics and the relative importance of each partial process occurred in the moisture removal of the drying process. Thus, in the convective drying process, the main transport phenomenon considered could be the mass transfer, which may be controlled by the internal and/or the external resistances as it was mentioned below. Moreover, the shrinkage could be considered additionally (Castro, Mayorga, and Moreno, 2018). If the simplifications considered turned to be inadequate, they should be reformulated with the aim of fitting the model to the reality.
In the convective drying process, the main transport phenomenon considered could be the mass transfer, which may be controlled by the internal and/or the external resistances as it was mentioned below. However, in the falling rate period, which is the larger period in the convective drying of fruits and vegetables, the internal resistance is usually considered as a determinant resistance. In the internal resistance, the water movement into the solid is frequently considered as a liquid diffusion mechanism based on the molecular movements of the water and it is defined by the second Fick’s law (Equation 1). Thus, in the conceptualisation of the model of the convective drying process, it is defined as a diffusion model.
The mathematical formulation of the model consists of the formulation of the mathematical equations needed to describe the drying process. When the mathematical model is formulated, the assumed approaches would depend on the problem being considered. Thus, the equations considered to describe the process are designed as governing equations and they are usually partial differential equations. In a diffusion model, the microscopic balance can be combined with the Fick’s diffusion law (Equation 4) taking into account the geometry of the system in order to obtain the governing equation of the system.
𝜕𝑊𝑙
𝜕𝑡= 𝛻(𝐷𝑒𝛻𝑊𝑙) Eq.4
For instance, the governing equation for a three-dimensional parallelepipedal geometry, considering that the solid is homogeneous and isotropic with regard to mass transfer, is presented in Equation 5.
𝜕𝑊𝑙
𝜕𝑡= 𝐷𝑒 (
𝜕2𝑊𝑙
𝜕𝑥2+𝜕2𝑊𝑙
𝜕𝑦2+𝜕2𝑊𝑙
𝜕𝑧2) Eq.5
Afterwards, the initial and boundary conditions should be defined. The initial condition usually considered is that initially, the solid moisture is homogeneous and equal to the initial average moisture content of the sample in all its points (Equation 6).
𝑊𝑙(𝑥,𝑦,𝑧)|𝑡=0 = 𝑊0 Eq.6
50
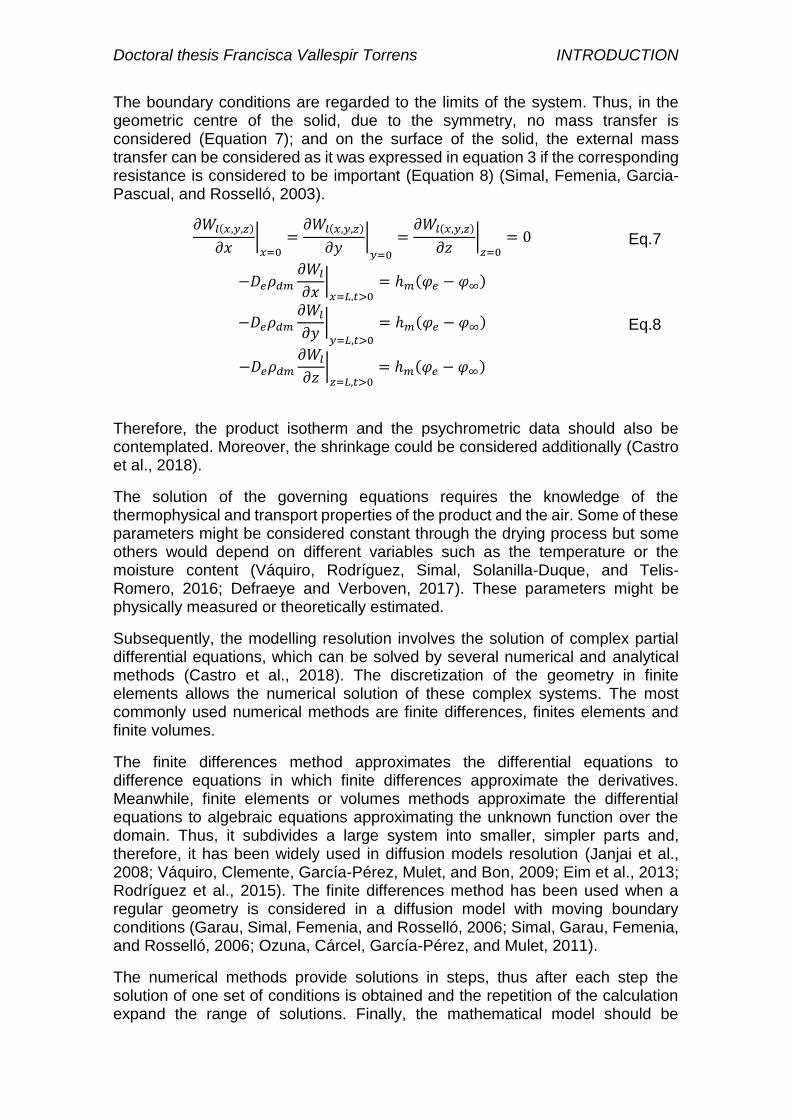
Doctoral thesis Francisca Vallespir Torrens INTRODUCTION
The boundary conditions are regarded to the limits of the system. Thus, in the geometric centre of the solid, due to the symmetry, no mass transfer is considered (Equation 7); and on the surface of the solid, the external mass transfer can be considered as it was expressed in equation 3 if the corresponding resistance is considered to be important (Equation 8) (Simal, Femenia, Garcia-Pascual, and Rosselló, 2003).
𝜕𝑊𝑙(𝑥,𝑦,𝑧)
𝜕𝑥|𝑥=0
=𝜕𝑊𝑙(𝑥,𝑦,𝑧)
𝜕𝑦|𝑦=0
=𝜕𝑊𝑙(𝑥,𝑦,𝑧)
𝜕𝑧|𝑧=0
= 0 Eq.7
−𝐷𝑒𝜌𝑑𝑚𝜕𝑊𝑙
𝜕𝑥|𝑥=𝐿,𝑡>0
= ℎ𝑚(𝜑𝑒 − 𝜑∞)
−𝐷𝑒𝜌𝑑𝑚𝜕𝑊𝑙
𝜕𝑦|𝑦=𝐿,𝑡>0
= ℎ𝑚(𝜑𝑒 − 𝜑∞) Eq.8
−𝐷𝑒𝜌𝑑𝑚𝜕𝑊𝑙
𝜕𝑧|𝑧=𝐿,𝑡>0
= ℎ𝑚(𝜑𝑒 − 𝜑∞)
Therefore, the product isotherm and the psychrometric data should also be contemplated. Moreover, the shrinkage could be considered additionally (Castro et al., 2018).
The solution of the governing equations requires the knowledge of the thermophysical and transport properties of the product and the air. Some of these parameters might be considered constant through the drying process but some others would depend on different variables such as the temperature or the moisture content (Váquiro, Rodríguez, Simal, Solanilla-Duque, and Telis-Romero, 2016; Defraeye and Verboven, 2017). These parameters might be physically measured or theoretically estimated.
Subsequently, the modelling resolution involves the solution of complex partial differential equations, which can be solved by several numerical and analytical methods (Castro et al., 2018). The discretization of the geometry in finite elements allows the numerical solution of these complex systems. The most commonly used numerical methods are finite differences, finites elements and finite volumes.
The finite differences method approximates the differential equations to difference equations in which finite differences approximate the derivatives. Meanwhile, finite elements or volumes methods approximate the differential equations to algebraic equations approximating the unknown function over the domain. Thus, it subdivides a large system into smaller, simpler parts and, therefore, it has been widely used in diffusion models resolution (Janjai et al., 2008; Váquiro, Clemente, García-Pérez, Mulet, and Bon, 2009; Eim et al., 2013; Rodríguez et al., 2015). The finite differences method has been used when a regular geometry is considered in a diffusion model with moving boundary conditions (Garau, Simal, Femenia, and Rosselló, 2006; Simal, Garau, Femenia, and Rosselló, 2006; Ozuna, Cárcel, García-Pérez, and Mulet, 2011).
The numerical methods provide solutions in steps, thus after each step the solution of one set of conditions is obtained and the repetition of the calculation expand the range of solutions. Finally, the mathematical model should be
51

Doctoral thesis Francisca Vallespir Torrens INTRODUCTION
validated in order to asses if the mathematical description of the process captures reality. The obtained solution of the model must be comparable to the real system behaviour. Thus, differences between the predicted values and the experimental data are indicators of the considered simplification level of the problem. When the level of simplification and the level of accuracy are optimized, the real problem could be satisfactorily explained by the proposed model. Frequently, the percentage of mean relative error (MRE) between predicted and experimental values is calculated in order to evaluate the quality of the simulation provided by the drying model. For example, the model could be considered as acceptable if MRE is lower than 10% (Kaymak-Ertekin and Gedik, 2005).
When solving a model, it is frequent to unknown one or several parameters of the model, in the present case, both the effective diffusion and external mass transfer coefficients are unknown. Consequently, initial values of the unknown model parameters are supposed to solve the model and compare the results of the simulation with the experimental ones. By using an iterative method of identification, new figures for the model parameters are obtained for the resolution of the model in order to minimize the differences between the experimental and calculated drying curves. With the definitive model parameters, those which allow the minimization of differences between experimental and calculated drying curves (effective diffusion and external mass transfer coefficients), the percentage of mean relative error is calculated and the quality of the simulation is evaluated.
1.3. Quality parameters changes during convective drying
One of the main concerns after drying process is the loss of quality of the dried product compared with the fresh one. The food quality changes during drying may be classified in chemical and physical changes as it is represented in Table 1 Chua and Chou (2014).
Table 1. Food quality changes, adapted from Chua and Chou (2014)
Chemical changes Physical changes
Vitamin and other bioactive compounds’ losses Antioxidant activity loss
Protein loss Lipid oxidation
Microbial survival Aroma degradation
Colour loss Rehydration changes
Solubility changes Texture changes
Shrinkage Gelatinization
Aroma volatilization
It is important to consider that degradation processes of food quality parameters during drying are mainly related to heat and time exposure (Chou and Chua, 2001). The increase of the temperature may promote nutrients losses due to the decomposition of different chemical compounds. Therefore, as the temperature increases, the degradation rate increases. Many different analytical methods are proposed in the literature for bioactive compounds contents determination as well as for its antioxidant activity (Madrau et al., 2008; Wojdyło, Figiel, and Oszmiański, 2009). Afterwards, the bioactive compounds contents and
52
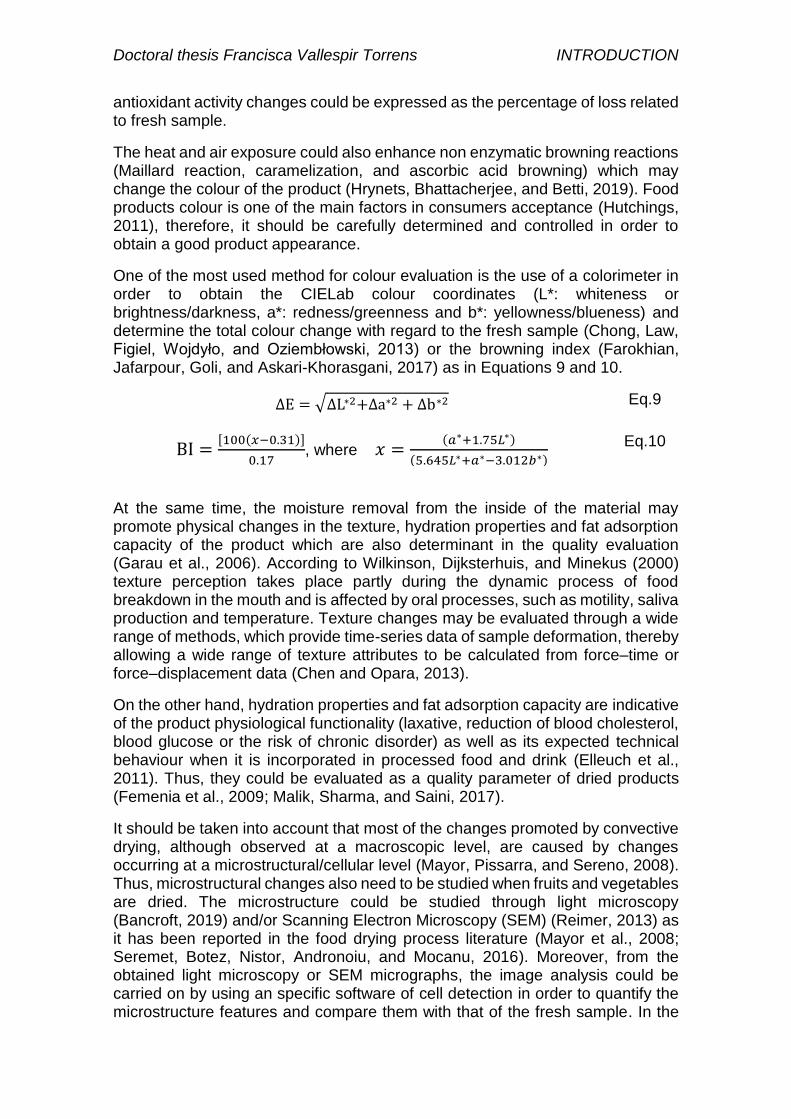
Doctoral thesis Francisca Vallespir Torrens INTRODUCTION
antioxidant activity changes could be expressed as the percentage of loss related to fresh sample.
The heat and air exposure could also enhance non enzymatic browning reactions (Maillard reaction, caramelization, and ascorbic acid browning) which may change the colour of the product (Hrynets, Bhattacherjee, and Betti, 2019). Food products colour is one of the main factors in consumers acceptance (Hutchings, 2011), therefore, it should be carefully determined and controlled in order to obtain a good product appearance.
One of the most used method for colour evaluation is the use of a colorimeter in order to obtain the CIELab colour coordinates (L*: whiteness or brightness/darkness, a*: redness/greenness and b*: yellowness/blueness) and determine the total colour change with regard to the fresh sample (Chong, Law, Figiel, Wojdyło, and Oziembłowski, 2013) or the browning index (Farokhian, Jafarpour, Goli, and Askari-Khorasgani, 2017) as in Equations 9 and 10.
∆E = √∆L∗2+∆a∗2 + ∆b∗2
Eq.9
BI =[100(𝑥−0.31)]
0.17, where 𝑥 =
(𝑎∗+1.75𝐿∗)
(5.645𝐿∗+𝑎∗−3.012𝑏∗)
Eq.10
At the same time, the moisture removal from the inside of the material may promote physical changes in the texture, hydration properties and fat adsorption capacity of the product which are also determinant in the quality evaluation (Garau et al., 2006). According to Wilkinson, Dijksterhuis, and Minekus (2000) texture perception takes place partly during the dynamic process of food breakdown in the mouth and is affected by oral processes, such as motility, saliva production and temperature. Texture changes may be evaluated through a wide range of methods, which provide time-series data of sample deformation, thereby allowing a wide range of texture attributes to be calculated from force–time or force–displacement data (Chen and Opara, 2013).
On the other hand, hydration properties and fat adsorption capacity are indicative of the product physiological functionality (laxative, reduction of blood cholesterol, blood glucose or the risk of chronic disorder) as well as its expected technical behaviour when it is incorporated in processed food and drink (Elleuch et al., 2011). Thus, they could be evaluated as a quality parameter of dried products (Femenia et al., 2009; Malik, Sharma, and Saini, 2017).
It should be taken into account that most of the changes promoted by convective drying, although observed at a macroscopic level, are caused by changes occurring at a microstructural/cellular level (Mayor, Pissarra, and Sereno, 2008). Thus, microstructural changes also need to be studied when fruits and vegetables are dried. The microstructure could be studied through light microscopy (Bancroft, 2019) and/or Scanning Electron Microscopy (SEM) (Reimer, 2013) as it has been reported in the food drying process literature (Mayor et al., 2008; Seremet, Botez, Nistor, Andronoiu, and Mocanu, 2016). Moreover, from the obtained light microscopy or SEM micrographs, the image analysis could be carried on by using an specific software of cell detection in order to quantify the microstructure features and compare them with that of the fresh sample. In the
53
Doctoral thesis Francisca Vallespir Torrens INTRODUCTION
image analysis process, the cell cavities are detected and evaluated in terms of cell number, area, perimeter, roundness, axis length, elongation and compactness (Mayor et al., 2008; Ramírez, Troncoso, Muñoz, and Aguilera, 2011).
In conclusion, in convective drying processes, air temperature, humidity and velocity have significant effects on the drying kinetics and, consequently, on the quality of the final food products. Therefore, the minimization of the product quality degradation can be reached through the direct control of the drying parameters (Chua and Chou, 2014).
1.4. Low-temperature drying
In order to better preserve quality parameters, convective drying at low temperatures have been proposed as a novel technique (Ozuna, Cárcel, Walde, and Garcia-Perez, 2014). Low temperatures during drying process would reduce thermolabile compounds losses due to less thermal damages. Thus, low-temperature convective drying refers to the convective drying at air temperatures
below 20 C, which include figures below or close to the product's freezing point and at atmospheric pressure (Ozuna et al., 2014). Therefore, the drying air should present a low relative humidity (Moreno, Brines, Mulet, Rosselló, and Cárcel, 2017), below 35%.
When drying temperatures between 20 and 0 C are used, the moisture removal is carried out by evaporation. Meanwhile, when drying temperature is lower than
0 C the moisture removal consists of a sublimation process and the freezing of the sample is required (Santacatalina, Fissore, Cárcel, Mulet, and García-Pérez, 2015). In this last case, the drying technique is also called atmospheric freeze drying.
With regard to quality parameters, compared with convective drying at high
temperatures, low-temperature drying at temperatures between 20 and 0C has been reported to decrease the quality parameters losses. For instance, according to Santacatalina et al. (2014) and Rodríguez et al. (2014), the losses of some bioactive compounds (total polyphenols and flavonoids) in apple var. Granny Smith during convective drying were of 25% at 0 °C and 28% at 10 °C but of 39% at 30 °C. Furthermore, the loss of hardness of rehydrated eggplant after convective drying compared to that of the fresh sample, was of ca 68% when drying was at temperatures between 40 and 60 °C (Urun, Yaman, and Köse, 2015) but only of ca 45% when drying air was at a lower temperature (10 °C) (Santacatalina, Soriano, Cárcel, and Garcia-Perez, 2016).
Thus, low-temperature drying using temperatures between 20 and 0 C could be a reasonable alternative to hot-air convective drying, in order to obtain high quality food products.
However, low-temperature drying usually presents a very low drying rate. For example, to reach an 80% of weight loss low-temperature drying (at 10 °C and 2 m/s) of apple cubes (8.8 mm side) required 17.1 h (Santacatalina, Contreras, Simal, Cárcel, and Garcia-Perez, 2016), meanwhile hot-air drying (at 70 °C and 1 m/s) of apple cubes (10 mm side) required only 1.92 h (Rodríguez et al., 2014). Therefore, low-temperature drying is prone to be intensified.
54

Doctoral thesis Francisca Vallespir Torrens INTRODUCTION
2. Drying pre-treatments: freezing pre-treatment
Different pre-treatments, such as chilling, blanching, osmotic dehydration, compression, ultrasonic bath and freezing, have been applied in order to enhance food drying process (Dandamrongrak, Young, and Mason, 2002; Arévalo-Pinedo and Xidieh Murr, 2007; Rodríguez et al., 2015; Ando et al., 2016; Wei, Liu, Li, Liu, and Jiang, 2017). Drying pre-treatments have been reported to promote different structural changes in the sample which ease the water removal during drying. These structural changes have been described as the injury to the cell membrane and the weak adhesion of cell walls by Ando et al. (2016). According to Wei et al. (2017), the structure collapse during pre-treatment processes facilitated heat and moisture transfer during drying.
Among the different pre-treatments, freezing has been reported to enhance the mass transfer process in vegetables and, therefore, promote higher drying rates (Lewicki, 2006). As it was observed by Dandamrongrak et al. (2002), freezing
pre-treatment (at −34 ºC) enhanced better the drying process of banana at 50 ºC and 3.1 m/s than chilling (at 0 ºC for 24 h) or blanching (at 100 ºC for 3 min).
Moreover, according to Ando et al. (2016), freezing pre-treatment (at −20 ºC) promoted a higher mass transfer enhancement than blanching (at 60-100 ºC for 5 min) in carrot root drying at 60 ºC and 0.83 m/s. One of the most important effects of freezing is the occurrence of tissue structure disorders due to the ice crystals formation (Bonat Celli, Ghanem, and Su-Ling Brooks, 2016).
2.1. Freezing pre-treatment characteristics
2.1.1. Freezing rate
According to Li, Zhu, and Sun (2018), the process of the ice crystals formation is regarded as one of the main factors affecting the cell structure during freezing, together with the water migration and the inherent characteristics of cell structure. Consequently, different freezing pre-treatments might have different effects depending on the freezing rate. Thus, the freezing pre-treatment characterization is usually done through the freezing rate or cooling rate which is defined as the average of the ratio between the temperature gap (from the initial ambient temperature to the final set temperature) and the global freezing time (Chassagne-Berces, Fonseca, Citeau, and Marin, 2010).
However, some other authors (Haiying, Shaozhi, and Guangming, 2007) reported that the ice crystals formation is mainly during the freezing plateau which is the temperature constant period starting from the initial freezing point. Therefore, the freezing rate could also be determined in this step of the freezing process.
In overall, it is accepted that faster freezing rates lead to less damage than slower freezing rates (Nowak, Piechucka, Witrowa-Rajchert, and Wiktor, 2016). However, the breakage of the product due to ice density differences with water can be provoked by too fast freezing (Chassagne-Berces et al., 2009).
2.1.2. Freezing equipment
Another important characteristic of the freezing pre-treatment are the specifications of the equipment used in the freezing process. Freezing chambers
55
Doctoral thesis Francisca Vallespir Torrens INTRODUCTION
have some characteristic features which could also change the freezing process performance, such as the kind of air circulation. The heat transfer process is faster when the air is forced in the surroundings of the sample, enhancing the freezing rate, than when the air is naturally moved.
As it was reported by Nowak et al. (2016), when comparing freezing under natural
convection at −20 °C with that under forced convection at −40 °C, freezing time was 7-15 times shorter and the cooling rate 4 times greater in the second case, which was not expected to be that high with regard to the temperature difference. Thus, the authors concluded that the freezing method resulted in diverse freezing intensity due to different air circulation, as well as freezing temperature difference.
To sum up, the freezing pre-treatment characterization is related to both the freezing rate and the freezing chamber features.
2.2. Freezing pre-treatment and material structure
As it was reported by Li et al. (2018) the inherent characteristics of cell structure are also important with regard to freezing process effects on the materials. Unfortunately, only few studies of different freezing treatments have been found and only for one product at a time: apple (Chassagne-Berces et al., 2009), carrot (Kidmose and Martens, 1999), and strawberry (Delgado and Rubiolo, 2005), or for different products but subjected to only one freezing treatment (green
asparagus, zucchini and green beans frozen at −40 °C) (Paciulli et al., 2015). The only found exception was the study of Chassagne-Berces et al. (2010) which
evaluated the effect of different freezing treatments (−20 °C, −80 °C and liquid nitrogen immersion) of mangoes and apples of different varieties and ripeness, concluding that the quality parameters analysed (texture, colour, soluble solids and water content) changed differently depending on the freezing protocol and the product nature and state.
Thus, there is still a claim for a better understanding of the complex mechanisms that take place during freezing which are not only affected by the freezing velocity but also by the structure of the sample submitted to freezing process.
2.3. Freezing pre-treatment effects on drying kinetics
It seems that freezing process modifies the structure and results in better water diffusion since it contributes to an easier water removal and, consequently, shorter drying times. Significant drying time reductions have been reported in the literature when different freezing pre-treatments were applied, compared with untreated samples. Thus, drying time of banana (at 50 ºC and 3.1 m/s)
(Dandamrongrak et al., 2002) and apple (at 60 C and 1.2 m/s) (Ramírez et al.,
2011) after freezing pre-treatment at −34 ºC and at −30 ºC, respectively, were significantly shorter (46 and 28% shorter, respectively) in comparison with those
of unfrozen samples. Moreover, freezing pre-treatment at −20 °C promoted
reductions of the drying time by 32% (at 70 C and 2 m/s), 13-20% (60-80 ºC) and 40% (60 ºC and 0.81 m/s) on the drying kinetics of beetroot, blueberries and carrots, respectively (Shynkaryk, Lebovka, and Vorobiev, 2008; Zielinska, Sadowski, and Błaszczak, 2015; Ando et al., 2016). Drying time of cape gooseberry (60 ºC and 2 m/s) was shortened by freezing pre-treatment of the
56
Doctoral thesis Francisca Vallespir Torrens INTRODUCTION
samples at −18 °C (13%) and by liquid nitrogen immersion (20%) (Junqueira, Corrêa, de Oliveira, Ivo Soares Avelar, and Salles Pio, 2017).
Due to the drying time reduction, freezing pre-treatment has been reported to decrease specific energy consumption by up to 27% in comparison with drying
without pre-treatment when blueberries were frozen (at −20 °C) prior to drying at 60 and 80 °C (Zielinska et al., 2015).
2.4. Freezing pre-treatment effects on dried product quality
Different characteristics of the food products are determined by the structural organization at different levels; from molecular to tissue level (Chassagne-Berces et al., 2009). Thus, material tissue structure disorders due to ice crystals formation would lead to physico-chemical changes which could promote macroscopic effects on properties related to the colour, the texture, the bioactive compounds content and/or the antioxidant activity of the sample, among others. The quality of the frozen and dried product would depend on the extension of such changes. For instance, Shynkaryk et al. (2008) observed higher shrinkage during drying, slower rehydration kinetics after drying and lower stress-relaxation texture curves (in dried and rehydrated samples) in frozen beetroot samples (at
−20 C) than in untreated ones.
Moreover, in order to understand and predict the changes occurred in the physico-chemical properties at higher levels of structure, the knowledge of the microstructural changes is crucial (Mayor et al., 2008). Ramírez et al. (2011) observed a more damaged microstructure (analysed by light microscopy) in
frozen apple samples (at −30 C) than in untreated samples. In this study the disruption of the cell walls was observed after freezing treatment in the light microscope images. Therefore, in the light microscope image analysis of frozen samples, significantly higher mean cell area was determined than in those of untreated ones, due to larger cell cavities created after the cell wall breakage during freezing.
In overall, freezing pre-treatment may damage the product quality, but at the same time, the quality could be better preserved due to drying time shortening which minimizes thermal exposure of the material.
3. Energy assistance during drying process: ultrasound application
Convective drying is usually a high energy demanding operation. According to Chua and Chou (2014), by using combined methods, the drying time could be reduced while retaining most quality parameters. The combined methods could be thermal techniques, non-thermal techniques, or combination of both.
Thermal techniques are based on heating technologies which surmount the internal resistance to water transfer inherent to the agricultural products. These techniques could be based on microwave, infrared or radio-frequency energies, the three of them being reported as able to reduce the time and energy consumption of fruits and vegetables drying (Onwude et al., 2016). However, they are based on the product heating which may induce higher quality parameters losses compared to conventional convective drying due to the higher
57
Doctoral thesis Francisca Vallespir Torrens INTRODUCTION
temperatures reached by the sample being dried. Therefore, non-thermal techniques could be considered instead.
Non-thermal techniques include ultraviolet radiation, pulsed electric fields and ultrasound energies (Onwude et al., 2017). They do not involve the generation of heat; thus, they do not depend on the temperature of source and they could be effective at room or less intense temperatures.
Ultraviolet radiation energy has been used as a medium of disinfection, inactivation of microorganisms in liquid food and as a post-harvest treatment of fruits and vegetables (Pataro, Sinik, Capitoli, Donsì, and Ferrari, 2015). It seems that, when applying ultraviolet radiation energy during drying, the injured reproductive systems of cells lead to the death of cells increasing the pore formation and the rate of moisture transfer (Phimphilai, Maimamuang, and Phimphilai, 2014). Thus, it has been reported to reduce drying time up to 38%
compared with convectional convective drying of mistletoe at 60-80 C and 0.5-1.5 m/s (Köse and Erentürk, 2010). However, it can be said that ultraviolet radiation energy drying mechanism is still in the early stages of investigation (Onwude et al., 2017).
Pulsed electric fields energy should be applied on materials with low electrical conductivity, high electrical resistivity and free of bubbles. Thus, it is not suitable for all materials. Significant drying time reductions were reported when combining pulsed electric fields with convective drying. Wiktor et al. (2013) reported a drying time reduction by 12% when applying pulsed electric fields in apple drying at 70
C and 2 m/s. However, pulsed electric field energy application has also been reported to electrically increase product damage presenting increased resistance of smaller cells (Onwude et al., 2017).
Finally, ultrasound energy is based on sound waves with frequencies higher than 20 kHz which is the upper audible limit of human hearing (Rodriguez et al., 2018).
3.1. Ultrasound characteristics
3.1.1. Ultrasound waves
Ultrasound waves could be characterized by the following parameters (Cárcel, García-Pérez, Riera, Rosselló, and Mulet, 2014):
❖ Frequency (Hz) is the number of cycles or vibrations completed in a unit of time. The inverse of the frequency is the period (T, s) which is defined as the time needed for a wave to complete a cycle.
❖ Speed (m/s) is the propagation velocity of the wave. It is usually characteristic of the material medium. However, it could be affected by the temperature or the pressure.
❖ Wavelength (m) is the distance between two planes in which the particles are in the same state of vibration. It is calculated by the quotient of the acoustic speed over the frequency.
❖ Amplitude (m) is the maximum movement of the particle from the equilibrium position.
❖ Intensity (W/m2) is defined as the average energy transmitted per unit of time through a unit of area perpendicular to the propagation direction.
58
Doctoral thesis Francisca Vallespir Torrens INTRODUCTION
❖ Power (W) is the total beamed energy from the ultrasonic source per unit of time. It can be determined from the product of the intensity and the radiant surface area.
❖ Impedance (MRayl) is the relationship between the acoustic pressure and the vibration speed of the particle. It can be determined through the product of the speed and the medium density. When the acoustic wave goes through the interphase, a part of the wave is reflected and the other is transmitted. The reflected energy ratio depends on the impedance differences between both mediums. Thus, the bigger the impedance difference, the higher the reflected energy and the lower the transmitted one. Therefore, the impedance is an important factor in ultrasound applications. If the reflected energy ratio is higher than the transmitted one, the ultrasound effects would be higher in the interphase than in the second medium. However, if the reflected energy ratio is lower than the transmitted one, the effects would be higher in the second medium.
❖ Attenuation is the loss of energy (intensity) as the wave goes through the medium. The attenuation depends on the distance to the wave source and it is due to the reflection, dispersion or diffraction phenomena during the wave propagation as well as the transformation of kinetic energy to thermal energy. The attenuation establishes the proportion of the energy that it is generated and the amount of energy that the sample receives.
Ultrasound waves have the same properties as sound waves, thus, they are elastic waves and they have to be propagated through a material medium. The material medium could be solid, liquid or gas. Moreover, ultrasound propagates by longitudinal motion but not by transverse motion (Musielak, Mierzwa, and Kroehnke, 2016). Therefore, ultrasound waves promote mechanical compression (high pressure) and rarefaction (low pressure) cycles of the material medium which are key in their application.
Ultrasound waves are classified into low- and high-intensity ultrasound according to their different applications. Low-intensity applications use frequencies higher than 100 kHz at intensities below 10 kW/m2 and their purpose is transmitting energy through a medium without causing a change in the state of the medium (Musielak et al., 2016). They are used as non- destructive characterization of the medium in medical diagnosis, depth sounding, acoustic spectroscopy and microscopy or industrial monitoring and control, for instance in the evaluation of frying oil degradation (Benedito, García-Pérez, Carmen Dobarganes, and Mulet, 2007).
High-intensity applications use frequencies between 20 and 100 kHz at intensities higher than 10 kW/m2 and their objective is to induce changes in the products or processes (Cárcel, García-Pérez, Benedito, and Mulet, 2012).
3.1.2. High-intensity ultrasound equipment in drying process
The ultrasound application system consists of three main elements: generator, transducer and emitter, as it is represented in Figure 5. The generator transforms the electrical signal into the selected frequency; the transducer, which is a vibrating body, converts the frequency electrical signal into mechanical
59
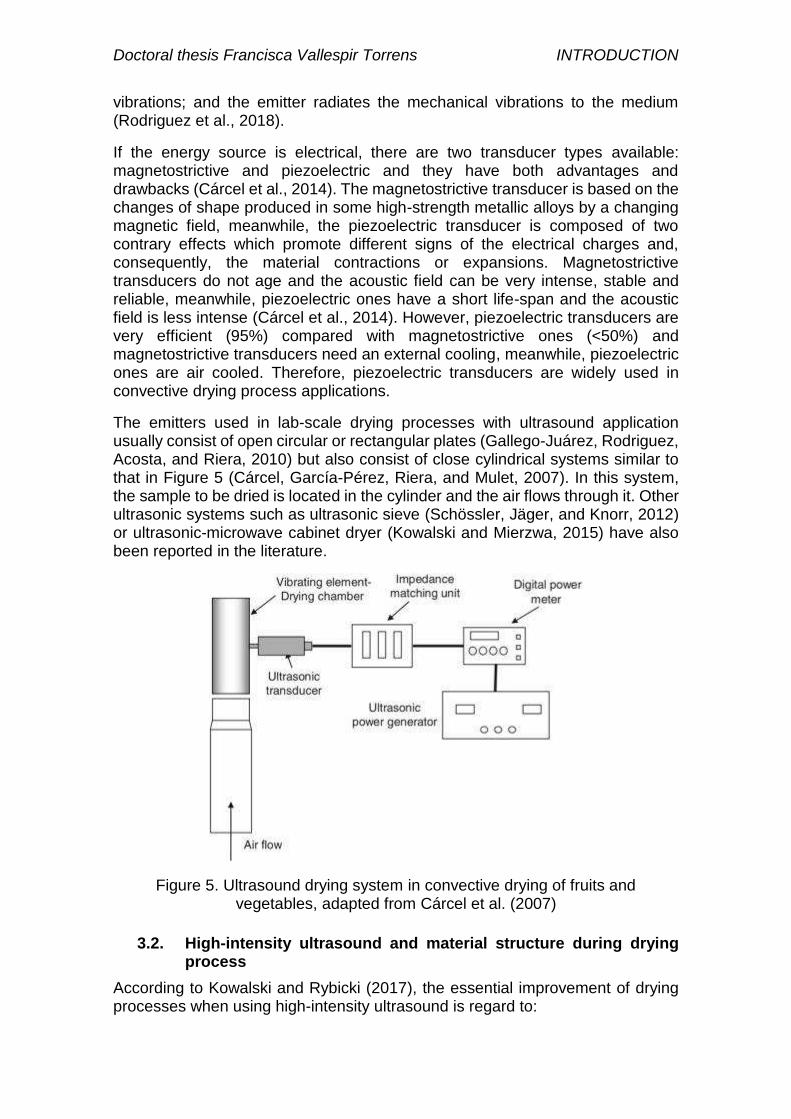
Doctoral thesis Francisca Vallespir Torrens INTRODUCTION
vibrations; and the emitter radiates the mechanical vibrations to the medium (Rodriguez et al., 2018).
If the energy source is electrical, there are two transducer types available: magnetostrictive and piezoelectric and they have both advantages and drawbacks (Cárcel et al., 2014). The magnetostrictive transducer is based on the changes of shape produced in some high-strength metallic alloys by a changing magnetic field, meanwhile, the piezoelectric transducer is composed of two contrary effects which promote different signs of the electrical charges and, consequently, the material contractions or expansions. Magnetostrictive transducers do not age and the acoustic field can be very intense, stable and reliable, meanwhile, piezoelectric ones have a short life-span and the acoustic field is less intense (Cárcel et al., 2014). However, piezoelectric transducers are very efficient (95%) compared with magnetostrictive ones (<50%) and magnetostrictive transducers need an external cooling, meanwhile, piezoelectric ones are air cooled. Therefore, piezoelectric transducers are widely used in convective drying process applications.
The emitters used in lab-scale drying processes with ultrasound application usually consist of open circular or rectangular plates (Gallego-Juárez, Rodriguez, Acosta, and Riera, 2010) but also consist of close cylindrical systems similar to that in Figure 5 (Cárcel, García-Pérez, Riera, and Mulet, 2007). In this system, the sample to be dried is located in the cylinder and the air flows through it. Other ultrasonic systems such as ultrasonic sieve (Schössler, Jäger, and Knorr, 2012) or ultrasonic-microwave cabinet dryer (Kowalski and Mierzwa, 2015) have also been reported in the literature.
Figure 5. Ultrasound drying system in convective drying of fruits and vegetables, adapted from Cárcel et al. (2007)
3.2. High-intensity ultrasound and material structure during drying process
According to Kowalski and Rybicki (2017), the essential improvement of drying processes when using high-intensity ultrasound is regard to:
60
Doctoral thesis Francisca Vallespir Torrens INTRODUCTION
• Shortening of drying time
• Reduction of energy consumption
• Improvement of dried products quality
However, the effects of ultrasound application on the convective drying kinetics and the quality of the dried product vary according to the properties of the acoustic wave (frequency, power, attenuation, impedance) and the structure and the nature of the food product (Rodriguez et al., 2018).
Although ultrasound produces alternating compressions and expansions of the material in general, the effects are different when the material is fluid or solid (Cárcel et al., 2012). The effects of ultrasound application in fluid are pressure variations and stirring. However, the efficient transmission of the acoustic waves in fluid medium from the transducer is challenging due to the impedance mismatch and the ultrasonic attenuation. In solid materials, the effect of ultrasound application is similar to that observed when a sponge is squeezed and released repeatedly and the liquid is released from the inside. Thus, the forces involved in this mechanical effect could be higher than the surface tension of the water molecules inside the solid making easier the interchanges of matter (Cárcel et al., 2012).
In the ultrasound application during convective drying of solid samples, the efficiency of the ultrasound propagation through the air and the solid should be considered. The gases such as air are highly attenuating of the ultrasound waves because they absorb the acoustic energy preventing its transfer to the solids being treated (Cárcel et al., 2014). Moreover, the high impedance difference between the air and the solid emitters surface and between the air and the solid samples promotes the reflection of a high ratio of the acoustic signal with regard to the transmitted one (García-Pérez, Cárcel, De la Fuente-Blanco, and De Sarabia, 2006). Therefore, a proper application system should be designed in order to achieve an efficient ultrasound application.
3.3. High-intensity ultrasound effects on drying kinetics
The ultrasound application in gas-solid systems have been developed recently and the enhancement of the convective drying has been observed (Fan, Zhang, and Mujumdar, 2017). The effects of ultrasound application on hot-air convective drying have been observed at mild temperature (less than 50 °C) (García-Pérez, Rosselló, et al., 2006) and at low air velocities (less than 4 m/s) (Cárcel et al., 2007).
Ultrasound application effects during hot-air drying of different products have been previously studied. Reported drying time reductions (at 40 °C and 1 m/s of air velocity) due to ultrasound application (at power density of 37 kW/m3 and 22 kHz of frequency) were between 32 and 72% on carrot cubes (García-Pérez, Cárcel, Riera, and Mulet, 2009) and eggplant cylinders (García-Pérez, Ozuna, Ortuño, Cárcel, and Mulet, 2011), respectively. As a consequence of the drying time reductions, significant energy reductions were reported when ultrasound was applied during hot-air drying, compared with drying without ultrasound application. Energy consumption reductions of 10-19% and 9-11% were reported by Kowalski, Pawłowski, Szadzińska, Łechtańska, and Stasiak (2016) and Szadzińska, Łechtańska, Kowalski, and Stasiak (2017) when applying ultrasound
61
Doctoral thesis Francisca Vallespir Torrens INTRODUCTION
(at 100 and 200 W) on raspberries drying at 55 C and on green pepper drying at
54 C, respectively. Moreover, higher energy consumption reductions (42-54%)
were reported in ultrasound assisted (75-90 W) drying of apples at 40 C by Sabarez, Gallego-Juárez, and Riera (2012).
In low-temperature drying, 75% of drying time reduction was observed in apple cubes drying (at 10 °C and 2 m/s) (Santacatalina, Contreras, et al., 2016) when ultrasound was applied (at power densities of 20.5 kW/m3 and 30.8 kW/m3, respectively, and 22 kHz of frequency).
To sum up, in general, higher drying process enhancement was observed with ultrasound application (75% in apple drying at 10 °C and 2 m/s (Santacatalina, Contreras, et al., 2016)) than with ultraviolet radiation (38% in mistletoe drying at
60-80 C and 0.5-1.5 m/s (Köse and Erentürk, 2010)) or pulsed electric fields
(12% in apple drying at 70 C and 2 m/s (Wiktor et al., 2013)) application. Therefore, it is a promising non-thermal combined method for drying process.
Furthermore, according to Onwude et al. (2017), the ultrasound effect seems to be higher at the beginning of the drying process. Therefore, it is suggested to apply the ultrasound energy at the first moments of the moisture removal in order to avoid further energy consumption and quality parameters losses due to the ultrasound extra application.
3.4. High-intensity ultrasound effects on dried product quality
Regarding quality parameters changes when ultrasound was applied during convective drying, Musielak et al. (2016) and Fan et al. (2017) compared a wide range of studies in their reviews and it was reported that, in general, the dried product quality was maintained or even enhanced with regard to some parameters (such as total phenolic content, flavonoid content, antioxidant activity) when ultrasound was applied during drying process because similar or lower losses were observed compared with drying process without ultrasound application. However, significant losses in dried product colour, water activity, porosity and hardness were usually reported after ultrasound application during drying, compared with drying process without ultrasound application. Rodriguez
et al. (2018) particularizes that, at low temperatures (below 40-50 C), the drying process shortening limited the oxidation reactions that maintain most of the
bioactive compounds contents. But, at high temperatures (above 40-50 C), the ultrasound application affected negatively the bioactive compounds contents as a result of the synergy between thermal and acoustic energy.
In fact, when ultrasound at 30.8 kW/m3 was applied in hot-air convective drying
experiments of apple at 30, 50 and 70 C and 1 m/s (Rodríguez et al., 2014) and
passion fruit peel at 40, 50, 60 at 70 C an 1 m/s (Do Nascimento, Mulet, Ascheri, de Carvalho, and Cárcel, 2016) higher bioactive compounds contents and
antioxidant activity losses were observed at high temperatures (above 50 C)
than at low temperatures (below 50 C), compared with drying without ultrasound application.
In low-temperature drying (below 20 C), equal or lower losses of hardness in rehydrated sample, total polyphenol content and antioxidant activity were
62
Doctoral thesis Francisca Vallespir Torrens INTRODUCTION
reported after ultrasonically assisted (at 10.3, 20.5 and 30.8 kW/m3) drying of apple cubes (8.8 mm side) at low-temperature drying (at 10 °C and 2 m/s), in comparison with changes after drying without ultrasound application (Santacatalina, Contreras, et al., 2016). Moreover, colour coordinates (CIELab scale) of cod slices dried (at temperatures of 0, 10 and 20 °C and air velocity of 2 m/s) with ultrasound application (at a power density of 20.5 kW/m3 and frequency of 22 kHz) presented negligible differences to salted cod dried without ultrasound application (Ozuna et al., 2014; Santacatalina, Guerrero, Garcia-Perez, Mulet, and Cárcel, 2016). However, quality changes in food products during low-temperature drying with and without ultrasound application have been barely studied in the literature.
4. Overall perspective
From the literature review, an overall perspective could be obtained with the following bullet points:
• Drying process is commonly used to stabilise food materials due to their short shelf life promoted by their high moisture content.
• Convective drying intensification is mainly focused on mass transfer process enhancement, which is related to energy and cost savings, and quality retention.
• The drying of a solid may promote its shrinkage. Thus, the microstructure of the product is affected and the solid dimensions and the external transfer area are reduced.
• Drying process modelling is an essential tool with the objective of asses the system and predict its results. Modelling methods based on fundamental laws explain better the real system behaviour.
• Food quality involves bioactive compounds contents, antioxidant activity and physical evaluation (colour, texture, hydration properties and fat adsorption capacity, among others) as well as the product microstructure.
• Convective drying may induce important quality parameters losses in fruits and vegetables, the extension of these losses being related to drying time and temperature.
• Low-temperature drying at temperatures below 20 C but above 0 C may provide high quality products; however, it has a very low drying rate.
• Freezing pre-treatment modifies the product structure promoting the mass transfer enhancement during drying process.
• Ice crystals growing may induce different changes in quality parameters of the product depending on the freezing process parameters and the product characteristics.
• Ultrasound application eases the moisture removal process from the inside of the solid intensifying the drying process.
• Compressions and expansions cycles promoted by ultrasound may deteriorate, maintain or enhance product quality according to drying temperature and the product characteristics.
63
Doctoral thesis Francisca Vallespir Torrens INTRODUCTION
5. Research hypotheses
Taking into account the literature review, the following research hypotheses were stated as the initial point of the experimental work:
I. The application of freezing pre-treatments at different freezing temperatures may modify the drying kinetics and final quality and microstructure of food products.
II. Different effects due to the freezing rate and freezing equipment characteristics as well as the product characteristics could be expected.
III. The high-intensity ultrasound application during drying could enhance the convective drying process of fruits and vegetables. Furthermore, the moisture removal process could be further eased if a freezing pre-treatment is also applied.
IV. The ice crystals growing during the freezing pre-treatment and the compressions and expansions due to the ultrasound application during drying may affect the microstructure of the samples before and after drying as well as the quality parameters.
V. When the convective drying is carried out at low-temperature, high quality dried food products could be obtained. However, this process requires a long processing time which could be enhanced by using high-intensity ultrasound application during drying.
VI. The ultrasound compressions and expansions may induce samples microstructure damages which may be assessed through microscope observations, and also modify the final dried product quality.
VII. Mathematical modelling could help to evaluate the effects of both freezing pre-treatment application and drying assisted by ultrasound.
64
Doctoral thesis Francisca Vallespir Torrens INTRODUCTION
6. References
Ando, Y., Maeda, Y., Mizutani, K., Wakatsuki, N., Hagiwara, S., and Nabetani, H. (2016). Impact of blanching and freeze-thaw pretreatment on drying rate of carrot roots in relation to changes in cell membrane function and cell wall structure. LWT - Food Science and Technology, 71, 40-46. doi: 10.1016/j.lwt.2016.03.019
Arévalo-Pinedo, A., and Xidieh Murr, F. E. (2007). Influence of pre-treatments on the drying kinetics during vacuum drying of carrot and pumpkin. Journal of Food Engineering, 80(1), 152-156. doi: 10.1016/j.jfoodeng.2006.05.005
Bancroft, J. D. (2019). Chapter 3 - Light microscopy. In S. K. Suvarna, C. Layton & J. D. Bancroft (Eds.), Bancroft's Theory and Practice of Histological Techniques (Eighth Edition) (pp. 25-39): Elsevier Health Sciences.
Benedito, J., García-Pérez, J. V., Carmen Dobarganes, M., and Mulet, A. (2007). Rapid evaluation of frying oil degradation using ultrasonic technology. Food Research International, 40(3), 406-414. doi: 10.1016/j.foodres.2006.10.017
Bird, R. B., Stewart, W. E., and Lightfoot, E. N. (2007). Transport Phenomena. New York: Wiley.
Bon, J., Rosselló, C., Femenia, A., Eim, V., and Simal, S. (2007). Mathematical modeling of drying kinetics for apricots: influence of the external resistance to mass transfer. Drying Technology, 25(11), 1829-1835. doi: 10.1080/07373930701677918
Bonat Celli, G., Ghanem, A., and Su-Ling Brooks, M. (2016). Influence of freezing process and frozen storage on the quality of fruits and fruit products. Food Reviews International, 32(3), 280-304. doi: 10.1080/87559129.2015.1075212
Brasil, I. M., and Siddiqui, M. W. (2018). Chapter 1 - Postharvest Quality of Fruits and Vegetables: An Overview. In M. W. Siddiqu (Ed.), Preharvest Modulation of Postharvest Fruit and Vegetable Quality (pp. 1-40): Academic Press.
Cárcel, J. A., García-Pérez, J. V., Benedito, J., and Mulet, A. (2012). Food process innovation through new technologies: Use of ultrasound. Journal of Food Engineering, 110(2), 200-207. doi: 10.1016/j.jfoodeng.2011.05.038
Cárcel, J. A., García-Pérez, J. V., Riera, E., and Mulet, A. (2007). Influence of high-intensity ultrasound on drying kinetics of persimmon. Drying Technology, 25(1), 185-193. doi: 10.1080/07373930601161070
Cárcel, J. A., García-Pérez, J. V., Riera, E., and Mulet, A. (2011). Improvement of convective drying of carrot by applying power ultrasound—Influence of mass load density. Drying Technology, 29(2), 174-182. doi: 10.1080/07373937.2010.483032
Cárcel, J. A., García-Pérez, J. V., Riera, E., Rosselló, C., and Mulet, A. (2014). Chapter 8 - Drying assisted by power ultrasound. In E. Tsotsas & A. S. Mujumdar (Eds.), Modern Drying Technology (Vol. 5, pp. 237-278): Wiley-VCH Verlag GmbH & Co. KGaA.
Castell-Palou, A., Váquiro, H. A., Cárcel, J. A., Rosselló, C., Femenia, A., and Simal, S. (2012). Mathematical Modeling of Moisture Distribution and Kinetics in Cheese Drying. Drying Technology, 30(11-12), 1247-1255. doi: 10.1080/07373937.2012.704465
Castro, A. M., Mayorga, E. Y., and Moreno, F. L. (2018). Mathematical modelling of convective drying of fruits: A review. Journal of Food Engineering, 223, 152-167. doi: 10.1016/j.jfoodeng.2017.12.012
Crank, J. (1979). The mathematics of diffusion. Oxford: Oxford university press. Chassagne-Berces, S., Fonseca, F., Citeau, M., and Marin, M. (2010). Freezing
protocol effect on quality properties of fruit tissue according to the fruit, the
65
Doctoral thesis Francisca Vallespir Torrens INTRODUCTION
variety and the stage of maturity. LWT - Food Science and Technology, 43(9), 1441-1449. doi: 10.1016/j.lwt.2010.04.004
Chassagne-Berces, S., Poirier, C., Devaux, M.-F., Fonseca, F., Lahaye, M., Pigorini, G., . . . Guillon, F. (2009). Changes in texture, cellular structure and cell wall composition in apple tissue as a result of freezing. Food Research International, 42(7), 788-797. doi: 10.1016/j.foodres.2009.03.001
Chen, L., and Opara, U. L. (2013). Approaches to analysis and modeling texture in fresh and processed foods – A review. Journal of Food Engineering, 119(3), 497-507. doi: https://doi.org/10.1016/j.jfoodeng.2013.06.028
Chong, C. H., Law, C. L., Figiel, A., Wojdyło, A., and Oziembłowski, M. (2013). Colour, phenolic content and antioxidant capacity of some fruits dehydrated by a combination of different methods. Food Chemistry, 141(4), 3889-3896. doi: 10.1016/j.foodchem.2013.06.042
Chou, S. K., and Chua, K. J. (2001). New hybrid drying technologies for heat sensitive foodstuffs. Trends in Food Science & Technology, 12(10), 359-369. doi: 10.1016/S0924-2244(01)00102-9
Chua, K. J., and Chou, S. K. (2014). Chapter 24 - Recent Advances in Hybrid Drying Technologies. In D.-W. Sun (Ed.), Emerging Technologies for Food Processing (Second Edition) (pp. 447-459). San Diego: Academic Press.
Dandamrongrak, R., Young, G., and Mason, R. (2002). Evaluation of various pre-treatments for the dehydration of banana and selection of suitable drying models. Journal of Food Engineering, 55(2), 139-146. doi: 10.1016/S0260-8774(02)00028-6
De Lima, A. G. B., Queiroz, M. R., and Nebra, S. A. (2002). Simultaneous moisture transport and shrinkage during drying of solids with ellipsoidal configuration. Chemical Engineering Journal, 86(1), 85-93. doi: 10.1016/S1385-8947(01)00276-5
Defraeye, T., and Verboven, P. (2017). Convective drying of fruit: role and impact of moisture transport properties in modelling. Journal of Food Engineering, 193, 95-107. doi: 10.1016/j.jfoodeng.2016.08.013
Delgado, A. E., and Rubiolo, A. C. (2005). Microstructural changes in strawberry after freezing and thawing processes. LWT - Food Science and Technology, 38(2), 135-142. doi: 10.1016/j.lwt.2004.04.015
Do Nascimento, E. M. G. C., Mulet, A., Ascheri, J. L. R., de Carvalho, C. W. P., and Cárcel, J. A. (2016). Effects of high-intensity ultrasound on drying kinetics and antioxidant properties of passion fruit peel. Journal of Food Engineering, 170, 108-118. doi: 10.1016/j.jfoodeng.2015.09.015
Eim, V. S., Urrea, D., Rosselló, C., García-Pérez, J. V., Femenia, A., and Simal, S. (2013). Optimization of the drying process of carrot (Daucus carota v. Nantes) on the basis of quality criteria. Drying Technology, 31(8), 951-962. doi: 10.1080/07373937.2012.707162
Elleuch, M., Bedigian, D., Roiseux, O., Besbes, S., Blecker, C., and Attia, H. (2011). Dietary fibre and fibre-rich by-products of food processing: Characterisation, technological functionality and commercial applications: A review. Food Chemistry, 124(2), 411-421. doi: 10.1016/j.foodchem.2010.06.077
Fan, K., Zhang, M., and Mujumdar, A. S. (2017). Application of airborne ultrasound in the convective drying of fruits and vegetables: A review. Ultrasonics Sonochemistry, 39, 47-57. doi: 10.1016/j.ultsonch.2017.04.001
Farokhian, F., Jafarpour, M., Goli, M., and Askari-Khorasgani, O. (2017). Quality Preservation of Air-Dried Sliced Button Mushroom (Agaricus bisporus) by Lavender (Lavendula angustifolia Mill.) Essential Oil. Journal of Food Process Engineering, 40(3), e12432. doi: 10.1111/jfpe.12432
Femenia, A., Sastre-Serrano, G., Simal, S., Garau, M. C., Eim, V. S., and Rosselló, C. (2009). Effects of air-drying temperature on the cell walls of kiwifruit processed
66
Doctoral thesis Francisca Vallespir Torrens INTRODUCTION
at different stages of ripening. LWT - Food Science and Technology, 42(1), 106-112. doi: https://doi.org/10.1016/j.lwt.2008.05.022
Gallego-Juárez, J. A., Rodriguez, G., Acosta, V., and Riera, E. (2010). Power ultrasonic transducers with extensive radiators for industrial processing. Ultrasonics Sonochemistry, 17(6), 953-964. doi: https://doi.org/10.1016/j.ultsonch.2009.11.006
Gamboa-Santos, J., Montilla, A., Cárcel, J. A., Villamiel, M., and Garcia-Perez, J. V. (2014). Air-borne ultrasound application in the convective drying of strawberry. Journal of Food Engineering, 128, 132-139. doi: 10.1016/j.jfoodeng.2013.12.021
Garau, M. C., Simal, S., Femenia, A., and Rosselló, C. (2006). Drying of orange skin: drying kinetics modelling and functional properties. Journal of Food Engineering, 75(2), 288-295. doi: https://doi.org/10.1016/j.jfoodeng.2005.04.017
García-Pérez, J. V., Cárcel, J., De la Fuente-Blanco, S., and De Sarabia, E. R.-F. (2006). Ultrasonic drying of foodstuff in a fluidized bed: Parametric study. Ultrasonics, 44, e539-e543. doi: 10.1016/j.ultras.2006.06.059
García-Pérez, J. V., Cárcel, J. A., Riera, E., and Mulet, A. (2009). Influence of the applied acoustic energy on the drying of carrots and lemon peel. Drying Technology, 27(2), 281-287. doi: 10.1080/07373930802606428
García-Pérez, J. V., Ozuna, C., Ortuño, C., Cárcel, J. A., and Mulet, A. (2011). Modeling ultrasonically assisted convective drying of eggplant. Drying Technology, 29(13), 1499-1509. doi: 10.1080/07373937.2011.576321
García-Pérez, J. V., Rosselló, C., Cárcel, J., De la Fuente, S., and Mulet, A. (2006). Effect of air temperature on convective drying assisted by high power ultrasound. Paper presented at the Defect and Diffusion Forum, Switzerland.
Haiying, W., Shaozhi, Z., and Guangming, C. (2007). Experimental study on the freezing characteristics of four kinds of vegetables. LWT - Food Science and Technology, 40(6), 1112-1116. doi: 10.1016/j.lwt.2006.06.001
Hrynets, Y., Bhattacherjee, A., and Betti, M. (2019). Nonenzymatic Browning Reactions: Overview. In L. Melton, F. Shahidi & P. Varelis (Eds.), Encyclopedia of Food Chemistry (pp. 233-244). Oxford: Academic Press.
Hutchings, J. B. (2011). Food Colour and Appearance. US: Springer US. Janjai, S., and Bala, B. (2012). Solar drying technology. Food Engineering Reviews,
4(1), 16-54. doi: 10.1007/s12393-011-9044-6 Janjai, S., Lamlert, N., Intawee, P., Mahayothee, B., Haewsungcharern, M., Bala, B. K.,
and Müller, J. (2008). Finite element simulation of drying of mango. Biosystems Engineering, 99(4), 523-531. doi: 10.1016/j.biosystemseng.2007.12.010
Junqueira, J. R. d. J., Corrêa, J. L. G., de Oliveira, H. M., Ivo Soares Avelar, R., and Salles Pio, L. A. (2017). Convective drying of cape gooseberry fruits: Effect of pretreatments on kinetics and quality parameters. LWT - Food Science and Technology, 82(Supplement C), 404-410. doi: 10.1016/j.lwt.2017.04.072
Kaymak-Ertekin, F., and Gedik, A. (2005). Kinetic modelling of quality deterioration in onions during drying and storage. Journal of Food Engineering, 68(4), 443-453. doi: 10.1016/j.jfoodeng.2004.06.022
Kidmose, U., and Martens, H. J. (1999). Changes in texture, microstructure and nutritional quality of carrot slices during blanching and freezing. Journal of the Science of Food and Agriculture, 79(12), 1747-1753. doi: 10.1002/(sici)1097-0010(199909)79:12<1747::aid-jsfa429>3.0.co;2-b
Kiranoudis, C. T., Maroulis, Z. B., and Marinos-Kouris, D. (1992). Model selection in air drying of foods. Drying Technology, 10(4), 1097-1106. doi: 10.1080/07373939208916497
Köse, B., and Erentürk, S. (2010). Drying characteristics of mistletoe (Viscum album L.) in convective and UV combined convective type dryers. Industrial Crops and Products, 32(3), 394-399. doi: 10.1016/j.indcrop.2010.06.008
67
Doctoral thesis Francisca Vallespir Torrens INTRODUCTION
Kowalski, S. J., and Mierzwa, D. (2015). US-Assisted convective drying of biological materials. Drying Technology, 33(13), 1601-1613. doi: 10.1080/07373937.2015.1026985
Kowalski, S. J., Pawłowski, A., Szadzińska, J., Łechtańska, J., and Stasiak, M. (2016). High power airborne ultrasound assist in combined drying of raspberries. Innovative Food Science & Emerging Technologies, 34, 225-233. doi: 10.1016/j.ifset.2016.02.006
Kowalski, S. J., and Rybicki, A. (2017). Ultrasound in wet biological materials subjected to drying. Journal of Food Engineering, 212, 271-282. doi: 10.1016/j.jfoodeng.2017.05.032
Lewicki, P. P. (2006). Design of hot air drying for better foods. Trends in Food Science & Technology, 17(4), 153-163. doi: 10.1016/j.tifs.2005.10.012
Lewicki, P. P., and Pawlak, G. (2003). Effect of drying on microstructure of plant tissue. Drying Technology, 21(4), 657-683. doi: 10.1081/DRT-120019057
Li, D., Zhu, Z., and Sun, D.-W. (2018). Effects of freezing on cell structure of fresh cellular food materials: A review. Trends in Food Science & Technology, 75, 46-55. doi: 10.1016/j.tifs.2018.02.019
Madrau, M. A., Piscopo, A., Sanguinetti, A. M., Del Caro, A., Poiana, M., Romeo, F. V., and Piga, A. (2008). Effect of drying temperature on polyphenolic content and antioxidant activity of apricots. European Food Research and Technology, 228(3), 441. doi: 10.1007/s00217-008-0951-6
Malik, M. A., Sharma, H. K., and Saini, C. S. (2017). High intensity ultrasound treatment of protein isolate extracted from dephenolized sunflower meal: Effect on physicochemical and functional properties. Ultrasonics Sonochemistry, 39(Supplement C), 511-519. doi: https://doi.org/10.1016/j.ultsonch.2017.05.026
Mayor, L., Pissarra, J., and Sereno, A. M. (2008). Microstructural changes during osmotic dehydration of parenchymatic pumpkin tissue. Journal of Food Engineering, 85(3), 326-339. doi: 10.1016/j.jfoodeng.2007.06.038
Mayor, L., and Sereno, A. M. (2004). Modelling shrinkage during convective drying of food materials: a review. Journal of Food Engineering, 61(3), 373-386. doi: 10.1016/S0260-8774(03)00144-4
Mayor, L., Silva, M. A., and Sereno, A. M. (2005). Microstructural changes during drying of apple slices. Drying Technology, 23(9-11), 2261-2276. doi: 10.1080/07373930500212776
Moreno, C., Brines, C., Mulet, A., Rosselló, C., and Cárcel, J. A. (2017). Antioxidant potential of atmospheric freeze-dried apples as affected by ultrasound application and sample surface. Drying Technology, 35(8), 957-968. doi: 10.1080/07373937.2016.1256890
Musielak, G., Mierzwa, D., and Kroehnke, J. (2016). Food drying enhancement by ultrasound – A review. Trends in Food Science & Technology, 56(Supplement C), 126-141. doi: 10.1016/j.tifs.2016.08.003
Nanda, S., Reddy, S. N., Hunter, H. N., Dalai, A. K., and Kozinski, J. A. (2015). Supercritical water gasification of fructose as a model compound for waste fruits and vegetables. The Journal of Supercritical Fluids, 104(Supplement C), 112-121. doi: 10.1016/j.supflu.2015.05.009
Nowak, D., Piechucka, P., Witrowa-Rajchert, D., and Wiktor, A. (2016). Impact of material structure on the course of freezing and freeze-drying and on the properties of dried substance, as exemplified by celery. Journal of Food Engineering, 180(Supplement C), 22-28. doi: 10.1016/j.jfoodeng.2016.01.032
Oliveira, S. M., Brandão, T. R. S., and Silva, C. L. M. (2016). Influence of Drying Processes and Pretreatments on Nutritional and Bioactive Characteristics of Dried Vegetables: A Review. Food Engineering Reviews, 8(2), 134-163. doi: 10.1007/s12393-015-9124-0
68

Doctoral thesis Francisca Vallespir Torrens INTRODUCTION
Onwude, D. I., Hashim, N., and Chen, G. (2016). Recent advances of novel thermal combined hot air drying of agricultural crops. Trends in Food Science & Technology, 57, 132-145. doi: 10.1016/j.tifs.2016.09.012
Onwude, D. I., Hashim, N., Janius, R., Abdan, K., Chen, G., and Oladejo, A. O. (2017). Non-thermal hybrid drying of fruits and vegetables: A review of current technologies. Innovative Food Science & Emerging Technologies, 43(Supplement C), 223-238. doi: 10.1016/j.ifset.2017.08.010
Ozuna, C., Cárcel, J. A., García-Pérez, J. V., and Mulet, A. (2011). Improvement of water transport mechanisms during potato drying by applying ultrasound. Journal of the Science of Food and Agriculture, 91(14), 2511-2517. doi: 10.1002/jsfa.4344
Ozuna, C., Cárcel, J. A., Walde, P. M., and Garcia-Perez, J. V. (2014). Low-temperature drying of salted cod (Gadus morhua) assisted by high power ultrasound: Kinetics and physical properties. Innovative Food Science & Emerging Technologies, 23(Supplement C), 146-155. doi: 10.1016/j.ifset.2014.03.008
Paciulli, M., Ganino, T., Pellegrini, N., Rinaldi, M., Zaupa, M., Fabbri, A., and Chiavaro, E. (2015). Impact of the industrial freezing process on selected vegetables — Part I. Structure, texture and antioxidant capacity. Food Research International, 74, 329-337. doi: 10.1016/j.foodres.2014.04.019
Park, K. J., Ardito, T. H., Ito, A. P., Park, K. J. B., de Oliveira, R. A., and Chiorato, M. (2007). Effective Diffusivity Determination Considering Shrinkage by Means of Explicit Finite Difference Method. Drying Technology, 25(7-8), 1313-1319. doi: 10.1080/07373930701438873
Pataro, G., Sinik, M., Capitoli, M. M., Donsì, G., and Ferrari, G. (2015). The influence of post-harvest UV-C and pulsed light treatments on quality and antioxidant properties of tomato fruits during storage. Innovative Food Science & Emerging Technologies, 30, 103-111. doi: 10.1016/j.ifset.2015.06.003
Perry, R., and Green, D. (2008). Perry's Chemical Engineers' Handbook, Eighth Edition. New York: McGraw-Hill Education.
Phimphilai, S., Maimamuang, S., and Phimphilai, K. (2014). Application of utraviolet radiation in the drying process of longan (Dimocarpus longan "Daw"). Paper presented at the IV International Symposium on Lychee, Longan and Other Sapindaceae Fruits. https://doi.org/10.17660/ActaHortic.2014.1029.49
Ramírez, C., Troncoso, E., Muñoz, J., and Aguilera, J. M. (2011). Microstructure analysis on pre-treated apple slices and its effect on water release during air drying. Journal of Food Engineering, 106(3), 253-261. doi: 10.1016/j.jfoodeng.2011.05.020
Ramos, I. N., Silva, C. L. M., Sereno, A. M., and Aguilera, J. M. (2004). Quantification of microstructural changes during first stage air drying of grape tissue. Journal of Food Engineering, 62(2), 159-164. doi: 10.1016/S0260-8774(03)00227-9
Rathnayaka Mudiyanselage, C. M., Karunasena, H. C. P., Gu, Y. T., Guan, L., and Senadeera, W. (2017). Novel trends in numerical modelling of plant food tissues and their morphological changes during drying – A review. Journal of Food Engineering, 194, 24-39. doi: 10.1016/j.jfoodeng.2016.09.002
Reimer, L. (2013). Scanning electron microscopy: physics of image formation and microanalysis. Berlin Heidelberg: Springer
Rodriguez, O., Eim, V., Rossello, C., Femenia, A., Carcel, J. A., and Simal, S. (2018). Application of power ultrasound on the convective drying of fruits and vegetables: effects on quality. Journal of the Science of Food and Agriculture, 98(5), 1660-1673. doi: 10.1002/jsfa.8673
Rodríguez, Ó., Eim, V. S., Simal, S., Femenia, A., and Rosselló, C. (2013). Validation of a difussion model using moisture profiles measured by means of TD-NMR in apples (Malus domestica). Food and Bioprocess Technology, 6(2), 542-552. doi: 10.1007/s11947-011-0711-7
69
Doctoral thesis Francisca Vallespir Torrens INTRODUCTION
Rodríguez, Ó., Llabrés, P. J., Simal, S., Femenia, A., and Rosselló, C. (2015). Intensification of predrying treatments by means of ultrasonic assistance: effects on water mobility, PPO activity, microstructure, and drying kinetics of apple. Food and Bioprocess Technology, 8(3), 503-515.
Rodríguez, Ó., Santacatalina, J. V., Simal, S., Garcia-Perez, J. V., Femenia, A., and Rosselló, C. (2014). Influence of power ultrasound application on drying kinetics of apple and its antioxidant and microstructural properties. Journal of Food Engineering, 129, 21-29. doi: 10.1016/j.jfoodeng.2014.01.001
Ruiz-López, I., and García-Alvarado, M. (2007). Analytical solution for food-drying kinetics considering shrinkage and variable diffusivity. Journal of Food Engineering, 79(1), 208-216. doi: 10.1016/j.jfoodeng.2006.01.051
Sabarez, H. T. (2012). Computational modelling of the transport phenomena occurring during convective drying of prunes. Journal of Food Engineering, 111(2), 279-288. doi: 10.1016/j.jfoodeng.2012.02.021
Sabarez, H. T. (2015). Chapter 4 - Modelling of drying processes for food materials. In S. Bakalis, K. Knoerzer & P. J. Fryer (Eds.), Modeling Food Processing Operations (pp. 95-127). UK: Woodhead Publishing.
Sabarez, H. T., Gallego-Juárez, J. A., and Riera, E. (2012). Ultrasonic-assisted convective drying of apple slices. Drying Technology, 30(9), 989-997. doi: 10.1080/07373937.2012.677083
Salehi, F., Kashaninejad, M., and Jafarianlari, A. (2017). Drying kinetics and characteristics of combined infrared-vacuum drying of button mushroom slices. Heat and Mass Transfer, 53(5), 1751-1759. doi: 10.1007/s00231-016-1931-1
Santacatalina, J., Rodríguez, O., Simal, S., Cárcel, J., Mulet, A., and García-Pérez, J. (2014). Ultrasonically enhanced low-temperature drying of apple: Influence on drying kinetics and antioxidant potential. Journal of Food Engineering, 138, 35-44. doi: 10.1016/j.jfoodeng.2014.04.003
Santacatalina, J. V., Contreras, M., Simal, S., Cárcel, J. A., and Garcia-Perez, J. V. (2016). Impact of applied ultrasonic power on the low temperature drying of apple. Ultrasonics Sonochemistry, 28(Supplement C), 100-109. doi: 10.1016/j.ultsonch.2015.06.027
Santacatalina, J. V., Fissore, D., Cárcel, J. A., Mulet, A., and García-Pérez, J. V. (2015). Model-based investigation into atmospheric freeze drying assisted by power ultrasound. Journal of Food Engineering, 151(Supplement C), 7-15. doi: 10.1016/j.jfoodeng.2014.11.013
Santacatalina, J. V., Guerrero, M. E., Garcia-Perez, J. V., Mulet, A., and Cárcel, J. A. (2016). Ultrasonically assisted low-temperature drying of desalted codfish. LWT - Food Science and Technology, 65(Supplement C), 444-450. doi: 10.1016/j.lwt.2015.08.023
Santacatalina, J. V., Soriano, J. R., Cárcel, J. A., and Garcia-Perez, J. V. (2016). Influence of air velocity and temperature on ultrasonically assisted low temperature drying of eggplant. Food and Bioproducts Processing, 100(Part A), 282-291. doi: 10.1016/j.fbp.2016.07.010
Schössler, K., Jäger, H., and Knorr, D. (2012). Effect of continuous and intermittent ultrasound on drying time and effective diffusivity during convective drying of apple and red bell pepper. Journal of Food Engineering, 108(1), 103-110. doi: 10.1016/j.jfoodeng.2011.07.018
Seremet, L., Botez, E., Nistor, O.-V., Andronoiu, D. G., and Mocanu, G.-D. (2016). Effect of different drying methods on moisture ratio and rehydration of pumpkin slices. Food Chemistry, 195, 104-109. doi: 10.1016/j.foodchem.2015.03.125
Shynkaryk, M. V., Lebovka, N. I., and Vorobiev, E. (2008). Pulsed electric fields and temperature effects on drying and rehydration of red beetroots. Drying Technology, 26(6), 695-704. doi: 10.1080/07373930802046260
Simal, S., Femenia, A., Garau, M. C., and Rosselló, C. (2005). Use of exponential, Page's and diffusional models to simulate the drying kinetics of kiwi fruit.
70

Doctoral thesis Francisca Vallespir Torrens INTRODUCTION
Journal of Food Engineering, 66(3), 323-328. doi: 10.1016/j.jfoodeng.2004.03.025
Simal, S., Femenia, A., Garcia-Pascual, P., and Rosselló, C. (2003). Simulation of the drying curves of a meat-based product: effect of the external resistance to mass transfer. Journal of Food Engineering, 58(2), 193-199. doi: https://doi.org/10.1016/S0260-8774(02)00369-2
Simal, S., Garau, M. C., Femenia, A., and Rosselló, C. (2006). A Diffusional Model with a Moisture-Dependent Diffusion Coefficient. Drying Technology, 24(11), 1365-1372. doi: 10.1080/07373930600952404
Szadzińska, J., Łechtańska, J., Kowalski, S. J., and Stasiak, M. (2017). The effect of high power airborne ultrasound and microwaves on convective drying effectiveness and quality of green pepper. Ultrasonics Sonochemistry, 34(Supplement C), 531-539. doi: 10.1016/j.ultsonch.2016.06.030
Tzempelikos, D. A., Vouros, A. P., Bardakas, A. V., Filios, A. E., and Margaris, D. P. (2015). Experimental study on convective drying of quince slices and evaluation of thin-layer drying models. Engineering in Agriculture, Environment and Food, 8(3), 169-177. doi: 10.1016/j.eaef.2014.12.002
Urun, G. B., Yaman, Ü. R., and Köse, E. (2015). Determination of drying characteristics and quality properties of eggplant in different drying conditions. Italian Journal of Food Science, 27(4), 459-467. doi: 10.14674/1120-1770/ijfs.v378
Váquiro, H., Mulet, A., García-Pérez, J., Clemente, G., and Bon, J. (2008). Optimization of Intermittent Hot Air Drying of Mango (Mangifera Indica L.). Paper presented at the Defect and Diffusion Forum, Switzerland.
Váquiro, H., Rodríguez, Ó., Simal, S., Solanilla-Duque, J. F., and Telis-Romero, J. (2016). Modelling of drying kinetics during non-isothermal convective drying of passion fruit seeds. Japan Journal of Food Engineering, 17(4), 117-121. doi: 10.11301/jsfe.17.117
Váquiro, H. A., Clemente, G., García-Pérez, J. V., Mulet, A., and Bon, J. (2009). Enthalpy-driven optimization of intermittent drying of Mangifera indica L. Chemical Engineering Research and Design, 87(7), 885-898. doi: https://doi.org/10.1016/j.cherd.2008.12.002
Wei, Q., Liu, C., Li, D., Liu, C., and Jiang, N. (2017). Comparison of four pretreatments on the drying behavior and quality of taro (Colocasia esculenta L. Schott) slices during intermittent microwave vacuum-assisted drying AU - Zhang, Zhongyuan. Drying Technology, 35(11), 1347-1357. doi: 10.1080/07373937.2017.1323761
Wiktor, A., Iwaniuk, M., Śledź, M., Nowacka, M., Chudoba, T., and Witrowa-Rajchert, D. (2013). Drying Kinetics of Apple Tissue Treated by Pulsed Electric Field. Drying Technology, 31(1), 112-119. doi: 10.1080/07373937.2012.724128
Wilkinson, C., Dijksterhuis, G. B., and Minekus, M. (2000). From food structure to texture. Trends in Food Science & Technology, 11(12), 442-450. doi: 10.1016/S0924-2244(01)00033-4
Wojdyło, A., Figiel, A., and Oszmiański, J. (2009). Effect of drying methods with the application of vacuum microwaves on the bioactive compounds, color, and antioxidant activity of strawberry fruits. Journal of Agricultural and Food Chemistry, 57(4), 1337-1343. doi: 10.1021/jf802507j
Zhang, Z., Liu, Z., Liu, C., Li, D., Jiang, N., and Liu, C. (2016). Effects of ultrasound pretreatment on drying kinetics and quality parameters of button mushroom slices. Drying Technology, 34(15), 1791-1800. doi: 10.1080/07373937.2015.1117486
Zielinska, M., Sadowski, P., and Błaszczak, W. (2015). Freezing/thawing and microwave-assisted drying of blueberries (Vaccinium corymbosum L.). LWT - Food Science and Technology, 62(1, Part 2), 555-563. doi: 10.1016/j.lwt.2014.08.002
71

Doctoral thesis Francisca Vallespir Torrens INTRODUCTION
72

OBJECTIVES
73

Doctoral thesis Francisca Vallespir Torrens OBJECTIVES
74
Doctoral thesis Francisca Vallespir Torrens OBJECTIVES
The work presented in this thesis was carried out within the framework of two research projects developed by the Agri-Food Engineering Group at the University of the Balearic Islands. These projects, financially supported by the Spanish government (MINECO) and the National Institute of Research and Agro-Food Technology (INIA) and co-financed with ERDF funds, were the following:
▪ “Aplicación de los ultrasonidos de potencia (UdP) en la intensificación de los procesos de secado a baja temperatura (DPI 2012-37466-C03-02)”.
▪ “Revalorización integral de subproductos en función de sus usos potenciales: Extracción de compuestos de interés mediante aplicación de US de potencia y estudios de bioaccesibilidad in vitro (RTA 2015-00060-C04-03)” within the coordinate project: “Gestión sostenible y revalorización de subproductos agroalimentarios para alimentación, energía y uso agronómico.”.
These projects were focused, on the ultrasound application in order to intensify the drying process at low-temperature; and on the sustainable management and revalorisation of agro-industrial by-products.
Within this context, the main aim of this work was, on the one hand, to study the drying process intensification at hot-air drying temperature by using freezing pre-treatments and ultrasound application; and on the other hand, also the intensification of the low-temperature drying process when ultrasound was applied. To these purposes, the effects on both the drying kinetics and the quality parameters were evaluated.
Thus, in order to achieve both general objectives, the following specific objectives were proposed:
➢ Evaluate the differences in hot-air drying of vegetable products with different initial microstructure (beetroot, apple and eggplant) when
different freezing pre-treatments (at −20 C, at −80 C and by liquid nitrogen immersion) were applied and analyse the changes in microstructure, colour, texture, bioactive compounds contents (total polyphenol content) and antioxidant activity. This objective was developed in “Chapter I: Hot-air drying intensification by using freezing pre-treatments”.
➢ Evaluate the effects of both freezing pre-treatment (at −20 C) and ultrasound application (at two power densities) on drying kinetics, microstructure, bioactive compounds contents (betalain and total polyphenol contents) and antioxidant activity of beetroot. This objective was worked out in “Chapter II: Hot-air drying intensification by using freezing pre-treatment and ultrasound application”.
➢ Asses the ultrasound application effects on low-temperature drying at
different temperatures (at 5, 10 and 15 C) of kiwifruit and mushroom and on their quality parameters such as microstructure, hydration properties, fat adsorption capacity, colour, bioactive compounds contents and antioxidant activity. This objective was developed in “Chapter III: Low-temperature drying intensification by ultrasound application”.
75

Doctoral thesis Francisca Vallespir Torrens OBJECTIVES
76

WORKING PLAN
77

Doctoral thesis Francisca Vallespir Torrens WORKING PLAN
78
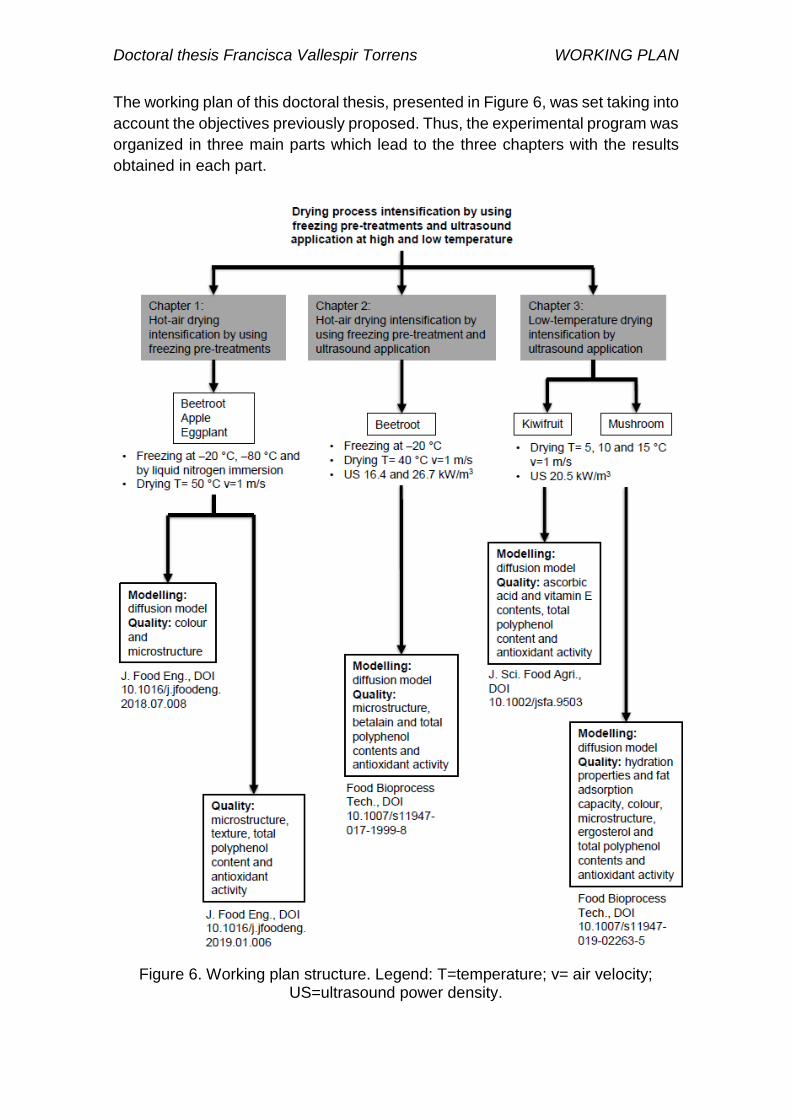
Doctoral thesis Francisca Vallespir Torrens WORKING PLAN
The working plan of this doctoral thesis, presented in Figure 6, was set taking into
account the objectives previously proposed. Thus, the experimental program was
organized in three main parts which lead to the three chapters with the results
obtained in each part.
Figure 6. Working plan structure. Legend: T=temperature; v= air velocity; US=ultrasound power density.
79

Doctoral thesis Francisca Vallespir Torrens WORKING PLAN
The first part of the experimental plan (Chapter 1) consisted of the study of the
effects of different freezing pre-treatments on the hot-air drying kinetics and the
quality parameters of vegetal products with three different initial microstructures:
beetroot (Beta vulgaris var. conditiva), apple (Malus domestica var. Granny
Smith) and eggplant (Solanum melongena var. black enorma).
For this purpose, beetroot, apple and eggplant cubes (0.01 m side) were frozen
at −20 °C, at −80 °C and by liquid nitrogen immersion. Then, untreated and frozen
samples were convectively dried at air conditions of 50 °C and 1 m/s.
Firstly, the effects of freezing pre-treatments on the hot-air drying kinetics and
quality parameters such as colour and microstructure were evaluated. A
diffusional model, taking into account both internal and external resistances and
solid shrinkage, was proposed in order to analyse the mass transfer
intensification due to freezing pre-treatments. Colour and microstructure
(Scanning Electron Microscopy, SEM) of untreated and frozen samples before
and after drying were evaluated.
Secondly, microstructure, texture, bioactive compounds contents (TPC) and
antioxidant activity (AA) changes due to freezing pre-treatments and drying were
evaluated. Thus, microstructure micrographs, bioactive compounds contents
(total polyphenol) and antioxidant activity of untreated and frozen samples before
and after drying were analysed. Moreover, cell cavities throughout microstructure
light micrographs (Light Microscopy, LM) and texture of untreated and frozen
samples before drying was evaluated with the aim of observe the physical effects
of freezing pre-treatments.
The subsequent part of the experimental plan (Chapter 2) proposed the
evaluation of the effects, on both the hot-air drying kinetics and quality
parameters of beetroot (Beta vulgaris var. conditiva), when samples were frozen
prior to drying and/or ultrasound was applied during drying. Beetroot was chosen
as a bioactive compounds’ rich product (total polyphenol and betalains content).
Therefore, beetroot cubes (0.008 m side) were frozen at −20 °C. Then untreated
and frozen samples were convectively dried at 40 °C of air temperature and 1
m/s of air velocity with and without ultrasound application (at 16.4 and 26.7
kW/m3).
A diffusional model, taking into account both internal and external resistances
and solid shrinkage, was proposed in order to analyse the mass transfer
intensification due to freezing pre-treatment and ultrasound application.
Afterwards, microstructure (Light Microscopy, LM), bioactive compounds
contents (betalains and total polyphenol) and antioxidant activity of both
untreated and frozen samples before and after drying were analysed.
80
Doctoral thesis Francisca Vallespir Torrens WORKING PLAN
The last part of the experimental plan (Chapter 3) deal with the study of the effects
of the ultrasound application on the low-temperature drying kinetics and quality
parameters of kiwifruit (Actinidia deliciosa cv. Hayward) and mushroom (Agaricus
bisporus), which are very appreciated but quickly perishable products.
For this purpose, kiwifruit parallelepipeds (0.01 x 0.01 x 0.005 m) and mushroom
slices (0.005 m of thickness) were dried at 5, 10 and 15 °C of air temperature and
1 m/s of air velocity without and with ultrasound application (at 26.7 kW/m3).
A diffusional model considering both internal and external resistances and solid
shrinkage was proposed with the aim of evaluating mass transfer intensification
due to ultrasound application during kiwifruit and mushroom drying.
Regarding kiwifruit, bioactive compounds contents, such as ascorbic acid,
vitamin E and total polyphenol, and antioxidant activity were determined.
Meanwhile, regarding mushroom, microstructure (Light Microscopy, LM),
bioactive compounds contents, such as ergosterol and total polyphenol,
antioxidant activity, colour, hydration properties and fat adsorption capacity were
analysed.
81

Doctoral thesis Francisca Vallespir Torrens WORKING PLAN
82

RESULTS AND DISCUSSION
83

Doctoral thesis Francisca Vallespir Torrens RESULTS AND DISCUSSION
84

CHAPTER 1
Hot-air drying intensification by using freezing pre-treatments:
Freezing pre-treatments on the intensification of the drying process of vegetables with different structures
Francisca Vallespir, Óscar Rodríguez, Valeria S. Eim, Carmen Rosselló, Susana Simal
Journal of Food Engineering DOI: 10.1007/j.jfoodeng.2018.07.008
Accepted and published Impact factor (2017): 3.197
Food Science & Technology (Q1)
Effects of freezing treatments before convective drying on quality parameters: Vegetables with different microstructures
Francisca Vallespir, Óscar Rodríguez, Valeria S. Eim, Carmen Rosselló, Susana Simal
Journal of Food Engineering DOI: 10.1016/j.jfoodeng.2019.01.006
Accepted and published Impact factor (2017): 3.197
Food Science & Technology (Q1)
85

86
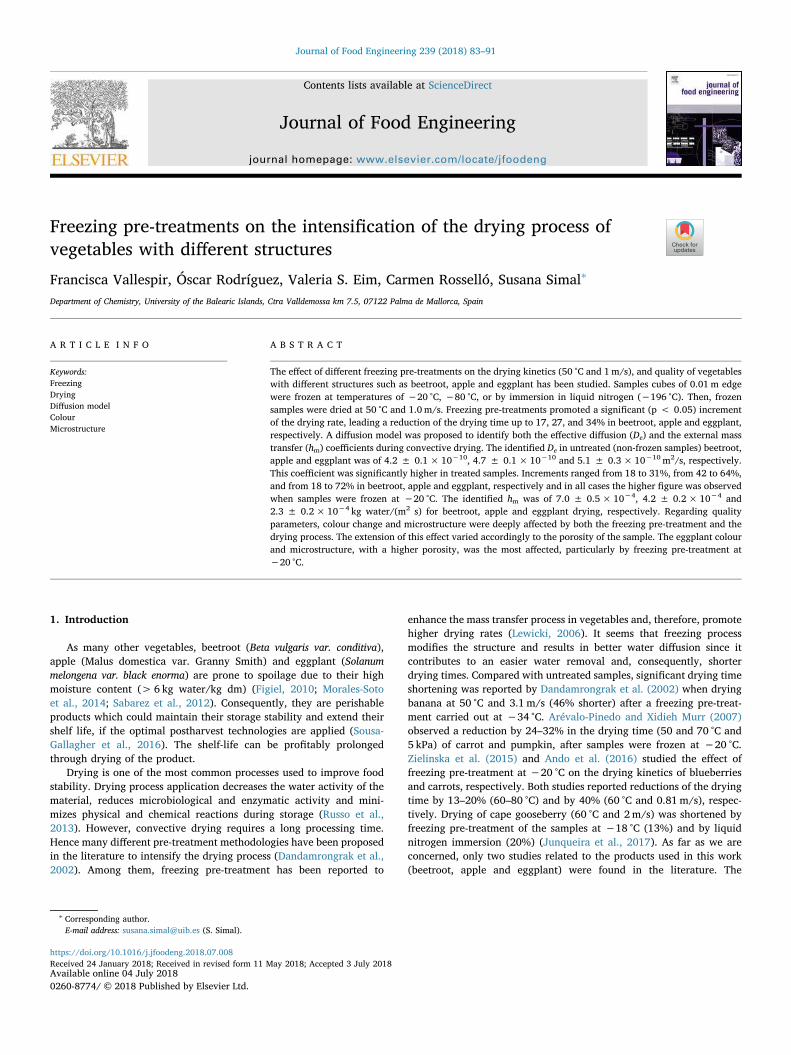
Contents lists available at ScienceDirect
Journal of Food Engineering
journal homepage: www.elsevier.com/locate/jfoodeng
Freezing pre-treatments on the intensification of the drying process ofvegetables with different structures
Francisca Vallespir, Óscar Rodríguez, Valeria S. Eim, Carmen Rosselló, Susana Simal∗
Department of Chemistry, University of the Balearic Islands, Ctra Valldemossa km 7.5, 07122 Palma de Mallorca, Spain
A R T I C L E I N F O
Keywords:FreezingDryingDiffusion modelColourMicrostructure
A B S T R A C T
The effect of different freezing pre-treatments on the drying kinetics (50 °C and 1m/s), and quality of vegetableswith different structures such as beetroot, apple and eggplant has been studied. Samples cubes of 0.01 m edgewere frozen at temperatures of −20 °C, −80 °C, or by immersion in liquid nitrogen (−196 °C). Then, frozensamples were dried at 50 °C and 1.0 m/s. Freezing pre-treatments promoted a significant (p < 0.05) incrementof the drying rate, leading a reduction of the drying time up to 17, 27, and 34% in beetroot, apple and eggplant,respectively. A diffusion model was proposed to identify both the effective diffusion (De) and the external masstransfer (hm) coefficients during convective drying. The identified De in untreated (non-frozen samples) beetroot,apple and eggplant was of 4.2 ± 0.1× 10⁻¹⁰, 4.7 ± 0.1×10⁻¹⁰ and 5.1 ± 0.3×10⁻¹⁰ m2/s, respectively.This coefficient was significantly higher in treated samples. Increments ranged from 18 to 31%, from 42 to 64%,and from 18 to 72% in beetroot, apple and eggplant, respectively and in all cases the higher figure was observedwhen samples were frozen at −20 °C. The identified hm was of 7.0 ± 0.5× 10⁻⁴, 4.2 ± 0.2× 10⁻⁴ and2.3 ± 0.2×10⁻⁴ kg water/(m2 s) for beetroot, apple and eggplant drying, respectively. Regarding qualityparameters, colour change and microstructure were deeply affected by both the freezing pre-treatment and thedrying process. The extension of this effect varied accordingly to the porosity of the sample. The eggplant colourand microstructure, with a higher porosity, was the most affected, particularly by freezing pre-treatment at−20 °C.
1. Introduction
As many other vegetables, beetroot (Beta vulgaris var. conditiva),apple (Malus domestica var. Granny Smith) and eggplant (Solanummelongena var. black enorma) are prone to spoilage due to their highmoisture content (> 6 kg water/kg dm) (Figiel, 2010; Morales-Sotoet al., 2014; Sabarez et al., 2012). Consequently, they are perishableproducts which could maintain their storage stability and extend theirshelf life, if the optimal postharvest technologies are applied (Sousa-Gallagher et al., 2016). The shelf-life can be profitably prolongedthrough drying of the product.
Drying is one of the most common processes used to improve foodstability. Drying process application decreases the water activity of thematerial, reduces microbiological and enzymatic activity and mini-mizes physical and chemical reactions during storage (Russo et al.,2013). However, convective drying requires a long processing time.Hence many different pre-treatment methodologies have been proposedin the literature to intensify the drying process (Dandamrongrak et al.,2002). Among them, freezing pre-treatment has been reported to
enhance the mass transfer process in vegetables and, therefore, promotehigher drying rates (Lewicki, 2006). It seems that freezing processmodifies the structure and results in better water diffusion since itcontributes to an easier water removal and, consequently, shorterdrying times. Compared with untreated samples, significant drying timeshortening was reported by Dandamrongrak et al. (2002) when dryingbanana at 50 °C and 3.1m/s (46% shorter) after a freezing pre-treat-ment carried out at −34 °C. Arévalo-Pinedo and Xidieh Murr (2007)observed a reduction by 24–32% in the drying time (50 and 70 °C and5 kPa) of carrot and pumpkin, after samples were frozen at −20 °C.Zielinska et al. (2015) and Ando et al. (2016) studied the effect offreezing pre-treatment at −20 °C on the drying kinetics of blueberriesand carrots, respectively. Both studies reported reductions of the dryingtime by 13–20% (60–80 °C) and by 40% (60 °C and 0.81m/s), respec-tively. Drying of cape gooseberry (60 °C and 2m/s) was shortened byfreezing pre-treatment of the samples at −18 °C (13%) and by liquidnitrogen immersion (20%) (Junqueira et al., 2017). As far as we areconcerned, only two studies related to the products used in this work(beetroot, apple and eggplant) were found in the literature. The
https://doi.org/10.1016/j.jfoodeng.2018.07.008Received 24 January 2018; Received in revised form 11 May 2018; Accepted 3 July 2018
∗ Corresponding author.E-mail address: [email protected] (S. Simal).
Journal of Food Engineering 239 (2018) 83–91
Available online 04 July 20180260-8774/ © 2018 Published by Elsevier Ltd.
T
87
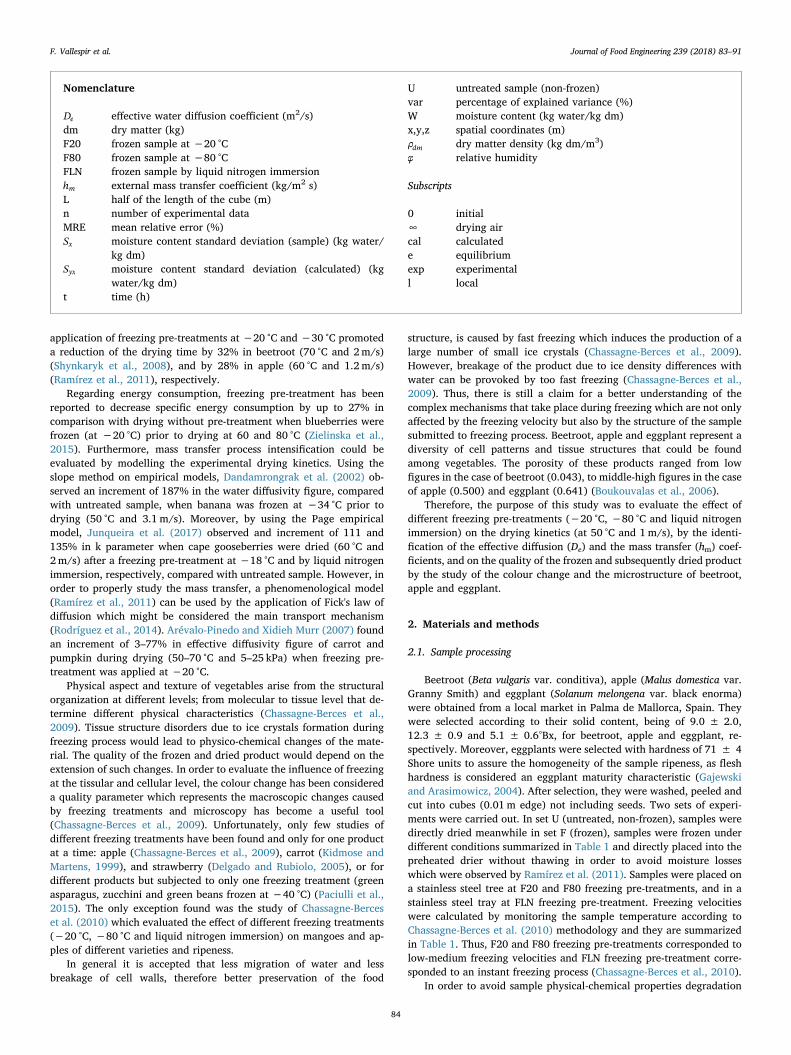
application of freezing pre-treatments at −20 °C and −30 °C promoteda reduction of the drying time by 32% in beetroot (70 °C and 2m/s)(Shynkaryk et al., 2008), and by 28% in apple (60 °C and 1.2 m/s)(Ramírez et al., 2011), respectively.
Regarding energy consumption, freezing pre-treatment has beenreported to decrease specific energy consumption by up to 27% incomparison with drying without pre-treatment when blueberries werefrozen (at −20 °C) prior to drying at 60 and 80 °C (Zielinska et al.,2015). Furthermore, mass transfer process intensification could beevaluated by modelling the experimental drying kinetics. Using theslope method on empirical models, Dandamrongrak et al. (2002) ob-served an increment of 187% in the water diffusivity figure, comparedwith untreated sample, when banana was frozen at −34 °C prior todrying (50 °C and 3.1 m/s). Moreover, by using the Page empiricalmodel, Junqueira et al. (2017) observed and increment of 111 and135% in k parameter when cape gooseberries were dried (60 °C and2m/s) after a freezing pre-treatment at −18 °C and by liquid nitrogenimmersion, respectively, compared with untreated sample. However, inorder to properly study the mass transfer, a phenomenological model(Ramírez et al., 2011) can be used by the application of Fick's law ofdiffusion which might be considered the main transport mechanism(Rodríguez et al., 2014). Arévalo-Pinedo and Xidieh Murr (2007) foundan increment of 3–77% in effective diffusivity figure of carrot andpumpkin during drying (50–70 °C and 5–25 kPa) when freezing pre-treatment was applied at −20 °C.
Physical aspect and texture of vegetables arise from the structuralorganization at different levels; from molecular to tissue level that de-termine different physical characteristics (Chassagne-Berces et al.,2009). Tissue structure disorders due to ice crystals formation duringfreezing process would lead to physico-chemical changes of the mate-rial. The quality of the frozen and dried product would depend on theextension of such changes. In order to evaluate the influence of freezingat the tissular and cellular level, the colour change has been considereda quality parameter which represents the macroscopic changes causedby freezing treatments and microscopy has become a useful tool(Chassagne-Berces et al., 2009). Unfortunately, only few studies ofdifferent freezing treatments have been found and only for one productat a time: apple (Chassagne-Berces et al., 2009), carrot (Kidmose andMartens, 1999), and strawberry (Delgado and Rubiolo, 2005), or fordifferent products but subjected to only one freezing treatment (greenasparagus, zucchini and green beans frozen at −40 °C) (Paciulli et al.,2015). The only exception found was the study of Chassagne-Berceset al. (2010) which evaluated the effect of different freezing treatments(−20 °C, −80 °C and liquid nitrogen immersion) on mangoes and ap-ples of different varieties and ripeness.
In general it is accepted that less migration of water and lessbreakage of cell walls, therefore better preservation of the food
structure, is caused by fast freezing which induces the production of alarge number of small ice crystals (Chassagne-Berces et al., 2009).However, breakage of the product due to ice density differences withwater can be provoked by too fast freezing (Chassagne-Berces et al.,2009). Thus, there is still a claim for a better understanding of thecomplex mechanisms that take place during freezing which are not onlyaffected by the freezing velocity but also by the structure of the samplesubmitted to freezing process. Beetroot, apple and eggplant represent adiversity of cell patterns and tissue structures that could be foundamong vegetables. The porosity of these products ranged from lowfigures in the case of beetroot (0.043), to middle-high figures in the caseof apple (0.500) and eggplant (0.641) (Boukouvalas et al., 2006).
Therefore, the purpose of this study was to evaluate the effect ofdifferent freezing pre-treatments (−20 °C, −80 °C and liquid nitrogenimmersion) on the drying kinetics (at 50 °C and 1m/s), by the identi-fication of the effective diffusion (De) and the mass transfer (hm) coef-ficients, and on the quality of the frozen and subsequently dried productby the study of the colour change and the microstructure of beetroot,apple and eggplant.
2. Materials and methods
2.1. Sample processing
Beetroot (Beta vulgaris var. conditiva), apple (Malus domestica var.Granny Smith) and eggplant (Solanum melongena var. black enorma)were obtained from a local market in Palma de Mallorca, Spain. Theywere selected according to their solid content, being of 9.0 ± 2.0,12.3 ± 0.9 and 5.1 ± 0.6°Bx, for beetroot, apple and eggplant, re-spectively. Moreover, eggplants were selected with hardness of 71 ± 4Shore units to assure the homogeneity of the sample ripeness, as fleshhardness is considered an eggplant maturity characteristic (Gajewskiand Arasimowicz, 2004). After selection, they were washed, peeled andcut into cubes (0.01m edge) not including seeds. Two sets of experi-ments were carried out. In set U (untreated, non-frozen), samples weredirectly dried meanwhile in set F (frozen), samples were frozen underdifferent conditions summarized in Table 1 and directly placed into thepreheated drier without thawing in order to avoid moisture losseswhich were observed by Ramírez et al. (2011). Samples were placed ona stainless steel tree at F20 and F80 freezing pre-treatments, and in astainless steel tray at FLN freezing pre-treatment. Freezing velocitieswere calculated by monitoring the sample temperature according toChassagne-Berces et al. (2010) methodology and they are summarizedin Table 1. Thus, F20 and F80 freezing pre-treatments corresponded tolow-medium freezing velocities and FLN freezing pre-treatment corre-sponded to an instant freezing process (Chassagne-Berces et al., 2010).
In order to avoid sample physical-chemical properties degradation
Nomenclature
De effective water diffusion coefficient (m2/s)dm dry matter (kg)F20 frozen sample at −20 °CF80 frozen sample at −80 °CFLN frozen sample by liquid nitrogen immersionhm external mass transfer coefficient (kg/m2 s)L half of the length of the cube (m)n number of experimental dataMRE mean relative error (%)Sx moisture content standard deviation (sample) (kg water/
kg dm)Syx moisture content standard deviation (calculated) (kg
water/kg dm)t time (h)
U untreated sample (non-frozen)var percentage of explained variance (%)W moisture content (kg water/kg dm)x,y,z spatial coordinates (m)ρdm dry matter density (kg dm/m3)φ relative humidity
Subscripts
0 initial∞ drying aircal calculatede equilibriumexp experimentall local
F. Vallespir et al. Journal of Food Engineering 239 (2018) 83–91
8488
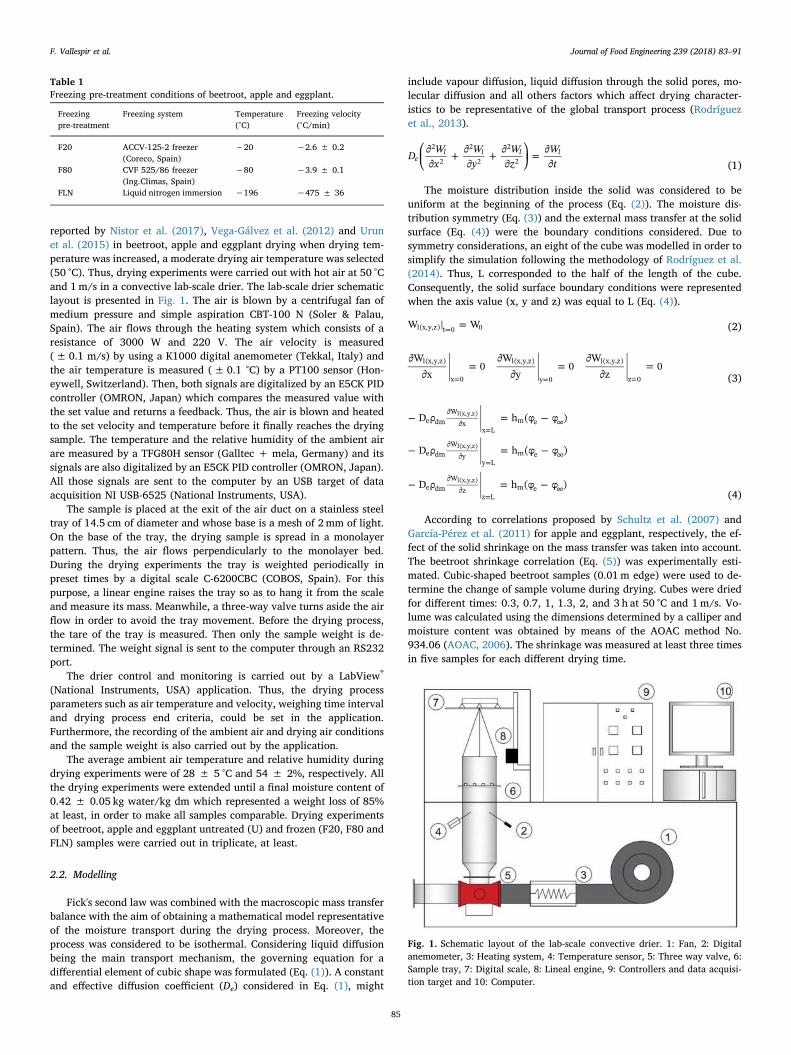
reported by Nistor et al. (2017), Vega-Gálvez et al. (2012) and Urunet al. (2015) in beetroot, apple and eggplant drying when drying tem-perature was increased, a moderate drying air temperature was selected(50 °C). Thus, drying experiments were carried out with hot air at 50 °Cand 1m/s in a convective lab-scale drier. The lab-scale drier schematiclayout is presented in Fig. 1. The air is blown by a centrifugal fan ofmedium pressure and simple aspiration CBT-100 N (Soler & Palau,Spain). The air flows through the heating system which consists of aresistance of 3000 W and 220 V. The air velocity is measured(± 0.1 m/s) by using a K1000 digital anemometer (Tekkal, Italy) andthe air temperature is measured (± 0.1 °C) by a PT100 sensor (Hon-eywell, Switzerland). Then, both signals are digitalized by an E5CK PIDcontroller (OMRON, Japan) which compares the measured value withthe set value and returns a feedback. Thus, the air is blown and heatedto the set velocity and temperature before it finally reaches the dryingsample. The temperature and the relative humidity of the ambient airare measured by a TFG80H sensor (Galltec + mela, Germany) and itssignals are also digitalized by an E5CK PID controller (OMRON, Japan).All those signals are sent to the computer by an USB target of dataacquisition NI USB-6525 (National Instruments, USA).
The sample is placed at the exit of the air duct on a stainless steeltray of 14.5 cm of diameter and whose base is a mesh of 2mm of light.On the base of the tray, the drying sample is spread in a monolayerpattern. Thus, the air flows perpendicularly to the monolayer bed.During the drying experiments the tray is weighted periodically inpreset times by a digital scale C-6200CBC (COBOS, Spain). For thispurpose, a linear engine raises the tray so as to hang it from the scaleand measure its mass. Meanwhile, a three-way valve turns aside the airflow in order to avoid the tray movement. Before the drying process,the tare of the tray is measured. Then only the sample weight is de-termined. The weight signal is sent to the computer through an RS232port.
The drier control and monitoring is carried out by a LabView®
(National Instruments, USA) application. Thus, the drying processparameters such as air temperature and velocity, weighing time intervaland drying process end criteria, could be set in the application.Furthermore, the recording of the ambient air and drying air conditionsand the sample weight is also carried out by the application.
The average ambient air temperature and relative humidity duringdrying experiments were of 28 ± 5 °C and 54 ± 2%, respectively. Allthe drying experiments were extended until a final moisture content of0.42 ± 0.05 kg water/kg dm which represented a weight loss of 85%at least, in order to make all samples comparable. Drying experimentsof beetroot, apple and eggplant untreated (U) and frozen (F20, F80 andFLN) samples were carried out in triplicate, at least.
2.2. Modelling
Fick's second law was combined with the macroscopic mass transferbalance with the aim of obtaining a mathematical model representativeof the moisture transport during the drying process. Moreover, theprocess was considered to be isothermal. Considering liquid diffusionbeing the main transport mechanism, the governing equation for adifferential element of cubic shape was formulated (Eq. (1)). A constantand effective diffusion coefficient (De) considered in Eq. (1), might
include vapour diffusion, liquid diffusion through the solid pores, mo-lecular diffusion and all others factors which affect drying character-istics to be representative of the global transport process (Rodríguezet al., 2013).
⎜ ⎟⎛⎝
∂∂
+ ∂∂
+ ∂∂
⎞⎠= ∂
∂D W
xWy
Wz
Wte
l l l l2
2
2
2
2
2 (1)
The moisture distribution inside the solid was considered to beuniform at the beginning of the process (Eq. (2)). The moisture dis-tribution symmetry (Eq. (3)) and the external mass transfer at the solidsurface (Eq. (4)) were the boundary conditions considered. Due tosymmetry considerations, an eight of the cube was modelled in order tosimplify the simulation following the methodology of Rodríguez et al.(2014). Thus, L corresponded to the half of the length of the cube.Consequently, the solid surface boundary conditions were representedwhen the axis value (x, y and z) was equal to L (Eq. (4)).
==W Wl(x,y,z) t 0 0 (2)
∂∂
=∂
∂=
∂∂
== = =
Wx
0W
y0
Wz
0l(x,y,z)
x 0
l(x,y,z)
y 0
l(x,y,z)
z 0 (3)
− = −
− = −
− = −
∂∂
=∞
∂∂
=∞
∂∂
=∞
D ρ h (φ φ )
D ρ h (φ φ )
D ρ h (φ φ )
e dmW
xx L
m e
e dmW
yy L
m e
e dmW
zz L
m e
l(x,y,z)
l(x,y,z)
l(x,y,z)
(4)
According to correlations proposed by Schultz et al. (2007) andGarcía-Pérez et al. (2011) for apple and eggplant, respectively, the ef-fect of the solid shrinkage on the mass transfer was taken into account.The beetroot shrinkage correlation (Eq. (5)) was experimentally esti-mated. Cubic-shaped beetroot samples (0.01m edge) were used to de-termine the change of sample volume during drying. Cubes were driedfor different times: 0.3, 0.7, 1, 1.3, 2, and 3 h at 50 °C and 1m/s. Vo-lume was calculated using the dimensions determined by a calliper andmoisture content was obtained by means of the AOAC method No.934.06 (AOAC, 2006). The shrinkage was measured at least three timesin five samples for each different drying time.
Table 1Freezing pre-treatment conditions of beetroot, apple and eggplant.
Freezingpre-treatment
Freezing system Temperature(°C)
Freezing velocity(°C/min)
F20 ACCV-125-2 freezer(Coreco, Spain)
−20 −2.6 ± 0.2
F80 CVF 525/86 freezer(Ing.Climas, Spain)
−80 −3.9 ± 0.1
FLN Liquid nitrogen immersion −196 −475 ± 36
Fig. 1. Schematic layout of the lab-scale convective drier. 1: Fan, 2: Digitalanemometer, 3: Heating system, 4: Temperature sensor, 5: Three way valve, 6:Sample tray, 7: Digital scale, 8: Lineal engine, 9: Controllers and data acquisi-tion target and 10: Computer.
F. Vallespir et al. Journal of Food Engineering 239 (2018) 83–91
8589

= + =VV
WW
R0.093 0.964 0.970 0
2(5)
Besides, the GAB sorption isotherms models reported by Iglesias andChirife (1982), Vega-Gálvez et al. (2008) and García-Pérez et al. (2011)for beetroot (Wm=0.092 kg/kg dm, C=1.56 and K=0.99), apple(Wm=0.180 kg/kg dm, C=8.90 and K=0.89) and eggplant(Wm=0.093 kg/kg dm, C=3.01 and K=0.99), respectively, wereconsidered together with the psychometric data in order to completethe model. The drying air temperature and the relative humidity andtemperature of the ambient air during drying were taken into accountto estimate the relative humidity of the drying air (φ∞) and relativehumidity of the equilibrium (φe) values which were related to the ex-ternal mass flux.
COMSOL Multiphysics® 3.4 (COMSOL, Inc., Sweden) software wasused to solve the differential equation (Eq. (1)) applying the finiteelement method. A mesh of 7× 7×7 parallelepiped elements withsizes decreasing exponentially towards boundary surfaces was selectedas the best option in terms of calculation time and convergence preci-sion (degrees of freedom 3375). The effective diffusion De, and the masstransfer hm coefficients were simultaneously identified by using the“fminsearch” function of the Optimization Toolbox of Matlab 2014a®
(The Mathworks, Inc., USA) software. The “fminsearch” function wasused to minimize the objective function which was the mean relativeerror (MRE) presented in Eq. (6). The mean relative error was calcu-lated between the experimental and the calculated curves obtainedfrom the drier and from the model solution, respectively. Thus, theidentified De and hm coefficients corresponded to the better valuesfound which reduce the mean relative error.
∑=−
=
MREn
W WW
100
i
nexp cal
exp1
i i
i (6)
2.3. Colour measurement
Colour of raw, frozen and dried beetroot, apple and eggplant cubeswas measured directly on the surface of the samples. The CIElab colourspace was used to estimate the colour values of beetroot samples. Thecoordinates were L* (whiteness or brightness/darkness), a* (redness/greenness) and b* (yellowness/blueness). The measurements of eachtriplicate sample were carried out twice with a CM-5 colorimeter(Konica Minolta, Japan) with a D65 illuminant and 2° observer (Urunet al., 2015). The total colour change (ΔE) was calculated comparedwith the untreated sample before drying (Eq. (7)).
= + +Δ Δ Δ ΔE L a b*2 *2 *2 (7)
2.4. Microstructure analysis
Microstructure of untreated, frozen and dried samples was observedby scanning electron microscopy (SEM). Beetroot, apple and eggplantcubes were lyophilized to remove the remained moisture (if needed)and soaked in liquid nitrogen before observation in a scanning electronmicroscope HITACHI S-3400N (Krefeld, Germany) accelerated at 15 kVand under vacuum pressure of 40 Pa, in order to be self-fractured. Siximages of each sample were taken in the microstructure analysis.
2.5. Statistical analyses
Data were averaged from replicates and reported as average va-lues ± standard deviations. Means of the drying time, the identifiedeffective diffusion coefficient (De) and total colour change were com-pared by using the Tukey's test at p < 0.05.
The percentage of explained variance (Eq. (8)) was additionallyused to evaluate the accuracy of the obtained simulation.
= ⎡⎣⎢
− ⎤⎦⎥×var
SS
1 100xy
y (8)
3. Results and discussion
3.1. Drying kinetics
The initial average moisture content (W0) of beetroot, apple andeggplant obtained by means of the AOAC method No. 934.06 (AOAC,2006) was of 9.8 ± 0.6, 6.1 ± 0.3 and 10.8 ± 0.8 kg water/kg dm,respectively. These figures were similar to those reported in the lit-erature (Figiel, 2010; Morales-Soto et al., 2014; Sabarez et al., 2012) forfresh beetroot (10.2 kg/kg dm), apple (6.1 kg/kg dm) and eggplant(10.1–13.3 kg/kg dm). Freezing pre-treatments did not promote sig-nificant changes (p > 0.05) regarding the initial moisture content.
Fig. 2. Drying curves of untreated (U) and pre-frozen (F20, F80 and FLN)beetroot (a), apple (b) and eggplant (c) cubes (50 °C and 1m/s). Averagevalue ± standard deviation.
F. Vallespir et al. Journal of Food Engineering 239 (2018) 83–91
8690
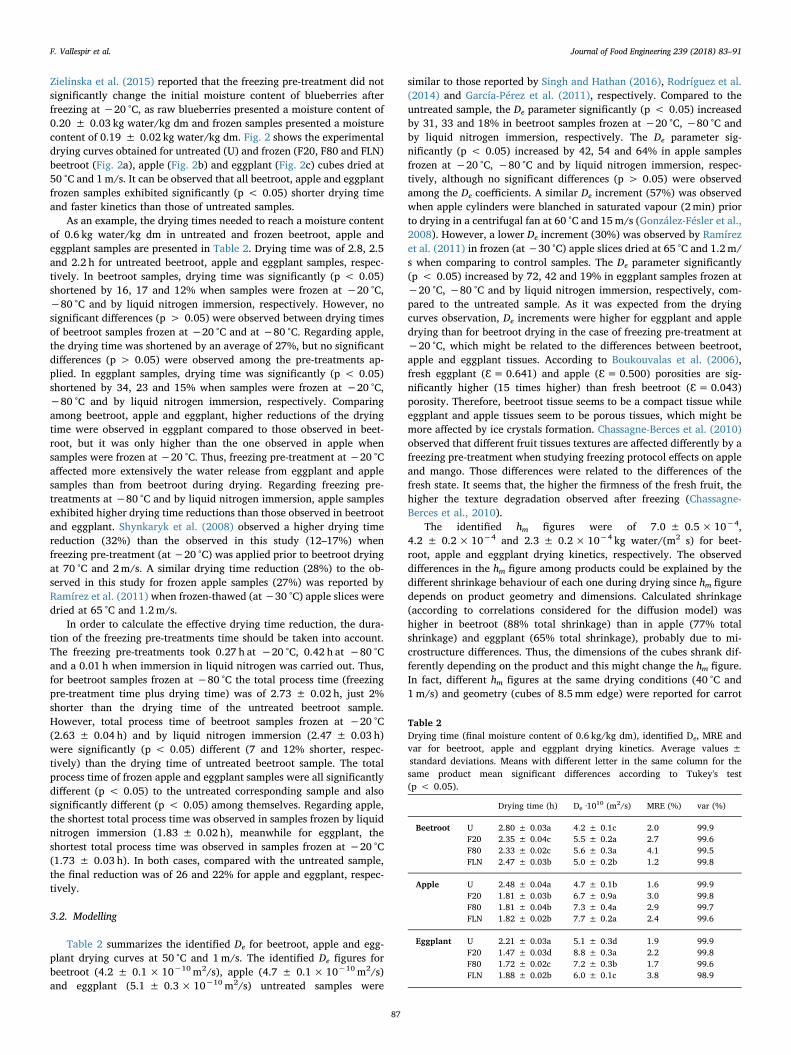
Zielinska et al. (2015) reported that the freezing pre-treatment did notsignificantly change the initial moisture content of blueberries afterfreezing at −20 °C, as raw blueberries presented a moisture content of0.20 ± 0.03 kg water/kg dm and frozen samples presented a moisturecontent of 0.19 ± 0.02 kg water/kg dm. Fig. 2 shows the experimentaldrying curves obtained for untreated (U) and frozen (F20, F80 and FLN)beetroot (Fig. 2a), apple (Fig. 2b) and eggplant (Fig. 2c) cubes dried at50 °C and 1m/s. It can be observed that all beetroot, apple and eggplantfrozen samples exhibited significantly (p < 0.05) shorter drying timeand faster kinetics than those of untreated samples.
As an example, the drying times needed to reach a moisture contentof 0.6 kg water/kg dm in untreated and frozen beetroot, apple andeggplant samples are presented in Table 2. Drying time was of 2.8, 2.5and 2.2 h for untreated beetroot, apple and eggplant samples, respec-tively. In beetroot samples, drying time was significantly (p < 0.05)shortened by 16, 17 and 12% when samples were frozen at −20 °C,−80 °C and by liquid nitrogen immersion, respectively. However, nosignificant differences (p > 0.05) were observed between drying timesof beetroot samples frozen at −20 °C and at −80 °C. Regarding apple,the drying time was shortened by an average of 27%, but no significantdifferences (p > 0.05) were observed among the pre-treatments ap-plied. In eggplant samples, drying time was significantly (p < 0.05)shortened by 34, 23 and 15% when samples were frozen at −20 °C,−80 °C and by liquid nitrogen immersion, respectively. Comparingamong beetroot, apple and eggplant, higher reductions of the dryingtime were observed in eggplant compared to those observed in beet-root, but it was only higher than the one observed in apple whensamples were frozen at −20 °C. Thus, freezing pre-treatment at −20 °Caffected more extensively the water release from eggplant and applesamples than from beetroot during drying. Regarding freezing pre-treatments at −80 °C and by liquid nitrogen immersion, apple samplesexhibited higher drying time reductions than those observed in beetrootand eggplant. Shynkaryk et al. (2008) observed a higher drying timereduction (32%) than the observed in this study (12–17%) whenfreezing pre-treatment (at −20 °C) was applied prior to beetroot dryingat 70 °C and 2m/s. A similar drying time reduction (28%) to the ob-served in this study for frozen apple samples (27%) was reported byRamírez et al. (2011) when frozen-thawed (at−30 °C) apple slices weredried at 65 °C and 1.2m/s.
In order to calculate the effective drying time reduction, the dura-tion of the freezing pre-treatments time should be taken into account.The freezing pre-treatments took 0.27 h at −20 °C, 0.42 h at −80 °Cand a 0.01 h when immersion in liquid nitrogen was carried out. Thus,for beetroot samples frozen at −80 °C the total process time (freezingpre-treatment time plus drying time) was of 2.73 ± 0.02 h, just 2%shorter than the drying time of the untreated beetroot sample.However, total process time of beetroot samples frozen at −20 °C(2.63 ± 0.04 h) and by liquid nitrogen immersion (2.47 ± 0.03 h)were significantly (p < 0.05) different (7 and 12% shorter, respec-tively) than the drying time of untreated beetroot sample. The totalprocess time of frozen apple and eggplant samples were all significantlydifferent (p < 0.05) to the untreated corresponding sample and alsosignificantly different (p < 0.05) among themselves. Regarding apple,the shortest total process time was observed in samples frozen by liquidnitrogen immersion (1.83 ± 0.02 h), meanwhile for eggplant, theshortest total process time was observed in samples frozen at −20 °C(1.73 ± 0.03 h). In both cases, compared with the untreated sample,the final reduction was of 26 and 22% for apple and eggplant, respec-tively.
3.2. Modelling
Table 2 summarizes the identified De for beetroot, apple and egg-plant drying curves at 50 °C and 1m/s. The identified De figures forbeetroot (4.2 ± 0.1×10⁻¹⁰ m2/s), apple (4.7 ± 0.1× 10⁻¹⁰ m2/s)and eggplant (5.1 ± 0.3×10⁻¹⁰ m2/s) untreated samples were
similar to those reported by Singh and Hathan (2016), Rodríguez et al.(2014) and García-Pérez et al. (2011), respectively. Compared to theuntreated sample, the De parameter significantly (p < 0.05) increasedby 31, 33 and 18% in beetroot samples frozen at −20 °C, −80 °C andby liquid nitrogen immersion, respectively. The De parameter sig-nificantly (p < 0.05) increased by 42, 54 and 64% in apple samplesfrozen at −20 °C, −80 °C and by liquid nitrogen immersion, respec-tively, although no significant differences (p > 0.05) were observedamong the De coefficients. A similar De increment (57%) was observedwhen apple cylinders were blanched in saturated vapour (2min) priorto drying in a centrifugal fan at 60 °C and 15m/s (González-Fésler et al.,2008). However, a lower De increment (30%) was observed by Ramírezet al. (2011) in frozen (at −30 °C) apple slices dried at 65 °C and 1.2m/s when comparing to control samples. The De parameter significantly(p < 0.05) increased by 72, 42 and 19% in eggplant samples frozen at−20 °C, −80 °C and by liquid nitrogen immersion, respectively, com-pared to the untreated sample. As it was expected from the dryingcurves observation, De increments were higher for eggplant and appledrying than for beetroot drying in the case of freezing pre-treatment at−20 °C, which might be related to the differences between beetroot,apple and eggplant tissues. According to Boukouvalas et al. (2006),fresh eggplant (Ɛ=0.641) and apple (Ɛ=0.500) porosities are sig-nificantly higher (15 times higher) than fresh beetroot (Ɛ=0.043)porosity. Therefore, beetroot tissue seems to be a compact tissue whileeggplant and apple tissues seem to be porous tissues, which might bemore affected by ice crystals formation. Chassagne-Berces et al. (2010)observed that different fruit tissues textures are affected differently by afreezing pre-treatment when studying freezing protocol effects on appleand mango. Those differences were related to the differences of thefresh state. It seems that, the higher the firmness of the fresh fruit, thehigher the texture degradation observed after freezing (Chassagne-Berces et al., 2010).
The identified hm figures were of 7.0 ± 0.5×10−4,4.2 ± 0.2×10⁻⁴ and 2.3 ± 0.2×10⁻⁴ kg water/(m2 s) for beet-root, apple and eggplant drying kinetics, respectively. The observeddifferences in the hm figure among products could be explained by thedifferent shrinkage behaviour of each one during drying since hm figuredepends on product geometry and dimensions. Calculated shrinkage(according to correlations considered for the diffusion model) washigher in beetroot (88% total shrinkage) than in apple (77% totalshrinkage) and eggplant (65% total shrinkage), probably due to mi-crostructure differences. Thus, the dimensions of the cubes shrank dif-ferently depending on the product and this might change the hm figure.In fact, different hm figures at the same drying conditions (40 °C and1m/s) and geometry (cubes of 8.5mm edge) were reported for carrot
Table 2Drying time (final moisture content of 0.6 kg/kg dm), identified De, MRE andvar for beetroot, apple and eggplant drying kinetics. Average values ±standard deviations. Means with different letter in the same column for thesame product mean significant differences according to Tukey's test(p < 0.05).
Drying time (h) De ·1010 (m2/s) MRE (%) var (%)
Beetroot U 2.80 ± 0.03a 4.2 ± 0.1c 2.0 99.9F20 2.35 ± 0.04c 5.5 ± 0.2a 2.7 99.6F80 2.33 ± 0.02c 5.6 ± 0.3a 4.1 99.5FLN 2.47 ± 0.03b 5.0 ± 0.2b 1.2 99.8
Apple U 2.48 ± 0.04a 4.7 ± 0.1b 1.6 99.9F20 1.81 ± 0.03b 6.7 ± 0.9a 3.0 99.8F80 1.81 ± 0.04b 7.3 ± 0.4a 2.9 99.7FLN 1.82 ± 0.02b 7.7 ± 0.2a 2.4 99.6
Eggplant U 2.21 ± 0.03a 5.1 ± 0.3d 1.9 99.9F20 1.47 ± 0.03d 8.8 ± 0.3a 2.2 99.8F80 1.72 ± 0.02c 7.2 ± 0.3b 1.7 99.6FLN 1.88 ± 0.02b 6.0 ± 0.1c 3.8 98.9
F. Vallespir et al. Journal of Food Engineering 239 (2018) 83–91
8791

(4.13 ± 0.21×10⁻⁴ kg water/(m2 s)) and potato(2.03 ± 0.36×10⁻⁴ kg water/(m2 s)), probably due to differentshrinkage behaviour (García-Pérez et al., 2006; Ozuna et al., 2011).
By using the identified De and hm figures, the drying curves weresimulated. Fig. 3 shows the experimental vs predicted average moisturecontents attained for untreated (U) and frozen (F20, F80 and FLN)beetroot (Fig. 3a), apple (Fig. 3b) and eggplant (Fig. 3c) cubes at 50 °Cand 1m/s. This figure also shows the regression analysis and the pre-diction bounds at a 95% confidence. Good agreement between bothgroups of data (predicted and experimental) was obtained for allbeetroot, apple and eggplant drying experiments, as it can be seen inFig. 3. The goodness of the simulation was corroborated by the re-gression analysis. The coefficient of determination, which describes thegood correlation of the predicted concentrations with their experi-mental values, was in all cases higher than 0.99 and the y-intercept andthe slope figures were close to zero and to unity, respectively.
The mean relative error (Eq. (6)) and the percentage of explainedvariance (Eq. (8)) were calculated for each experiment to mathemati-cally evaluate the simulation and the results are also shown in Table 2.MRE was lower than 5% (average MRE of 2.6 ± 0.9%) and var washigher than 98.8% for the simulation of all experiments as it can be seenin this table. It could be concluded from Fig. 3 and Table 2 that thedrying curves of raw and frozen beetroot, apple and eggplant cubeswere satisfactory simulated by using the proposed model.
3.3. Colour measurements
CIElab colour parameters for untreated beetroot were ofL* = 21.4 ± 1.7, a* = 19.4 ± 2.3 and b* = 6.6 ± 1.2 which werein the range of those reported by Fijalkowska et al. (2015) for rawbeetroot (L* = 20.3 ± 0.7, a* = 21.0 ± 3.3 and b* = 5.6 ± 1.2).For untreated apple, CIElab colour parameters were ofL* = 75.3 ± 2.2, a* = −2.8 ± 0.6 and b* = 22.1 ± 1.0, close tothose reported by Chassagne-Berces et al. (2010) (L* = 80 ± 1.0,a* =−3 ± 2 and b* = 17.5 ± 1.5) for ripe and unripe Granny Smithfresh apples. For untreated eggplant, CIElab colour parameters were ofL* = 84.6 ± 1.1, a* = −1.4 ± 0.3 and b* = 22.5 ± 1.8, similar tofresh eggplant reported values by Maestrelli et al. (2003)(L* = 78.4 ± 5.1, a* = −5.4 ± 3.1 and b* = 24.6 ± 4.3).
Table 3 shows the ΔE figures for untreated and frozen samples ofbeetroot, apple and eggplant before and after drying, with respect to thecorresponding untreated sample before drying (raw sample). It isworthy to point out that ΔE values higher than 2.3 might lead to no-ticeable differences in the visual perception of consumers (Sharma andBala, 2002). Therefore, in this study all samples exhibited noticeablecolour changes after the freezing pre-treatments and even more afterdrying process.
Frozen samples of each product exhibited the significantly lowest(p < 0.05) colour change figures when they were frozen by liquid ni-trogen immersion (FLN samples) except for the apple frozen sampleswhich presented the lowest colour change figure when they were frozenat −20 °C. Comparing among beetroot, apple and eggplant, the lowercolour change figures were observed in apple frozen samples.Chassagne-Berces et al. (2010) observed significantly higher colourchange values (32.5 ± 2.5) after apple freezing at −20 °C, −80 °C andby liquid nitrogen immersion probably due to thawing process at 4 °Covernight which lead to enzymatic reactions.
Drying of untreated eggplant and apple samples promoted slightcolour changes (4.3 ± 0.4 and 9.2 ± 0.1, respectively). Higher colourchange figures (12.5 ± 2.1–14.9 ± 1.4) have been reported by Urunet al. (2015) when eggplant slices were convectively dried at 40, 50 and60 °C and 5m/s, indicating that the higher air velocity, the highereggplant colour browning; and also higher colour change figures(18.7 ± 0.1–37.2 ± 0.1) have been observed, when apple slabs wereconvectively dried at 40, 60 and 80 °C and 0.5, 1.0 and 1.5m/s in-dicating that the higher temperature, the lower apple colour change
(Vega-Gálvez et al., 2012). However, colour change for untreatedbeetroot samples after drying (26.3 ± 1.4) was higher than those forapple and eggplant, which could be related to the degradation ofbeetroot coloured biocompounds during drying. Similar colour changevalue (ΔE of 30.0 ± 6.6) was reported by Behrouzifar and Shahidy(2016) when beetroot slices were dried at 50 °C and different fan ve-locities: 700, 600 and 500 cycle/min.
Significant differences (p < 0.05) were observed between ΔE fig-ures of untreated and frozen samples after drying. Thus, the freezingtreatment prior to drying significantly affected (p < 0.05) the colour ofbeetroot, apple and eggplant. In fact, dried eggplant and apple colourseem to be highly affected by the freezing pre-treatment due to the
Fig. 3. Predicted vs. experimental average moisture content. Drying experi-ments carried out with untreated (U) and pre-frozen (F20, F80 and FLN)beetroot (a), apple (b) and eggplant (c) cubes (50 °C and 1m/s).
F. Vallespir et al. Journal of Food Engineering 239 (2018) 83–91
8892

difference between untreated and frozen samples was between 15 and22 units, respectively, meanwhile in beetroot, this change was only of2–4 units. According to Junqueira et al. (2017), cape gooseberries whenfreezing pre-treatment (at −18 °C and by liquid nitrogen immersion)was applied presented higher ΔE after drying (60 °C and 2m/s) thanuntreated samples.
3.4. Microstructure analysis
The effect of freezing treatment prior to drying on the micro-structure of beetroot, apple and eggplant has been studied by means ofscanning electron microscope. Figs. 4 and 5 show the scanning electronmicrographs of untreated (U) and frozen samples (F20, F80 and FLN) ofbeetroot, apple and eggplant before (Fig. 4) and after drying (Fig. 5)(50 °C and 1m/s). The most representative photo of each sample hasbeen selected. The untreated (U) beetroot, apple and eggplant samplesbefore drying, presented in the first row of Fig. 4, presented few in-tercellular spaces between typical isodiametrical and polyhedral cells ashas been reported previously for each product by Nayak et al. (2007),Russo et al. (2013) and Huang et al. (2012), respectively.
Frozen beetroot, apple and eggplant samples (F20, F80 and FLN)micrographs were also presented in Fig. 4 (following rows). Cell wallsdisruptions and tissue fissures can be observed in the micrographs as aconsequence of freezing treatment. The freezing treatment effects onmicrostructure depend on the freezing velocity as it has been reportedin apple freezing at −20 °C, −80 °C and by liquid nitrogen immersion(Chassagne-Berces et al., 2009, 2010). According to this studies(Chassagne-Berces et al., 2009, 2010) fast freezing (by liquid nitrogenimmersion) left an important fraction of unfrozen water and inducedthe formation of a large number of small ice crystals, while slowfreezing (at −20 °C and −80 °C) led to fewer ice crystals but of largersize. In fact, frozen beetroot, apple and eggplant samples by liquid ni-trogen immersion (FLN) presented slight differences to untreatedsamples, particularly beetroot frozen sample FLN, while frozen samples
Table 3Total colour change (ΔE) of untreated (U) and frozen (F20, F80 and FLN)beetroot, apple and eggplant cubes before and after drying. Average va-lues ± standard deviations. Means with different letter for the same productmean significant differences according to Tukey's test (p < 0.05).
ΔEBefore drying
ΔEAfter drying
Beetroot U 26.3 ± 1.4bF20 13.1 ± 1.4d 29.8 ± 0.5aF80 18.7 ± 0.8c 30.0 ± 0.1aFLN 5.5 ± 0.4e 28.5 ± 0.4a
Apple U 9.2 ± 0.1dF20 2.8 ± 0.2f 25.6 ± 0.1bF80 4.9 ± 0.8e 27.6 ± 0.2aFLN 5.0 ± 0.5e 24.5 ± 0.2c
Eggplant U 4.3 ± 0.4fF20 16.4 ± 1.3c 26.3 ± 0.1aF80 14.1 ± 1.4d 22.3 ± 0.8bFLN 12.1 ± 0.7e 25.9 ± 0.1a
Fig. 4. Scanning electron micrographs of untreated (U) and frozen samples (F20, F80 and FLN) of beetroot, apple and eggplant before drying. ic= isodiametricalcells, d= disruptions, f = fissures.
F. Vallespir et al. Journal of Food Engineering 239 (2018) 83–91
8993
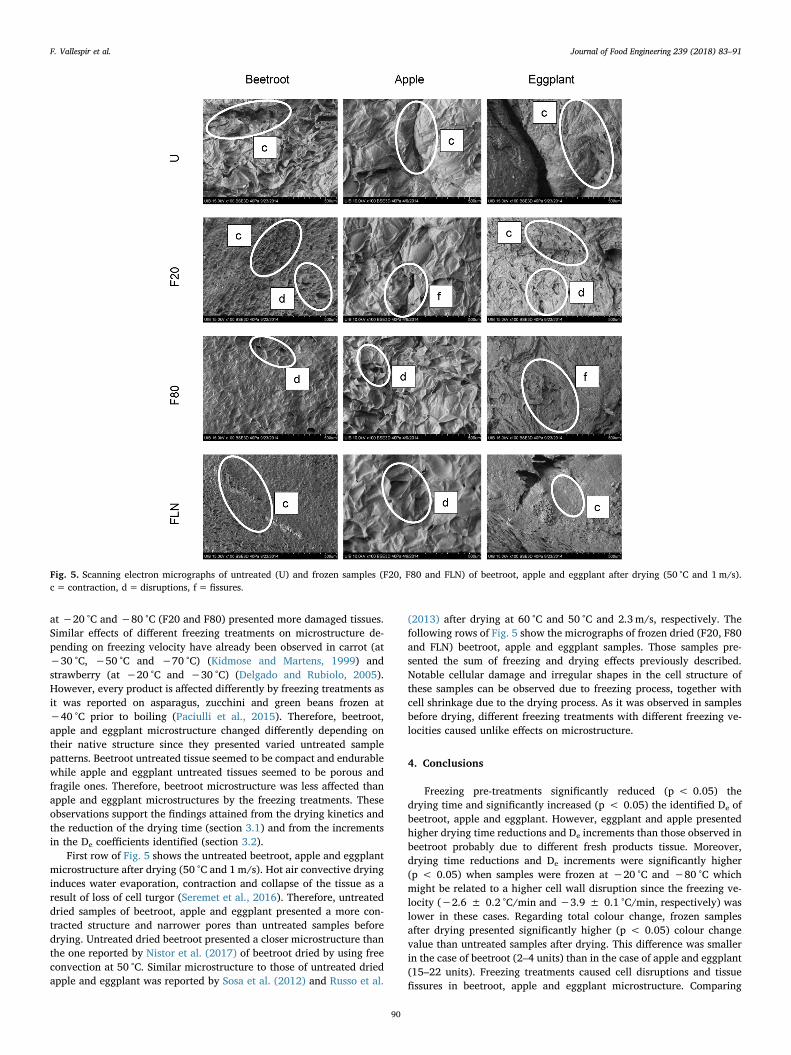
at −20 °C and −80 °C (F20 and F80) presented more damaged tissues.Similar effects of different freezing treatments on microstructure de-pending on freezing velocity have already been observed in carrot (at−30 °C, −50 °C and −70 °C) (Kidmose and Martens, 1999) andstrawberry (at −20 °C and −30 °C) (Delgado and Rubiolo, 2005).However, every product is affected differently by freezing treatments asit was reported on asparagus, zucchini and green beans frozen at−40 °C prior to boiling (Paciulli et al., 2015). Therefore, beetroot,apple and eggplant microstructure changed differently depending ontheir native structure since they presented varied untreated samplepatterns. Beetroot untreated tissue seemed to be compact and endurablewhile apple and eggplant untreated tissues seemed to be porous andfragile ones. Therefore, beetroot microstructure was less affected thanapple and eggplant microstructures by the freezing treatments. Theseobservations support the findings attained from the drying kinetics andthe reduction of the drying time (section 3.1) and from the incrementsin the De coefficients identified (section 3.2).
First row of Fig. 5 shows the untreated beetroot, apple and eggplantmicrostructure after drying (50 °C and 1m/s). Hot air convective dryinginduces water evaporation, contraction and collapse of the tissue as aresult of loss of cell turgor (Seremet et al., 2016). Therefore, untreateddried samples of beetroot, apple and eggplant presented a more con-tracted structure and narrower pores than untreated samples beforedrying. Untreated dried beetroot presented a closer microstructure thanthe one reported by Nistor et al. (2017) of beetroot dried by using freeconvection at 50 °C. Similar microstructure to those of untreated driedapple and eggplant was reported by Sosa et al. (2012) and Russo et al.
(2013) after drying at 60 °C and 50 °C and 2.3m/s, respectively. Thefollowing rows of Fig. 5 show the micrographs of frozen dried (F20, F80and FLN) beetroot, apple and eggplant samples. Those samples pre-sented the sum of freezing and drying effects previously described.Notable cellular damage and irregular shapes in the cell structure ofthese samples can be observed due to freezing process, together withcell shrinkage due to the drying process. As it was observed in samplesbefore drying, different freezing treatments with different freezing ve-locities caused unlike effects on microstructure.
4. Conclusions
Freezing pre-treatments significantly reduced (p < 0.05) thedrying time and significantly increased (p < 0.05) the identified De ofbeetroot, apple and eggplant. However, eggplant and apple presentedhigher drying time reductions and De increments than those observed inbeetroot probably due to different fresh products tissue. Moreover,drying time reductions and De increments were significantly higher(p < 0.05) when samples were frozen at −20 °C and −80 °C whichmight be related to a higher cell wall disruption since the freezing ve-locity (−2.6 ± 0.2 °C/min and −3.9 ± 0.1 °C/min, respectively) waslower in these cases. Regarding total colour change, frozen samplesafter drying presented significantly higher (p < 0.05) colour changevalue than untreated samples after drying. This difference was smallerin the case of beetroot (2–4 units) than in the case of apple and eggplant(15–22 units). Freezing treatments caused cell disruptions and tissuefissures in beetroot, apple and eggplant microstructure. Comparing
Fig. 5. Scanning electron micrographs of untreated (U) and frozen samples (F20, F80 and FLN) of beetroot, apple and eggplant after drying (50 °C and 1m/s).c= contraction, d= disruptions, f= fissures.
F. Vallespir et al. Journal of Food Engineering 239 (2018) 83–91
9094
between different freezing treatments, the lower the freezing velocitythe larger the ice crystals and the more significant damage observed.Moreover, every product was affected differently by the freezing pre-treatments depending on their fresh tissue which is very differentamong them. After drying, contraction and collapse was observed inuntreated and frozen beetroot, apple and eggplant samples. Frozensamples after drying presented a sum of freezing and drying effects.
Acknowledgements
The authors would like to acknowledge the INIA and FOGAIBA forthe financial support (RTA2015-00060-C04-03, RTA2015-00060-C04-02 and AIA01/15 projects) and the Spanish Government (MINECO) forthe BES-2013-064131 fellowship.
References
Ando, Y., Maeda, Y., Mizutani, K., Wakatsuki, N., Hagiwara, S., Nabetani, H., 2016.Impact of blanching and freeze-thaw pretreatment on drying rate of carrot roots inrelation to changes in cell membrane function and cell wall structure. LWT - Food Sci.Technol. 71, 40–46.
AOAC, 2006. Moisture in Dried Fruits, sixteenth ed. Association of AnalyticalCommunities, Maryland.
Arévalo-Pinedo, A., Xidieh Murr, F.E., 2007. Influence of pre-treatments on the dryingkinetics during vacuum drying of carrot and pumpkin. J. Food Eng. 80 (1), 152–156.
Behrouzifar, F., Shahidy, S.A., 2016. Evaluation of beetroot changes during drying withhot air by digital images. J. Fund. Appl. Sci. 8 (4S), 11.
Boukouvalas, C.J., Krokida, M., Maroulis, Z., Marinos-Kouris, D., 2006. Density andporosity: literature data compilation for foodstuffs. Int. J. Food Prop. 9 (4), 715–746.
Chassagne-Berces, S., Fonseca, F., Citeau, M., Marin, M., 2010. Freezing protocol effect onquality properties of fruit tissue according to the fruit, the variety and the stage ofmaturity. LWT - Food Sci. Technol. 43 (9), 1441–1449.
Chassagne-Berces, S., Poirier, C., Devaux, M.-F., Fonseca, F., Lahaye, M., Pigorini, G.,Girault, C., Marin, M., Guillon, F., 2009. Changes in texture, cellular structure andcell wall composition in apple tissue as a result of freezing. Food Res. Int. 42 (7),788–797.
Dandamrongrak, R., Young, G., Mason, R., 2002. Evaluation of various pre-treatments forthe dehydration of banana and selection of suitable drying models. J. Food Eng. 55(2), 139–146.
Delgado, A.E., Rubiolo, A.C., 2005. Microstructural changes in strawberry after freezingand thawing processes. LWT - Food Sci. Technol. 38 (2), 135–142.
Figiel, A., 2010. Drying kinetics and quality of beetroots dehydrated by combination ofconvective and vacuum-microwave methods. J. Food Eng. 98 (4), 461–470.
Fijalkowska, A., Nowacka, M., Witrowa-rajchert, D., 2015. Effect of ultrasound waves ondrying process and selected properties of beetroot tissue. Food Sci. Technol. Qual. 2(99), 138–149.
Gajewski, M., Arasimowicz, D., 2004. Sensory quality of eggplant fruits (Solanum mel-ongena L.) as affected by cultivar and maturity stage. Pol. J. Food Nutr. Sci. 3(13/54).
García-Pérez, J.V., Ozuna, C., Ortuño, C., Cárcel, J.A., Mulet, A., 2011. Modeling ultra-sonically assisted convective drying of eggplant. Dry. Technol. 29 (13), 1499–1509.
García-Pérez, J.V., Rosselló, C., Cárcel, J., De la Fuente, S., Mulet, A., 2006. Effect of airtemperature on convective drying assisted by high power ultrasound. In: Defect andDiffusion Forum. Trans Tech Publ, pp. 563–574.
González-Fésler, M., Salvatori, D., Gómez, P., Alzamora, S.M., 2008. Convective airdrying of apples as affected by blanching and calcium impregnation. J. Food Eng. 87(3), 323–332.
Huang, L.-l., Zhang, M., Wang, L.-p., Mujumdar, A.S., Sun, D.-f., 2012. Influence ofcombination drying methods on composition, texture, aroma and microstructure ofapple slices. LWT - Food Sci. Technol. 47 (1), 183–188.
Iglesias, H.A., Chirife, J., 1982. Handbook of Food Isotherms: Water Sorption Parametersfor Food and Food Components. Academic Press, New York.
Junqueira, J.R.d.J., Corrêa, J.L.G., de Oliveira, H.M., Ivo Soares Avelar, R., Salles Pio,L.A., 2017. Convective drying of cape gooseberry fruits: effect of pretreatments onkinetics and quality parameters. LWT - Food Sci. Technol. 82 (Suppl. C), 404–410.
Kidmose, U., Martens, H.J., 1999. Changes in texture, microstructure and nutritionalquality of carrot slices during blanching and freezing. J. Sci. Food Agric. 79 (12),1747–1753.
Lewicki, P.P., 2006. Design of hot air drying for better foods. Trends Food Sci. Technol. 17(4), 153–163.
Maestrelli, A., Lo Scalzo, R., Rotino, G.L., Acciarri, N., Spena, A., Vitelli, G., Bertolo, G.,2003. Freezing effect on some quality parameters of transgenic parthenocarpic egg-plants. J. Food Eng. 56 (2–3), 285–287.
Morales-Soto, A., García-Salas, P., Rodríguez-Pérez, C., Jiménez-Sánchez, C., Cádiz-Gurrea, M.d.l.L., Segura-Carretero, A., Fernández-Gutiérrez, A., 2014. Antioxidantcapacity of 44 cultivars of fruits and vegetables grown in Andalusia (Spain). FoodRes. Int. 58, 35–46.
Nayak, C.A., Suguna, K., Narasimhamurthy, K., Rastogi, N.K., 2007. Effect of gammairradiation on histological and textural properties of carrot, potato and beetroot. J.Food Eng. 79 (3), 765–770.
Nistor, O.-V., Seremet, L., Andronoiu, D.G., Rudi, L., Botez, E., 2017. Influence of differentdrying methods on the physicochemical properties of red beetroot (Beta vulgaris L.var. Cylindra). Food Chem. 236, 59–67.
Ozuna, C., Cárcel, J.A., García-Pérez, J.V., Mulet, A., 2011. Improvement of watertransport mechanisms during potato drying by applying ultrasound. J. Sci. FoodAgric. 91 (14), 2511–2517.
Paciulli, M., Ganino, T., Pellegrini, N., Rinaldi, M., Zaupa, M., Fabbri, A., Chiavaro, E.,2015. Impact of the industrial freezing process on selected vegetables — Part I.Structure, texture and antioxidant capacity. Food Res. Int. 74, 329–337.
Ramírez, C., Troncoso, E., Muñoz, J., Aguilera, J.M., 2011. Microstructure analysis onpre-treated apple slices and its effect on water release during air drying. J. Food Eng.106 (3), 253–261.
Rodríguez, Ó., Eim, V.S., Simal, S., Femenia, A., Rosselló, C., 2013. Validation of a di-fussion model using moisture profiles measured by means of TD-NMR in apples(Malus domestica). Food Bioprocess Technol. 6 (2), 542–552.
Rodríguez, Ó., Santacatalina, J.V., Simal, S., Garcia-Perez, J.V., Femenia, A., Rosselló, C.,2014. Influence of power ultrasound application on drying kinetics of apple and itsantioxidant and microstructural properties. J. Food Eng. 129, 21–29.
Russo, P., Adiletta, G., Di Matteo, M., 2013. The influence of drying air temperature onthe physical properties of dried and rehydrated eggplant. Food Bioprod. Process. 91(3), 249–256.
Sabarez, H.T., Gallego-Juárez, J.A., Riera, E., 2012. Ultrasonic-assisted convective dryingof apple slices. Dry. Technol. 30 (9), 989–997.
Schultz, E.L., Mazzuco, M.M., Machado, R.A.F., Bolzan, A., Quadri, M.B., Quadri, M.G.N.,2007. Effect of pre-treatments on drying, density and shrinkage of apple slices. J.Food Eng. 78 (3), 1103–1110.
Seremet, L., Botez, E., Nistor, O.-V., Andronoiu, D.G., Mocanu, G.-D., 2016. Effect ofdifferent drying methods on moisture ratio and rehydration of pumpkin slices. FoodChem. 195, 104–109.
Sharma, G., Bala, R., 2002. Digital Color Imaging Handbook. Taylor & Francis.Shynkaryk, M.V., Lebovka, N.I., Vorobiev, E., 2008. Pulsed electric fields and temperature
effects on drying and rehydration of red beetroots. Dry. Technol. 26 (6), 695–704.Singh, B., Hathan, B.S., 2016. Convective dehydration kinetics and quality evaluation of
osmo-convective dried beetroot candy. Ital. J. Food Sci. 28 (4).Sosa, N., Salvatori, D., Schebor, C., 2012. Physico-chemical and mechanical properties of
apple disks subjected to osmotic dehydration and different drying methods. FoodBioprocess Technol. 5 (5), 1790–1802.
Sousa-Gallagher, M.J., Tank, A., Sousa, R., 2016. 14-Emerging technologies to extend theshelf life and stability of fruits and vegetables A2-Subramaniam, Persis. In: TheStability and Shelf Life of Food, second ed. Woodhead Publishing, pp. 399–430.
Urun, G.B., Yaman, Ü.R., Köse, E., 2015. Determination of drying characteristics andquality properties of eggplant in different drying conditions. Ital. J. Food Sci. 27 (4),459–467.
Vega-Gálvez, A., Ah-Hen, K., Chacana, M., Vergara, J., Martínez-Monzó, J., García-Segovia, P., Lemus-Mondaca, R., Di Scala, K., 2012. Effect of temperature and airvelocity on drying kinetics, antioxidant capacity, total phenolic content, colour,texture and microstructure of apple (var. Granny Smith) slices. Food Chem. 132 (1),51–59.
Vega-Gálvez, A., Miranda, M., Bilbao-Sáinz, C., Uribe, E., Lemus-Mondaca, R., 2008.Empirical modeling of drying process for apple (cv. Granny Smith) slices at differentair temperatures. J. Food Process. Preserv. 32 (6), 972–986.
Zielinska, M., Sadowski, P., Błaszczak, W., 2015. Freezing/thawing and microwave-as-sisted drying of blueberries (Vaccinium corymbosum L.). LWT - Food Sci. Technol. 62(1, Part 2), 555–563.
F. Vallespir et al. Journal of Food Engineering 239 (2018) 83–91
9195
Corrigendum
Corrigendum to Freezing pre-treatments on the intensification of
the drying process of vegetables with different structures
Journal of Food Engineering 239 (2018) 83–91
Francisca Vallespir, Óscar Rodríguez, Valeria S. Eim, Carmen
Rosselló, Susana Simal
Department of Chemistry, University of the Balearic Islands,
Ctra Valldemossa km 7.5, 07122 Palma de Mallorca, Spain
The authors regret that the Acknowledgements section was incorrect. Acknowledgements
should be corrected as follows: The authors would like to acknowledge the financial support
of the National Institute of Research and Agro-Food Technology (INIA) and co-financed with
ERDF funds (RTA2015-00060-C04-03, RTA2015-00060-C04-02), the FOGAIBA
(AIA01/15 project), the Balearic Government for the research project AAEE045/2017 co-
financed with ERDF funds and the Spanish Government (MINECO) for the BES-2013-
064131 fellowship.
The authors would like to apologise for any inconvenience caused.
____________________________ DOI of original article: doi.org/10.1016/j.jfoodeng.2018.07.008
Corresponding author: Susana Simal
E-mail address: [email protected]
96

Contents lists available at ScienceDirect
Journal of Food Engineering
journal homepage: www.elsevier.com/locate/jfoodeng
Effects of freezing treatments before convective drying on qualityparameters: Vegetables with different microstructures
Francisca Vallespir, Óscar Rodríguez, Valeria S. Eim, Carmen Rosselló, Susana Simal∗
Department of Chemistry, University of the Balearic Islands, Ctra Valldemossa km 7.5, 07122, Palma de Mallorca, Spain
A R T I C L E I N F O
Keywords:BeetrootAppleEggplantTextureTotal polyphenol contentAntioxidant activity
A B S T R A C T
Effects of freezing (at −20, −80 and −196 °C) before convective drying (at 50 °C and a flow rate of 1m/s) onmicrostructure, texture, total polyphenol content (TPC) and antioxidant activity (AA) of vegetables with dif-ferent porosity, beetroot (low), apple (medium) and eggplant (high), have been studied. Drying time of frozensamples was 11–32% shorter (p < 0.05) than untreated samples. The highest drying time reductions wereobtained in eggplant (22 ± 10%) and the lowest in beetroot (14 ± 3%). Changes in microstructure afterfreezing were remarkable at −20 and −80 °C, but minor after freezing by liquid nitrogen immersion in beetrootand apple; and not significant (p > 0.05) in eggplant. The elastic modulus decreased 96 ± 2% and the stress-strain curves were significantly lower (p < 0.05) with no rupture point in the three vegetables after all freezingtreatments. Both TPC and AA of frozen samples were significantly lower (p < 0.05) than those of untreatedsamples before and after drying, except in beetroot frozen by immersion in liquid nitrogen, which was notsignificantly different (p > 0.05) to untreated sample. Freezing by immersion in liquid nitrogen promoted thelowest TPC and AA reductions in apple and eggplant. In conclusion, freezing pre-treatment before drying af-fected differently depending on both, the freezing rate and the original microstructure of the vegetable.
1. Introduction
Beetroot, apple and eggplant have been recognized as healthy foodto human body, especially in the oriental countries (Hung and Duy,2012; Wu et al., 2007). All three are good sources of phenolics, in-cluding flavonoids, anthocyanins and carotenoids. Beetroot (Beta vul-garis) contains polyphenols and two main betalain pigments which,apart from being coloured, have also high antioxidant potential(Gengatharan et al., 2015): betaxanthin (yellow-orange) and beta-cyanin (red-violet) (Paciulli et al., 2016). Apple (Malus domestica), as asource of various biologically active compounds, such as vitamin C, andcertain phenolic compounds which are known to act as natural anti-oxidants and also a source of monosaccharides, minerals and dietaryfibre, constitutes an important part of the human diet (Wu et al., 2007).Eggplant (Solanum melongena L.), due to its high phenolic content isranked among the top ten vegetables in terms of oxygen radical ab-sorbance capacity (Luthria, 2012).
Beetroot, apple and eggplant are high moisture content producewhich might be exposed to spoilage during their storage. Drying is aclassical method of food preservation, which provides smaller space forstorage, lighter weight for transportation and longer shelf-life(Dandamrongrak et al., 2002). Moreover, dried fruits and vegetables
are added to various ready-to-eat meals in order to improve their nu-tritional quality due to health benefit compounds (vitamins, phyto-chemicals, dietary fibres) and, therefore, drying of products is of aparticular interest (Mrkić et al., 2007). Usually, convective drying byusing hot air as a medium for heating and removing evaporated water isthe method used in fruits and vegetables (Kaleta and Górnicki, 2010).
Convective drying of fruits and vegetables is a time and energydemanding process, which might be enhanced by using different foodpre-treatment methodologies proposed in the literature. Freezing pre-treatment seems to enhance drying rate of fruits and vegetables(Lewicki, 2006), shorter drying times being observed in samples whichwere frozen before drying. Drying time reductions between 13% and46% were reported in the literature when freezing pre-treatments at−34 and −18 °C were applied before convective drying (at 50 °C and3.1 m/s and at 60 °C and 2m/s, respectively) of cape gooseberry(Junqueira et al., 2017b) and banana (Dandamrongrak et al., 2002),respectively. For beetroot, apple and eggplant, as far as we are con-cerned, only two studies about freezing treatment prior to drying havebeen published. According to Shynkaryk et al. (2008) and Ramírez et al.(2011) beetroot and apple drying time (at 70 °C and 2m/s and at 60 °Cand 1.2m/s, respectively) was shortened by 32% and 28% afterfreezing at −20 and −30 °C, respectively.
https://doi.org/10.1016/j.jfoodeng.2019.01.006Received 17 July 2018; Received in revised form 30 September 2018; Accepted 8 January 2019
∗ Corresponding author.E-mail address: [email protected] (S. Simal).
Journal of Food Engineering 249 (2019) 15–24
Available online 09 January 20190260-8774/ © 2019 Elsevier Ltd. All rights reserved.
T
97
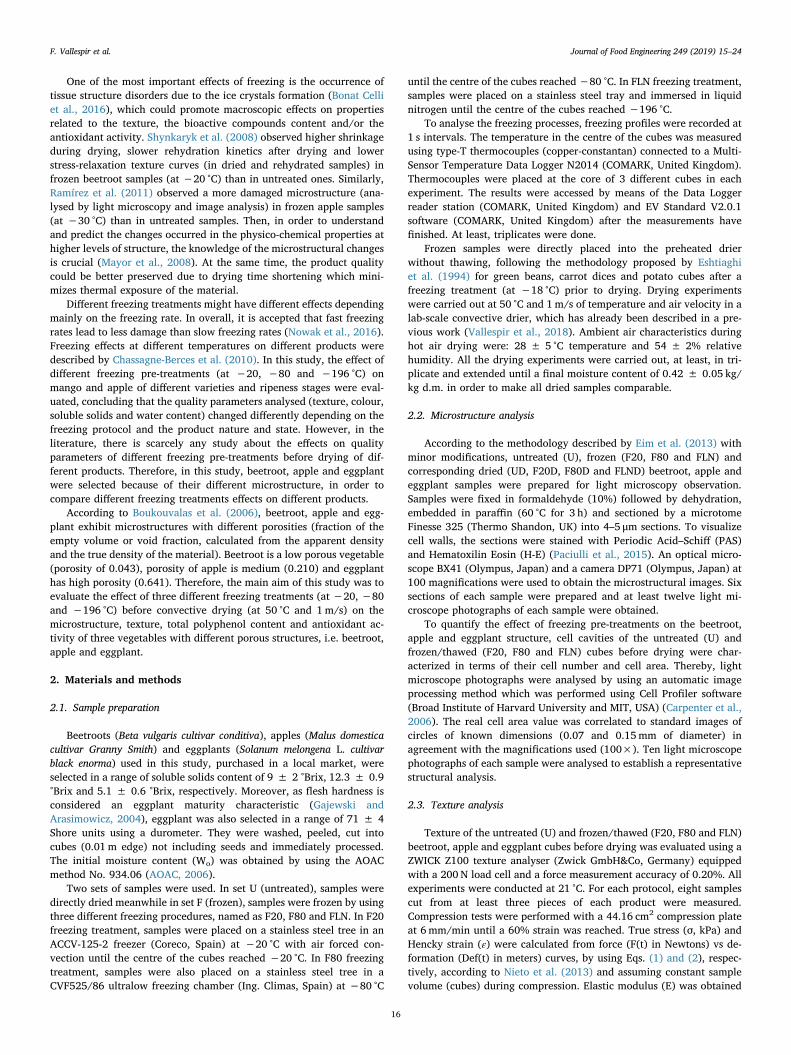
One of the most important effects of freezing is the occurrence oftissue structure disorders due to the ice crystals formation (Bonat Celliet al., 2016), which could promote macroscopic effects on propertiesrelated to the texture, the bioactive compounds content and/or theantioxidant activity. Shynkaryk et al. (2008) observed higher shrinkageduring drying, slower rehydration kinetics after drying and lowerstress-relaxation texture curves (in dried and rehydrated samples) infrozen beetroot samples (at −20 °C) than in untreated ones. Similarly,Ramírez et al. (2011) observed a more damaged microstructure (ana-lysed by light microscopy and image analysis) in frozen apple samples(at −30 °C) than in untreated samples. Then, in order to understandand predict the changes occurred in the physico-chemical properties athigher levels of structure, the knowledge of the microstructural changesis crucial (Mayor et al., 2008). At the same time, the product qualitycould be better preserved due to drying time shortening which mini-mizes thermal exposure of the material.
Different freezing treatments might have different effects dependingmainly on the freezing rate. In overall, it is accepted that fast freezingrates lead to less damage than slow freezing rates (Nowak et al., 2016).Freezing effects at different temperatures on different products weredescribed by Chassagne-Berces et al. (2010). In this study, the effect ofdifferent freezing pre-treatments (at −20, −80 and −196 °C) onmango and apple of different varieties and ripeness stages were eval-uated, concluding that the quality parameters analysed (texture, colour,soluble solids and water content) changed differently depending on thefreezing protocol and the product nature and state. However, in theliterature, there is scarcely any study about the effects on qualityparameters of different freezing pre-treatments before drying of dif-ferent products. Therefore, in this study, beetroot, apple and eggplantwere selected because of their different microstructure, in order tocompare different freezing treatments effects on different products.
According to Boukouvalas et al. (2006), beetroot, apple and egg-plant exhibit microstructures with different porosities (fraction of theempty volume or void fraction, calculated from the apparent densityand the true density of the material). Beetroot is a low porous vegetable(porosity of 0.043), porosity of apple is medium (0.210) and eggplanthas high porosity (0.641). Therefore, the main aim of this study was toevaluate the effect of three different freezing treatments (at −20, −80and −196 °C) before convective drying (at 50 °C and 1m/s) on themicrostructure, texture, total polyphenol content and antioxidant ac-tivity of three vegetables with different porous structures, i.e. beetroot,apple and eggplant.
2. Materials and methods
2.1. Sample preparation
Beetroots (Beta vulgaris cultivar conditiva), apples (Malus domesticacultivar Granny Smith) and eggplants (Solanum melongena L. cultivarblack enorma) used in this study, purchased in a local market, wereselected in a range of soluble solids content of 9 ± 2 °Brix, 12.3 ± 0.9°Brix and 5.1 ± 0.6 °Brix, respectively. Moreover, as flesh hardness isconsidered an eggplant maturity characteristic (Gajewski andArasimowicz, 2004), eggplant was also selected in a range of 71 ± 4Shore units using a durometer. They were washed, peeled, cut intocubes (0.01m edge) not including seeds and immediately processed.The initial moisture content (Wo) was obtained by using the AOACmethod No. 934.06 (AOAC, 2006).
Two sets of samples were used. In set U (untreated), samples weredirectly dried meanwhile in set F (frozen), samples were frozen by usingthree different freezing procedures, named as F20, F80 and FLN. In F20freezing treatment, samples were placed on a stainless steel tree in anACCV-125-2 freezer (Coreco, Spain) at −20 °C with air forced con-vection until the centre of the cubes reached −20 °C. In F80 freezingtreatment, samples were also placed on a stainless steel tree in aCVF525/86 ultralow freezing chamber (Ing. Climas, Spain) at −80 °C
until the centre of the cubes reached−80 °C. In FLN freezing treatment,samples were placed on a stainless steel tray and immersed in liquidnitrogen until the centre of the cubes reached −196 °C.
To analyse the freezing processes, freezing profiles were recorded at1 s intervals. The temperature in the centre of the cubes was measuredusing type-T thermocouples (copper-constantan) connected to a Multi-Sensor Temperature Data Logger N2014 (COMARK, United Kingdom).Thermocouples were placed at the core of 3 different cubes in eachexperiment. The results were accessed by means of the Data Loggerreader station (COMARK, United Kingdom) and EV Standard V2.0.1software (COMARK, United Kingdom) after the measurements havefinished. At least, triplicates were done.
Frozen samples were directly placed into the preheated drierwithout thawing, following the methodology proposed by Eshtiaghiet al. (1994) for green beans, carrot dices and potato cubes after afreezing treatment (at −18 °C) prior to drying. Drying experimentswere carried out at 50 °C and 1m/s of temperature and air velocity in alab-scale convective drier, which has already been described in a pre-vious work (Vallespir et al., 2018). Ambient air characteristics duringhot air drying were: 28 ± 5 °C temperature and 54 ± 2% relativehumidity. All the drying experiments were carried out, at least, in tri-plicate and extended until a final moisture content of 0.42 ± 0.05 kg/kg d.m. in order to make all dried samples comparable.
2.2. Microstructure analysis
According to the methodology described by Eim et al. (2013) withminor modifications, untreated (U), frozen (F20, F80 and FLN) andcorresponding dried (UD, F20D, F80D and FLND) beetroot, apple andeggplant samples were prepared for light microscopy observation.Samples were fixed in formaldehyde (10%) followed by dehydration,embedded in paraffin (60 °C for 3 h) and sectioned by a microtomeFinesse 325 (Thermo Shandon, UK) into 4–5 μm sections. To visualizecell walls, the sections were stained with Periodic Acid–Schiff (PAS)and Hematoxilin Eosin (H-E) (Paciulli et al., 2015). An optical micro-scope BX41 (Olympus, Japan) and a camera DP71 (Olympus, Japan) at100 magnifications were used to obtain the microstructural images. Sixsections of each sample were prepared and at least twelve light mi-croscope photographs of each sample were obtained.
To quantify the effect of freezing pre-treatments on the beetroot,apple and eggplant structure, cell cavities of the untreated (U) andfrozen/thawed (F20, F80 and FLN) cubes before drying were char-acterized in terms of their cell number and cell area. Thereby, lightmicroscope photographs were analysed by using an automatic imageprocessing method which was performed using Cell Profiler software(Broad Institute of Harvard University and MIT, USA) (Carpenter et al.,2006). The real cell area value was correlated to standard images ofcircles of known dimensions (0.07 and 0.15mm of diameter) inagreement with the magnifications used (100×). Ten light microscopephotographs of each sample were analysed to establish a representativestructural analysis.
2.3. Texture analysis
Texture of the untreated (U) and frozen/thawed (F20, F80 and FLN)beetroot, apple and eggplant cubes before drying was evaluated using aZWICK Z100 texture analyser (Zwick GmbH&Co, Germany) equippedwith a 200 N load cell and a force measurement accuracy of 0.20%. Allexperiments were conducted at 21 °C. For each protocol, eight samplescut from at least three pieces of each product were measured.Compression tests were performed with a 44.16 cm2 compression plateat 6mm/min until a 60% strain was reached. True stress (σ, kPa) andHencky strain (ε) were calculated from force (F(t) in Newtons) vs de-formation (Def(t) in meters) curves, by using Eqs. (1) and (2), respec-tively, according to Nieto et al. (2013) and assuming constant samplevolume (cubes) during compression. Elastic modulus (E) was obtained
F. Vallespir et al. Journal of Food Engineering 249 (2019) 15–24
1698

from the slope of the loading curve at the point of the highest gradientaccording to Nieto et al. (2013) (Eq. (3)). Rupture stress (σR) andrupture strain (εR) were determined from the first peak of the stress-strain curve. Toughness (W) (i.e. the energy absorbed by the materialup to the rupture point per unit of volume of the cubes) was obtained bycalculating the area of the stress-strain curve until the rupture strainpoint (εR) according to Nieto et al. (2013) (Eq. (4)).
=−
σF t H Def t
H( )·( ( ))0
03 (1)
=−
ε ln HH Def t(
( ))0
0 (2)
=E dσdε (3)
∫=W σ dεε
0
R
(4)
where F(t) is the force at time t (N), Def(t) is the deformation at time t(m) and H0 is the initial height of the cubes (0.01m).
2.4. Total polyphenol content and antioxidant activity
Untreated (U), frozen (F20, F80 and FLN) and corresponding driedsamples (UD, F20D, F80D and FLND) were analysed to determine theirtotal polyphenol content (TPC) and antioxidant activity (AA). Methanolextracts from beetroot, apple and eggplant samples were prepared ac-cording to the methodology described by Heredia and Cisneros-Zevallos(2009) with some modifications. Samples were accurately weighted(∼3 g of fresh samples and ∼1 g of dried samples) and extractionsolvent was added (20mL of methanol). Mixture was homogenized byusing Ultra-Turrax© (T25 Digital, IKA, Germany) at 13,000 rpm for1min at 4 °C and the obtained solution was refrigerated overnight.Mixtures were centrifuged at 4000 rpm for 10min and then filtrated.The extracts were refrigerated at 4 °C until analysis. At least, two me-thanol extracts were prepared for each sample, which were analysed intriplicate.
According to Eim et al. (2013), total polyphenol content (TPC) wasdetermined by means of the Folin-Ciocalteu assay. According toGonzález-Centeno et al. (2012), the antioxidant activity (AA) was de-termined by using FRAP, CUPRAC and ABTS assays. A UV/Vis/NIRspectrophotometer Multiskan Spectrum (Thermo Scientific, Finland)was used to carry out the absorbance measurements at 25 °C and at 745(TPC), 593 (FRAP), 450 (CUPRAC) and 734 (ABTS) nm. Standardcurves (0–250 ppm gallic acid for TPC and 0–400 ppm trolox for AA)were used to correlate absorbance measurements. The results wereexpressed as mg of gallic acid equivalent (GAE)/g dry matter (d.m.) for
the TPC, while the AA was expressed as mg trolox equivalent (TE)/g drymatter (d.m.).
2.5. Statistical analysis
Statistical analysis of the cell area results in microstructure analysiswas performed by using the “prctile” function of Matlab 2014a versionsoftware (Mathworks Inc., USA). Thus, the cell number per unit oftissue surface and the percentile profile of cell areas of each samplewere obtained.
Statistical analyses were carried out by using R software (GNU,USA). Data were averaged from replicates and reported as averagevalues ± standard deviations. Analysis of variance (ANOVA) was ap-plied to analyse the effects of freezing pre-treatment and drying onmicrostructure and texture parameters, total polyphenol content andantioxidant activity. Means were compared by Tukey's test atp < 0.05.
3. Results and discussion
3.1. Freezing curves
No significant differences (p > 0.05) were observed among thebeetroot, apple and eggplant cubes temperature profiles during eachfreezing pre-treatment. Thus, the average freezing curves for the threeproducts were presented in Fig. 1 for the different freezing pre-treat-ments: F20, F80 and FLN. Typical temperature profiles similar to thoseof navy bean, pea pod, mushroom and cauliflower frozen at−70 °C andstrawberry frozen at −30 °C reported by Haiying et al. (2007) andDelgado and Rubiolo (2005), respectively, could be observed in thisfigure. In those profiles, temperature decreased speedily from roomtemperature (18.8 ± 0.7 °C) to ca. 0 °C for the three freezing pre-treatments. Afterwards temperature remained almost constant for ashort period of time during ice crystals formation which is called thefreezing plateau (Chung et al., 2013). The freezing plateau started atthe initial freezing point which depends on the freezing rate and theproduct used (Haiying et al., 2007). In the case of FLN freezing pre-treatment, ice crystals were almost instantly formed and the plateaucould not be appreciated due to its shortness. Finally, the temperaturecontinued decreasing until the freezing set temperature. It is worth tomention that final temperature of F80 sample was of −76 °C, higherthan −80 °C due to the frosting layer of the freezer.
Chung et al. (2013) and Harnkarnsujarit et al. (2016) reported thatwhen comparing different freezing treatments (Prunus mume juicefrozen at −20 and −50 °C and Soybean curd frozen at −20 °C,−50 °C,−90 °C and by liquid nitrogen immersion, respectively) the lower thefreezing temperature, the faster the freezing process. Moreover,
-25-20-15-10-505
10152025
0 200 400 600 800
Tem
pera
ture
(ºC
)
Time (s)
F20
-100
-80
-60
-40
-20
0
20
40
0 200 400 600 800
Tem
pera
ture
(ºC
)
Time (s)
F80
-250
-200
-150
-100
-50
0
50
0 5 10 15 20 25
Tem
pera
ture
(ºC
)
Time (s)
FLN
Fig. 1. Beetroot, apple and eggplant cubes freezing curves at −20 °C (F20), at −80 °C (F80) and by liquid nitrogen immersion (FLN). Average values ± standarddeviations.
F. Vallespir et al. Journal of Food Engineering 249 (2019) 15–24
1799
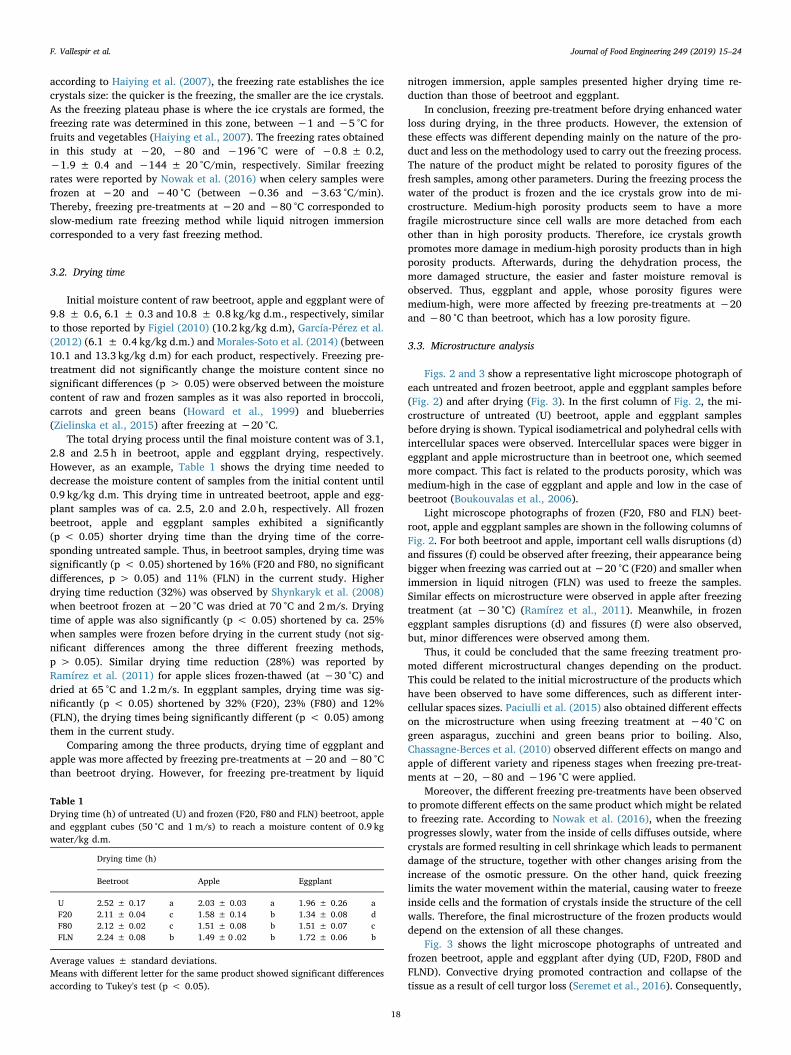
according to Haiying et al. (2007), the freezing rate establishes the icecrystals size: the quicker is the freezing, the smaller are the ice crystals.As the freezing plateau phase is where the ice crystals are formed, thefreezing rate was determined in this zone, between −1 and −5 °C forfruits and vegetables (Haiying et al., 2007). The freezing rates obtainedin this study at −20, −80 and −196 °C were of −0.8 ± 0.2,−1.9 ± 0.4 and −144 ± 20 °C/min, respectively. Similar freezingrates were reported by Nowak et al. (2016) when celery samples werefrozen at −20 and −40 °C (between −0.36 and −3.63 °C/min).Thereby, freezing pre-treatments at −20 and −80 °C corresponded toslow-medium rate freezing method while liquid nitrogen immersioncorresponded to a very fast freezing method.
3.2. Drying time
Initial moisture content of raw beetroot, apple and eggplant were of9.8 ± 0.6, 6.1 ± 0.3 and 10.8 ± 0.8 kg/kg d.m., respectively, similarto those reported by Figiel (2010) (10.2 kg/kg d.m), García-Pérez et al.(2012) (6.1 ± 0.4 kg/kg d.m.) and Morales-Soto et al. (2014) (between10.1 and 13.3 kg/kg d.m) for each product, respectively. Freezing pre-treatment did not significantly change the moisture content since nosignificant differences (p > 0.05) were observed between the moisturecontent of raw and frozen samples as it was also reported in broccoli,carrots and green beans (Howard et al., 1999) and blueberries(Zielinska et al., 2015) after freezing at −20 °C.
The total drying process until the final moisture content was of 3.1,2.8 and 2.5 h in beetroot, apple and eggplant drying, respectively.However, as an example, Table 1 shows the drying time needed todecrease the moisture content of samples from the initial content until0.9 kg/kg d.m. This drying time in untreated beetroot, apple and egg-plant samples was of ca. 2.5, 2.0 and 2.0 h, respectively. All frozenbeetroot, apple and eggplant samples exhibited a significantly(p < 0.05) shorter drying time than the drying time of the corre-sponding untreated sample. Thus, in beetroot samples, drying time wassignificantly (p < 0.05) shortened by 16% (F20 and F80, no significantdifferences, p > 0.05) and 11% (FLN) in the current study. Higherdrying time reduction (32%) was observed by Shynkaryk et al. (2008)when beetroot frozen at −20 °C was dried at 70 °C and 2m/s. Dryingtime of apple was also significantly (p < 0.05) shortened by ca. 25%when samples were frozen before drying in the current study (not sig-nificant differences among the three different freezing methods,p > 0.05). Similar drying time reduction (28%) was reported byRamírez et al. (2011) for apple slices frozen-thawed (at −30 °C) anddried at 65 °C and 1.2 m/s. In eggplant samples, drying time was sig-nificantly (p < 0.05) shortened by 32% (F20), 23% (F80) and 12%(FLN), the drying times being significantly different (p < 0.05) amongthem in the current study.
Comparing among the three products, drying time of eggplant andapple was more affected by freezing pre-treatments at −20 and −80 °Cthan beetroot drying. However, for freezing pre-treatment by liquid
nitrogen immersion, apple samples presented higher drying time re-duction than those of beetroot and eggplant.
In conclusion, freezing pre-treatment before drying enhanced waterloss during drying, in the three products. However, the extension ofthese effects was different depending mainly on the nature of the pro-duct and less on the methodology used to carry out the freezing process.The nature of the product might be related to porosity figures of thefresh samples, among other parameters. During the freezing process thewater of the product is frozen and the ice crystals grow into de mi-crostructure. Medium-high porosity products seem to have a morefragile microstructure since cell walls are more detached from eachother than in high porosity products. Therefore, ice crystals growthpromotes more damage in medium-high porosity products than in highporosity products. Afterwards, during the dehydration process, themore damaged structure, the easier and faster moisture removal isobserved. Thus, eggplant and apple, whose porosity figures weremedium-high, were more affected by freezing pre-treatments at −20and −80 °C than beetroot, which has a low porosity figure.
3.3. Microstructure analysis
Figs. 2 and 3 show a representative light microscope photograph ofeach untreated and frozen beetroot, apple and eggplant samples before(Fig. 2) and after drying (Fig. 3). In the first column of Fig. 2, the mi-crostructure of untreated (U) beetroot, apple and eggplant samplesbefore drying is shown. Typical isodiametrical and polyhedral cells withintercellular spaces were observed. Intercellular spaces were bigger ineggplant and apple microstructure than in beetroot one, which seemedmore compact. This fact is related to the products porosity, which wasmedium-high in the case of eggplant and apple and low in the case ofbeetroot (Boukouvalas et al., 2006).
Light microscope photographs of frozen (F20, F80 and FLN) beet-root, apple and eggplant samples are shown in the following columns ofFig. 2. For both beetroot and apple, important cell walls disruptions (d)and fissures (f) could be observed after freezing, their appearance beingbigger when freezing was carried out at−20 °C (F20) and smaller whenimmersion in liquid nitrogen (FLN) was used to freeze the samples.Similar effects on microstructure were observed in apple after freezingtreatment (at −30 °C) (Ramírez et al., 2011). Meanwhile, in frozeneggplant samples disruptions (d) and fissures (f) were also observed,but, minor differences were observed among them.
Thus, it could be concluded that the same freezing treatment pro-moted different microstructural changes depending on the product.This could be related to the initial microstructure of the products whichhave been observed to have some differences, such as different inter-cellular spaces sizes. Paciulli et al. (2015) also obtained different effectson the microstructure when using freezing treatment at −40 °C ongreen asparagus, zucchini and green beans prior to boiling. Also,Chassagne-Berces et al. (2010) observed different effects on mango andapple of different variety and ripeness stages when freezing pre-treat-ments at −20, −80 and −196 °C were applied.
Moreover, the different freezing pre-treatments have been observedto promote different effects on the same product which might be relatedto freezing rate. According to Nowak et al. (2016), when the freezingprogresses slowly, water from the inside of cells diffuses outside, wherecrystals are formed resulting in cell shrinkage which leads to permanentdamage of the structure, together with other changes arising from theincrease of the osmotic pressure. On the other hand, quick freezinglimits the water movement within the material, causing water to freezeinside cells and the formation of crystals inside the structure of the cellwalls. Therefore, the final microstructure of the frozen products woulddepend on the extension of all these changes.
Fig. 3 shows the light microscope photographs of untreated andfrozen beetroot, apple and eggplant after dying (UD, F20D, F80D andFLND). Convective drying promoted contraction and collapse of thetissue as a result of cell turgor loss (Seremet et al., 2016). Consequently,
Table 1Drying time (h) of untreated (U) and frozen (F20, F80 and FLN) beetroot, appleand eggplant cubes (50 °C and 1m/s) to reach a moisture content of 0.9 kgwater/kg d.m.
Drying time (h)
Beetroot Apple Eggplant
U 2.52 ± 0.17 a 2.03 ± 0.03 a 1.96 ± 0.26 aF20 2.11 ± 0.04 c 1.58 ± 0.14 b 1.34 ± 0.08 dF80 2.12 ± 0.02 c 1.51 ± 0.08 b 1.51 ± 0.07 cFLN 2.24 ± 0.08 b 1.49 ± 0 .02 b 1.72 ± 0.06 b
Average values ± standard deviations.Means with different letter for the same product showed significant differencesaccording to Tukey's test (p < 0.05).
F. Vallespir et al. Journal of Food Engineering 249 (2019) 15–24
18100
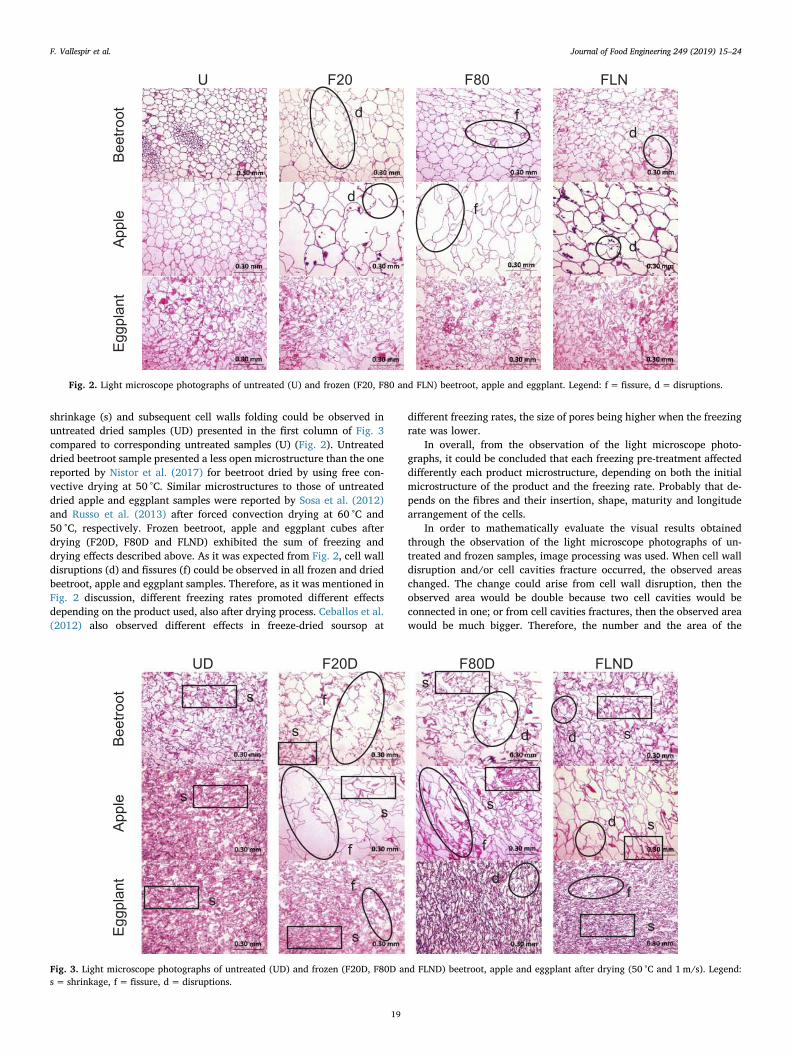
shrinkage (s) and subsequent cell walls folding could be observed inuntreated dried samples (UD) presented in the first column of Fig. 3compared to corresponding untreated samples (U) (Fig. 2). Untreateddried beetroot sample presented a less open microstructure than the onereported by Nistor et al. (2017) for beetroot dried by using free con-vective drying at 50 °C. Similar microstructures to those of untreateddried apple and eggplant samples were reported by Sosa et al. (2012)and Russo et al. (2013) after forced convection drying at 60 °C and50 °C, respectively. Frozen beetroot, apple and eggplant cubes afterdrying (F20D, F80D and FLND) exhibited the sum of freezing anddrying effects described above. As it was expected from Fig. 2, cell walldisruptions (d) and fissures (f) could be observed in all frozen and driedbeetroot, apple and eggplant samples. Therefore, as it was mentioned inFig. 2 discussion, different freezing rates promoted different effectsdepending on the product used, also after drying process. Ceballos et al.(2012) also observed different effects in freeze-dried soursop at
different freezing rates, the size of pores being higher when the freezingrate was lower.
In overall, from the observation of the light microscope photo-graphs, it could be concluded that each freezing pre-treatment affecteddifferently each product microstructure, depending on both the initialmicrostructure of the product and the freezing rate. Probably that de-pends on the fibres and their insertion, shape, maturity and longitudearrangement of the cells.
In order to mathematically evaluate the visual results obtainedthrough the observation of the light microscope photographs of un-treated and frozen samples, image processing was used. When cell walldisruption and/or cell cavities fracture occurred, the observed areaschanged. The change could arise from cell wall disruption, then theobserved area would be double because two cell cavities would beconnected in one; or from cell cavities fractures, then the observed areawould be much bigger. Therefore, the number and the area of the
U F20 F80 FLN
Bee
troot
App
leE
ggpl
ant
d
f
f
d
d
d
Fig. 2. Light microscope photographs of untreated (U) and frozen (F20, F80 and FLN) beetroot, apple and eggplant. Legend: f= fissure, d= disruptions.
UD F20D F80D FLND
Bee
troot
App
leE
ggpl
ant
f
f
df
d
s
s
ss
s
ss
ds
s
s
sf d
f
Fig. 3. Light microscope photographs of untreated (UD) and frozen (F20D, F80D and FLND) beetroot, apple and eggplant after drying (50 °C and 1m/s). Legend:s= shrinkage, f= fissure, d= disruptions.
F. Vallespir et al. Journal of Food Engineering 249 (2019) 15–24
19101
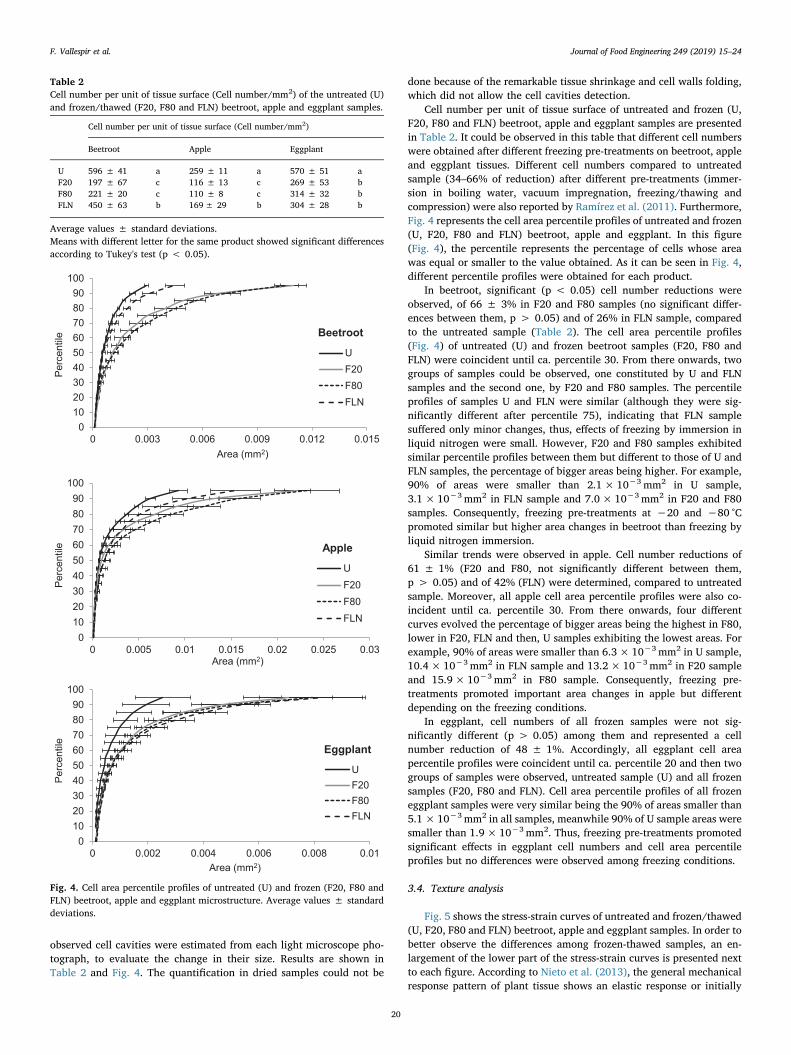
observed cell cavities were estimated from each light microscope pho-tograph, to evaluate the change in their size. Results are shown inTable 2 and Fig. 4. The quantification in dried samples could not be
done because of the remarkable tissue shrinkage and cell walls folding,which did not allow the cell cavities detection.
Cell number per unit of tissue surface of untreated and frozen (U,F20, F80 and FLN) beetroot, apple and eggplant samples are presentedin Table 2. It could be observed in this table that different cell numberswere obtained after different freezing pre-treatments on beetroot, appleand eggplant tissues. Different cell numbers compared to untreatedsample (34–66% of reduction) after different pre-treatments (immer-sion in boiling water, vacuum impregnation, freezing/thawing andcompression) were also reported by Ramírez et al. (2011). Furthermore,Fig. 4 represents the cell area percentile profiles of untreated and frozen(U, F20, F80 and FLN) beetroot, apple and eggplant. In this figure(Fig. 4), the percentile represents the percentage of cells whose areawas equal or smaller to the value obtained. As it can be seen in Fig. 4,different percentile profiles were obtained for each product.
In beetroot, significant (p < 0.05) cell number reductions wereobserved, of 66 ± 3% in F20 and F80 samples (no significant differ-ences between them, p > 0.05) and of 26% in FLN sample, comparedto the untreated sample (Table 2). The cell area percentile profiles(Fig. 4) of untreated (U) and frozen beetroot samples (F20, F80 andFLN) were coincident until ca. percentile 30. From there onwards, twogroups of samples could be observed, one constituted by U and FLNsamples and the second one, by F20 and F80 samples. The percentileprofiles of samples U and FLN were similar (although they were sig-nificantly different after percentile 75), indicating that FLN samplesuffered only minor changes, thus, effects of freezing by immersion inliquid nitrogen were small. However, F20 and F80 samples exhibitedsimilar percentile profiles between them but different to those of U andFLN samples, the percentage of bigger areas being higher. For example,90% of areas were smaller than 2.1× 10⁻³ mm2 in U sample,3.1× 10−3 mm2 in FLN sample and 7.0× 10⁻³ mm2 in F20 and F80samples. Consequently, freezing pre-treatments at −20 and −80 °Cpromoted similar but higher area changes in beetroot than freezing byliquid nitrogen immersion.
Similar trends were observed in apple. Cell number reductions of61 ± 1% (F20 and F80, not significantly different between them,p > 0.05) and of 42% (FLN) were determined, compared to untreatedsample. Moreover, all apple cell area percentile profiles were also co-incident until ca. percentile 30. From there onwards, four differentcurves evolved the percentage of bigger areas being the highest in F80,lower in F20, FLN and then, U samples exhibiting the lowest areas. Forexample, 90% of areas were smaller than 6.3× 10⁻³ mm2 in U sample,10.4×10−3 mm2 in FLN sample and 13.2×10⁻³ mm2 in F20 sampleand 15.9× 10⁻³ mm2 in F80 sample. Consequently, freezing pre-treatments promoted important area changes in apple but differentdepending on the freezing conditions.
In eggplant, cell numbers of all frozen samples were not sig-nificantly different (p > 0.05) among them and represented a cellnumber reduction of 48 ± 1%. Accordingly, all eggplant cell areapercentile profiles were coincident until ca. percentile 20 and then twogroups of samples were observed, untreated sample (U) and all frozensamples (F20, F80 and FLN). Cell area percentile profiles of all frozeneggplant samples were very similar being the 90% of areas smaller than5.1×10−3 mm2 in all samples, meanwhile 90% of U sample areas weresmaller than 1.9× 10⁻³ mm2. Thus, freezing pre-treatments promotedsignificant effects in eggplant cell numbers and cell area percentileprofiles but no differences were observed among freezing conditions.
3.4. Texture analysis
Fig. 5 shows the stress-strain curves of untreated and frozen/thawed(U, F20, F80 and FLN) beetroot, apple and eggplant samples. In order tobetter observe the differences among frozen-thawed samples, an en-largement of the lower part of the stress-strain curves is presented nextto each figure. According to Nieto et al. (2013), the general mechanicalresponse pattern of plant tissue shows an elastic response or initially
Table 2Cell number per unit of tissue surface (Cell number/mm2) of the untreated (U)and frozen/thawed (F20, F80 and FLN) beetroot, apple and eggplant samples.
Cell number per unit of tissue surface (Cell number/mm2)
Beetroot Apple Eggplant
U 596 ± 41 a 259 ± 11 a 570 ± 51 aF20 197 ± 67 c 116 ± 13 c 269 ± 53 bF80 221 ± 20 c 110 ± 8 c 314 ± 32 bFLN 450 ± 63 b 169± 29 b 304 ± 28 b
Average values ± standard deviations.Means with different letter for the same product showed significant differencesaccording to Tukey's test (p < 0.05).
0102030405060708090
100
0 0.003 0.006 0.009 0.012 0.015
Perc
entil
e
Area (mm2)
UF20F80FLN
Beetroot
0102030405060708090
100
0 0.005 0.01 0.015 0.02 0.025 0.03
Perc
entil
e
Area (mm2)
UF20F80FLN
Apple
0102030405060708090
100
0 0.002 0.004 0.006 0.008 0.01
Perc
entil
e
Area (mm2)
UF20F80FLN
Eggplant
Fig. 4. Cell area percentile profiles of untreated (U) and frozen (F20, F80 andFLN) beetroot, apple and eggplant microstructure. Average values ± standarddeviations.
F. Vallespir et al. Journal of Food Engineering 249 (2019) 15–24
20102

linear stress-strain relationship, until the sample fractures in a criticaldeformation level and finally the stress decreases. This pattern, de-scribed in the literature, has a lognormal style and it was observed inthe untreated beetroot and apple samples, but not in the untreatedeggplant sample, whose deformation took place during the whole ex-periment without sample fracture. The rupture stress (σR) was of810 ± 70 kPa at 0.60 ± 0.06 of rupture strain point (εR) in untreatedbeetroot sample and of 460 ± 70 kPa at 0.27 ± 0.05 of rupture strainpoint (εR) in untreated apple sample. Toughness (W) (energy absorbedup to the rupture strain point per unit of volume) was of 308 ± 28mJ/m3 and of 63 ± 9mJ/m3 for untreated beetroot and apple samples,respectively. Thus, beetroot sample absorbed more energy before therupture point than apple sample. It is difficult to compare these resultswith other researchers’ work since sample size and shape, temperatureand strain rate may change the results obtained due to differentequipment (Chiralt et al., 2001). However, Nieto et al. (2013) reported,for apple cylinders, lower figures of rupture stress (340–350 kPa),rupture strain (0.19–0.26) and toughness (35–44mJ/m3). Also, Varelaet al. (2007) reported a higher figure of rupture stress (σR) (600 kPa) foruntreated apple.
With regard to the frozen samples, it can be seen in Fig. 5 that in allthree cases, beetroot, apple and eggplant, the freezing process highlyaltered the texture. Thus, the resistance to deformation of frozen/thawed samples was significantly lower than that of the untreatedsamples. Besides, it can also be observed in Fig. 5 that none of thefrozen samples presented rupture point (a peak in stress-strain curves)since they showed a linear style increasing constantly. Similar resultswere reported by Chiralt et al. (2001), Nayak et al. (2007), Varela et al.
(2007), Chassagne-Berces et al. (2010) and Nieto et al. (2013) whendifferent processes, such as osmotic dehydration, gamma irradiation,freezing or cold storage were applied to mango, kiwi, strawberry,carrot, potato, beetroot and apple. All these authors observed lowerstress-strain curves in processed samples, in comparison to the un-treated samples, due to the damage on texture caused by processing.Different factors can contribute to mechanical properties of plant tissue:cell wall resistance to compression or tensile forces, cell turgor, cellbonding force through middle lamella and density of cell packaging(Chiralt et al., 2001). It seems that freezing process affected thosefactors reducing the mechanical resistance of the frozen samples,probably due to the ice crystals growing.
Comparing among the different freezing pre-treatments, the stress-strain curves of F20, F80 and FLN samples presented no significantdifferences (p > 0.05) among them in the case of apple and eggplant,and the only significant difference (p < 0.05) was observed in beetrootbetween the curve of FLN sample and those of F20 and F80 samples.Thereby, all the freezing pre-treatments promoted high but similartexture damage to apple and eggplant texture, and only slightly smallerwhen freezing was carried out by immersion in liquid nitrogen in thecase of beetroot.
Table 3 shows the elastic modulus (E) of untreated and frozen/thawed (U, F20, F80 and FLN) beetroot, apple and eggplant samples,calculated from compression tests. It can be seen in this table thatelastic modulus in untreated beetroot and apple were very similaramong each other, but ca. 15–18 times higher than that of untreatedeggplant. Thus, elastic response was lower in eggplant sample than inbeetroot and apple samples. Different authors reported elastic modulusfigures of the same order of magnitude for raw beetroot:1550 ± 80 kPa (Paciulli et al., 2016); apple: 2070–2220 kPa(Chassagne-Berces et al., 2010) and 1700–2200 kPa (Nieto et al., 2013);and eggplant: 210 ± 20 kPa (Junqueira et al., 2017a).
As it was expected from the stress-strain curves described above,frozen samples of beetroot, apple and eggplant exhibited significantly(p < 0.05) lower E values than those of the corresponding untreatedsamples (90–98% of E decrease). Similar E decreases (78–99%) wereobtained by Chassagne-Berces et al. (2010) when apple and mangocylinders were frozen at −20, −80 and −196 °C. Decreases in othertexture parameters such as firmness (36–96% of decrease) after papayafreezing at −25 °C (1–5 cycles) and hardness, chewiness and gummi-ness (66–80% of decrease) after blueberries freezing at −20 °C wereobserved by Phothiset and Charoenrein (2014) and by Zielinska et al.(2015), respectively.
Elastic modulus reductions after freezing/thawing were highlycorrelated to the differences observed in stress-strain curves. Thus, nosignificant differences (p > 0.05) were observed among E reductionsin frozen/thawed samples (F20, F80 and FLN) of apple and eggplant,which were of 96 ± 1 and 94 ± 4%, respectively. In frozen/thawedbeetroot, E reductions at −20 and −80 °C (F20 and F80) were of96 ± 1% (no significant differences found between them, p > 0.05),
0
200
400
600
800
1000
0 0.5 1
(kPa
)
0
40
80
120
160
200
0 0.5 1
(kPa
)
Beetroot
UF20F80FLN
0
100
200
300
400
500
600
0 0.5 1
(kPa
)
0
20
40
60
80
100
120
0 0.5 1
(kPa
)
Apple
UF20F80FLN
0
20
40
60
80
0 0.5 1
(kPa
)
0
1
2
3
4
5
6
7
0 0.5 1
(kPa
)
Eggplant
UF20F80FLN
Fig. 5. Stress vs strain curves of untreated (U) and frozen (F20, F80 and FLN)beetroot, apple and eggplant cubes. Average values ± standard deviations.
Table 3Elastic modulus, E (kPa), obtained from texture tests of the untreated (U) andfrozen/thawed (F20, F80 and FLN) beetroot, apple and eggplant samples beforedrying.
Elastic modulus (kPa)
Beetroot Apple Eggplant
U 2592 ± 285 a 2179 ± 389 a 136 ± 51 aF20 85 ± 10 c 61 ± 10 b 5 ± 3 bF80 49 ± 30 c 73 ± 20 b 13 ± 6 bFLN 157 ± 20 b 49 ± 10 b 7 ± 5 b
Average values ± standard deviations.Means with different letter for the same product showed significant differencesaccording to Tukey's test (p < 0.05).
F. Vallespir et al. Journal of Food Engineering 249 (2019) 15–24
21103
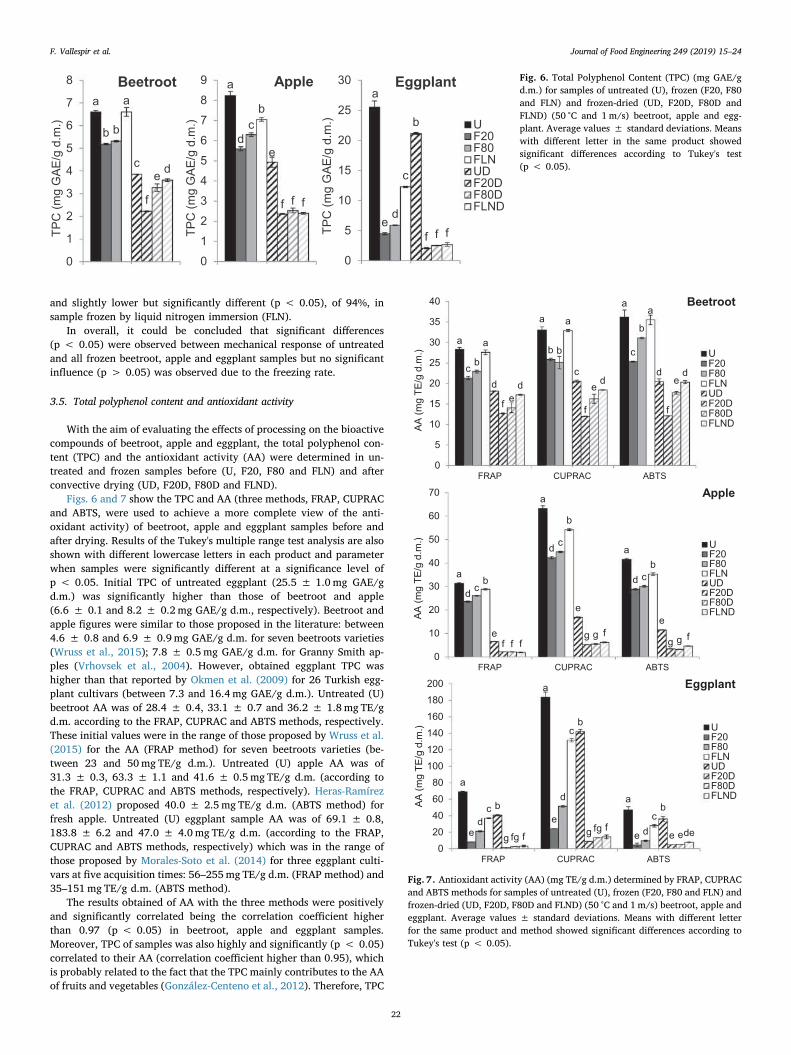
and slightly lower but significantly different (p < 0.05), of 94%, insample frozen by liquid nitrogen immersion (FLN).
In overall, it could be concluded that significant differences(p < 0.05) were observed between mechanical response of untreatedand all frozen beetroot, apple and eggplant samples but no significantinfluence (p > 0.05) was observed due to the freezing rate.
3.5. Total polyphenol content and antioxidant activity
With the aim of evaluating the effects of processing on the bioactivecompounds of beetroot, apple and eggplant, the total polyphenol con-tent (TPC) and the antioxidant activity (AA) were determined in un-treated and frozen samples before (U, F20, F80 and FLN) and afterconvective drying (UD, F20D, F80D and FLND).
Figs. 6 and 7 show the TPC and AA (three methods, FRAP, CUPRACand ABTS, were used to achieve a more complete view of the anti-oxidant activity) of beetroot, apple and eggplant samples before andafter drying. Results of the Tukey's multiple range test analysis are alsoshown with different lowercase letters in each product and parameterwhen samples were significantly different at a significance level ofp < 0.05. Initial TPC of untreated eggplant (25.5 ± 1.0mg GAE/gd.m.) was significantly higher than those of beetroot and apple(6.6 ± 0.1 and 8.2 ± 0.2mg GAE/g d.m., respectively). Beetroot andapple figures were similar to those proposed in the literature: between4.6 ± 0.8 and 6.9 ± 0.9mg GAE/g d.m. for seven beetroots varieties(Wruss et al., 2015); 7.8 ± 0.5 mg GAE/g d.m. for Granny Smith ap-ples (Vrhovsek et al., 2004). However, obtained eggplant TPC washigher than that reported by Okmen et al. (2009) for 26 Turkish egg-plant cultivars (between 7.3 and 16.4 mg GAE/g d.m.). Untreated (U)beetroot AA was of 28.4 ± 0.4, 33.1 ± 0.7 and 36.2 ± 1.8mg TE/gd.m. according to the FRAP, CUPRAC and ABTS methods, respectively.These initial values were in the range of those proposed by Wruss et al.(2015) for the AA (FRAP method) for seven beetroots varieties (be-tween 23 and 50mg TE/g d.m.). Untreated (U) apple AA was of31.3 ± 0.3, 63.3 ± 1.1 and 41.6 ± 0.5mg TE/g d.m. (according tothe FRAP, CUPRAC and ABTS methods, respectively). Heras-Ramírezet al. (2012) proposed 40.0 ± 2.5mg TE/g d.m. (ABTS method) forfresh apple. Untreated (U) eggplant sample AA was of 69.1 ± 0.8,183.8 ± 6.2 and 47.0 ± 4.0mg TE/g d.m. (according to the FRAP,CUPRAC and ABTS methods, respectively) which was in the range ofthose proposed by Morales-Soto et al. (2014) for three eggplant culti-vars at five acquisition times: 56–255mg TE/g d.m. (FRAP method) and35–151mg TE/g d.m. (ABTS method).
The results obtained of AA with the three methods were positivelyand significantly correlated being the correlation coefficient higherthan 0.97 (p < 0.05) in beetroot, apple and eggplant samples.Moreover, TPC of samples was also highly and significantly (p < 0.05)correlated to their AA (correlation coefficient higher than 0.95), whichis probably related to the fact that the TPC mainly contributes to the AAof fruits and vegetables (González-Centeno et al., 2012). Therefore, TPC
a
b b
a
c
f
e d
0
1
2
3
4
5
6
7
8
TPC(mgGAE/gd.m.)
Beetroot a
dcb
e
f f f
0123456789
TPC(mgGAE/gd.m.)
Applea
ed
c
b
f f f
0
5
10
15
20
25
30
TPC(mgGAE/gd.m.)
Eggplant
UF20F80FLNUDF20DF80DFLND
Fig. 6. Total Polyphenol Content (TPC) (mg GAE/gd.m.) for samples of untreated (U), frozen (F20, F80and FLN) and frozen-dried (UD, F20D, F80D andFLND) (50 °C and 1m/s) beetroot, apple and egg-plant. Average values ± standard deviations. Meanswith different letter in the same product showedsignificant differences according to Tukey's test(p < 0.05).
a
aa
c
b cb
b
ba
aa
dc d
f f fe
eed dd
0
5
10
15
20
25
30
35
40
FRAP CUPRAC ABTS
AA(mgTE/gd.m.)
Beetroot
UF20F80FLNUDF20DF80DFLND
a
a
a
d
d
dc
c
cb
b
b
e
ee
fg
gfg gff f
0
10
20
30
40
50
60
70
FRAP CUPRAC ABTS
AA(mgTE/gd.m.)
Apple
UF20F80FLNUDF20DF80DFLND
a
a
a
ee
ed
d
d
c
c
cb
b
b
g g efgfg eff de
020406080100120140160180200
FRAP CUPRAC ABTS
AA(mgTE/gd.m.)
Eggplant
UF20F80FLNUDF20DF80DFLND
Fig. 7. Antioxidant activity (AA) (mg TE/g d.m.) determined by FRAP, CUPRACand ABTS methods for samples of untreated (U), frozen (F20, F80 and FLN) andfrozen-dried (UD, F20D, F80D and FLND) (50 °C and 1m/s) beetroot, apple andeggplant. Average values ± standard deviations. Means with different letterfor the same product and method showed significant differences according toTukey's test (p < 0.05).
F. Vallespir et al. Journal of Food Engineering 249 (2019) 15–24
22104

and AA results are discussed simultaneously, AA being discussed byusing only the FRAP method.
Initial TPC and AA of untreated beetroot significantly (p < 0.05)decreased (19–22% and 19–25% in TPC and AA, respectively) whensamples were frozen at−20 °C (F20) or at−80 °C (F80). However, TPCand AA of beetroot sample frozen by liquid nitrogen immersion (FLN)were not significantly different (p > 0.05) to those of untreated beet-root (U). TPC and AA of apple significantly (p < 0.05) decreased(23–32 and 17–25% in TPC and AA, respectively) when samples werefrozen at −20 °C (F20) or at −80 °C (F80), meanwhile significant(p < 0.05) but lower decreases (4% in TPC and 18% in AA) wereobserved when samples were frozen by liquid nitrogen immersion(FLN). Similarly, in the case of eggplant, TPC and AA of untreatedsample significantly (p < 0.05) decreased (77–82% in TPC and69–88% in AA) when samples were frozen at−20 °C or at−80 °C beingsample frozen by liquid nitrogen immersion (FLN) the one which ex-hibited the lowest but significant (p < 0.05) decrease (46% in TPC and52% in AA).
In general, freezing promoted important TPC and AA losses. It seemsthat the transformation of liquid water into ice leaded to a variety ofpotential stress mechanisms for vegetable tissues due to several factorssuch as volumetric change of water converting into ice, the spatialdistribution of ice within the system and the size of individual icecrystals which may deteriorate frozen products quality (Paciulli et al.,2015). Thereby, the growing of ice crystals may break the cellular wallsand promote bioactive compounds losses and/or oxidations. Freezingpre-treatment at −20 and −40 °C have also been reported to decreaseTPC in strawberry (Oszmiański et al., 2009) and AA according to ABTSand FRAP method in asparagus, zucchini and green beans (Paciulliet al., 2015), respectively. Moreover, the impact of freezing on productquality depends on the type of product and the freezing rate(Chassagne-Berces et al., 2009). Thus, different TPC and AA decreaseswere observed for each product (beetroot, apple and eggplant) and foreach freezing pre-treatment used (F20, F80 and FLN). Frozen samplesby liquid nitrogen immersion (FLN) presented the lowest TPC and AAdecreases compared with untreated corresponding samples (U). Thus,fast freezing (FLN) promoted lower TPC and AA decreases than slow-medium freezing (F20 and F80). A similar trend was reported byHolzwarth et al. (2012) in strawberry since lower TPC was obtainedafter freezing treatment at −20 °C than by liquid nitrogen immersion.
Convective drying process usually causes intensive oxidation due tolong exposition to hot air (Figiel, 2010). In the present study, the TPCand AA significantly decreased in all samples after drying: TPC de-creased by 42%, 40% and 17%, and AA decreased by 36%, 79% and41%, in beetroot, apple and eggplant, respectively. Lower decreasesthan the observed in the present study have been reported for beetrootdrying by others researchers’ work. TPC and AA (ABTS method) de-creased both ca. 22% after drying at 80 °C during 6 h (Raupp et al.,2011). AA (FRAP method) decreased ca. 30% after drying at 60 °C and1.8 m/s (Figiel, 2010) and AA (ABTS method) decreased a 35% afterdrying at 50 °C and 0.2 m/s (Gokhale and Lele, 2014). For apple, higherTPC decrease (75%) and similar AA (ABTS method) decrease (63%)were reported by Vega-Gálvez et al. (2012) and Heras-Ramírez et al.(2012) after apple drying at 40–60 °C and 1m/s and at 50 °C and 3m/s,respectively. However, lower TPC and AA (FRAP and CUPRACmethods) decreases of 27 and 32–46% after apple drying at 50 °C and1m/s were reported by Rodríguez et al. (2014).
Moreover, TPC and AA losses during drying were much higher infrozen samples (F20D, F80D and FLND) which exhibited TPC decreasesof 39%, 69% and 83%, and AA decreases of 67%, 94% and 98%, inbeetroot, apple and eggplant samples, respectively, compared withuntreated sample (U). Lower TPC decreases (20–51%) were reported byKetata et al. (2013) when blueberries were frozen by liquid nitrogenimmersion during 24–30 s and osmotically dried in a sucrose solution at60 °Brix and 40 °C. Those TPC decreases were higher than the TPCdecreases of samples osmotically dried without pre-treatment (3–8%),
as it was also observed in the present study.
4. Conclusions
The main conclusion that can be obtained from this study is thatfreezing pre-treatment before drying affects differently depending onboth the freezing rate and the original microstructure of the vegetal.The magnitude of the drying time reduction was higher in the mostporous vegetable (eggplant), and lower in the less porous one (beet-root). Moreover, freezing by immersion in liquid nitrogen had lessimpact in the drying time of beetroot and eggplant than freezing at−20and −80 °C. Drying time of apple was similarly affected by the threefreezing methods.
Differences between untreated and frozen beetroot, apple and egg-plant samples microstructure were significant before and after dryingdue to disruptions and fissures caused by ice crystals growing.However, minor differences were observed among frozen eggplantsamples before and after drying. Moreover, frozen samples presented amore damaged texture than the corresponding untreated samples. Nosignificant differences were observed among the texture of all frozenapple and eggplant samples and only minor differences were observedin beetroot between samples frozen by liquid nitrogen immersion and at−20 °C or at −80 °C. TPC and AA determinations of frozen samplespresented significantly lower values than corresponding untreatedsamples before and after drying. The freezing treatment by liquid ni-trogen immersion was the one that promoted lower losses, probablydue to a lower degradation and oxidation of bioactive compounds ofbeetroot apple and eggplant, such as polyphenols, during freezing anddrying process, respectively. In fact, TPC and AA of beetroot frozensamples by liquid nitrogen immersion were not significantly different tountreated sample before (TPC and AA) and after (AA) drying.
Therefore, in general, freezing pre-treatment by liquid nitrogenimmersion seemed to promote minor structure damage and less qualityparameters losses probably due to its fast freezing rate and smallcrystals formation (−144 ± 20 °C/min). Meanwhile, freezing pre-treatments at −20 and −80 °C promoted greater structure disordersand quality parameters losses, which could not be distinguished amongthemselves in parameters analysed due their slow and similar freezingrates (−0.8 ± 0.2 °C, −1.9 ± 0.4 °C/min).
Acknowledgements
The authors would like to acknowledge the financial support of theNational Institute of Research and Agro-Food Technology (INIA) andco-financed with ERDF funds (RTA2015-00060-C04-03), the FOGAIBA(AIA01/15 project), the Balearic Government for the research projectAAEE045/2017 co-financed with ERDF funds and the SpanishGovernment (MINECO) for the BES-2013-064131 fellowship.
References
AOAC, 2006. Moisture in Dried Fruits, sixteenth ed. Association of AnalyticalCommunities, Maryland.
Bonat Celli, G., Ghanem, A., Su-Ling Brooks, M., 2016. Influence of freezing process andfrozen storage on the quality of fruits and fruit products. Food Rev. Int. 32 (3),280–304.
Boukouvalas, C.J., Krokida, M., Maroulis, Z., Marinos-Kouris, D., 2006. Density andporosity: literature data compilation for foodstuffs. Int. J. Food Prop. 9 (4), 715–746.
Carpenter, A.E., Jones, T.R., Lamprecht, M.R., Clarke, C., Kang, I.H., Friman, O., Guertin,D.A., Chang, J.H., Lindquist, R.A., Moffat, J., Golland, P., Sabatini, D.M., 2006.CellProfiler: image analysis software for identifying and quantifying cell phenotypes.Genome Biol. 7 (10), R100.
Ceballos, A.M., Giraldo, G.I., Orrego, C.E., 2012. Effect of freezing rate on quality para-meters of freeze dried soursop fruit pulp. J. Food Eng. 111 (2), 360–365.
Chassagne-Berces, S., Fonseca, F., Citeau, M., Marin, M., 2010. Freezing protocol effect onquality properties of fruit tissue according to the fruit, the variety and the stage ofmaturity. LWT - Food Sci. Technol. (Lebensmittel-Wissenschaft -Technol.) 43 (9),1441–1449.
Chassagne-Berces, S., Poirier, C., Devaux, M.-F., Fonseca, F., Lahaye, M., Pigorini, G.,Girault, C., Marin, M., Guillon, F., 2009. Changes in texture, cellular structure and
F. Vallespir et al. Journal of Food Engineering 249 (2019) 15–24
23105
cell wall composition in apple tissue as a result of freezing. Food Res. Int. 42 (7),788–797.
Chiralt, A., Martınez-Navarrete, N., Martınez-Monzó, J., Talens, P., Moraga, G., Ayala, A.,Fito, P., 2001. Changes in mechanical properties throughout osmotic processes:cryoprotectant effect. J. Food Eng. 49 (2), 129–135.
Chung, H.-S., Kim, D.-S., Kim, H.-S., Lee, Y.-G., Seong, J.-H., 2013. Effect of freezingpretreatment on the quality of juice extracted from Prunus mume fruit by osmosis withsucrose. LWT - Food Sci. Technol. (Lebensmittel-Wissenschaft -Technol.) 54 (1),30–34.
Dandamrongrak, R., Young, G., Mason, R., 2002. Evaluation of various pre-treatments forthe dehydration of banana and selection of suitable drying models. J. Food Eng. 55(2), 139–146.
Delgado, A.E., Rubiolo, A.C., 2005. Microstructural changes in strawberry after freezingand thawing processes. LWT - Food Sci. Technol. (Lebensmittel-Wissenschaft-Technol.) 38 (2), 135–142.
Eim, V.S., Urrea, D., Rosselló, C., García-Pérez, J.V., Femenia, A., Simal, S., 2013.Optimization of the drying process of carrot (Daucus carota v. Nantes) on the basis ofquality criteria. Dry. Technol. 31 (8), 951–962.
Eshtiaghi, M.N., Stute, R., Knorr, D., 1994. High-pressure and freezing pretreatment ef-fects on drying, rehydration, texture and color of green beans, carrots and potatoes. J.Food Sci. 59 (6), 1168–1170.
Figiel, A., 2010. Drying kinetics and quality of beetroots dehydrated by combination ofconvective and vacuum-microwave methods. J. Food Eng. 98 (4), 461–470.
Gajewski, M., Arasimowicz, D., 2004. Sensory quality of eggplant fruits (Solanum mel-ongena L.) as affected by cultivar and maturity stage. Pol. J. Food Nutr. Sci. 13 (3),249–254.
García-Pérez, J.V., Cárcel, J.A., Riera, E., Rosselló, C., Mulet, A., 2012. Intensification oflow-temperature drying by using ultrasound. Dry. Technol. 30 (11–12), 1199–1208.
Gengatharan, A., Dykes, G.A., Choo, W.S., 2015. Betalains: natural plant pigments withpotential application in functional foods. LWT - Food Sci. Technol. (Lebensmittel-Wissenschaft -Technol.) 64 (2), 645–649.
Gokhale, S.V., Lele, S.S., 2014. Betalain content and antioxidant activity of Beta vulgaris:effect of hot air convective drying and storage. J. Food Process. Preserv. 38 (1),585–590.
González-Centeno, M.R., Jourdes, M., Femenia, A., Simal, S., Rosselló, C., Teissedre, P.-L.,2012. Proanthocyanidin composition and antioxidant potential of the stem wine-making byproducts from 10 different grape varieties (Vitis vinifera L.). J. Agric. FoodChem. 60 (48), 11850–11858.
Haiying, W., Shaozhi, Z., Guangming, C., 2007. Experimental study on the freezingcharacteristics of four kinds of vegetables. LWT - Food Sci. Technol. (Lebensmittel-Wissenschaft -Technol.) 40 (6), 1112–1116.
Harnkarnsujarit, N., Kawai, K., Watanabe, M., Suzuki, T., 2016. Effects of freezing onmicrostructure and rehydration properties of freeze-dried soybean curd. J. Food Eng.184, 10–20.
Heras-Ramírez, M.E., Quintero-Ramos, A., Camacho-Dávila, A.A., Barnard, J., Talamás-Abbud, R., Torres-Muñoz, J.V., Salas-Muñoz, E., 2012. Effect of blanching and dryingtemperature on polyphenolic compound stability and antioxidant capacity of applepomace. Food Bioprocess Technol. 5 (6), 2201–2210.
Heredia, J.B., Cisneros-Zevallos, L., 2009. The effects of exogenous ethylene and methyljasmonate on the accumulation of phenolic antioxidants in selected whole andwounded fresh produce. Food Chem. 115 (4), 1500–1508.
Holzwarth, M., Korhummel, S., Carle, R., Kammerer, D.R., 2012. Evaluation of the effectsof different freezing and thawing methods on color, polyphenol and ascorbic acidretention in strawberries (Fragaria×ananassa Duch.). Food Res. Int. 48 (1), 241–248.
Howard, L.A., Wong, A.D., Perry, A.K., Klein, B.P., 1999. β-Carotene and ascorbic acidretention in fresh and processed vegetables. J. Food Sci. 64 (5), 929–936.
Hung, P., Duy, T., 2012. Effects of drying methods on bioactive compounds of vegetablesand correlation between bioactive compounds and their antioxidants. InternationalFood Research Journal 19 (1), 327–332.
Junqueira, J.R.d.J., Corrêa, J.L.G., de Mendonça, K.S., Resende, N.S., de Barros VilasBoas, E.V., 2017a. Influence of sodium replacement and vacuum pulse on the osmoticdehydration of eggplant slices. Innovat. Food Sci. Emerg. Technol. 41 (Suppl. C),10–18.
Junqueira, J.R.d.J., Corrêa, J.L.G., de Oliveira, H.M., Ivo Soares Avelar, R., Salles Pio,L.A., 2017b. Convective drying of cape gooseberry fruits: effect of pretreatments onkinetics and quality parameters. LWT - Food Sci. Technol. (Lebensmittel-Wissenschaft-Technol.) 82 (Suppl. C), 404–410.
Kaleta, A., Górnicki, K., 2010. Some remarks on evaluation of drying models of red beetparticles. Energy Convers. Manag. 51 (12), 2967–2978.
Ketata, M., Desjardins, Y., Ratti, C., 2013. Effect of liquid nitrogen pretreatments on os-motic dehydration of blueberries. J. Food Eng. 116 (1), 202–212.
Lewicki, P.P., 2006. Design of hot air drying for better foods. Trends Food Sci. Technol. 17(4), 153–163.
Luthria, D.L., 2012. A simplified UV spectral scan method for the estimation of phenolicacids and antioxidant capacity in eggplant pulp extracts. Journal of Functional Foods4 (1), 238–242.
Mayor, L., Pissarra, J., Sereno, A., 2008. Microstructural changes during osmotic dehy-dration of parenchymatic pumpkin tissue. J. Food Eng. 85 (3), 326–339.
Morales-Soto, A., García-Salas, P., Rodríguez-Pérez, C., Jiménez-Sánchez, C., Cádiz-Gurrea, M.d.l.L., Segura-Carretero, A., Fernández-Gutiérrez, A., 2014. Antioxidantcapacity of 44 cultivars of fruits and vegetables grown in Andalusia (Spain). FoodRes. Int. 58, 35–46.
Mrkić, V., Ukrainczyk, M., Tripalo, B., 2007. Applicability of moisture transfer Bi–Dicorrelation for convective drying of broccoli. J. Food Eng. 79 (2), 640–646.
Nayak, C.A., Suguna, K., Narasimhamurthy, K., Rastogi, N.K., 2007. Effect of gammairradiation on histological and textural properties of carrot, potato and beetroot. J.Food Eng. 79 (3), 765–770.
Nieto, A.B., Vicente, S., Hodara, K., Castro, M.A., Alzamora, S.M., 2013. Osmotic dehy-dration of apple: influence of sugar and water activity on tissue structure, rheologicalproperties and water mobility. J. Food Eng. 119 (1), 104–114.
Nistor, O.-V., Seremet, L., Andronoiu, D.G., Rudi, L., Botez, E., 2017. Influence of differentdrying methods on the physicochemical properties of red beetroot (Beta vulgaris L.var. Cylindra). Food Chem. 236, 59–67.
Nowak, D., Piechucka, P., Witrowa-Rajchert, D., Wiktor, A., 2016. Impact of materialstructure on the course of freezing and freeze-drying and on the properties of driedsubstance, as exemplified by celery. J. Food Eng. 180 (Suppl. C), 22–28.
Okmen, B., Sigva, H.O., Mutlu, S., Doganlar, S., Yemenicioglu, A., Frary, A., 2009. Totalantioxidant activity and total phenolic contents in different Turkish eggplant(Solanum melongena L.) cultivars. Int. J. Food Prop. 12 (3), 616–624.
Oszmiański, J., Wojdyło, A., Kolniak, J., 2009. Effect of l-ascorbic acid, sugar, pectin andfreeze–thaw treatment on polyphenol content of frozen strawberries. LWT - Food Sci.Technol. (Lebensmittel-Wissenschaft -Technol.) 42 (2), 581–586.
Paciulli, M., Ganino, T., Pellegrini, N., Rinaldi, M., Zaupa, M., Fabbri, A., Chiavaro, E.,2015. Impact of the industrial freezing process on selected vegetables — Part I.Structure, texture and antioxidant capacity. Food Res. Int. 74, 329–337.
Paciulli, M., Medina-Meza, I.G., Chiavaro, E., Barbosa-Cánovas, G.V., 2016. Impact ofthermal and high pressure processing on quality parameters of beetroot (Beta vulgarisL.). LWT - Food Sci. Technol. (Lebensmittel-Wissenschaft -Technol.) 68, 98–104.
Phothiset, S., Charoenrein, S., 2014. Effects of freezing and thawing on texture, micro-structure and cell wall composition changes in papaya tissues. J. Sci. Food Agric. 94(2), 189–196.
Ramírez, C., Troncoso, E., Muñoz, J., Aguilera, J.M., 2011. Microstructure analysis onpre-treated apple slices and its effect on water release during air drying. J. Food Eng.106 (3), 253–261.
Raupp, D.d.S., Rodrigues, E., Rockenbach, I.I., Carbonar, A., Campos, P.F.d., Borsato,A.V., Fett, R., 2011. Effect of processing on antioxidant potential and total phenolicscontent in beet (Beta vulgaris L.). Food Sci. Technol. 31 (3), 688–693.
Rodríguez, Ó., Santacatalina, J.V., Simal, S., Garcia-Perez, J.V., Femenia, A., Rosselló, C.,2014. Influence of power ultrasound application on drying kinetics of apple and itsantioxidant and microstructural properties. J. Food Eng. 129, 21–29.
Russo, P., Adiletta, G., Di Matteo, M., 2013. The influence of drying air temperature onthe physical properties of dried and rehydrated eggplant. Food Bioprod. Process. 91(3), 249–256.
Seremet, L., Botez, E., Nistor, O.-V., Andronoiu, D.G., Mocanu, G.-D., 2016. Effect ofdifferent drying methods on moisture ratio and rehydration of pumpkin slices. FoodChem. 195, 104–109.
Shynkaryk, M.V., Lebovka, N.I., Vorobiev, E., 2008. Pulsed electric fields and temperatureeffects on drying and rehydration of red beetroots. Dry. Technol. 26 (6), 695–704.
Sosa, N., Salvatori, D., Schebor, C., 2012. Physico-chemical and mechanical properties ofapple disks subjected to osmotic dehydration and different drying methods. FoodBioprocess Technol. 5 (5), 1790–1802.
Vallespir, F., Rodríguez, Ó., Eim, V.S., Rosselló, C., Simal, S., 2018. Freezing pre-treat-ments on the intensification of the drying process of vegetables with differentstructures. J. Food Eng. 239, 83–91.
Varela, P., Salvador, A., Fiszman, S., 2007. Changes in apple tissue with storage time:rheological, textural and microstructural analyses. J. Food Eng. 78 (2), 622–629.
Vega-Gálvez, A., Ah-Hen, K., Chacana, M., Vergara, J., Martínez-Monzó, J., García-Segovia, P., Lemus-Mondaca, R., Di Scala, K., 2012. Effect of temperature and airvelocity on drying kinetics, antioxidant capacity, total phenolic content, colour,texture and microstructure of apple (var. Granny Smith) slices. Food Chem. 132 (1),51–59.
Vrhovsek, U., Rigo, A., Tonon, D., Mattivi, F., 2004. Quantitation of polyphenols in dif-ferent apple varieties. J. Agric. Food Chem. 52 (21), 6532–6538.
Wruss, J., Waldenberger, G., Huemer, S., Uygun, P., Lanzerstorfer, P., Müller, U.,Höglinger, O., Weghuber, J., 2015. Compositional characteristics of commercialbeetroot products and beetroot juice prepared from seven beetroot varieties grown inUpper Austria. J. Food Compos. Anal. 42, 46–55.
Wu, J., Gao, H., Zhao, L., Liao, X., Chen, F., Wang, Z., Hu, X., 2007. Chemical compo-sitional characterization of some apple cultivars. Food Chem. 103 (1), 88–93.
Zielinska, M., Sadowski, P., Błaszczak, W., 2015. Freezing/thawing and microwave-as-sisted drying of blueberries (Vaccinium corymbosum L.). LWT - Food Sci. Technol.(Lebensmittel-Wissenschaft -Technol.) 62 (1), 555–563 Part 2.
F. Vallespir et al. Journal of Food Engineering 249 (2019) 15–24
24106

CHAPTER 2
Hot-air drying intensification by using freezing pre-treatment and ultrasound application:
Improvement of mass transfer by freezing pre-treatment and ultrasound application on the convective drying of beetroot (Beta vulgaris L.)
Francisca Vallespir, Juan A. Cárcel, Francesco Marra, Valeria S. Eim, Susana Simal
Food and Bioprocess Technology DOI: 10.1007/s11947-017-1999-8
Accepted and published Impact factor (2017): 2.998
Food Science & Technology (Q1)
107

108
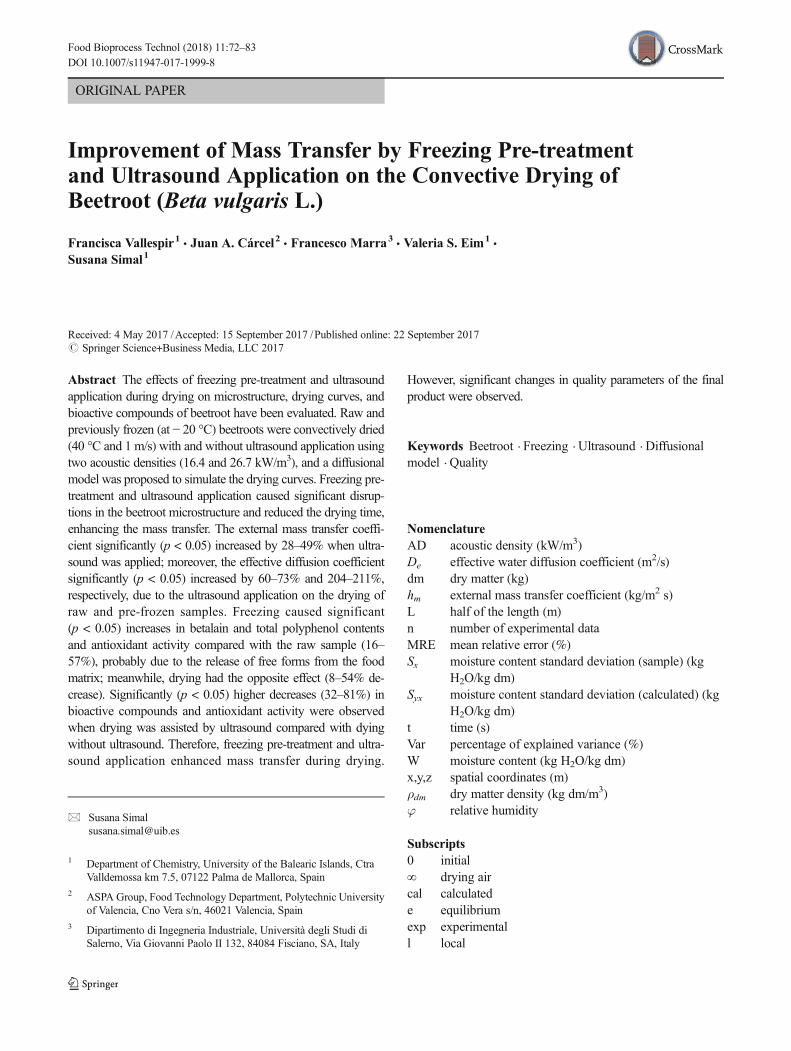
ORIGINAL PAPER
Improvement of Mass Transfer by Freezing Pre-treatmentand Ultrasound Application on the Convective Drying ofBeetroot (Beta vulgaris L.)
Francisca Vallespir1 & Juan A. Cárcel2 & Francesco Marra3 & Valeria S. Eim1&
Susana Simal1
Received: 4 May 2017 /Accepted: 15 September 2017 /Published online: 22 September 2017# Springer Science+Business Media, LLC 2017
Abstract The effects of freezing pre-treatment and ultrasoundapplication during drying on microstructure, drying curves, andbioactive compounds of beetroot have been evaluated. Raw andpreviously frozen (at − 20 °C) beetroots were convectively dried(40 °C and 1 m/s) with and without ultrasound application usingtwo acoustic densities (16.4 and 26.7 kW/m3), and a diffusionalmodel was proposed to simulate the drying curves. Freezing pre-treatment and ultrasound application caused significant disrup-tions in the beetroot microstructure and reduced the drying time,enhancing the mass transfer. The external mass transfer coeffi-cient significantly (p < 0.05) increased by 28–49% when ultra-sound was applied; moreover, the effective diffusion coefficientsignificantly (p < 0.05) increased by 60–73% and 204–211%,respectively, due to the ultrasound application on the drying ofraw and pre-frozen samples. Freezing caused significant(p < 0.05) increases in betalain and total polyphenol contentsand antioxidant activity compared with the raw sample (16–57%), probably due to the release of free forms from the foodmatrix; meanwhile, drying had the opposite effect (8–54% de-crease). Significantly (p < 0.05) higher decreases (32–81%) inbioactive compounds and antioxidant activity were observedwhen drying was assisted by ultrasound compared with dyingwithout ultrasound. Therefore, freezing pre-treatment and ultra-sound application enhanced mass transfer during drying.
However, significant changes in quality parameters of the finalproduct were observed.
Keywords Beetroot . Freezing . Ultrasound . Diffusionalmodel . Quality
NomenclatureAD acoustic density (kW/m3)De effective water diffusion coefficient (m2/s)dm dry matter (kg)hm external mass transfer coefficient (kg/m2 s)L half of the length (m)n number of experimental dataMRE mean relative error (%)Sx moisture content standard deviation (sample) (kg
H2O/kg dm)Syx moisture content standard deviation (calculated) (kg
H2O/kg dm)t time (s)Var percentage of explained variance (%)W moisture content (kg H2O/kg dm)x,y,z spatial coordinates (m)ρdm dry matter density (kg dm/m3)φ relative humidity
Subscripts0 initial∞ drying aircal calculatede equilibriumexp experimentall local
* Susana [email protected]
1 Department of Chemistry, University of the Balearic Islands, CtraValldemossa km 7.5, 07122 Palma de Mallorca, Spain
2 ASPA Group, Food Technology Department, Polytechnic Universityof Valencia, Cno Vera s/n, 46021 Valencia, Spain
3 Dipartimento di Ingegneria Industriale, Università degli Studi diSalerno, Via Giovanni Paolo II 132, 84084 Fisciano, SA, Italy
Food Bioprocess Technol (2018) 11:72–83DOI 10.1007/s11947-017-1999-8
109
Introduction
Beetroot contains polyphenols and two main betalain pig-ments: betaxanthins (yellow-orange) and betacyanins (red-violet) (Paciulli et al. 2016) which, apart from being colored,also have high antioxidant potential (Gengatharan et al. 2015).Although the most common preparations of beetroot areboiled or juice (Wootton-Beard and Ryan 2011), some newproducts have recently been studied, such as freeze and heat-dried beetroot (Figiel 2010; Kaleta and Górnicki 2010), driedpowders processed by spray-drying, air-drying, or freeze-drying (Wruss et al. 2015), and juice microcapsules obtainedby spray-drying (Janiszewska 2014). All these processes in-volve drying the sample in order to stabilize the product.
Convective drying is the most frequently used drying oper-ation in the food and chemical industry (Samoticha et al. 2016).However, drying causes changes in the nutritional, physical,and chemical properties of fruits, vegetables, and their products(Onwude et al. 2016). These changes need to be carefully eval-uated. Most of them, although observed at a macroscopic level,are caused by changes occurring at a microstructural/cellularlevel (Mayor et al. 2008). Therefore, microstructural changesalso need to be studied when fruits and vegetables are dried.Different authors (Gokhale and Lele 2014; Székely et al. 2016;Nistor et al. 2017) have observed considerable changes in themicrostructure and composition of bioactive compounds inbeetroot depending on the drying conditions.
In order to intensify the drying process, many different pre-treatmentmethodologies have been proposed.Among them, freez-ing pre-treatment has been reported to enhance fruit and vegetabledrying (Lewicki 2006). Freezing treatment (between − 18 and− 28 °C) prior to drying has been reported to reduce the dryingtime and, consequently, energy consumption, in the convectivedrying of green beans, carrots, and potatoes at 70 °C (Eshtiaghiet al. 1994); rice microwave vibro-fluidized bed drying at 110–185 °C (Sripinyowanich and Noomhorm 2013); blueberries con-vective drying at 60–80 °C (Zielinska et al. 2015); carrots convec-tive drying at 60 °C (Ando et al. 2016); among others. Freezingtreatment might cause disruption of tissue structure which wouldlead to physico-chemical changes of the material, such as higherwater absorption capacity (Lewicki 2006).At the same time, short-ening the drying time reduces thermal exposure of the material,and consequently nutritional value could be better preserved.Studies of beetroot freezing before drying have not been foundin the literature. However, osmotic dehydration pre-treatment andultrasound pre-treatment have been reported to intensify beetrootconvective drying at 60 and 70 °C, respectively (Fijalkowska et al.2015; Kowalski and Łechtańska 2015). Kowalski and Łechtańska(2015) observed that osmotic dehydration pre-treatment in 5 and15% of NaCl solution for 30, 60, and 90 min shortened (20–32%) the beetroot drying time at 60 °C and 1.2 m/s whilepresenting better quality parameters such as rehydration ca-pacity, color, and betanin retention. Meanwhile, Fijalkowska
et al. (2015) concluded that ultrasound pre-treatment using afrequency of 21 kHz during 10, 20, and 30 min reduced thedrying time (5–9%) and the energy input (11–14%), and pre-sented higher color parameters and betalain content.
Ultrasound application in a drying system may overcomesome of the limitations of convective drying by increasing thedrying rate. Mainly at low temperature (less than 50 °C) (García-Pérez et al. 2006) and at low air velocities (less than 4 m/s)(Cárcel et al. 2007). Ultrasound application effects during hot-air drying of many products have been previously studied. Themechanical energy provided by the ultrasound application pro-motes alternating compressions and expansions which have asimilar effect to that observed when a sponge is squeezed andreleased repeatedly—Bsponge effect^ (de la Fuente-Blanco et al.2006). This Bsponge effect^ helps to release liquid from the innerpart of a particle to its surface and promotes the suction of fluidfrom outside. The forces involved in this mechanism can behigher than the surface tension which maintains the water mole-cules inside the capillaries of the material, creating microscopicchannels and facilitating the exchange of matter. Thus, both in-ternal and external resistances to mass transfer would be en-hanced. No studies of the intensification of beetroot drying byultrasound assistance have been found in the literature, althoughmicrowave intensification of beetroot drying has already beenwidely discussed (Kaur and Singh 2014; Nistor et al. 2017).Kaur and Singh (2014) observed that microwave finish dryingat 540, 810, and 1080W reduced beetroot drying time at 55, 65,and 75 °C at a maximum of 44% for 1080 W and 75 °C.Moreover, these authors observed better rehydration properties,lesser color degradation, stiff texture, maximum total solublesolids, and safe water activity in final beetroot products. Nistoret al. (2017) observed that microwave (315 W) finish drying at40 °C enhanced the free convection beetroot drying at 50, 60,and 70 °C (40–52% of drying time reduction) and increasedbetacyanins, betaxanthins, and polyphenol contents and percentDPPH inhibition.
Therefore, the main objective of this study was to evaluatethe influence of the freezing pre-treatment and the ultrasoundapplication on the mass transfer in convective drying of beet-root cubes. For this purpose, the microstructure and also thedrying curves using a diffusional model have been studied;likewise, the changes in the betalain and total polyphenol con-tents and in the antioxidant activity in the food matrix due tofreezing pre-treatment and drying with ultrasound applicationhave been evaluated.
Materials and Methods
Sample Processing
The beetroot (Beta vulgaris var. conditiva) used in this study,purchased in a local market, was selected on a range of
Food Bioprocess Technol (2018) 11:72–83 73
110
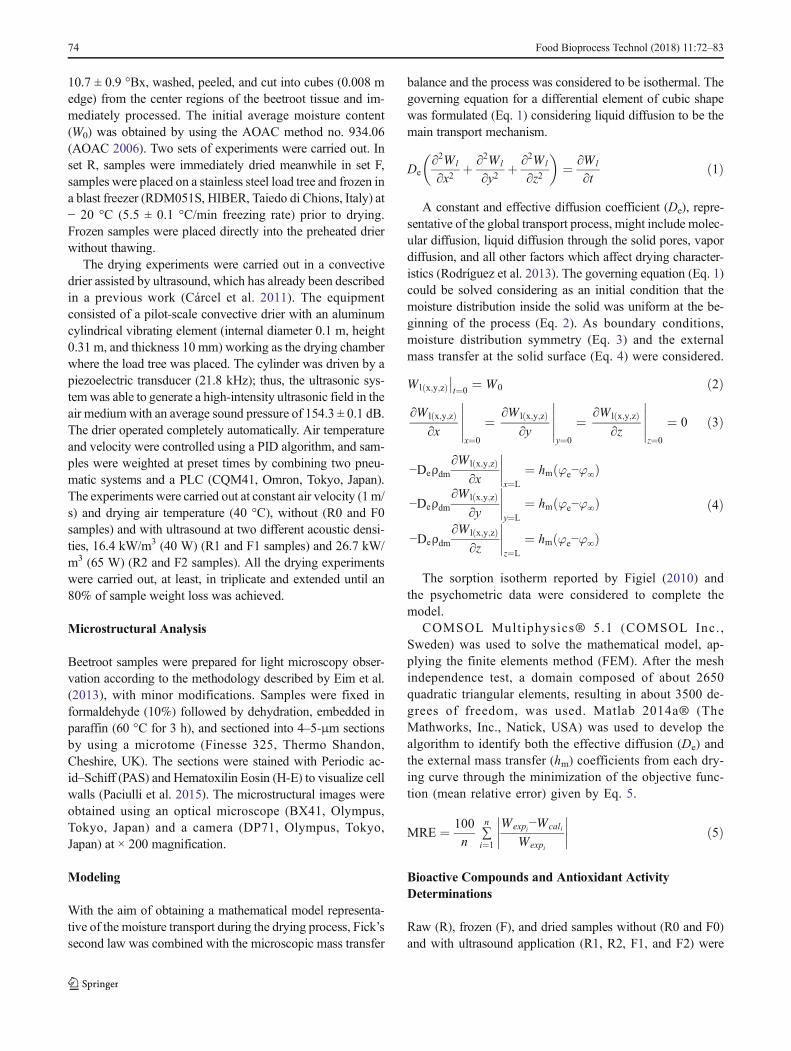
10.7 ± 0.9 °Bx, washed, peeled, and cut into cubes (0.008 medge) from the center regions of the beetroot tissue and im-mediately processed. The initial average moisture content(W0) was obtained by using the AOAC method no. 934.06(AOAC 2006). Two sets of experiments were carried out. Inset R, samples were immediately dried meanwhile in set F,samples were placed on a stainless steel load tree and frozen ina blast freezer (RDM051S, HIBER, Taiedo di Chions, Italy) at− 20 °C (5.5 ± 0.1 °C/min freezing rate) prior to drying.Frozen samples were placed directly into the preheated drierwithout thawing.
The drying experiments were carried out in a convectivedrier assisted by ultrasound, which has already been describedin a previous work (Cárcel et al. 2011). The equipmentconsisted of a pilot-scale convective drier with an aluminumcylindrical vibrating element (internal diameter 0.1 m, height0.31 m, and thickness 10 mm) working as the drying chamberwhere the load tree was placed. The cylinder was driven by apiezoelectric transducer (21.8 kHz); thus, the ultrasonic sys-temwas able to generate a high-intensity ultrasonic field in theair mediumwith an average sound pressure of 154.3 ± 0.1 dB.The drier operated completely automatically. Air temperatureand velocity were controlled using a PID algorithm, and sam-ples were weighted at preset times by combining two pneu-matic systems and a PLC (CQM41, Omron, Tokyo, Japan).The experiments were carried out at constant air velocity (1m/s) and drying air temperature (40 °C), without (R0 and F0samples) and with ultrasound at two different acoustic densi-ties, 16.4 kW/m3 (40 W) (R1 and F1 samples) and 26.7 kW/m3 (65 W) (R2 and F2 samples). All the drying experimentswere carried out, at least, in triplicate and extended until an80% of sample weight loss was achieved.
Microstructural Analysis
Beetroot samples were prepared for light microscopy obser-vation according to the methodology described by Eim et al.(2013), with minor modifications. Samples were fixed informaldehyde (10%) followed by dehydration, embedded inparaffin (60 °C for 3 h), and sectioned into 4–5-μm sectionsby using a microtome (Finesse 325, Thermo Shandon,Cheshire, UK). The sections were stained with Periodic ac-id–Schiff (PAS) and Hematoxilin Eosin (H-E) to visualize cellwalls (Paciulli et al. 2015). The microstructural images wereobtained using an optical microscope (BX41, Olympus,Tokyo, Japan) and a camera (DP71, Olympus, Tokyo,Japan) at × 200 magnification.
Modeling
With the aim of obtaining a mathematical model representa-tive of the moisture transport during the drying process, Fick’ssecond law was combined with the microscopic mass transfer
balance and the process was considered to be isothermal. Thegoverning equation for a differential element of cubic shapewas formulated (Eq. 1) considering liquid diffusion to be themain transport mechanism.
De∂2Wl
∂x2þ ∂2Wl
∂y2þ ∂2Wl
∂z2
� �¼ ∂Wl
∂tð1Þ
A constant and effective diffusion coefficient (De), repre-sentative of the global transport process, might include molec-ular diffusion, liquid diffusion through the solid pores, vapordiffusion, and all other factors which affect drying character-istics (Rodríguez et al. 2013). The governing equation (Eq. 1)could be solved considering as an initial condition that themoisture distribution inside the solid was uniform at the be-ginning of the process (Eq. 2). As boundary conditions,moisture distribution symmetry (Eq. 3) and the externalmass transfer at the solid surface (Eq. 4) were considered.
W l x;y;zð Þ��t¼0
¼ W0 ð2Þ∂W l x;y;zð Þ
∂x
�����x¼0
¼ ∂W l x;y;zð Þ∂y
�����y¼0
¼ ∂W l x;y;zð Þ∂z
�����z¼0
¼ 0 ð3Þ
−Deρdm∂W l x;y;zð Þ
∂x
����x¼L
¼ hm φe−φ∞ð Þ
−Deρdm∂W l x;y;zð Þ
∂y
����y¼L
¼ hm φe−φ∞ð Þ
−Deρdm∂W l x;y;zð Þ
∂z
����z¼L
¼ hm φe−φ∞ð Þ
ð4Þ
The sorption isotherm reported by Figiel (2010) andthe psychometric data were considered to complete themodel.
COMSOL Multiphysics® 5.1 (COMSOL Inc. ,Sweden) was used to solve the mathematical model, ap-plying the finite elements method (FEM). After the meshindependence test, a domain composed of about 2650quadratic triangular elements, resulting in about 3500 de-grees of freedom, was used. Matlab 2014a® (TheMathworks, Inc., Natick, USA) was used to develop thealgorithm to identify both the effective diffusion (De) andthe external mass transfer (hm) coefficients from each dry-ing curve through the minimization of the objective func-tion (mean relative error) given by Eq. 5.
MRE ¼ 100
n∑n
i¼1
Wexpi−Wcali
Wexpi
�������� ð5Þ
Bioactive Compounds and Antioxidant ActivityDeterminations
Raw (R), frozen (F), and dried samples without (R0 and F0)and with ultrasound application (R1, R2, F1, and F2) were
74 Food Bioprocess Technol (2018) 11:72–83
111
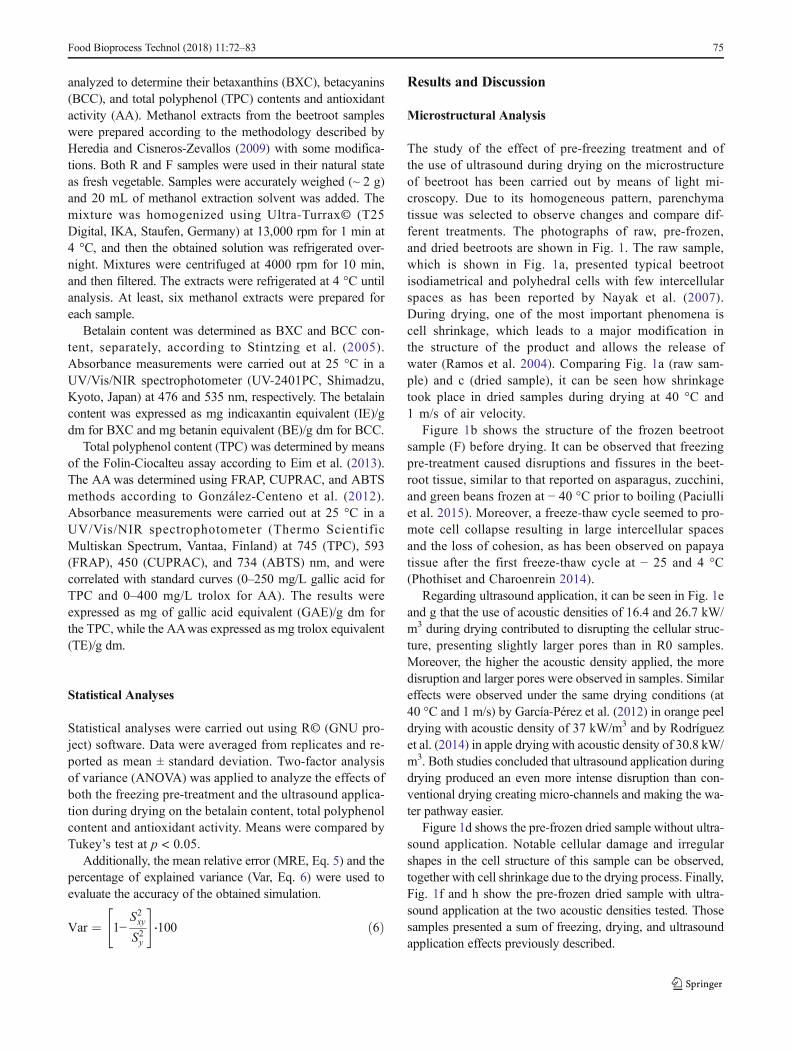
analyzed to determine their betaxanthins (BXC), betacyanins(BCC), and total polyphenol (TPC) contents and antioxidantactivity (AA). Methanol extracts from the beetroot sampleswere prepared according to the methodology described byHeredia and Cisneros-Zevallos (2009) with some modifica-tions. Both R and F samples were used in their natural stateas fresh vegetable. Samples were accurately weighed (~ 2 g)and 20 mL of methanol extraction solvent was added. Themixture was homogenized using Ultra-Turrax© (T25Digital, IKA, Staufen, Germany) at 13,000 rpm for 1 min at4 °C, and then the obtained solution was refrigerated over-night. Mixtures were centrifuged at 4000 rpm for 10 min,and then filtered. The extracts were refrigerated at 4 °C untilanalysis. At least, six methanol extracts were prepared foreach sample.
Betalain content was determined as BXC and BCC con-tent, separately, according to Stintzing et al. (2005).Absorbance measurements were carried out at 25 °C in aUV/Vis/NIR spectrophotometer (UV-2401PC, Shimadzu,Kyoto, Japan) at 476 and 535 nm, respectively. The betalaincontent was expressed as mg indicaxantin equivalent (IE)/gdm for BXC and mg betanin equivalent (BE)/g dm for BCC.
Total polyphenol content (TPC) was determined by meansof the Folin-Ciocalteu assay according to Eim et al. (2013).The AAwas determined using FRAP, CUPRAC, and ABTSmethods according to González-Centeno et al. (2012).Absorbance measurements were carried out at 25 °C in aUV/Vis/NIR spectrophotometer (Thermo ScientificMultiskan Spectrum, Vantaa, Finland) at 745 (TPC), 593(FRAP), 450 (CUPRAC), and 734 (ABTS) nm, and werecorrelated with standard curves (0–250 mg/L gallic acid forTPC and 0–400 mg/L trolox for AA). The results wereexpressed as mg of gallic acid equivalent (GAE)/g dm forthe TPC, while the AAwas expressed as mg trolox equivalent(TE)/g dm.
Statistical Analyses
Statistical analyses were carried out using R© (GNU pro-ject) software. Data were averaged from replicates and re-ported as mean ± standard deviation. Two-factor analysisof variance (ANOVA) was applied to analyze the effects ofboth the freezing pre-treatment and the ultrasound applica-tion during drying on the betalain content, total polyphenolcontent and antioxidant activity. Means were compared byTukey’s test at p < 0.05.
Additionally, the mean relative error (MRE, Eq. 5) and thepercentage of explained variance (Var, Eq. 6) were used toevaluate the accuracy of the obtained simulation.
Var ¼ 1−S2xyS2y
" #⋅100 ð6Þ
Results and Discussion
Microstructural Analysis
The study of the effect of pre-freezing treatment and ofthe use of ultrasound during drying on the microstructureof beetroot has been carried out by means of light mi-croscopy. Due to its homogeneous pattern, parenchymatissue was selected to observe changes and compare dif-ferent treatments. The photographs of raw, pre-frozen,and dried beetroots are shown in Fig. 1. The raw sample,which is shown in Fig. 1a, presented typical beetrootisodiametrical and polyhedral cells with few intercellularspaces as has been reported by Nayak et al. (2007).During drying, one of the most important phenomena iscell shrinkage, which leads to a major modification inthe structure of the product and allows the release ofwater (Ramos et al. 2004). Comparing Fig. 1a (raw sam-ple) and c (dried sample), it can be seen how shrinkagetook place in dried samples during drying at 40 °C and1 m/s of air velocity.
Figure 1b shows the structure of the frozen beetrootsample (F) before drying. It can be observed that freezingpre-treatment caused disruptions and fissures in the beet-root tissue, similar to that reported on asparagus, zucchini,and green beans frozen at − 40 °C prior to boiling (Paciulliet al. 2015). Moreover, a freeze-thaw cycle seemed to pro-mote cell collapse resulting in large intercellular spacesand the loss of cohesion, as has been observed on papayatissue after the first freeze-thaw cycle at − 25 and 4 °C(Phothiset and Charoenrein 2014).
Regarding ultrasound application, it can be seen in Fig. 1eand g that the use of acoustic densities of 16.4 and 26.7 kW/m3 during drying contributed to disrupting the cellular struc-ture, presenting slightly larger pores than in R0 samples.Moreover, the higher the acoustic density applied, the moredisruption and larger pores were observed in samples. Similareffects were observed under the same drying conditions (at40 °C and 1 m/s) by García-Pérez et al. (2012) in orange peeldrying with acoustic density of 37 kW/m3 and by Rodríguezet al. (2014) in apple drying with acoustic density of 30.8 kW/m3. Both studies concluded that ultrasound application duringdrying produced an even more intense disruption than con-ventional drying creating micro-channels and making the wa-ter pathway easier.
Figure 1d shows the pre-frozen dried sample without ultra-sound application. Notable cellular damage and irregularshapes in the cell structure of this sample can be observed,together with cell shrinkage due to the drying process. Finally,Fig. 1f and h show the pre-frozen dried sample with ultra-sound application at the two acoustic densities tested. Thosesamples presented a sum of freezing, drying, and ultrasoundapplication effects previously described.
Food Bioprocess Technol (2018) 11:72–83 75
112

Drying Kinetics
The initial moisture content of raw beetroot in this study, of8.7 ± 0.1 kg/kg dm was within the range proposed in theliterature by Kaleta and Górnicki (2010) (between 6 and8 kg/kg dm) and by Figiel (2010) (10.2 kg/kg dm) for thesame vegetable. No significant differences (p > 0.05) wereobserved between the initial moisture content of raw and
frozen samples; thus, it was not significantly changed by thefreezing pre-treatment, as has also been reported after thefreezing at − 20 °C of blueberries (Zielinska et al. 2015).
Figure 2 shows the experimental drying curves obtained forraw and pre-frozen beetroot cubes with and without ultra-sound application at 40 °C and 1 m/s, from the initial moisturecontent down to ca 0.45 ± 0.02 kg/kg dm of final moisturecontent. The drying times for this final moisture content of the
c) R0s
b) Ff
e) R1
d
g) R2
m
d) F0
f
s
h) F2m
f) F1
d
f
a) R
is
is
Fig. 1 Light microscopephotographs of raw (R), pre-frozen (F), and dried beetrootcubes (40 °C and 1 m/s), without(0) and with ultrasound applica-tion at 16.4 kW/m3 (1) and26.7 kW/m3 (2). Legend: is = in-tercellular spaces, s = shrinkage, f= fissure, d = disruptions, m =micro-channels
76 Food Bioprocess Technol (2018) 11:72–83
113
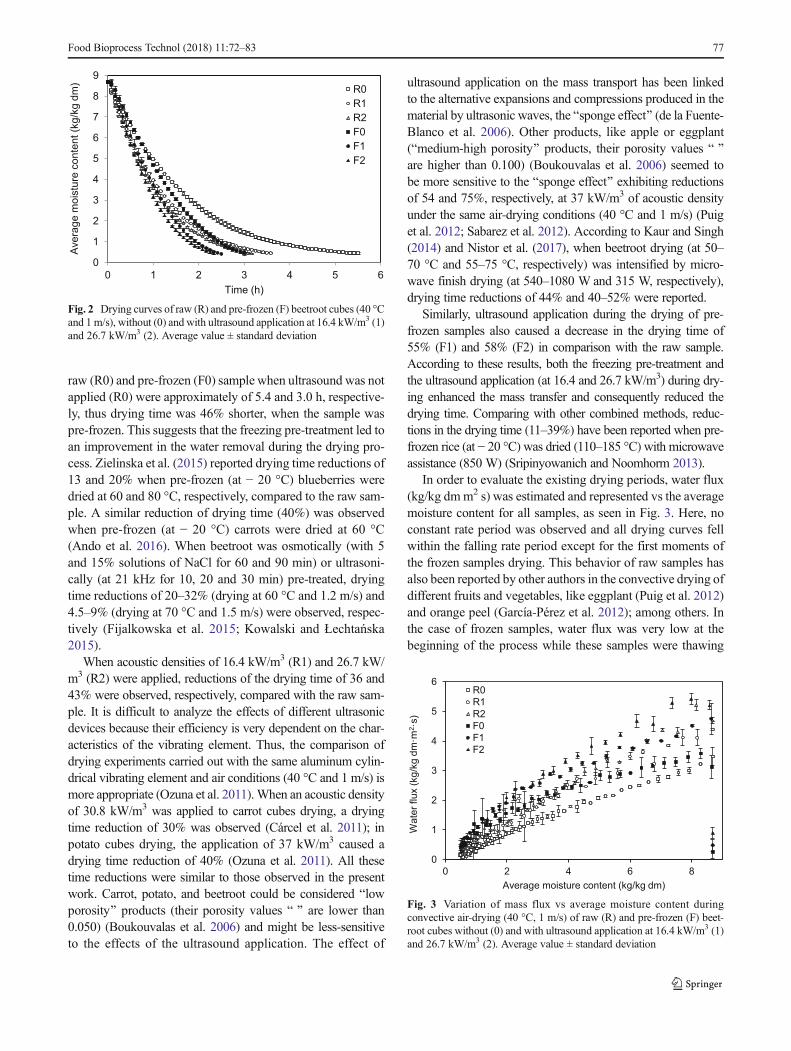
raw (R0) and pre-frozen (F0) sample when ultrasound was notapplied (R0) were approximately of 5.4 and 3.0 h, respective-ly, thus drying time was 46% shorter, when the sample waspre-frozen. This suggests that the freezing pre-treatment led toan improvement in the water removal during the drying pro-cess. Zielinska et al. (2015) reported drying time reductions of13 and 20% when pre-frozen (at − 20 °C) blueberries weredried at 60 and 80 °C, respectively, compared to the raw sam-ple. A similar reduction of drying time (40%) was observedwhen pre-frozen (at − 20 °C) carrots were dried at 60 °C(Ando et al. 2016). When beetroot was osmotically (with 5and 15% solutions of NaCl for 60 and 90 min) or ultrasoni-cally (at 21 kHz for 10, 20 and 30 min) pre-treated, dryingtime reductions of 20–32% (drying at 60 °C and 1.2 m/s) and4.5–9% (drying at 70 °C and 1.5 m/s) were observed, respec-tively (Fijalkowska et al. 2015; Kowalski and Łechtańska2015).
When acoustic densities of 16.4 kW/m3 (R1) and 26.7 kW/m3 (R2) were applied, reductions of the drying time of 36 and43% were observed, respectively, compared with the raw sam-ple. It is difficult to analyze the effects of different ultrasonicdevices because their efficiency is very dependent on the char-acteristics of the vibrating element. Thus, the comparison ofdrying experiments carried out with the same aluminum cylin-drical vibrating element and air conditions (40 °C and 1 m/s) ismore appropriate (Ozuna et al. 2011).When an acoustic densityof 30.8 kW/m3 was applied to carrot cubes drying, a dryingtime reduction of 30% was observed (Cárcel et al. 2011); inpotato cubes drying, the application of 37 kW/m3 caused adrying time reduction of 40% (Ozuna et al. 2011). All thesetime reductions were similar to those observed in the presentwork. Carrot, potato, and beetroot could be considered Blowporosity^ products (their porosity values B ^ are lower than0.050) (Boukouvalas et al. 2006) and might be less-sensitiveto the effects of the ultrasound application. The effect of
ultrasound application on the mass transport has been linkedto the alternative expansions and compressions produced in thematerial by ultrasonic waves, the Bsponge effect^ (de la Fuente-Blanco et al. 2006). Other products, like apple or eggplant(Bmedium-high porosity^ products, their porosity values B ^are higher than 0.100) (Boukouvalas et al. 2006) seemed tobe more sensitive to the Bsponge effect^ exhibiting reductionsof 54 and 75%, respectively, at 37 kW/m3 of acoustic densityunder the same air-drying conditions (40 °C and 1 m/s) (Puiget al. 2012; Sabarez et al. 2012). According to Kaur and Singh(2014) and Nistor et al. (2017), when beetroot drying (at 50–70 °C and 55–75 °C, respectively) was intensified by micro-wave finish drying (at 540–1080 W and 315 W, respectively),drying time reductions of 44% and 40–52% were reported.
Similarly, ultrasound application during the drying of pre-frozen samples also caused a decrease in the drying time of55% (F1) and 58% (F2) in comparison with the raw sample.According to these results, both the freezing pre-treatment andthe ultrasound application (at 16.4 and 26.7 kW/m3) during dry-ing enhanced the mass transfer and consequently reduced thedrying time. Comparing with other combined methods, reduc-tions in the drying time (11–39%) have been reported when pre-frozen rice (at − 20 °C) was dried (110–185 °C) with microwaveassistance (850 W) (Sripinyowanich and Noomhorm 2013).
In order to evaluate the existing drying periods, water flux(kg/kg dmm2 s) was estimated and represented vs the averagemoisture content for all samples, as seen in Fig. 3. Here, noconstant rate period was observed and all drying curves fellwithin the falling rate period except for the first moments ofthe frozen samples drying. This behavior of raw samples hasalso been reported by other authors in the convective drying ofdifferent fruits and vegetables, like eggplant (Puig et al. 2012)and orange peel (García-Pérez et al. 2012); among others. Inthe case of frozen samples, water flux was very low at thebeginning of the process while these samples were thawing
0
1
2
3
4
5
6
7
8
9
0 1 2 3 4 5 6
)md
gk/gk(tnetnocerutsio
megarevA
Time (h)
R0R1R2F0F1F2
Fig. 2 Drying curves of raw (R) and pre-frozen (F) beetroot cubes (40 °Cand 1 m/s), without (0) and with ultrasound application at 16.4 kW/m3 (1)and 26.7 kW/m3 (2). Average value ± standard deviation
0
1
2
3
4
5
6
0 2 4 6 8
m·md
gk/gk(xulfreta
W2 ·
s)
Average moisture content (kg/kg dm)
R0R1R2F0F1F2
Fig. 3 Variation of mass flux vs average moisture content duringconvective air-drying (40 °C, 1 m/s) of raw (R) and pre-frozen (F) beet-root cubes without (0) and with ultrasound application at 16.4 kW/m3 (1)and 26.7 kW/m3 (2). Average value ± standard deviation
Food Bioprocess Technol (2018) 11:72–83 77
114
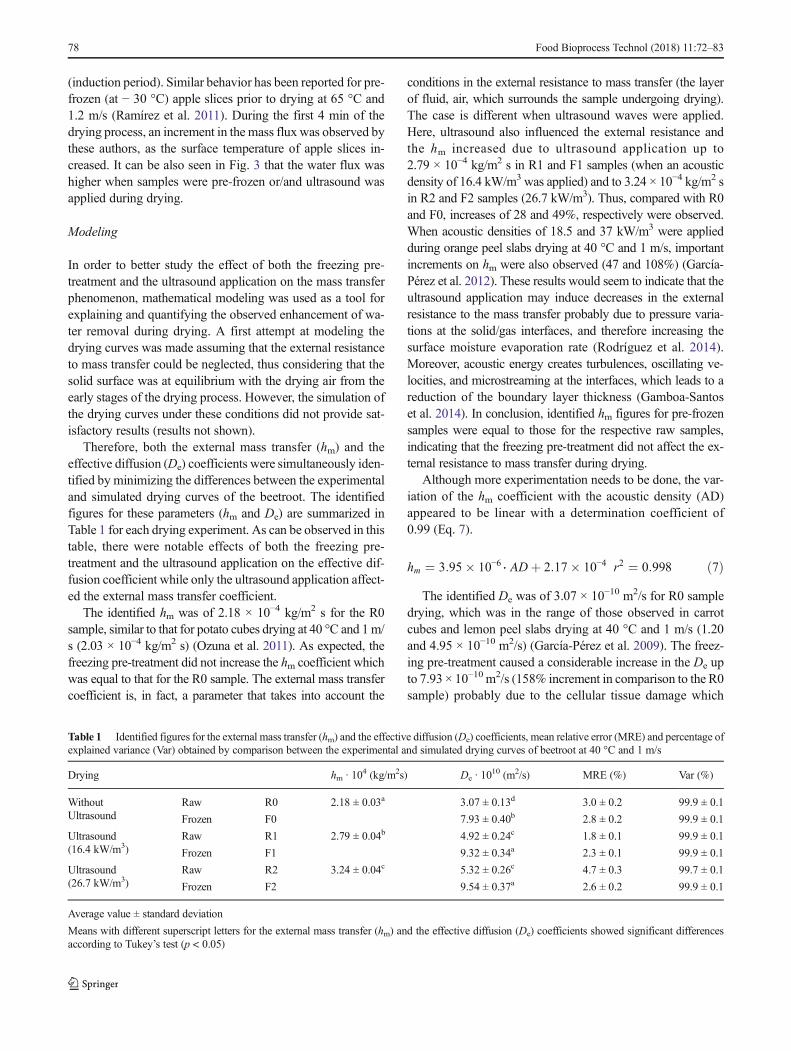
(induction period). Similar behavior has been reported for pre-frozen (at − 30 °C) apple slices prior to drying at 65 °C and1.2 m/s (Ramírez et al. 2011). During the first 4 min of thedrying process, an increment in the mass flux was observed bythese authors, as the surface temperature of apple slices in-creased. It can be also seen in Fig. 3 that the water flux washigher when samples were pre-frozen or/and ultrasound wasapplied during drying.
Modeling
In order to better study the effect of both the freezing pre-treatment and the ultrasound application on the mass transferphenomenon, mathematical modeling was used as a tool forexplaining and quantifying the observed enhancement of wa-ter removal during drying. A first attempt at modeling thedrying curves was made assuming that the external resistanceto mass transfer could be neglected, thus considering that thesolid surface was at equilibrium with the drying air from theearly stages of the drying process. However, the simulation ofthe drying curves under these conditions did not provide sat-isfactory results (results not shown).
Therefore, both the external mass transfer (hm) and theeffective diffusion (De) coefficients were simultaneously iden-tified by minimizing the differences between the experimentaland simulated drying curves of the beetroot. The identifiedfigures for these parameters (hm and De) are summarized inTable 1 for each drying experiment. As can be observed in thistable, there were notable effects of both the freezing pre-treatment and the ultrasound application on the effective dif-fusion coefficient while only the ultrasound application affect-ed the external mass transfer coefficient.
The identified hm was of 2.18 × 10⁻⁴ kg/m2 s for the R0sample, similar to that for potato cubes drying at 40 °C and 1m/s (2.03 × 10⁻⁴ kg/m2 s) (Ozuna et al. 2011). As expected, thefreezing pre-treatment did not increase the hm coefficient whichwas equal to that for the R0 sample. The external mass transfercoefficient is, in fact, a parameter that takes into account the
conditions in the external resistance to mass transfer (the layerof fluid, air, which surrounds the sample undergoing drying).The case is different when ultrasound waves were applied.Here, ultrasound also influenced the external resistance andthe hm increased due to ultrasound application up to2.79 × 10−4 kg/m2 s in R1 and F1 samples (when an acousticdensity of 16.4 kW/m3 was applied) and to 3.24 × 10⁻⁴ kg/m2 sin R2 and F2 samples (26.7 kW/m3). Thus, compared with R0and F0, increases of 28 and 49%, respectively were observed.When acoustic densities of 18.5 and 37 kW/m3 were appliedduring orange peel slabs drying at 40 °C and 1 m/s, importantincrements on hm were also observed (47 and 108%) (García-Pérez et al. 2012). These results would seem to indicate that theultrasound application may induce decreases in the externalresistance to the mass transfer probably due to pressure varia-tions at the solid/gas interfaces, and therefore increasing thesurface moisture evaporation rate (Rodríguez et al. 2014).Moreover, acoustic energy creates turbulences, oscillating ve-locities, and microstreaming at the interfaces, which leads to areduction of the boundary layer thickness (Gamboa-Santoset al. 2014). In conclusion, identified hm figures for pre-frozensamples were equal to those for the respective raw samples,indicating that the freezing pre-treatment did not affect the ex-ternal resistance to mass transfer during drying.
Although more experimentation needs to be done, the var-iation of the hm coefficient with the acoustic density (AD)appeared to be linear with a determination coefficient of0.99 (Eq. 7).
hm ¼ 3:95� 10−6 ⋅ ADþ 2:17� 10−4 r2 ¼ 0:998 ð7Þ
The identified De was of 3.07 × 10⁻¹⁰ m2/s for R0 sampledrying, which was in the range of those observed in carrotcubes and lemon peel slabs drying at 40 °C and 1 m/s (1.20and 4.95 × 10⁻¹⁰ m2/s) (García-Pérez et al. 2009). The freez-ing pre-treatment caused a considerable increase in the De upto 7.93 × 10⁻¹⁰ m2/s (158% increment in comparison to the R0sample) probably due to the cellular tissue damage which
Table 1 Identified figures for the external mass transfer (hm) and the effective diffusion (De) coefficients, mean relative error (MRE) and percentage ofexplained variance (Var) obtained by comparison between the experimental and simulated drying curves of beetroot at 40 °C and 1 m/s
Drying hm · 104 (kg/m2s) De · 1010 (m2/s) MRE (%) Var (%)
WithoutUltrasound
Raw R0 2.18 ± 0.03a 3.07 ± 0.13d 3.0 ± 0.2 99.9 ± 0.1
Frozen F0 7.93 ± 0.40b 2.8 ± 0.2 99.9 ± 0.1
Ultrasound(16.4 kW/m3)
Raw R1 2.79 ± 0.04b 4.92 ± 0.24c 1.8 ± 0.1 99.9 ± 0.1
Frozen F1 9.32 ± 0.34a 2.3 ± 0.1 99.9 ± 0.1
Ultrasound(26.7 kW/m3)
Raw R2 3.24 ± 0.04c 5.32 ± 0.26c 4.7 ± 0.3 99.7 ± 0.1
Frozen F2 9.54 ± 0.37a 2.6 ± 0.2 99.9 ± 0.1
Average value ± standard deviation
Means with different superscript letters for the external mass transfer (hm) and the effective diffusion (De) coefficients showed significant differencesaccording to Tukey’s test (p < 0.05)
78 Food Bioprocess Technol (2018) 11:72–83
115
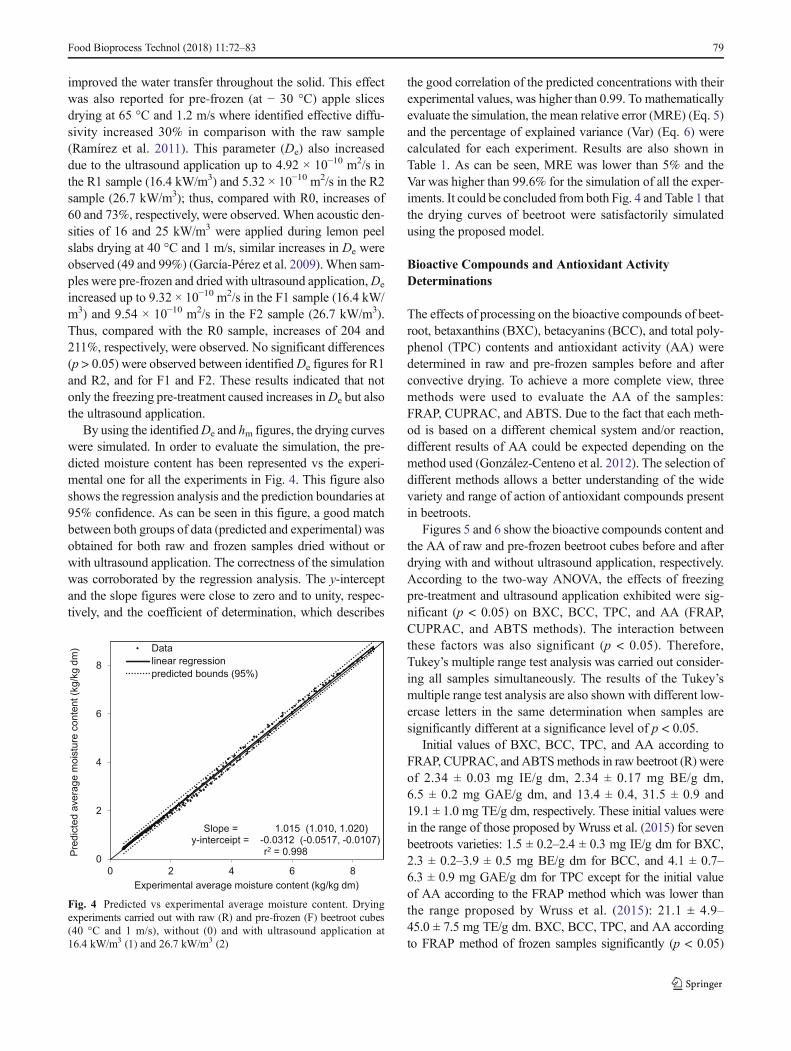
improved the water transfer throughout the solid. This effectwas also reported for pre-frozen (at − 30 °C) apple slicesdrying at 65 °C and 1.2 m/s where identified effective diffu-sivity increased 30% in comparison with the raw sample(Ramírez et al. 2011). This parameter (De) also increaseddue to the ultrasound application up to 4.92 × 10⁻¹⁰ m2/s inthe R1 sample (16.4 kW/m3) and 5.32 × 10⁻¹⁰ m2/s in the R2sample (26.7 kW/m3); thus, compared with R0, increases of60 and 73%, respectively, were observed. When acoustic den-sities of 16 and 25 kW/m3 were applied during lemon peelslabs drying at 40 °C and 1 m/s, similar increases in De wereobserved (49 and 99%) (García-Pérez et al. 2009). When sam-ples were pre-frozen and dried with ultrasound application,De
increased up to 9.32 × 10⁻¹⁰ m2/s in the F1 sample (16.4 kW/m3) and 9.54 × 10⁻¹⁰ m2/s in the F2 sample (26.7 kW/m3).Thus, compared with the R0 sample, increases of 204 and211%, respectively, were observed. No significant differences(p > 0.05) were observed between identifiedDe figures for R1and R2, and for F1 and F2. These results indicated that notonly the freezing pre-treatment caused increases inDe but alsothe ultrasound application.
By using the identifiedDe and hm figures, the drying curveswere simulated. In order to evaluate the simulation, the pre-dicted moisture content has been represented vs the experi-mental one for all the experiments in Fig. 4. This figure alsoshows the regression analysis and the prediction boundaries at95% confidence. As can be seen in this figure, a good matchbetween both groups of data (predicted and experimental) wasobtained for both raw and frozen samples dried without orwith ultrasound application. The correctness of the simulationwas corroborated by the regression analysis. The y-interceptand the slope figures were close to zero and to unity, respec-tively, and the coefficient of determination, which describes
the good correlation of the predicted concentrations with theirexperimental values, was higher than 0.99. To mathematicallyevaluate the simulation, the mean relative error (MRE) (Eq. 5)and the percentage of explained variance (Var) (Eq. 6) werecalculated for each experiment. Results are also shown inTable 1. As can be seen, MRE was lower than 5% and theVar was higher than 99.6% for the simulation of all the exper-iments. It could be concluded from both Fig. 4 and Table 1 thatthe drying curves of beetroot were satisfactorily simulatedusing the proposed model.
Bioactive Compounds and Antioxidant ActivityDeterminations
The effects of processing on the bioactive compounds of beet-root, betaxanthins (BXC), betacyanins (BCC), and total poly-phenol (TPC) contents and antioxidant activity (AA) weredetermined in raw and pre-frozen samples before and afterconvective drying. To achieve a more complete view, threemethods were used to evaluate the AA of the samples:FRAP, CUPRAC, and ABTS. Due to the fact that each meth-od is based on a different chemical system and/or reaction,different results of AA could be expected depending on themethod used (González-Centeno et al. 2012). The selection ofdifferent methods allows a better understanding of the widevariety and range of action of antioxidant compounds presentin beetroots.
Figures 5 and 6 show the bioactive compounds content andthe AA of raw and pre-frozen beetroot cubes before and afterdrying with and without ultrasound application, respectively.According to the two-way ANOVA, the effects of freezingpre-treatment and ultrasound application exhibited were sig-nificant (p < 0.05) on BXC, BCC, TPC, and AA (FRAP,CUPRAC, and ABTS methods). The interaction betweenthese factors was also significant (p < 0.05). Therefore,Tukey’s multiple range test analysis was carried out consider-ing all samples simultaneously. The results of the Tukey’smultiple range test analysis are also shown with different low-ercase letters in the same determination when samples aresignificantly different at a significance level of p < 0.05.
Initial values of BXC, BCC, TPC, and AA according toFRAP, CUPRAC, and ABTSmethods in raw beetroot (R) wereof 2.34 ± 0.03 mg IE/g dm, 2.34 ± 0.17 mg BE/g dm,6.5 ± 0.2 mg GAE/g dm, and 13.4 ± 0.4, 31.5 ± 0.9 and19.1 ± 1.0 mg TE/g dm, respectively. These initial values werein the range of those proposed by Wruss et al. (2015) for sevenbeetroots varieties: 1.5 ± 0.2–2.4 ± 0.3 mg IE/g dm for BXC,2.3 ± 0.2–3.9 ± 0.5 mg BE/g dm for BCC, and 4.1 ± 0.7–6.3 ± 0.9 mg GAE/g dm for TPC except for the initial valueof AA according to the FRAP method which was lower thanthe range proposed by Wruss et al. (2015): 21.1 ± 4.9–45.0 ± 7.5 mg TE/g dm. BXC, BCC, TPC, and AA accordingto FRAP method of frozen samples significantly (p < 0.05)
0
2
4
6
8
0 2 4 6 8
)md
gk/gk(tnetnocerutsio
megareva
detciderP
Experimental average moisture content (kg/kg dm)
Slope = 1.015 (1.010, 1.020)y-interceipt = -0.0312 (-0.0517, -0.0107)
r2 = 0.998
Datalinear regressionpredicted bounds (95%)
Fig. 4 Predicted vs experimental average moisture content. Dryingexperiments carried out with raw (R) and pre-frozen (F) beetroot cubes(40 °C and 1 m/s), without (0) and with ultrasound application at16.4 kW/m3 (1) and 26.7 kW/m3 (2)
Food Bioprocess Technol (2018) 11:72–83 79
116
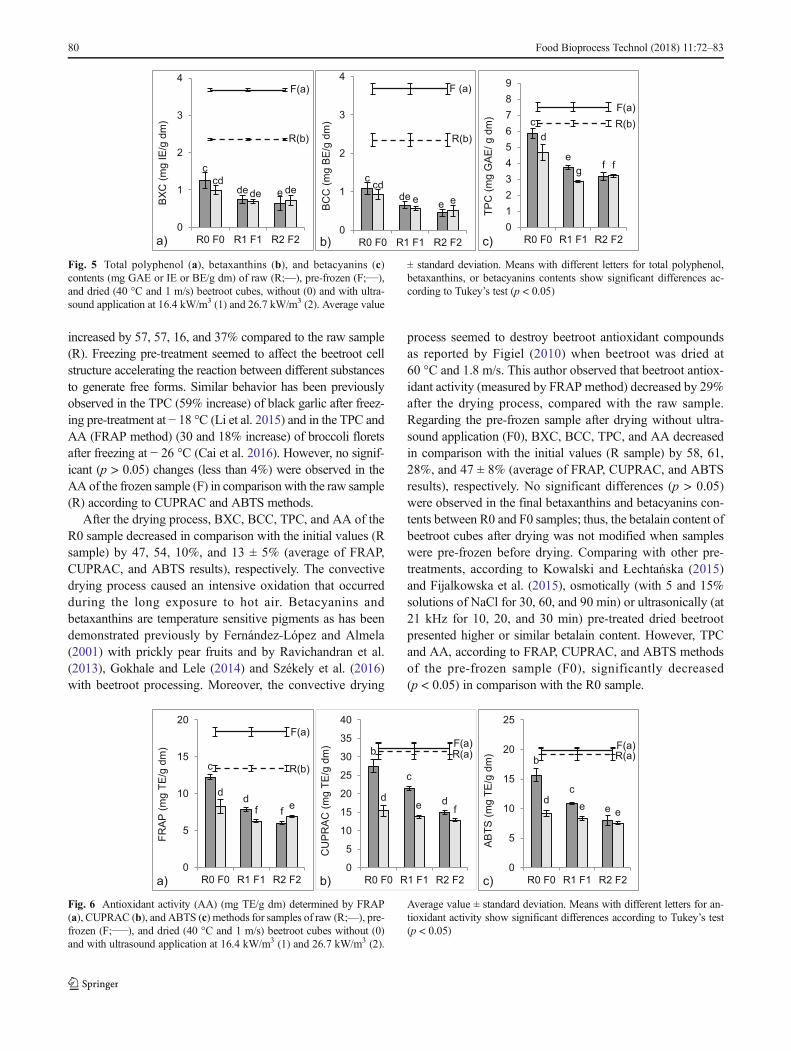
increased by 57, 57, 16, and 37% compared to the raw sample(R). Freezing pre-treatment seemed to affect the beetroot cellstructure accelerating the reaction between different substancesto generate free forms. Similar behavior has been previouslyobserved in the TPC (59% increase) of black garlic after freez-ing pre-treatment at − 18 °C (Li et al. 2015) and in the TPC andAA (FRAP method) (30 and 18% increase) of broccoli floretsafter freezing at − 26 °C (Cai et al. 2016). However, no signif-icant (p > 0.05) changes (less than 4%) were observed in theAA of the frozen sample (F) in comparison with the raw sample(R) according to CUPRAC and ABTS methods.
After the drying process, BXC, BCC, TPC, and AA of theR0 sample decreased in comparison with the initial values (Rsample) by 47, 54, 10%, and 13 ± 5% (average of FRAP,CUPRAC, and ABTS results), respectively. The convectivedrying process caused an intensive oxidation that occurredduring the long exposure to hot air. Betacyanins andbetaxanthins are temperature sensitive pigments as has beendemonstrated previously by Fernández-López and Almela(2001) with prickly pear fruits and by Ravichandran et al.(2013), Gokhale and Lele (2014) and Székely et al. (2016)with beetroot processing. Moreover, the convective drying
process seemed to destroy beetroot antioxidant compoundsas reported by Figiel (2010) when beetroot was dried at60 °C and 1.8 m/s. This author observed that beetroot antiox-idant activity (measured by FRAP method) decreased by 29%after the drying process, compared with the raw sample.Regarding the pre-frozen sample after drying without ultra-sound application (F0), BXC, BCC, TPC, and AA decreasedin comparison with the initial values (R sample) by 58, 61,28%, and 47 ± 8% (average of FRAP, CUPRAC, and ABTSresults), respectively. No significant differences (p > 0.05)were observed in the final betaxanthins and betacyanins con-tents between R0 and F0 samples; thus, the betalain content ofbeetroot cubes after drying was not modified when sampleswere pre-frozen before drying. Comparing with other pre-treatments, according to Kowalski and Łechtańska (2015)and Fijalkowska et al. (2015), osmotically (with 5 and 15%solutions of NaCl for 30, 60, and 90 min) or ultrasonically (at21 kHz for 10, 20, and 30 min) pre-treated dried beetrootpresented higher or similar betalain content. However, TPCand AA, according to FRAP, CUPRAC, and ABTS methodsof the pre-frozen sample (F0), significantly decreased(p < 0.05) in comparison with the R0 sample.
c
de ecd
de de
R(b)
F(a)
0
1
2
3
4
R0 F0 R1 F1 R2 F2
BXC
(mg
IE/g
dm
)
a)
c
dee
cde e
R(b)
F (a)
0
1
2
3
4
R0 F0 R1 F1 R2 F2
BC
C (m
g B
E/g
dm
)
b)
c
ef
d
g f
R(b)F(a)
0123456789
R0 F0 R1 F1 R2 F2
TPC
(mg
GA
E/ g
dm
)
c)
Fig. 5 Total polyphenol (a), betaxanthins (b), and betacyanins (c)contents (mg GAE or IE or BE/g dm) of raw (R;—), pre-frozen (F;___),and dried (40 °C and 1 m/s) beetroot cubes, without (0) and with ultra-sound application at 16.4 kW/m3 (1) and 26.7 kW/m3 (2). Average value
± standard deviation. Means with different letters for total polyphenol,betaxanthins, or betacyanins contents show significant differences ac-cording to Tukey’s test (p < 0.05)
c
df
d
f e
R(b)
F(a)
0
5
10
15
20
R0 F0 R1 F1 R2 F2
FRA
P (m
g TE
/g d
m)
a)
b
c
dde f
R(a)F(a)
0
5
10
15
20
25
30
35
40
R0 F0 R1 F1 R2 F2
CU
PR
AC
(mg
TE/g
dm
)
b)
b
c
ed e e
R(a)F(a)
0
5
10
15
20
25
R0 F0 R1 F1 R2 F2
AB
TS (m
g TE
/g d
m)
c)
Fig. 6 Antioxidant activity (AA) (mg TE/g dm) determined by FRAP(a), CUPRAC (b), and ABTS (c) methods for samples of raw (R;—), pre-frozen (F;____), and dried (40 °C and 1 m/s) beetroot cubes without (0)and with ultrasound application at 16.4 kW/m3 (1) and 26.7 kW/m3 (2).
Average value ± standard deviation. Means with different letters for an-tioxidant activity show significant differences according to Tukey’s test(p < 0.05)
80 Food Bioprocess Technol (2018) 11:72–83
117
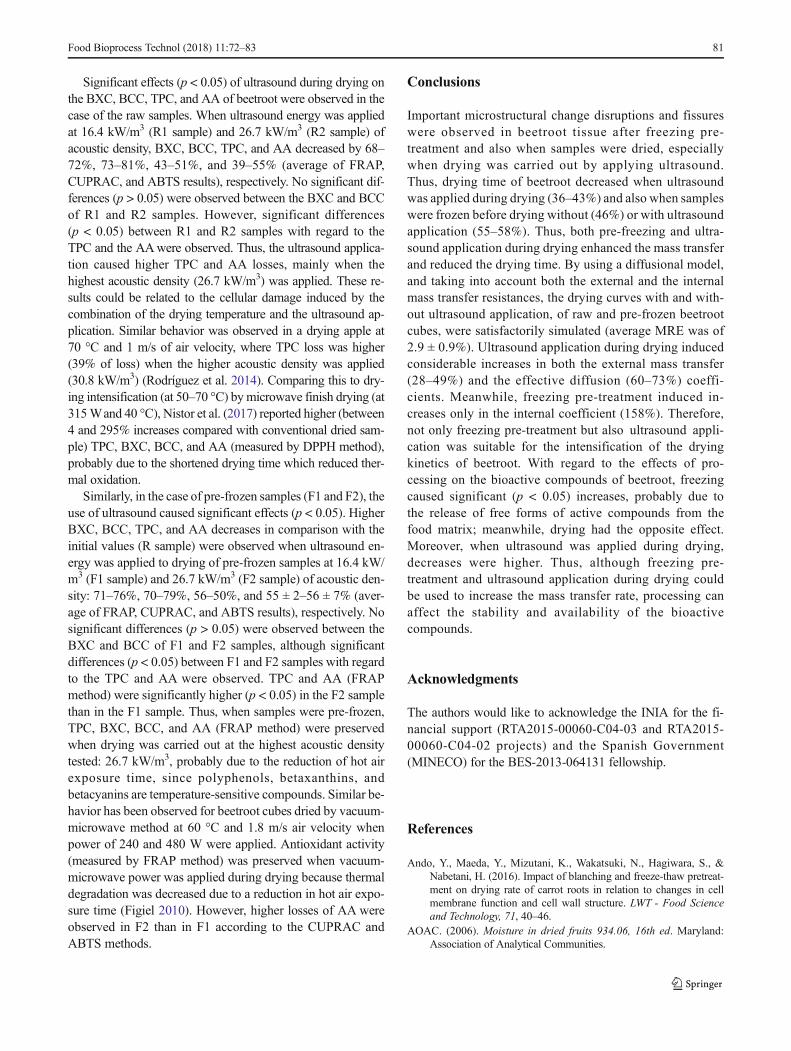
Significant effects (p < 0.05) of ultrasound during drying onthe BXC, BCC, TPC, and AA of beetroot were observed in thecase of the raw samples. When ultrasound energy was appliedat 16.4 kW/m3 (R1 sample) and 26.7 kW/m3 (R2 sample) ofacoustic density, BXC, BCC, TPC, and AA decreased by 68–72%, 73–81%, 43–51%, and 39–55% (average of FRAP,CUPRAC, and ABTS results), respectively. No significant dif-ferences (p > 0.05) were observed between the BXC and BCCof R1 and R2 samples. However, significant differences(p < 0.05) between R1 and R2 samples with regard to theTPC and the AAwere observed. Thus, the ultrasound applica-tion caused higher TPC and AA losses, mainly when thehighest acoustic density (26.7 kW/m3) was applied. These re-sults could be related to the cellular damage induced by thecombination of the drying temperature and the ultrasound ap-plication. Similar behavior was observed in a drying apple at70 °C and 1 m/s of air velocity, where TPC loss was higher(39% of loss) when the higher acoustic density was applied(30.8 kW/m3) (Rodríguez et al. 2014). Comparing this to dry-ing intensification (at 50–70 °C) bymicrowave finish drying (at315Wand 40 °C), Nistor et al. (2017) reported higher (between4 and 295% increases compared with conventional dried sam-ple) TPC, BXC, BCC, and AA (measured by DPPH method),probably due to the shortened drying time which reduced ther-mal oxidation.
Similarly, in the case of pre-frozen samples (F1 and F2), theuse of ultrasound caused significant effects (p < 0.05). HigherBXC, BCC, TPC, and AA decreases in comparison with theinitial values (R sample) were observed when ultrasound en-ergy was applied to drying of pre-frozen samples at 16.4 kW/m3 (F1 sample) and 26.7 kW/m3 (F2 sample) of acoustic den-sity: 71–76%, 70–79%, 56–50%, and 55 ± 2–56 ± 7% (aver-age of FRAP, CUPRAC, and ABTS results), respectively. Nosignificant differences (p > 0.05) were observed between theBXC and BCC of F1 and F2 samples, although significantdifferences (p < 0.05) between F1 and F2 samples with regardto the TPC and AA were observed. TPC and AA (FRAPmethod) were significantly higher (p < 0.05) in the F2 samplethan in the F1 sample. Thus, when samples were pre-frozen,TPC, BXC, BCC, and AA (FRAP method) were preservedwhen drying was carried out at the highest acoustic densitytested: 26.7 kW/m3, probably due to the reduction of hot airexposure time, since polyphenols, betaxanthins, andbetacyanins are temperature-sensitive compounds. Similar be-havior has been observed for beetroot cubes dried by vacuum-microwave method at 60 °C and 1.8 m/s air velocity whenpower of 240 and 480 W were applied. Antioxidant activity(measured by FRAP method) was preserved when vacuum-microwave power was applied during drying because thermaldegradation was decreased due to a reduction in hot air expo-sure time (Figiel 2010). However, higher losses of AA wereobserved in F2 than in F1 according to the CUPRAC andABTS methods.
Conclusions
Important microstructural change disruptions and fissureswere observed in beetroot tissue after freezing pre-treatment and also when samples were dried, especiallywhen drying was carried out by applying ultrasound.Thus, drying time of beetroot decreased when ultrasoundwas applied during drying (36–43%) and also when sampleswere frozen before drying without (46%) or with ultrasoundapplication (55–58%). Thus, both pre-freezing and ultra-sound application during drying enhanced the mass transferand reduced the drying time. By using a diffusional model,and taking into account both the external and the internalmass transfer resistances, the drying curves with and with-out ultrasound application, of raw and pre-frozen beetrootcubes, were satisfactorily simulated (average MRE was of2.9 ± 0.9%). Ultrasound application during drying inducedconsiderable increases in both the external mass transfer(28–49%) and the effective diffusion (60–73%) coeffi-cients. Meanwhile, freezing pre-treatment induced in-creases only in the internal coefficient (158%). Therefore,not only freezing pre-treatment but also ultrasound appli-cation was suitable for the intensification of the dryingkinetics of beetroot. With regard to the effects of pro-cessing on the bioactive compounds of beetroot, freezingcaused significant (p < 0.05) increases, probably due tothe release of free forms of active compounds from thefood matrix; meanwhile, drying had the opposite effect.Moreover, when ultrasound was applied during drying,decreases were higher. Thus, although freezing pre-treatment and ultrasound application during drying couldbe used to increase the mass transfer rate, processing canaffect the stability and availability of the bioactivecompounds.
Acknowledgments
The authors would like to acknowledge the INIA for the fi-nancial support (RTA2015-00060-C04-03 and RTA2015-00060-C04-02 projects) and the Spanish Government(MINECO) for the BES-2013-064131 fellowship.
References
Ando, Y., Maeda, Y., Mizutani, K., Wakatsuki, N., Hagiwara, S., &Nabetani, H. (2016). Impact of blanching and freeze-thaw pretreat-ment on drying rate of carrot roots in relation to changes in cellmembrane function and cell wall structure. LWT - Food Scienceand Technology, 71, 40–46.
AOAC. (2006). Moisture in dried fruits 934.06, 16th ed. Maryland:Association of Analytical Communities.
Food Bioprocess Technol (2018) 11:72–83 81
118

Boukouvalas, C. J., Krokida, M., Maroulis, Z., & Marinos-Kouris, D.(2006). Density and porosity: literature data compilation for food-stuffs. International Journal of Food Properties, 9(4), 715–746.
Cai, C., Miao, H., Qian, H., Yao, L., Wang, B., & Wang, Q. (2016).Effects of industrial pre-freezing processing and freezing handlingon glucosinolates and antioxidant attributes in broccoli florets. FoodChemistry, 210, 451–456.
Cárcel, J. A., García-Pérez, J. V., Riera, E., &Mulet, A. (2007). Influenceof high-intensity ultrasound on drying kinetics of persimmon.Drying Technology, 25(1), 185–193.
Cárcel, J. A., García-Pérez, J. V., Riera, E., & Mulet, A. (2011).Improvement of convective drying of carrot by applying powerultrasound—influence of mass load density. Drying Technology,29(2), 174–182.
de la Fuente-Blanco, S., Riera-Franco de Sarabia, E., Acosta-Aparicio,V. M., Blanco-Blanco, A. & Gallego-Juárez, J. A. (2006). Fooddrying process by power ultrasound.Ultrasonics, 44, e523–e527.
Eim, V. S., Urrea, D., Rosselló, C., García-Pérez, J. V., Femenia, A., &Simal, S. (2013). Optimization of the drying process of carrot(Daucus carota v. Nantes) on the basis of quality criteria. DryingTechnology, 31(8), 951–962.
Eshtiaghi, M. N., Stute, R., & Knorr, D. (1994). High-pressure and freez-ing pretreatment effects on drying, rehydration, texture and color ofgreen beans, carrots and potatoes. Journal of Food Science, 59(6),1168–1170.
Fernández-López, J. A., & Almela, L. (2001). Application of high-performance liquid chromatography to the characterization of thebetalain pigments in prickly pear fruits. Journal of ChromatographyA, 913(1), 415–420.
Figiel, A. (2010). Drying kinetics and quality of beetroots dehydrated bycombination of convective and vacuum-microwave methods.Journal of Food Engineering, 98(4), 461–470.
Fijalkowska, A., Nowacka, M., & Witrowa-rajchert, D. (2015). Effect ofultrasound waves on drying process and selected properties of beet-root tissue. Food Science Technology Quality, 2(99), 138–149.
Gamboa-Santos, J.,Montilla,A.,Cárcel, J.A.,Villamiel,M.,&Garcia-Perez, J. V. (2014). Air-borne ultrasound application in the con-vective drying of strawberry. Journal of Food Engineering, 128,132–139.
García-Pérez, J. V., Rosselló, C., Cárcel, J., De la Fuente, S., & Mulet, A.(2006). Effect of air temperature on convective drying assisted byhigh power ultrasound. Defect and Diffusion Forum, Trans TechPublications, 258, 563–574.
García-Pérez, J. V., Cárcel, J. A., Riera, E., &Mulet, A. (2009). Influenceof the applied acoustic energy on the drying of carrots and lemonpeel. Drying Technology, 27(2), 281–287.
García-Pérez, J. V., Ortuño, C., Puig, A., Cárcel, J. A., & Perez-Munuera,I. (2012). Enhancement of water transport and microstructuralchanges induced by high-intensity ultrasound application on orangepeel drying. Food and Bioprocess Technology, 5(6), 2256–2265.
Gengatharan, A., Dykes, G. A., & Choo, W. S. (2015). Betalains: naturalplant pigments with potential application in functional foods. LWT -Food Science and Technology, 64(2), 645–649.
Gokhale, S. V., & Lele, S. S. (2014). Betalain content and antioxidantactivity of beta vulgaris: effect of hot air convective drying andstorage. Journal of Food Processing and Preservation, 38(1),585–590.
González-Centeno, M. R., Jourdes, M., Femenia, A., Simal, S., Rosselló,C., & Teissedre, P.-L. (2012). Proanthocyanidin composition andantioxidant potential of the stem winemaking byproducts from 10different grape varieties (Vitis vinifera L.) Journal of Agriculturaland Food Chemistry, 60(48), 11850–11858.
Heredia, J. B., & Cisneros-Zevallos, L. (2009). The effects of exogenousethylene and methyl jasmonate on the accumulation of phenolicantioxidants in selected whole and wounded fresh produce. FoodChemistry, 115(4), 1500–1508.
Janiszewska, E. (2014). Microencapsulated beetroot juice as a potentialsource of betalain. Powder Technology, 264, 190–196.
Kaleta, A., & Górnicki, K. (2010). Some remarks on evaluation of dryingmodels of red beet particles. Energy Conversion and Management,51(12), 2967–2978.
Kaur, K., & Singh, A. (2014). Drying kinetics and quality characteristicsof beetroot slices under hot air followed bymicrowave finish drying.African Journal of Agricultural Research, 9(12), 1036–1044.
Kowalski, S. J., & Łechtańska, J. M. (2015). Drying of red beetroot afterosmotic pretreatment: kinetics and quality considerations. Chemicaland Process Engineering, 36(3), 345–354.
Lewicki, P. P. (2006). Design of hot air drying for better foods. Trends inFood Science & Technology, 17(4), 153–163.
Li, N., Lu, X., Pei, H., & Qiao, X. (2015). Effect of freezing pretreatmenton the processing time and quality of black garlic. Journal of FoodProcess Engineering, 38(4), 329–335.
Mayor, L., Pissarra, J., & Sereno, A. (2008). Microstructural changesduring osmotic dehydration of parenchymatic pumpkin tissue.Journal of Food Engineering, 85(3), 326–339.
Nayak, C. A., Suguna, K., Narasimhamurthy, K., & Rastogi, N. K.(2007). Effect of gamma irradiation on histological and texturalproperties of carrot, potato and beetroot. Journal of FoodEngineering, 79(3), 765–770.
Nistor, O.-V., Seremet, L., Andronoiu, D. G., Rudi, L., & Botez, E.(2017). Influence of different drying methods on the physicochem-ical properties of red beetroot (Beta vulgaris L. var. Cylindra). FoodChemistry, 236, 59–67.
Onwude, D. I., Hashim, N., & Chen, G. (2016). Recent advances of novelthermal combined hot air drying of agricultural crops. Trends inFood Science & Technology, 57, 132–145.
Ozuna, C., Cárcel, J. A., García-Pérez, J. V., & Mulet, A. (2011).Improvement of water transport mechanisms during potato dryingby applying ultrasound. Journal of the Science of Food andAgriculture, 91(14), 2511–2517.
Paciulli, M., Ganino, T., Pellegrini, N., Rinaldi, M., Zaupa, M., Fabbri,A., & Chiavaro, E. (2015). Impact of the industrial freezing processon selected vegetables—part I. Structure, texture and antioxidantcapacity. Food Research International, 74, 329–337.
Paciulli, M., Medina-Meza, I. G., Chiavaro, E., & Barbosa-Cánovas, G.V. (2016). Impact of thermal and high pressure processing on qualityparameters of beetroot (Beta vulgaris L.) LWT - Food Science andTechnology, 68, 98–104.
Phothiset, S., & Charoenrein, S. (2014). Effects of freezing and thawingon texture, microstructure and cell wall composition changes inpapaya tissues. Journal of the Science of Food and Agriculture,94(2), 189–196.
Puig, A., Pérez-Munuera, I., Cárcel, J., Hernando, I., & García-Pérez, J.(2012). Moisture loss kinetics and microstructural changes in egg-plant (Solanum melongena L.) during conventional and ultrasoni-cally assisted convective drying. Food and Bioproducts Processing,90(4), 624–632.
Ramírez, C., Troncoso, E., Muñoz, J., & Aguilera, J. M. (2011).Microstructure analysis on pre-treated apple slices and its effect onwater release during air drying. Journal of Food Engineering,106(3), 253–261.
Ramos, I. N., Silva, C. L. M., Sereno, A. M., & Aguilera, J. M. (2004).Quantification of microstructural changes during first stage air dry-ing of grape tissue. Journal of Food Engineering, 62(2), 159–164.
Ravichandran, K., Saw, N. M. M. T., Mohdaly, A. A. A., Gabr, A. M. M.,Kastell, A., Riedel, H., Cai, Z., Knorr, D., & Smetanska, I. (2013).Impact of processing of red beet on betalain content and antioxidantactivity. Food Research International, 50(2), 670–675.
Rodríguez, Ó., Eim, V. S., Simal, S., Femenia, A., & Rosselló, C. (2013).Validation of a difussion model using moisture profiles measured bymeans of TD-NMR in apples (Malus domestica). Food andBioprocess Technology, 6(2), 542–552.
82 Food Bioprocess Technol (2018) 11:72–83
119
Rodríguez, Ó., Santacatalina, J. V., Simal, S., Garcia-Perez, J. V.,Femenia, A., & Rosselló, C. (2014). Influence of power ultrasoundapplication on drying kinetics of apple and its antioxidant and mi-crostructural properties. Journal of Food Engineering, 129, 21–29.
Sabarez, H. T., Gallego-Juárez, J. A., & Riera, E. (2012). Ultrasonic-assisted convective drying of apple slices. Drying Technology,30(9), 989–997.
Samoticha, J., Wojdyło, A., & Lech, K. (2016). The influence of differentthe drying methods on chemical composition and antioxidant activityin chokeberries. LWT - Food Science and Technology, 66, 484–489.
Sripinyowanich, J., & Noomhorm, A. (2013). Effects of freezing pretreat-ment, microwave-assisted vibro-fluidized bed drying and dryingtemperature on instant rice production and quality. Journal ofFood Processing and Preservation, 37(4), 314–324.
Stintzing, F. C., Herbach, K. M., Mosshammer, M. R., Carle, R., Yi, W.,Sellappan, S., Akoh, C. C., Bunch, R., & Felker, P. (2005). Color,betalain pattern, and antioxidant properties of cactus pear (Opuntia
spp.) clones. Journal of Agricultural and Food Chemistry, 53(2),442–451.
Székely, D., Illés, B., Stéger-Máté, M., & Monspart-Sényi, J. (2016).Effect of drying methods for inner parameters of red beetroot(Beta vulgaris L.). Acta Universitatis Sapientiae, Alimentaria,9(1), 60–68.
Wootton-Beard, P. C., & Ryan, L. (2011). A beetroot juice shot is asignificant and convenient source of bioaccessible antioxidants.Journal of Functional Foods, 3(4), 329–334.
Wruss, J., Waldenberger, G., Huemer, S., Uygun, P., Lanzerstorfer, P.,Müller, U., Höglinger, O., & Weghuber, J. (2015). Compositionalcharacteristics of commercial beetroot products and beetroot juiceprepared from seven beetroot varieties grown in Upper Austria.Journal of Food Composition and Analysis, 42, 46–55.
Zielinska,M., Sadowski, P., & Błaszczak,W. (2015). Freezing/thawing andmicrowave-assisted drying of blueberries (Vaccinium corymbosumL.)LWT - Food Science and Technology, 62(1, Part 2), 555–563.
Food Bioprocess Technol (2018) 11:72–83 83
120
CORRECTION
Correction to: Improvement of Mass Transfer by Freezing Pre-treatmentand Ultrasound Application on the Convective Drying of Beetroot (Betavulgaris L.)
Francisca Vallespir1 & Juan A. Cárcel2 & Francesco Marra3 & Valeria S. Eim1& Susana Simal1
Published online: 3 October 2018# Springer Science+Business Media, LLC, part of Springer Nature 2018
Correction to: Food Bioprocess Technol (2018) 11(1):72–83https://doi.org/10.1007/s11947-017-1999-8
The original version of this article unfortunately containedan error in the Acknowledgements section.
The authors hereby change BThe authors would like toacknowledge the INIA for the financial support (RTA2015-00060-C04-03 and RTA2015-00060-C04-02 projects)^ toBThe authors would like to acknowledge the INIA-ERDF andCAIB-ERDF for the financial support (RTA2015-00060-C04-03, RTA2015-00060-C04-02, and AAEE045/2017 projects).^
The online version of the original article can be found at https://doi.org/10.1007/s11947-017-1999-8
* Susana [email protected]
1 Department of Chemistry, University of the Balearic Islands, CtraValldemossa km 7.5, 07122 Palma de Mallorca, Spain
2 ASPA Group, Food Technology Department, Polytechnic Universityof Valencia, Cno Vera s/n, 46021 Valencia, Spain
3 Dipartimento di Ingegneria Industriale, Università degli Studi diSalerno, Via Giovanni Paolo II 132, 84084 Fisciano, SA, Italy
Food and Bioprocess Technology (2018) 11:2286https://doi.org/10.1007/s11947-018-2187-1
121

122
CHAPTER 3
Low-temperature drying intensification by ultrasound application:
Ultrasound assisted low-temperature drying of kiwifruit. Effects on kinetics, bioactive compounds and antioxidant activity
Francisca Vallespir, Óscar Rodríguez, Juan A. Cárcel, Carmen Rosselló, Susana Simal
Journal of the Science of Food and Agriculture DOI: 10.1002/jsfa.9503 Accepted and published
Impact factor (2017): 2.379 Food Science & Technology (Q1)
Intensification of low-temperature drying of mushroom by means of power ultrasound: effects on drying kinetics and quality parameters
Francisca Vallespir, Laura Crescenzo, Óscar Rodríguez, Francesco Marra, Susana Simal
Food and Bioprocess Technology DOI: 10.1007/s11947-019-02263-5
Accepted and published Impact factor (2017): 2.998
Food Science & Technology (Q1)
123

124

Research ArticleReceived: 28 August 2018 Revised: 18 October 2018 Accepted article published: 24 November 2018 Published online in Wiley Online Library:
(wileyonlinelibrary.com) DOI 10.1002/jsfa.9503
Ultrasound assisted low-temperature dryingof kiwifruit: Effects on drying kinetics,bioactive compounds and antioxidant activityFrancisca Vallespir,a Óscar Rodríguez,a Juan A Cárcel,b Carmen Rossellóa
and Susana Simala*
Abstract
BACKGROUND: Low-temperature drying is considered to be a promising technique for food processing. It preserves ther-molabile compounds and might be intensified by acoustic assistance. The effect of acoustic assistance (20.5 kWm−3) duringlow-temperature drying of kiwifruit (at 5, 10 and 15 ∘C, and 1ms−1) on drying kinetics, bioactive compounds (such as ascorbicacid, vitamin E, and total polyphenols), and antioxidant activity was studied.
RESULTS: Drying time was shortened by 55–65% when using power ultrasound. A diffusion model was used to evaluatethe drying kinetics. The effective diffusion coefficient increased by 154± 30% and the external mass transfer coefficientincreased by 158± 66% when ultrasound was applied during drying, compared with drying without ultrasound application.With regard to bioactive compounds and antioxidant activity, although samples dried at 15 ∘C presented significantly higher(P< 0.05) losses (39–54% and 57–69%, respectively) than samples dried at 5 ∘C (14–43% and 23–50%, respectively) whenultrasound was not applied, the application of ultrasound during drying at 15 ∘C significantly reduced (P< 0.05) those lossesin all quality parameters (15–47% and 47–58%, respectively).
CONCLUSION: Overall, low-temperature drying of kiwifruit was enhanced by acoustic assistance preserving bioactive com-pounds and antioxidant activity, especially at 15 ∘C.© 2018 Society of Chemical Industry
Keywords: kiwifruit; low-temperature drying; power ultrasound; bioactive compounds
INTRODUCTIONKiwifruit crops and consumption have increased during recentdecades, this fruit being appreciated by consumers in Westerncountries as an exotic food with health benefits mainly relatedto its antioxidant content.1 According to Du et al.2 kiwifruit is char-acterized by its high ascorbic acid and vitamin E content and otheruseful compounds such as carotenoids, chlorophylls, flavonoids,and minerals. The kiwi, like many other fruits, is highly perish-able, so the development of optimal methods for its conserva-tion is interesting, taking into account the fact that consumersdemandminimally processed food products, with similar or equiv-alent nutritional and sensorial attributes to the fresh product andin compliance with food safety requirements.3
Convective drying is one of the most commonly used tech-niques for food preservation in industry. Drying improves foodstability by reducing water activity, but it also promotes colorand texture changes, shrinkage, and losses of different nutritionalbiocompounds.4 The extent of these changes, especially the lossesof thermolabile biocompounds, is usually higher as both the dry-ing temperature and the drying time increase.5
Low-temperature drying has thus been considered a promisingtechnique for food preservation. Working at atmospheric pres-sure and using air at a temperature below standard room condi-tions and close to the water freezing point, and with low relative
humidity (below 30%), it has been found to preserve thermola-bile compounds.6 For instance, according to Santacatalina et al.4
and Rodríguez et al.,7 the losses of some biocompounds (totalpolyphenols and flavonoids) in Granny Smith apples during con-vective drying were 25% at 0 ∘C, 28% at 10 ∘C, but 39% at 30 ∘C.Using this technique, a previous freezing process that would havehad to be conducted during freeze-drying is not required4. Anyextra quality loss caused by the ice crystal formation during freez-ing, as well as the high cost of freezing and vacuum, is thereforeavoided.However, by decreasing the air temperature, the mass transfer
rate during drying also decreases, thus making low-temperaturedrying a time-consuming operation compared with conventionalconvective drying at high temperatures. Low-temperature dryingis prone to be intensified by using complementary techniques to
∗ Correspondence to: S Simal, Department of Chemistry, University of theBalearic Islands, Ctra. Valldemossa km 7.5, 07122 Palma de Mallorca, Spain.E-mail: [email protected]
a DepartmentofChemistry, University of theBalearic Islands, PalmadeMallorca,Spain
b ASPA Group, Food Technology Department, Polytechnic University of Valencia,Valencia, Spain
J Sci Food Agric (2019) www.soci.org © 2018 Society of Chemical Industry 125
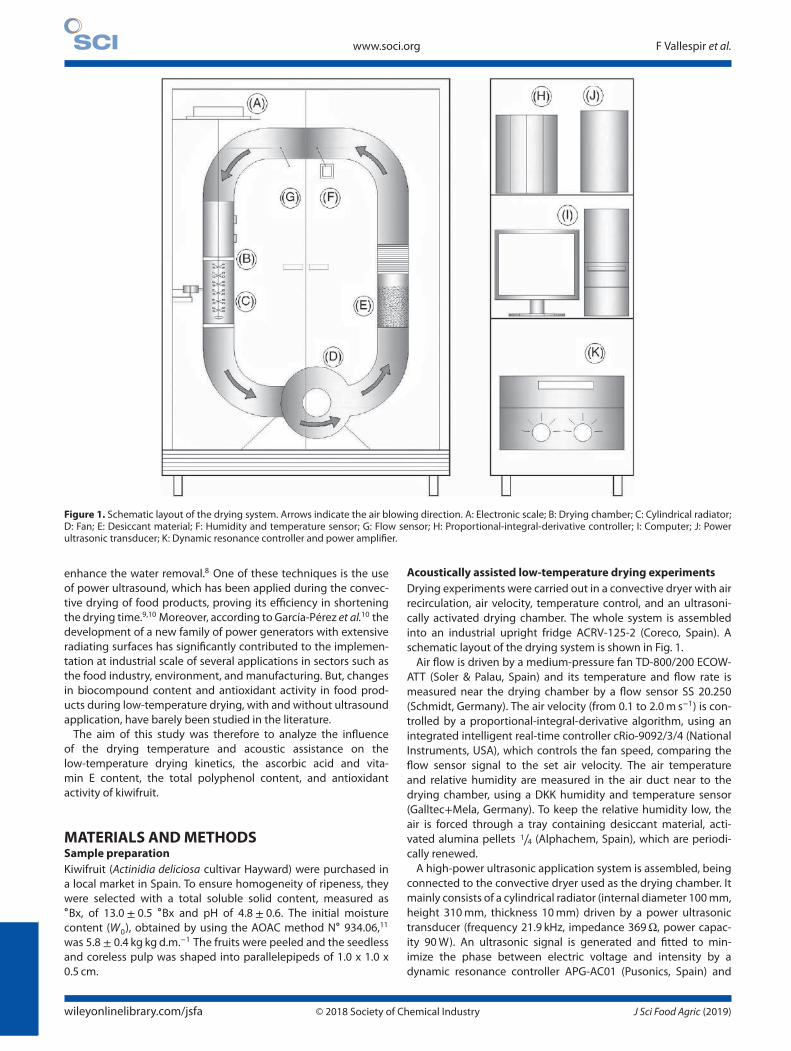
www.soci.org F Vallespir et al.
Figure 1. Schematic layout of the drying system. Arrows indicate the air blowing direction. A: Electronic scale; B: Drying chamber; C: Cylindrical radiator;D: Fan; E: Desiccant material; F: Humidity and temperature sensor; G: Flow sensor; H: Proportional-integral-derivative controller; I: Computer; J: Powerultrasonic transducer; K: Dynamic resonance controller and power amplifier.
enhance the water removal.8 One of these techniques is the useof power ultrasound, which has been applied during the convec-tive drying of food products, proving its efficiency in shorteningthe drying time.9,10 Moreover, according to García-Pérez et al.10 thedevelopment of a new family of power generators with extensiveradiating surfaces has significantly contributed to the implemen-tation at industrial scale of several applications in sectors such asthe food industry, environment, and manufacturing. But, changesin biocompound content and antioxidant activity in food prod-ucts during low-temperature drying, with and without ultrasoundapplication, have barely been studied in the literature.The aim of this study was therefore to analyze the influence
of the drying temperature and acoustic assistance on thelow-temperature drying kinetics, the ascorbic acid and vita-min E content, the total polyphenol content, and antioxidantactivity of kiwifruit.
MATERIALS ANDMETHODSSample preparationKiwifruit (Actinidia deliciosa cultivar Hayward) were purchased ina local market in Spain. To ensure homogeneity of ripeness, theywere selected with a total soluble solid content, measured as∘Bx, of 13.0 ± 0.5 ∘Bx and pH of 4.8 ± 0.6. The initial moisturecontent (W0), obtained by using the AOAC method N∘ 934.06,11was 5.8 ± 0.4 kg kg d.m.−1 The fruits were peeled and the seedlessand coreless pulp was shaped into parallelepipeds of 1.0 x 1.0 x0.5 cm.
Acoustically assisted low-temperature drying experimentsDrying experiments were carried out in a convective dryer with airrecirculation, air velocity, temperature control, and an ultrasoni-cally activated drying chamber. The whole system is assembledinto an industrial upright fridge ACRV-125-2 (Coreco, Spain). Aschematic layout of the drying system is shown in Fig. 1.Air flow is driven by a medium-pressure fan TD-800/200 ECOW-
ATT (Soler & Palau, Spain) and its temperature and flow rate ismeasured near the drying chamber by a flow sensor SS 20.250(Schmidt, Germany). The air velocity (from 0.1 to 2.0m s−1) is con-trolled by a proportional-integral-derivative algorithm, using anintegrated intelligent real-time controller cRio-9092/3/4 (NationalInstruments, USA), which controls the fan speed, comparing theflow sensor signal to the set air velocity. The air temperatureand relative humidity are measured in the air duct near to thedrying chamber, using a DKK humidity and temperature sensor(Galltec+Mela, Germany). To keep the relative humidity low, theair is forced through a tray containing desiccant material, acti-vated alumina pellets 1∕4 (Alphachem, Spain), which are periodi-cally renewed.A high-power ultrasonic application system is assembled, being
connected to the convective dryer used as the drying chamber. Itmainly consists of a cylindrical radiator (internal diameter 100mm,height 310mm, thickness 10mm) driven by a power ultrasonictransducer (frequency 21.9 kHz, impedance 369Ω, power capac-ity 90W). An ultrasonic signal is generated and fitted to min-imize the phase between electric voltage and intensity by adynamic resonance controller APG-AC01 (Pusonics, Spain) and
wileyonlinelibrary.com/jsfa © 2018 Society of Chemical Industry J Sci Food Agric (2019)126
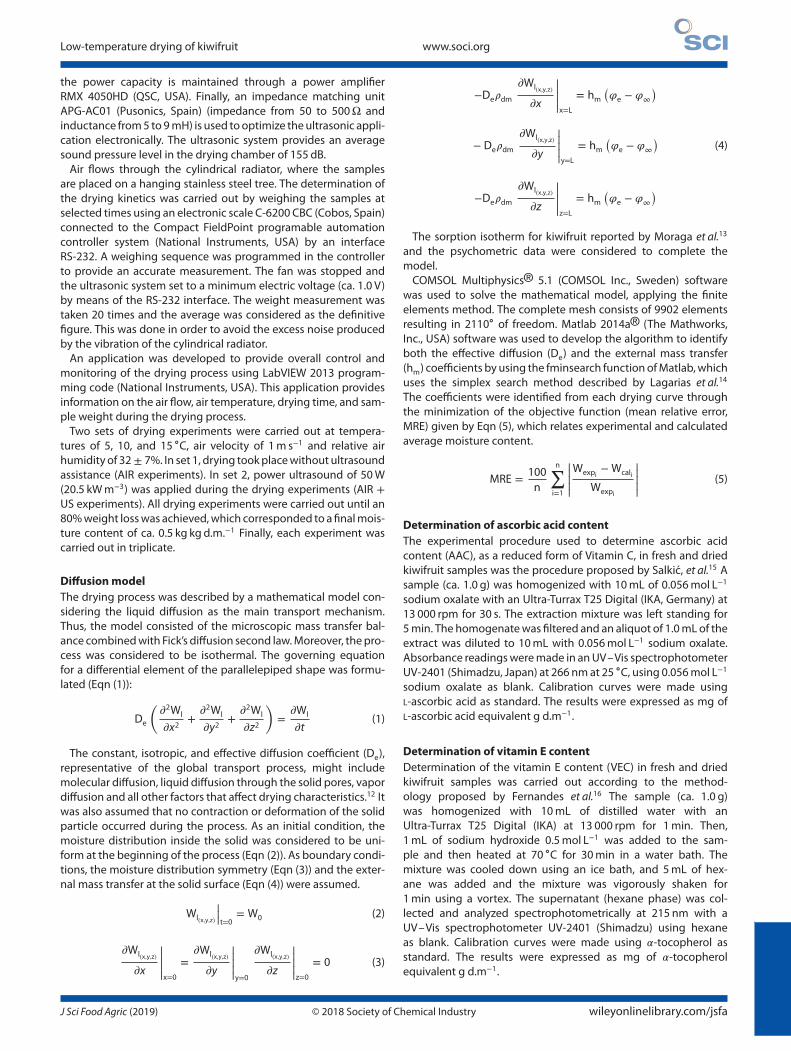
Low-temperature drying of kiwifruit www.soci.org
the power capacity is maintained through a power amplifierRMX 4050HD (QSC, USA). Finally, an impedance matching unitAPG-AC01 (Pusonics, Spain) (impedance from 50 to 500Ω andinductance from5 to9mH) is used tooptimize theultrasonic appli-cation electronically. The ultrasonic system provides an averagesound pressure level in the drying chamber of 155 dB.Air flows through the cylindrical radiator, where the samples
are placed on a hanging stainless steel tree. The determination ofthe drying kinetics was carried out by weighing the samples atselected times using an electronic scale C-6200 CBC (Cobos, Spain)connected to the Compact FieldPoint programable automationcontroller system (National Instruments, USA) by an interfaceRS-232. A weighing sequence was programmed in the controllerto provide an accurate measurement. The fan was stopped andthe ultrasonic system set to a minimum electric voltage (ca. 1.0 V)by means of the RS-232 interface. The weight measurement wastaken 20 times and the average was considered as the definitivefigure. This was done in order to avoid the excess noise producedby the vibration of the cylindrical radiator.An application was developed to provide overall control and
monitoring of the drying process using LabVIEW 2013 program-ming code (National Instruments, USA). This application providesinformation on the air flow, air temperature, drying time, and sam-ple weight during the drying process.Two sets of drying experiments were carried out at tempera-
tures of 5, 10, and 15 ∘C, air velocity of 1m s−1 and relative airhumidity of 32 ± 7%. In set 1, drying tookplacewithout ultrasoundassistance (AIR experiments). In set 2, power ultrasound of 50W(20.5 kWm−3) was applied during the drying experiments (AIR +US experiments). All drying experiments were carried out until an80%weight losswas achieved,which corresponded to afinalmois-ture content of ca. 0.5 kg kg d.m.−1 Finally, each experiment wascarried out in triplicate.
DiffusionmodelThe drying process was described by a mathematical model con-sidering the liquid diffusion as the main transport mechanism.Thus, the model consisted of the microscopic mass transfer bal-ance combinedwith Fick’s diffusion second law.Moreover, thepro-cess was considered to be isothermal. The governing equationfor a differential element of the parallelepiped shape was formu-lated (Eqn (1)):
De
(𝜕2Wl
𝜕x2+
𝜕2Wl
𝜕y2+
𝜕2Wl
𝜕z2
)=
𝜕Wl
𝜕t(1)
The constant, isotropic, and effective diffusion coefficient (De),representative of the global transport process, might includemolecular diffusion, liquid diffusion through the solid pores, vapordiffusion and all other factors that affect drying characteristics.12 Itwas also assumed that no contraction or deformation of the solidparticle occurred during the process. As an initial condition, themoisture distribution inside the solid was considered to be uni-form at the beginning of the process (Eqn (2)). As boundary condi-tions, the moisture distribution symmetry (Eqn (3)) and the exter-nal mass transfer at the solid surface (Eqn (4)) were assumed.
Wl(x,y,z)
|||t=0 = W0 (2)
𝜕Wl(x,y,z)
𝜕x
|||||x=0 =𝜕Wl(x,y,z)
𝜕y
|||||y=0𝜕Wl(x,y,z)
𝜕z
|||||z=0 = 0 (3)
−De𝜌dm
𝜕Wl(x,y,z)
𝜕x
|||||x=L = hm
(𝜑e − 𝜑∞
)
− De𝜌dm
𝜕Wl(x,y,z)
𝜕y
|||||y=L = hm
(𝜑e − 𝜑∞
)(4)
−De𝜌dm
𝜕Wl(x,y,z)
𝜕z
|||||z=L = hm
(𝜑e − 𝜑∞
)
The sorption isotherm for kiwifruit reported by Moraga et al.13
and the psychometric data were considered to complete themodel.COMSOL Multiphysics® 5.1 (COMSOL Inc., Sweden) software
was used to solve the mathematical model, applying the finiteelements method. The complete mesh consists of 9902 elementsresulting in 2110∘ of freedom. Matlab 2014a® (The Mathworks,Inc., USA) software was used to develop the algorithm to identifyboth the effective diffusion (De) and the external mass transfer(hm) coefficients by using the fminsearch functionofMatlab,whichuses the simplex search method described by Lagarias et al.14
The coefficients were identified from each drying curve throughthe minimization of the objective function (mean relative error,MRE) given by Eqn (5), which relates experimental and calculatedaverage moisture content.
MRE = 100n
n∑i=1
|||||Wexpi
−Wcali
Wexpi
||||| (5)
Determination of ascorbic acid contentThe experimental procedure used to determine ascorbic acidcontent (AAC), as a reduced form of Vitamin C, in fresh and driedkiwifruit samples was the procedure proposed by Salkic, et al.15 Asample (ca. 1.0 g) was homogenized with 10mL of 0.056mol L−1
sodium oxalate with an Ultra-Turrax T25 Digital (IKA, Germany) at13 000 rpm for 30 s. The extraction mixture was left standing for5min. The homogenatewas filtered and an aliquot of 1.0mL of theextract was diluted to 10mL with 0.056mol L−1 sodium oxalate.Absorbance readingsweremade in anUV–Vis spectrophotometerUV-2401 (Shimadzu, Japan) at 266 nmat 25 ∘C, using 0.056mol L−1
sodium oxalate as blank. Calibration curves were made usingL-ascorbic acid as standard. The results were expressed as mg ofL-ascorbic acid equivalent g d.m−1.
Determination of vitamin E contentDetermination of the vitamin E content (VEC) in fresh and driedkiwifruit samples was carried out according to the method-ology proposed by Fernandes et al.16 The sample (ca. 1.0 g)was homogenized with 10mL of distilled water with anUltra-Turrax T25 Digital (IKA) at 13 000 rpm for 1min. Then,1mL of sodium hydroxide 0.5mol L−1 was added to the sam-ple and then heated at 70 ∘C for 30min in a water bath. Themixture was cooled down using an ice bath, and 5mL of hex-ane was added and the mixture was vigorously shaken for1min using a vortex. The supernatant (hexane phase) was col-lected and analyzed spectrophotometrically at 215 nm with aUV–Vis spectrophotometer UV-2401 (Shimadzu) using hexaneas blank. Calibration curves were made using 𝛼-tocopherol asstandard. The results were expressed as mg of 𝛼-tocopherolequivalent g d.m−1.
J Sci Food Agric (2019) © 2018 Society of Chemical Industry wileyonlinelibrary.com/jsfa 127

www.soci.org F Vallespir et al.
Total polyphenol content and antioxidant activitydeterminationsMethanol extracts from the kiwifruit samples were pre-pared according to the methodology described by Herediaand Cisneros-Zevallos.17 Samples were accurately weighed (ca. 1 gfresh samples or ca. 0.1 g dried samples) and 20mL of methanolextraction solvent was added. The mixture was homogenizedusing a T25 Digital Ultra-Turrax (IKA) at 13 000 rpm for 1min at4 ∘C and the solution obtained was refrigerated overnight. Mix-tures were centrifuged at 4000 rpm for 10min and then filtered.The extracts were refrigerated at 4 ∘C until analysis. At least fourmethanol extracts were prepared for each sample.The total polyphenol content (TPC) was determined by
means of the Folin–Ciocalteu assay according to Singletonand Rossi.18 The antioxidant activity (AA) was spectrophotomet-rically determined using the ferric reducing antioxidant power(FRAP), cupric reducing antioxidant capacity (CUPRAC), and 22′-azino-bis(3-ethylbenzothiazoline-6-sulfonic acid) (ABTS) meth-ods as described by Benzie and Strain,19 Apak et al.,20 and Reet al.,21 respectively. Absorbance measurements were carried outat 25 ∘C in a UV/Vis/NIR spectrophotometer Multiskan Spectrum(Thermo Scientific, Finland) at 745 nm (TPC), 593 nm (FRAP),450 nm (CUPRAC), and 734 nm (ABTS). Absorbancemeasurementswere correlated with standard curves (0–250mg L−1 gallic acid forTPC and 0–400mg L−1 Trolox for AA). The results were expressedas mg of gallic acid equivalent g d.m−1. for the TPC, while the AAwas expressed as mg of Trolox equivalent g d.m−1.
Statistical analysesAll quality determinations were carried out in triplicate and resultswere expressed as the percentage loss (%) of the quality attributeusing the figures determined for the fresh sample as reference(Eqn (6)):
Loss (%) =[Fresh − Dried
Fresh
]× 100 (6)
Data were averaged from replicates and reported as an averagefigure ± standard deviation. An analysis of variance (ANOVA) wasapplied to analyze the effects of both the drying temperatureand the acoustic assistance during drying on the ascorbic acidand vitamin E contents, the total polyphenol content, and theantioxidant activity. Means were compared using Tukey’s test atP < 0.05. Statistical analyses were carried out using Language andEnvironment for Statistical Computing R (R Core Team, Austria).The percentage of explained variance (var) was also used to
evaluate further the accuracy of the simulation obtained (Eqn (7)):
var =[1 −
SyxSy
]× 100 (7)
RESULTS ANDDISCUSSIONDrying kineticsFigure 2 shows the experimental drying curves (dots) for the dif-ferent drying temperatures (5, 10, and 15 ∘C) without (AIR) andwith an acoustic assistance of 20.5 kWm−3 (AIR + US). Althoughlow-temperature drying is a time-demanding process, the useof acoustic energy promoted a remarkable reduction of thedrying time. As an example, to reach a moisture content of0.65 ± 0.03 kg kg d.m.−1, the drying time for the AIR samples driedat 5, 10 and 15 ∘C were of ca. 60, 34, and 19 h, respectively,whereas when ultrasound was applied (AIR + US), the drying time
0
1
2
3
4
5
6
0 10 20 30 40 50 60
Ave
rage
moi
stur
e co
nten
t (k
g kg
d.m
.–1)
Time (h)
5° C AIR
10° C AIR
15° C AIR
5° C AIR+US
10° C AIR+US
15° C AIR+US
Predicted
Figure 2. Experimental and predicted drying kinetics of kiwifruit without(AIR) and with 20.5 kWm−3 of acoustic assistance (AIR + US) at 5, 10, and15 ∘C. Average values ± standard deviations.
decreased by 62%, 65%, and 55% at 5, 10, and 15 ∘C, respec-tively. Santacatalina et al.22 also studied the influence of acousticassistance during the low-temperature drying at 1m s−1 of egg-plant cubes. These authors reported reductions in the drying timeof 80% and 58% when an acoustic assistance of 20.5 kWm−3 wasapplied at drying temperatures of 0 and 10 ∘C, respectively. Simi-larly, in the low-temperature drying of apple cubes from 0 to 10 ∘C(2m s−1), Santacatalina et al.4 observed that theacoustic assistance(20.5 kWm−3) increased the drying rate of apples at every dry-ing temperature tested. In this case, the reduction of the dryingtime promoted by ultrasound application was similar (60%) in theexperiments carried out at 0, 5, and 10 ∘C.
DiffusionmodelAs described above, the diffusion model was designed for a paral-lelepiped. By minimizing the differences between the experimen-tal drying curves and the calculated ones, the effective diffusioncoefficient De and the external mass transfer coefficient hm, weresimultaneously determined for each experiment. Results are pre-sented in Table 1, togetherwith the averageMRE and var, obtainedby comparing the experimental and simulated drying curves.The identified De in the AIR experiments ranged from 1.37 (5 ∘C)
to 4.30× 10⁻¹¹ m2 s−1 (15 ∘C), but in the AIR+US experiments thiscoefficient ranged from 3.67 (5 ∘C) to 9.45 × 10⁻¹¹ m2 s−1 (15 ∘C).These figures were within the range of those observed by Santa-catalina et al.4 in the low-temperature drying of apple (2m s−1).Santacatalina et al.4 reported De figures from 3.3 (0 ∘C) to 8.8 ×10⁻¹¹ m2 s−1 (10 ∘C), when dryingwas carried outwithout acousticassistance, and from 8.6 (0 ∘C) to 22.3 × 10⁻¹¹ m2 s−1 (10 ∘C), whenan acoustic power of 20.5Wm−3 was applied. Higher figures werereported by Darıcı and Sen23 in the hot-air drying of kiwifruit slicesof 4mm (2.3–7.0 × 10⁻¹⁰ m2 s−1) and 6mm thickness (2.8–5.9 ×10⁻¹⁰ m2 s−1) dried between 50 and 80 ∘C and with an air velocityof 0.5m s−1. Thus, ten times higher effective diffusion coefficientswere obtained at hot air drying, probably due to faster waterdiffusion inside the solid matrix at higher temperatures.As expected, the higher the drying temperature, the higher the
effective diffusion coefficient. The identified effective diffusioncoefficient increased by 214% and 157% in the AIR and AIR + USexperiments, respectively, when the temperature was increasedfrom 5 to 15 ∘C. The effective diffusion coefficient increment washigher in AIR experiments than in AIR + US experiments as wasalso reported by Santacatalina et al.4 (167% and 160% in AIR and
wileyonlinelibrary.com/jsfa © 2018 Society of Chemical Industry J Sci Food Agric (2019)128
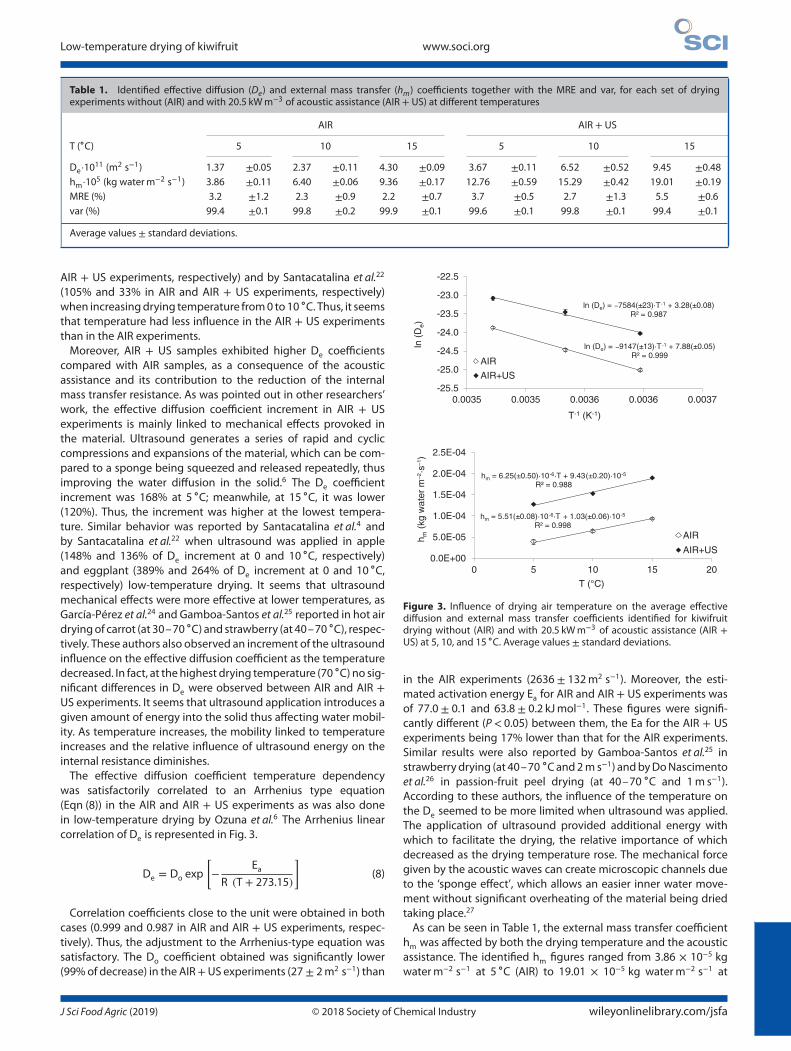
Low-temperature drying of kiwifruit www.soci.org
Table 1. Identified effective diffusion (De) and external mass transfer (hm) coefficients together with the MRE and var, for each set of dryingexperiments without (AIR) and with 20.5 kWm−3 of acoustic assistance (AIR + US) at different temperatures
AIR AIR + US
T (∘C) 5 10 15 5 10 15
De·1011 (m2 s−1) 1.37 ±0.05 2.37 ±0.11 4.30 ±0.09 3.67 ±0.11 6.52 ±0.52 9.45 ±0.48hm·105 (kg waterm−2 s−1) 3.86 ±0.11 6.40 ±0.06 9.36 ±0.17 12.76 ±0.59 15.29 ±0.42 19.01 ±0.19MRE (%) 3.2 ±1.2 2.3 ±0.9 2.2 ±0.7 3.7 ±0.5 2.7 ±1.3 5.5 ±0.6var (%) 99.4 ±0.1 99.8 ±0.2 99.9 ±0.1 99.6 ±0.1 99.8 ±0.1 99.4 ±0.1
Average values ± standard deviations.
AIR + US experiments, respectively) and by Santacatalina et al.22
(105% and 33% in AIR and AIR + US experiments, respectively)when increasingdrying temperature from0 to10 ∘C. Thus, it seemsthat temperature had less influence in the AIR + US experimentsthan in the AIR experiments.Moreover, AIR + US samples exhibited higher De coefficients
compared with AIR samples, as a consequence of the acousticassistance and its contribution to the reduction of the internalmass transfer resistance. As was pointed out in other researchers’work, the effective diffusion coefficient increment in AIR + USexperiments is mainly linked to mechanical effects provoked inthe material. Ultrasound generates a series of rapid and cycliccompressions and expansions of the material, which can be com-pared to a sponge being squeezed and released repeatedly, thusimproving the water diffusion in the solid.6 The De coefficientincrement was 168% at 5 ∘C; meanwhile, at 15 ∘C, it was lower(120%). Thus, the increment was higher at the lowest tempera-ture. Similar behavior was reported by Santacatalina et al.4 andby Santacatalina et al.22 when ultrasound was applied in apple(148% and 136% of De increment at 0 and 10 ∘C, respectively)and eggplant (389% and 264% of De increment at 0 and 10 ∘C,respectively) low-temperature drying. It seems that ultrasoundmechanical effects were more effective at lower temperatures, asGarcía-Pérez et al.24 and Gamboa-Santos et al.25 reported in hot airdryingof carrot (at 30–70 ∘C) and strawberry (at 40–70 ∘C), respec-tively. These authors also observed an increment of the ultrasoundinfluence on the effective diffusion coefficient as the temperaturedecreased. In fact, at thehighest drying temperature (70 ∘C) no sig-nificant differences in De were observed between AIR and AIR +US experiments. It seems that ultrasound application introduces agiven amount of energy into the solid thus affecting water mobil-ity. As temperature increases, the mobility linked to temperatureincreases and the relative influence of ultrasound energy on theinternal resistance diminishes.The effective diffusion coefficient temperature dependency
was satisfactorily correlated to an Arrhenius type equation(Eqn (8)) in the AIR and AIR + US experiments as was also donein low-temperature drying by Ozuna et al.6 The Arrhenius linearcorrelation of De is represented in Fig. 3.
De = Do exp
[−
EaR (T + 273.15)
](8)
Correlation coefficients close to the unit were obtained in bothcases (0.999 and 0.987 in AIR and AIR + US experiments, respec-tively). Thus, the adjustment to the Arrhenius-type equation wassatisfactory. The Do coefficient obtained was significantly lower(99%of decrease) in the AIR+US experiments (27 ± 2m2 s−1) than
-25.5
-25.0
-24.5
-24.0
-23.5
-23.0
-22.5
0.0035 0.0035 0.0036 0.0036 0.0037
ln (
De)
T-1 (K-1)
AIR
AIR+US
ln (De) = 7584(±23)·T-1 + 3.28(±0.08)R2 = 0.987
ln (De) = 9147(±13)·T-1 + 7.88(±0.05)R2 = 0.999
hm = 5.51(±0.08)·10-6·T + 1.03(±0.06)·10-5
R2 = 0.998
hm = 6.25(±0.50)·10-6·T + 9.43(±0.20)·10-5
R2 = 0.988
0.0E+00
5.0E-05
1.0E-04
1.5E-04
2.0E-04
2.5E-04
0 5 10 15 20
h m(k
g w
ater
m–2
·s–1
)
T (°C)
AIR
AIR+US
Figure 3. Influence of drying air temperature on the average effectivediffusion and external mass transfer coefficients identified for kiwifruitdrying without (AIR) and with 20.5 kWm−3 of acoustic assistance (AIR +US) at 5, 10, and 15 ∘C. Average values ± standard deviations.
in the AIR experiments (2636 ± 132m2 s−1). Moreover, the esti-mated activation energy Ea for AIR and AIR + US experiments wasof 77.0 ± 0.1 and 63.8 ± 0.2 kJmol−1. These figures were signifi-cantly different (P< 0.05) between them, the Ea for the AIR + USexperiments being 17% lower than that for the AIR experiments.Similar results were also reported by Gamboa-Santos et al.25 instrawberrydrying (at 40–70 ∘Cand2m s−1) andbyDoNascimentoet al.26 in passion-fruit peel drying (at 40–70 ∘C and 1m s−1).According to these authors, the influence of the temperature onthe De seemed to be more limited when ultrasound was applied.The application of ultrasound provided additional energy withwhich to facilitate the drying, the relative importance of whichdecreased as the drying temperature rose. The mechanical forcegiven by the acoustic waves can create microscopic channels dueto the ‘sponge effect’, which allows an easier inner water move-ment without significant overheating of the material being driedtaking place.27
As can be seen in Table 1, the external mass transfer coefficienthm was affected by both the drying temperature and the acousticassistance. The identified hm figures ranged from 3.86 × 10⁻⁵ kgwaterm−2 s−1 at 5 ∘C (AIR) to 19.01 × 10⁻⁵ kg waterm−2 s−1 at
J Sci Food Agric (2019) © 2018 Society of Chemical Industry wileyonlinelibrary.com/jsfa 129
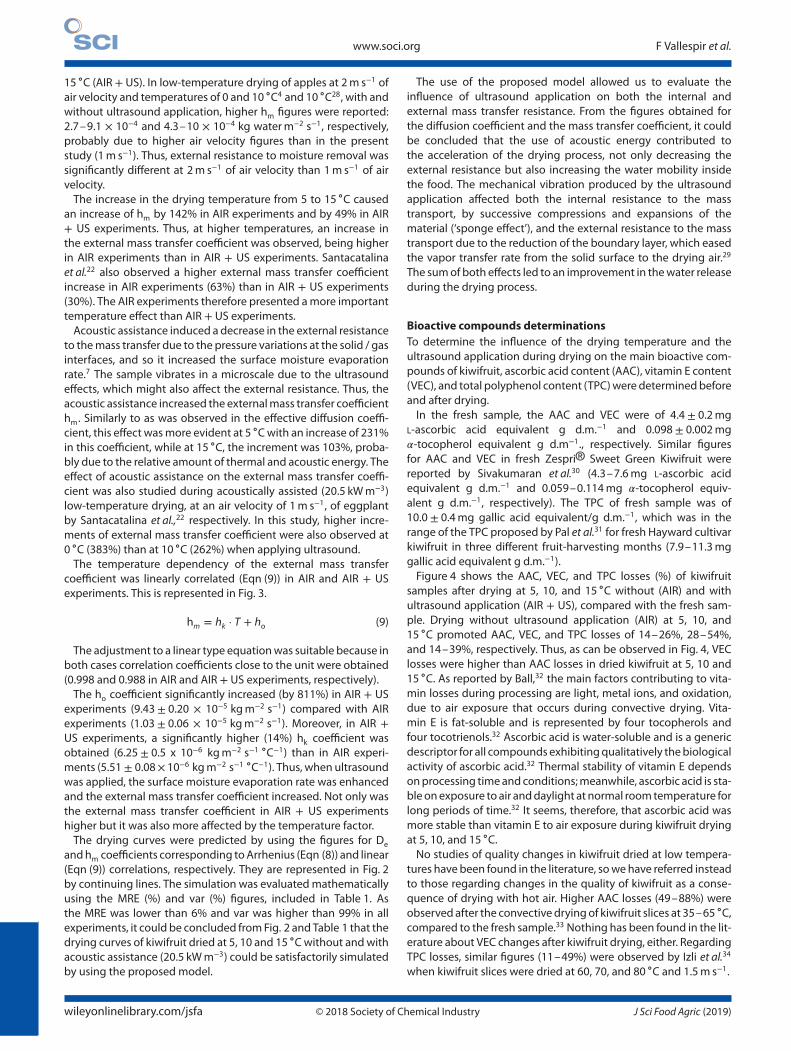
www.soci.org F Vallespir et al.
15 ∘C (AIR + US). In low-temperature drying of apples at 2m s−1 ofair velocity and temperatures of 0 and 10 ∘C4 and 10 ∘C28, with andwithout ultrasound application, higher hm figures were reported:2.7–9.1 × 10⁻⁴ and 4.3–10 × 10−4 kg waterm−2 s−1, respectively,probably due to higher air velocity figures than in the presentstudy (1m s−1). Thus, external resistance to moisture removal wassignificantly different at 2m s−1 of air velocity than 1m s−1 of airvelocity.The increase in the drying temperature from 5 to 15 ∘C caused
an increase of hm by 142% in AIR experiments and by 49% in AIR+ US experiments. Thus, at higher temperatures, an increase inthe external mass transfer coefficient was observed, being higherin AIR experiments than in AIR + US experiments. Santacatalinaet al.22 also observed a higher external mass transfer coefficientincrease in AIR experiments (63%) than in AIR + US experiments(30%). The AIR experiments therefore presented amore importanttemperature effect than AIR + US experiments.Acoustic assistance induced a decrease in the external resistance
to themass transfer due to the pressure variations at the solid / gasinterfaces, and so it increased the surface moisture evaporationrate.7 The sample vibrates in a microscale due to the ultrasoundeffects, which might also affect the external resistance. Thus, theacoustic assistance increased the externalmass transfer coefficienthm. Similarly to as was observed in the effective diffusion coeffi-cient, this effect wasmore evident at 5 ∘Cwith an increase of 231%in this coefficient, while at 15 ∘C, the increment was 103%, proba-bly due to the relative amount of thermal and acoustic energy. Theeffect of acoustic assistance on the external mass transfer coeffi-cient was also studied during acoustically assisted (20.5 kWm−3)low-temperature drying, at an air velocity of 1m s−1, of eggplantby Santacatalina et al.,22 respectively. In this study, higher incre-ments of external mass transfer coefficient were also observed at0 ∘C (383%) than at 10 ∘C (262%) when applying ultrasound.The temperature dependency of the external mass transfer
coefficient was linearly correlated (Eqn (9)) in AIR and AIR + USexperiments. This is represented in Fig. 3.
hm = hk · T + ho (9)
The adjustment to a linear type equationwas suitable because inboth cases correlation coefficients close to the unit were obtained(0.998 and 0.988 in AIR and AIR + US experiments, respectively).The ho coefficient significantly increased (by 811%) in AIR + US
experiments (9.43 ± 0.20 × 10⁻⁵ kgm−2 s−1) compared with AIRexperiments (1.03 ± 0.06 × 10⁻⁵ kgm−2 s−1). Moreover, in AIR +US experiments, a significantly higher (14%) hk coefficient wasobtained (6.25 ± 0.5 x 10⁻⁶ kgm−2 s−1 ∘C−1) than in AIR experi-ments (5.51 ± 0.08× 10⁻⁶ kgm−2 s−1 ∘C−1). Thus, when ultrasoundwas applied, the surface moisture evaporation rate was enhancedand the external mass transfer coefficient increased. Not only wasthe external mass transfer coefficient in AIR + US experimentshigher but it was also more affected by the temperature factor.The drying curves were predicted by using the figures for De
andhm coefficients corresponding toArrhenius (Eqn (8)) and linear(Eqn (9)) correlations, respectively. They are represented in Fig. 2by continuing lines. The simulation was evaluatedmathematicallyusing the MRE (%) and var (%) figures, included in Table 1. Asthe MRE was lower than 6% and var was higher than 99% in allexperiments, it could be concluded fromFig. 2 and Table 1 that thedrying curves of kiwifruit dried at 5, 10 and 15 ∘Cwithout andwithacoustic assistance (20.5 kWm−3) could be satisfactorily simulatedby using the proposed model.
The use of the proposed model allowed us to evaluate theinfluence of ultrasound application on both the internal andexternal mass transfer resistance. From the figures obtained forthe diffusion coefficient and the mass transfer coefficient, it couldbe concluded that the use of acoustic energy contributed tothe acceleration of the drying process, not only decreasing theexternal resistance but also increasing the water mobility insidethe food. The mechanical vibration produced by the ultrasoundapplication affected both the internal resistance to the masstransport, by successive compressions and expansions of thematerial (‘sponge effect’), and the external resistance to the masstransport due to the reduction of the boundary layer, which easedthe vapor transfer rate from the solid surface to the drying air.29
The sumof both effects led to an improvement in thewater releaseduring the drying process.
Bioactive compounds determinationsTo determine the influence of the drying temperature and theultrasound application during drying on the main bioactive com-pounds of kiwifruit, ascorbic acid content (AAC), vitamin E content(VEC), and total polyphenol content (TPC)were determinedbeforeand after drying.In the fresh sample, the AAC and VEC were of 4.4 ± 0.2mg
L-ascorbic acid equivalent g d.m.−1 and 0.098 ± 0.002mg𝛼-tocopherol equivalent g d.m−1., respectively. Similar figuresfor AAC and VEC in fresh Zespri® Sweet Green Kiwifruit werereported by Sivakumaran et al.30 (4.3–7.6mg L-ascorbic acidequivalent g d.m.−1 and 0.059–0.114mg 𝛼-tocopherol equiv-alent g d.m.−1, respectively). The TPC of fresh sample was of10.0 ± 0.4mg gallic acid equivalent/g d.m.−1, which was in therange of the TPC proposed by Pal et al.31 for fresh Hayward cultivarkiwifruit in three different fruit-harvesting months (7.9–11.3mggallic acid equivalent g d.m.−1).Figure 4 shows the AAC, VEC, and TPC losses (%) of kiwifruit
samples after drying at 5, 10, and 15 ∘C without (AIR) and withultrasound application (AIR + US), compared with the fresh sam-ple. Drying without ultrasound application (AIR) at 5, 10, and15 ∘C promoted AAC, VEC, and TPC losses of 14–26%, 28–54%,and 14–39%, respectively. Thus, as can be observed in Fig. 4, VEClosses were higher than AAC losses in dried kiwifruit at 5, 10 and15 ∘C. As reported by Ball,32 the main factors contributing to vita-min losses during processing are light, metal ions, and oxidation,due to air exposure that occurs during convective drying. Vita-min E is fat-soluble and is represented by four tocopherols andfour tocotrienols.32 Ascorbic acid is water-soluble and is a genericdescriptor for all compoundsexhibitingqualitatively thebiologicalactivity of ascorbic acid.32 Thermal stability of vitamin E dependsonprocessing timeandconditions;meanwhile, ascorbic acid is sta-bleonexposure to air anddaylight at normal roomtemperature forlong periods of time.32 It seems, therefore, that ascorbic acid wasmore stable than vitamin E to air exposure during kiwifruit dryingat 5, 10, and 15 ∘C.No studies of quality changes in kiwifruit dried at low tempera-
tures have been found in the literature, sowehave referred insteadto those regarding changes in the quality of kiwifruit as a conse-quence of drying with hot air. Higher AAC losses (49–88%) wereobserved after the convective dryingof kiwifruit slices at 35–65 ∘C,compared to the fresh sample.33 Nothing has been found in the lit-erature about VEC changes after kiwifruit drying, either. RegardingTPC losses, similar figures (11–49%) were observed by Izli et al.34
when kiwifruit slices were dried at 60, 70, and 80 ∘C and 1.5m s−1.
wileyonlinelibrary.com/jsfa © 2018 Society of Chemical Industry J Sci Food Agric (2019)130

Low-temperature drying of kiwifruit www.soci.org
cb
a
dcd c
0
10
20
30
40
50
60
70
80
5 °C 10 °C 15 °C
AA
C lo
ss (
%)
AIRAIR+US
d
c
b
ab
c
0
10
20
30
40
50
60
70
80
5 °C 10 °C 15 °C
VE
C lo
ss (
%)
AIRAIR+US
e
d
ba
bccd
0
10
20
30
40
50
60
70
80
5 °C 10 °C 15 °C
TP
C lo
ss (
%)
AIRAIR+US
Figure 4. Kiwifruit losses (%) of ascorbic acid content (AAC), vitamin E content (VEC) and total polyphenol content (TPC) after drying at 5, 10 and 15 ∘Cwithout (AIR, white bars) and with 20.5 kWm−3 of acoustic assistance (AIR + US, grey bars). Average values ± standard deviations. Means with differentletters for AAC, VEC or TPC losses showed significant differences according to Tukey’s test (P < 0.05).
Among all dried samples without ultrasound application (AIR),the highest losses in AAC, VEC, and TPC were observed in samplesdriedat 15 ∘C,probablydue tohigherbioactive compoundsdegra-dation at higher temperatures. Similar results were obtained bySantacatalina et al.:4 TPC exhibited slight but significantly higher(P < 0.05) losses in apple dried samples at 10 ∘C (40%) than at 0 ∘C(36%). In hot-air drying of kiwifruit, higher AAC losses were alsoobserved with the increase of the drying temperature by Kayaet al.33 at 35–65 ∘C (49–88% losses).Samples dried at 5, 10, and 15 ∘C with ultrasound application
(AIR + US) exhibited AAC, VEC and TPC losses of 6–15%, 47–65%and 30–50%, respectively, compared with the fresh sample. Thus,also in this case, the VEC losses were higher than AAC losses indried samples with ultrasound application at 5, 10 and 15 ∘C.Furthermore, the TPC losses were also higher than the AAC lossesin these samples.In the case of samples dried at 5 and 10 ∘Cwith ultrasound appli-
cation (AIR + US), the VEC and the TPC losses were significantlyhigher (P < 0.05) than the corresponding dried samples withoutultrasound application (AIR). This behavior was also observed bySantacatalina et al.4 in TPC when drying apple cubes at tempera-tures of 0, 5, and 10 ∘C with and without ultrasound application(at 20.5 kWm−3). According to this study, this greater degrada-tion could be linked to the structural damage of cells broughtabout by ultrasound. The mechanical stress linked to ultrasonicwave propagation could therefore aid the release of oxidativeenzymes and intra-cellular compounds into the solvent, contribut-ing to thedegradation of polyphenol in a similarway to freezing. Inhot-air drying, high degradation of VEC16,35 and TPC26,36 were alsoreported by different studies when ultrasound was applied.However, samples dried at 15 ∘C with ultrasound application
(AIR + US) exhibited significantly lower (P < 0.05) losses of AAC(as well as samples dried at 5 and 10 ∘C), VEC, and TPC, thanthe corresponding dried samples without ultrasound application(AIR). It seems that ultrasound application led to a better retentionof TPC in these cases, probably due to the shortening of the dryingtime, which reduces the thermal exposure of the samples and,consequently, the bioactive compound degradation. Accordingto Moreno et al.,37 the application of ultrasound can activate aresponse mechanism in the tissue that induces the formationof new phenolic compounds, not only through the combinationof existing compounds but also via the activation of secondarymetabolic pathways. Furthermore, the fact that the ultrasonictreatment produced a possible inactivation of oxidative enzymesmust also be considered. Similar effects in AAC,38 VEC16,35 and
TPC26 were also reported in the bibliography of hot-air dryingwhen ultrasound was applied.
Antioxidant activityAntioxidant activity (AA) in kiwifruit samples was determinedusing the FRAP, CUPRAC, andABTSmethods to evaluate the effectsof drying temperature and ultrasound application. In each AAmethodused, themeasurement is basedona single electron trans-fer, but the antioxidants present in themediummaybehydrophilicor lipophilic in nature and this will aid the reaction to a greateror lesser extent. It should be noted that, as each method is basedon a different chemical system and / or reaction, the AA figuresclearly varied for each sampleextract, dependingon themethod.39
However, the results of AA according to FRAP, CUPRAC, and ABTScorrelated highly with each other, the correlation coefficient beinghigher than 0.89.The AA of the fresh sample, according to the FRAP, CUPRAC,
and ABTS methods, was 42 ± 3, 26 ± 1 and 34 ± 2mg Troloxequivalent g d.m.−1, respectively. Similar values of AA, accord-ing to the FRAP method, were reported by Pal et al.31 in freshkiwifruit of the Hayward cultivar at three different fruit-harvestingmonths (38–50mg Trolox equivalent g d.m.−1). Similar values ofAA, according to the CUPRAC and ABTS methods, were reportedby Leontowicz et al.40 in kiwifruit (22 ± 3 and 41 ± 4mg Troloxequivalent g d.m.−1, respectively).Loss (%) (Eqn (6)) of the AA, according to the FRAP, CUPRAC
and ABTS methods, in the kiwifruit samples after drying at 5,10, and 15 ∘C without (AIR) and with ultrasound application (AIR+ US), compared with the fresh sample, are shown in Fig. 5. Ingeneral, when samples were dried without ultrasound assistance(AIR), the AA losses were higher after drying at 15 ∘C than at5 ∘C, as was also observed in bioactive compounds losses, whichmight be related to higher bioactive compounds degradationat higher temperatures. Santacatalina et al.4 also reported signif-icantly higher (P < 0.05) AA Loss (%) according to the CUPRACmethod in apple-dried samples at 10 ∘C (21%) than at 0 ∘C (18%).Antioxidant activity Loss (%) were significantly higher (P < 0.05)
in samples dried at 5 and 10 ∘C with ultrasound application (AIR+ US) than the corresponding dried samples without ultrasoundapplication (AIR). As was mentioned above, this greater degrada-tion could be linked to the structural damage to cells broughtabout by ultrasound. Santacatalina et al.4 also reported lower AAaccording toABTS andCUPRACmethodswhendrying apple cubesat low temperatures of 0, 5 and 10 ∘Cwithout and with ultrasound
J Sci Food Agric (2019) © 2018 Society of Chemical Industry wileyonlinelibrary.com/jsfa 131
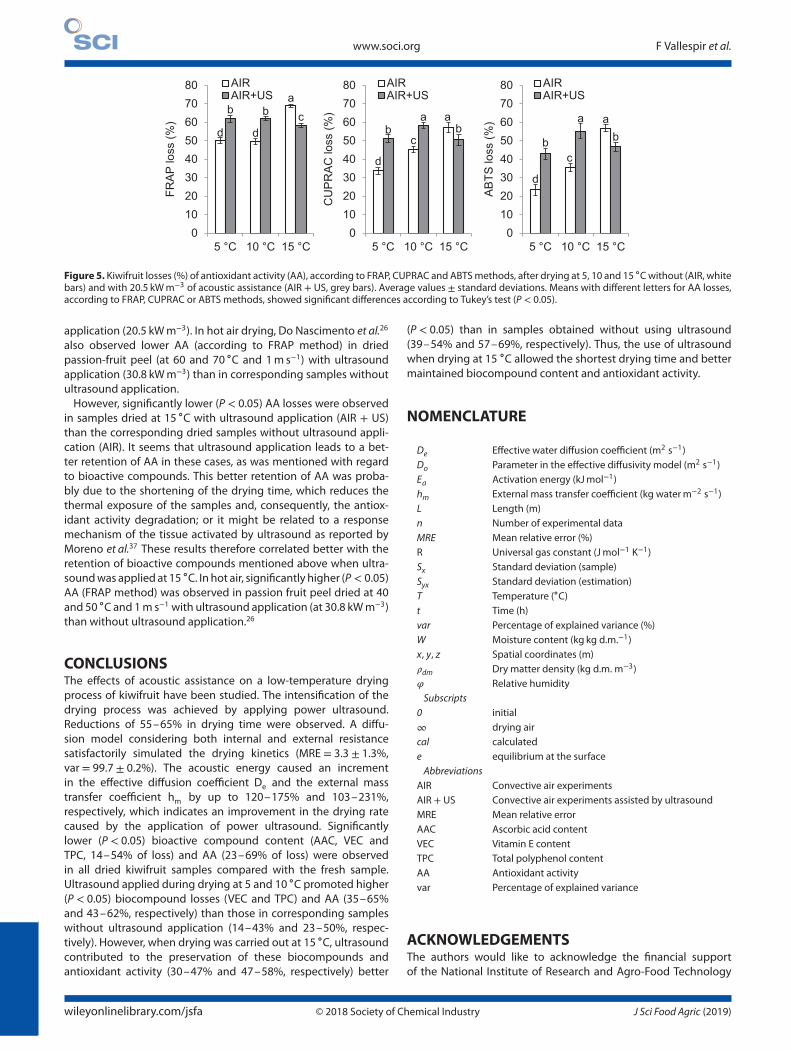
www.soci.org F Vallespir et al.
d d
ab b c
01020304050607080
5 °C 10 °C 15 °C
FRAP
loss
(%)
AIRAIR+US
d
c
ab
ab
01020304050607080
5 °C 10 °C 15 °C
CU
PRAC
loss
(%)
AIRAIR+US
d
c
a
b
ab
01020304050607080
5 °C 10 °C 15 °C
ABTS
loss
(%)
AIRAIR+US
Figure 5. Kiwifruit losses (%) of antioxidant activity (AA), according to FRAP, CUPRAC and ABTSmethods, after drying at 5, 10 and 15 ∘Cwithout (AIR, whitebars) and with 20.5 kWm−3 of acoustic assistance (AIR + US, grey bars). Average values ± standard deviations. Means with different letters for AA losses,according to FRAP, CUPRAC or ABTS methods, showed significant differences according to Tukey’s test (P < 0.05).
application (20.5 kWm−3). In hot air drying, Do Nascimento et al.26
also observed lower AA (according to FRAP method) in driedpassion-fruit peel (at 60 and 70 ∘C and 1m s−1) with ultrasoundapplication (30.8 kWm−3) than in corresponding samples withoutultrasound application.However, significantly lower (P < 0.05) AA losses were observed
in samples dried at 15 ∘C with ultrasound application (AIR + US)than the corresponding dried samples without ultrasound appli-cation (AIR). It seems that ultrasound application leads to a bet-ter retention of AA in these cases, as was mentioned with regardto bioactive compounds. This better retention of AA was proba-bly due to the shortening of the drying time, which reduces thethermal exposure of the samples and, consequently, the antiox-idant activity degradation; or it might be related to a responsemechanism of the tissue activated by ultrasound as reported byMoreno et al.37 These results therefore correlated better with theretention of bioactive compounds mentioned above when ultra-soundwas applied at 15 ∘C. In hot air, significantly higher (P < 0.05)AA (FRAP method) was observed in passion fruit peel dried at 40and 50 ∘C and 1m s−1 with ultrasound application (at 30.8 kWm−3)than without ultrasound application.26
CONCLUSIONSThe effects of acoustic assistance on a low-temperature dryingprocess of kiwifruit have been studied. The intensification of thedrying process was achieved by applying power ultrasound.Reductions of 55–65% in drying time were observed. A diffu-sion model considering both internal and external resistancesatisfactorily simulated the drying kinetics (MRE = 3.3 ± 1.3%,var = 99.7 ± 0.2%). The acoustic energy caused an incrementin the effective diffusion coefficient De and the external masstransfer coefficient hm by up to 120–175% and 103–231%,respectively, which indicates an improvement in the drying ratecaused by the application of power ultrasound. Significantlylower (P < 0.05) bioactive compound content (AAC, VEC andTPC, 14–54% of loss) and AA (23–69% of loss) were observedin all dried kiwifruit samples compared with the fresh sample.Ultrasound applied during drying at 5 and 10 ∘C promoted higher(P < 0.05) biocompound losses (VEC and TPC) and AA (35–65%and 43–62%, respectively) than those in corresponding sampleswithout ultrasound application (14–43% and 23–50%, respec-tively). However, when drying was carried out at 15 ∘C, ultrasoundcontributed to the preservation of these biocompounds andantioxidant activity (30–47% and 47–58%, respectively) better
(P < 0.05) than in samples obtained without using ultrasound(39–54% and 57–69%, respectively). Thus, the use of ultrasoundwhen drying at 15 ∘C allowed the shortest drying time and bettermaintained biocompound content and antioxidant activity.
NOMENCLATURE
De Effective water diffusion coefficient (m2 s−1)Do Parameter in the effective diffusivity model (m2 s−1)Ea Activation energy (kJmol−1)hm External mass transfer coefficient (kg waterm−2 s−1)L Length (m)n Number of experimental dataMRE Mean relative error (%)R Universal gas constant (Jmol−1 K−1)Sx Standard deviation (sample)Syx Standard deviation (estimation)T Temperature (∘C)t Time (h)var Percentage of explained variance (%)W Moisture content (kg kg d.m.−1)x, y, z Spatial coordinates (m)𝜌dm Dry matter density (kg d.m. m−3)𝜑 Relative humiditySubscripts
0 initial∞ drying aircal calculatede equilibrium at the surfaceAbbreviations
AIR Convective air experimentsAIR + US Convective air experiments assisted by ultrasoundMRE Mean relative errorAAC Ascorbic acid contentVEC Vitamin E contentTPC Total polyphenol contentAA Antioxidant activityvar Percentage of explained variance
ACKNOWLEDGEMENTSThe authors would like to acknowledge the financial supportof the National Institute of Research and Agro-Food Technology
wileyonlinelibrary.com/jsfa © 2018 Society of Chemical Industry J Sci Food Agric (2019)132
Low-temperature drying of kiwifruit www.soci.org
(INIA) and co-financed with ERDF funds (RTA2015-00060-C04-03and RTA2015-00060-C04-02 projects) and the Spanish Govern-ment (MINECO) for the BES-2013-064131 fellowship.
REFERENCES1 Soquetta MB, Stefanello FS, Huerta KM, Monteiro SS, da Rosa CS and
Terra NN, Characterization of physiochemical and microbiologicalproperties, and bioactive compounds, of flour made from the skinand bagasse of kiwi fruit (Actinidia deliciosa). Food Chem 199 (Suppl.C):471–478 (2016).
2 Du G, Li M, Ma F and Liang D, Antioxidant capacity and the relation-ship with polyphenol and vitamin C in Actinidia fruits. Food Chem113:557–562 (2009).
3 Fernández-Sestelo A, de Saá RS, Pérez-Lamela C, Torrado-Agrasar A,Rúa ML and Pastrana-Castro L, Overall quality properties in pres-surized kiwi purée: microbial, physicochemical, nutritive and sen-sory tests during refrigerated storage. Innov Food Sci Emerg Technol(Suppl. C) 20:64–72 (2013).
4 Santacatalina J, Rodríguez O, Simal S, Cárcel J, Mulet A andGarcía-Pérez J, Ultrasonically enhanced low-temperature dry-ing of apple: influence on drying kinetics and antioxidant potential.J Food Eng 138:35–44 (2014).
5 Vallespir F, Cárcel JA, Marra F, Eim VS and Simal S, Improvement ofmass transfer by freezing pre-treatment and ultrasound applicationon the convective drying of beetroot (Beta vulgaris L.). Food BioprocTech 11:72–83 (2018).
6 Ozuna C, Cárcel JA, Walde PM and Garcia-Perez JV, Low-temperaturedrying of salted cod (Gadus morhua) assisted by high power ultra-sound: kinetics andphysical properties. InnovFoodSci EmergTechnol(Suppl. C) 23:146–155 (2014).
7 Rodríguez Ó, Santacatalina JV, Simal S, Garcia-Perez JV, Femenia Aand Rosselló C, Influence of power ultrasound application on dryingkinetics of apple and its antioxidant and microstructural properties.J Food Eng 129:21–29 (2014).
8 García-Pérez JV, Cárcel JA, Riera E, Rosselló C and Mulet A, Intensifica-tion of low-temperature drying by using ultrasound. Drying Technol30:1199–1208 (2012).
9 Cárcel JA,García-Pérez JV, Riera E, RossellóC andMuletA,Ultrasonicallyassisted drying, inUltrasound in FoodProcessing, ed. byMar Villamiel,Jose V. Garcia-Perez, Antonia Montilla, Juan A. Carcel, Jose Benedito,John Wiley & Sons, Ltd, New York, pp. 371–391 (2017).
10 García-Pérez JV, Carcel JA, Mulet A, Riera E and Gallego-Juarez JA,Ultrasonic drying for food preservation, in Power Ultrasonics, ed.by, Juan A Gallego-Juárez and Karl F Graff, Woodhead Publishing,Oxford, pp. 875–910 (2015).
11 Association of Analytical Communities (AOAC),Moisture in Dried Fruits,16th edn. AOAC, Rockville, MD (2006).
12 Rodríguez Ó, Eim VS, Simal S, Femenia A and Rosselló C, Validation ofa diffusion model using moisture profiles measured by means ofTD-NMR in apples (Malus domestica). Food Bioproc Tech 6:542–552(2013).
13 Moraga G, Martínez-Navarrete N and Chiralt A, Water sorptionisotherms and phase transitions in kiwifruit. J Food Eng 72:147–156(2006).
14 Lagarias JC, Reeds JA, Wright MH andWright PE, Convergence proper-ties of the Nelder–Mead simplex method in low dimensions. SIAMJ Optimiz 9:112–147 (1998).
15 Salkic M, Keran H and Jašic M, Determination of L-ascorbic acid in phar-maceutical preparations usingdirect ultraviolet spectrophotometry.Agric Conspec Sci 74:263–268 (2009).
16 Fernandes FAN, Rodrigues S, Cárcel JA and García-Pérez JV,Ultrasound-assisted air-drying of apple (Malus domestica L.) andits effects on the vitamin of the dried product. Food Bioproc Tech8:1503–1511 (2015).
17 Heredia JB and Cisneros-Zevallos L, The effects of exogenous ethy-lene andmethyl jasmonate on the accumulation of phenolic antiox-idants in selected whole and wounded fresh produce. Food Chem115:1500–1508 (2009).
18 Singleton VL and Rossi JA, Colorimetry of total phenolics withphosphomolybdic-phosphotungstic acid reagents. Am J Enol Vitic16:144–158 (1965).
19 Benzie IF and Strain JJ, The ferric reducing ability of plasma (FRAP)as a measure of ‘antioxidant power’: the FRAP assay. Anal Biochem239:70–76 (1996).
20 Apak R, Güçlü K, Özyürek M and Karademir SE, Novel total antioxidantcapacity index for dietary polyphenols and vitamins C and E, usingtheir cupric ion reducing capability in the presence of neocuproine:CUPRAC method. J Agric Food Chem 52:7970–7981 (2004).
21 Re R, Pellegrini N, Proteggente A, Pannala A, Yang M and Rice-Evans C,Antioxidant activity applyingan improvedABTS radical cationdecol-orization assay. Free Radical Bio Med 26:1231–1237 (1999).
22 Santacatalina JV, Soriano JR, Cárcel JA andGarcia-Perez JV, Influence ofair velocity and temperature on ultrasonically assisted low temper-ature drying of eggplant. Food Bioprod Process 100(Part A):282–291(2016).
23 Darıcı S and Sen S, Experimental investigation of convective dry-ing kinetics of kiwi under different conditions. Heat Mass Transfer51:1167–1176 (2015).
24 García-Pérez JV, Rosselló C, Cárcel J, De la Fuente S and Mulet Aeds, Effect of air temperature on convective drying assisted byhigh power ultrasound, in Defect and Diffusion Forum. Trans TechPublications, Switzerland, (2006).
25 Gamboa-Santos J, Montilla A, Cárcel JA, Villamiel M and Garcia-PerezJV, Air-borne ultrasound application in the convective drying ofstrawberry. J Food Eng 128:132–139 (2014).
26 Do Nascimento EMGC, Mulet A, Ascheri JLR, de Carvalho CWP andCárcel JA, Effects of high-intensity ultrasound on drying kinetics andantioxidant properties of passion fruit peel. J Food Eng 170:108–118(2016).
27 García-Pérez JV, Ortuño C, Puig A, Cárcel JA and Perez-Munuera I,Enhancement of water transport and microstructural changesinduced by high-intensity ultrasound application on orange peeldrying. Food Bioproc Tech 5:2256–2265 (2012).
28 Santacatalina JV, Contreras M, Simal S, Cárcel JA and Garcia-Perez JV,Impact of applied ultrasonic power on the low temperature dryingof apple. Ultrason Sonochem (Suppl. C) 28:100–109 (2016).
29 Rodriguez O, Eim V, Rossello C, Femenia A, Carcel JA and Simal S,Application of power ultrasound on the convective drying of fruitsand vegetables: effects on quality. J Sci Food Agric 98:1660–1673(2018).
30 Sivakumaran S, Huffman L, Sivakumaran S and Drummond L, Thenutritional composition of Zespri® SunGold kiwifruit and Zespri®sweet green kiwifruit. Food Chem (Suppl. C) 238:195–202 (2018).
31 Pal RS, Kumar VA, Arora S, Sharma A, Kumar V and Agrawal S, Physico-chemical and antioxidant properties of kiwifruit as a function of cul-tivar and fruit harvested month. Braz Arch Biol Technol 58:262–271(2015).
32 Ball GF, Vitamins in Foods: Analysis, Bioavailability, and Stability. CRCPress, Taylor & Francis Group, Boca Raton, FL, USA, (2005).
33 Kaya A, Aydın O and Kolaylı S, Effect of different drying conditions onthe vitamin C (ascorbic acid) content of Hayward kiwifruits (Actinidiadeliciosa Planch). Food Bioprod Process 88:165–173 (2010).
34 Izli N, Izli G and Taskin O, Drying kinetics, colour, total phenolic con-tent and antioxidant capacity properties of kiwi dried by differentmethods. J FoodMeas Charact 11:64–74 (2017).
35 Fernandes FAN, Rodrigues S, García-Pérez JV and Cárcel JA, Effects ofultrasound-assistedair-dryingonvitamins andcarotenoidsof cherrytomatoes. Drying Technol 34:986–996 (2016).
36 Cruz L, Clemente G, Mulet A, Ahmad-Qasem MH, Barrajón-Catalán Eand García-Pérez JV, Air-borne ultrasonic application in the dry-ing of grape skin: kinetic and quality considerations. J Food Eng168:251–258 (2016).
37 Moreno C, Brines C, Mulet A, Rosselló C and Cárcel JA, Antioxidantpotential of atmospheric freeze-dried apples as affected by ultra-sound application and sample surface. Drying Technol 35:957–968(2017).
38 Szadzinska J, Łechtanska J, Kowalski SJ and Stasiak M, The effect ofhigh power airborne ultrasound andmicrowaves on convective dry-ing effectiveness and quality of green pepper. Ultrason Sonochem(Suppl. C) 34:531–539 (2017).
39 González-Centeno MR, Jourdes M, Femenia A, Simal S, Rosselló Cand Teissedre P-L, Proanthocyanidin composition and antioxidantpotential of the stem winemaking byproducts from 10 differentgrape varieties (Vitis vinifera L.). J Agric Food Chem 60:11850–11858(2012).
40 Leontowicz H, Leontowicz M, Latocha P, Jesion I, Park Y-S, Katrich Eet al., Bioactivity and nutritional properties of hardy kiwi fruitActinidia arguta in comparison with Actinidia deliciosa ‘Hayward’and Actinidia eriantha ‘Bidan’. Food Chem 196:281–291 (Suppl. C)(2016).
J Sci Food Agric (2019) © 2018 Society of Chemical Industry wileyonlinelibrary.com/jsfa 133

134

ORIGINAL PAPER
Intensification of Low-Temperature Drying of MushroombyMeans of Power Ultrasound: Effects on Drying Kinetics and QualityParameters
Francisca Vallespir1 & Laura Crescenzo2& Óscar Rodríguez1 & Francesco Marra2 & Susana Simal1
Received: 30 November 2018 /Accepted: 5 March 2019 /Published online: 15 March 2019# Springer Science+Business Media, LLC, part of Springer Nature 2019
AbstractThe aim of this study was to assess the effects of ultrasonic assistance on low-temperature drying of mushroom. For this purpose,mushroom caps slices drying kinetics at 5, 10, and 15 °Cwithout and with ultrasound application (at 20.5 kW/m3) were analyzed,together with the dried product microstructure and some quality parameters (ergosterol and total polyphenol contents, antioxidantactivity, color, hydration properties, and fat adsorption capacity). Ultrasound application promoted drying time reductions of 41%at 5 °C, 57% at 10 °C, and 66% at 15 °C, compared with drying without ultrasound. After drying at each temperature, mushroommicrostructure presented remarkable tissue shrinkage. Moreover, when ultrasound was also applied, micro-channels were ob-served. When drying was carried out with ultrasound application, no significant (p ≥ 0.05) differences or significantly higher(p < 0.05) figures of quality parameters were observed, compared with drying without ultrasound application. Thus, mushroomdrying process intensification was achieved by using ultrasound, particularly when drying at 15 °C since drying kinetics wasenhanced and significantly (p < 0.05) smaller changes in all quality parameters were observed, compared with drying withoutultrasound.
Keywords Mushroom . Low-temperature drying . Ultrasound .Microstructure . Quality
Introduction
The white button mushroom (Agaricus bisporus) contributesabout 40% of the total world production ofmushroom. It is themost widely cultivated and consumed mushroom throughoutthe world (Salehi et al. 2017). For centuries, mushrooms havebeen widely used as a human food, highly appreciated fortheir healthy properties. They have proven to be effective asantibacterial, antioxidant, anti-inflammatory, antitumor, andantiviral agents (Wu et al. 2016).
Among the biological active substances present in mush-rooms, phenolics have attracted much attention due to theirhigh antioxidant activity (Palacios et al. 2011). Moreover, theedible fungi mushrooms are the most important sources for
vitamin D2 and its precursor, ergosterol, which exists only inthe Fungi kingdom (Guan et al. 2016). An important role inregulation of calcium and phosphorus and mineralization ofbones in the human body is played by vitamin D (Guan et al.2016).
In Asia, functional products based on compounds derivedfrom mushrooms or extracts are very common due to theirexcellent bioactivity (Reis et al. 2017). The study of the prop-erties of mushroom by-products may give information abouthow they could be incorporated in functional foods. In fact,according to Ekunseitan et al. (2017), the protein present inmushrooms is in forms that are easily digestible and of betterquality than those of many legumes sources such as soybeansand peanut. Thus, according to these authors, when mush-room flour proportion was increased in composite flour ofwheat and high quality cassava flours, water retention capac-ity, and fat adsorption capacity significantly increased(Ekunseitan et al. 2017).
Since they have no cuticle to protect them from water lossand physical or microbial attacks, the shelf life of buttonmushroom is limited to a few days (Zhang et al. 2016).Therefore, they should be consumed or processed rapidly after
* Susana [email protected]
1 Department of Chemistry, University of the Balearic Islands, CtraValldemossa km 7.5, 07122 Palma de Mallorca, Spain
2 Dipartimento di Ingegneria Industriale, Università degli Studi diSalerno, Via Giovanni Paolo II 132, 84084 Salerno, Italy
Food and Bioprocess Technology (2019) 12:839–851https://doi.org/10.1007/s11947-019-02263-5
135
harvesting being the drying process one of the oldest methodsof mushroom preservation. However, remarkable losses ofmushroom quality characteristics could be promoted by dry-ing. According to Çakmak et al. (2016) and Nölle et al.(2017), mushroom bioactive compound contents such as totalpolyphenol and ergosterol contents were significantly affected(34 and 36% of loss, respectively) after convective dryingprocess at 50 °C (1.5 m/s) and 40 °C (0.6 m/s), respectively.In addition, browning of mushrooms can be indirectly relatedto quality deterioration due to enzymatic and/or non-enzymatic activity during processing and especially drying,being color a primary quality criterion to consumers, whoprefer mushrooms close to their natural appearance (Nölleet al. 2017). Changes in mushroom appearance might alsobe related to microstructure changes during drying such astissue shrinkage and collapse (Giri and Prasad 2007).
Low-temperature drying could better preserve the mush-rooms quality attributes as they are very sensitive to tempera-ture (Salehi et al. 2017). However, low-temperature drying is along time and high energy consuming process. Ultrasoundapplication has been reported to enhance low-temperaturedrying of different fruits and vegetables due to its mechanicalenergy and mild thermal effect (Santacatalina et al. 2016a).Alternating expansions and contractions when travelingacross a medium are generated by the ultrasonic waves, whichhave a similar effect to that found in a sponge when it isrepeatedly squeezed and released (Santacatalina et al. 2016b).
Thus, drying time reductions between 16% in cod slicesdrying (at 0 °C and 2 m/s) (Santacatalina et al. 2016b) and75% in apple cubes drying (at 10 °C and 2 m/s) (Santacatalinaet al. 2016a) were observed when ultrasound was applied (atpower densities of 20.5 kW/m3 and 30.8 kW/m3, respectively,and 22 kHz of frequency). Drying kinetics enhancement couldbe properly evaluated by using a diffusion model consideringboth external and internal resistances as it has been demon-strated in previous low-temperature drying studies (García-Pérez et al. 2012a; Santacatalina et al. 2016c). However, dueto the Bsponge effect^ of ultrasound, greater degradation inapple and cod microstructure was observed when drying wascarried out with ultrasound application (Ozuna et al. 2014;Santacatalina et al. 2016a).
According to Reay et al. (2013), process intensificationleads to substantially more energy-efficient process technolo-gy, but in the case of food industry it might also concernquality preservation. Equal or higher losses of bioactive com-pounds (total polyphenol content and total flavonoid content)and antioxidant activity were reported after ultrasonicallyassisted (at a power density of 20.5 kW/m3 and frequency of22 kHz) drying of apple cubes (8.8 mm side) at low-temperature drying (at temperatures of 0, 5, and 10 °C andair velocity of 1 m/s), in comparison with changes after dryingwithout ultrasound application (Santacatalina et al. 2014,2016a). Meanwhile, color coordinates (CIELab scale) of cod
slices dried (at temperatures of 0, 10, and 20 °C and air veloc-ity of 2 m/s) with ultrasound application (at a power density of20.5 kW/m3 and frequency of 22 kHz) presented negligibledifferences to salted cod dried without ultrasound application(Ozuna et al. 2014; Santacatalina et al. 2016b). Unfortunately,in the literature, there is scarcely any study about mushroomlow-temperature drying intensification by using ultrasoundapplication.
Therefore, the main aim of this study was to evaluate theeffects of ultrasound application on the low-temperature dry-ing kinetics and quality parameters of mushroom. Therefore,drying kinetics and changes promoted in microstructure, er-gosterol and total polyphenol contents, antioxidant activity,color, hydration properties, and fat adsorption capacity afterdrying without and with ultrasound were evaluated.
Materials and Methods
Sample Processing
Preparation
White buttonmushrooms (Agaricus bisporus) were purchasedin a local market in Palma de Mallorca (Spain). Mushroomswith uniform color and size (5 cm of diameter approx.) wereselected. The stems were removed and only the caps wereused for the experiments. They were washed with tap waterand sliced to a thickness of 0.005 m with a sharp knife cuttingthem vertically and immediately processed to avoid degrada-tion. Blanching pre-treatment with steam of boiling water (at100 ± 5 °C) during 15 s was applied in order to reduce brow-ning process. After blanching, the excess of water on the sur-face of the slices was drained with tissue paper. Then, by usingthe AOAC method No. 934.06 (AOAC 2006), the initial av-erage moisture content (W0, kg/kg d.m.) was obtained.Finally, the slices were placed on a stainless-steel load tree,which was hanged into the dryer.
Drying Experiments
Drying experiments were carried out in a convective dryerwith air recirculation, air velocity and temperature control,and an ultrasonically activated drying chamber, which wasalready described by Vallespir et al. (2018). A scheme of theconvective drier was also reported by Vallespir et al. (2018).The drying experiments were carried out at the temperaturesof 5, 10, and 15 °C in an industrial upright fridge ACRV-125-2(Coreco, Spain). The air velocity was of 1 m/s and the airrelative humidity was of 28 ± 7%. An electrical power of50 W (20.5 kW/m3) and 22 kHz was applied in the dryingexperiments with ultrasound application (AIR+US) and noelectrical power was applied in the drying experiments
840 Food Bioprocess Technol (2019) 12:839–851
136
without ultrasound application (AIR). Drying experimentswere carried out until an 85% of weight loss with respect toinitial weight was achieved. Sample was periodically weighedat selected times. At least, triplicates of each experiment weredone.
Shrinkage Correlations
The contraction of the slab shape was considered as both thecontraction of the thickness and the contraction of the facearea. The thickness and face area shrinkage correlations wereexperimentally estimated. Slab-shaped mushroom samples(4.9 ± 0.2 × 10⁻³ m thickness and 1.44 ± 0.05 × 10⁻⁴ m2 offace area) were used to determine the change of the samplethickness and area during drying. The samples were driedduring the different times: 100, 200, 360, 450, and 600 minat 15 °C and 1 m/s. The shrinkage was measured in fivesamples at each different drying time. The changes in thick-ness (Th) were calculated using the dimensions determined bya caliper. The changes in the face area (A) were measured byusing an image acquisition systemwhich consisted of a digitalcamera vertically placed above the sample at a distance of0.1 m from its upper face. The illumination was achieved withfour fluorescent light tubes (power, 35 W; length, 0.30 m;color temperature, 2700 K; light flux, 270 lm). Both the cam-era and the illumination system were placed in a wooden boxwhose walls were painted in black to minimize the back-ground light. Four images were acquired for each sample(two of each side) at each time, thus 20 photos of each timewere processed. Image managing involved the adjustment ofthe pictures with Microsoft Office Picture Manager® software(Microsoft, Seattle, USA) (color and shades correction tools)and the area measurement with an algorithm developed byusing the Image Acquisition Toolbox of Matlab® software(The Mathworks, Inc., Natick, USA). The area measurementswere correlated to the surface of 1 and 2 euros coins, sincethese objects have official surface values given by BFábricaNacional de Moneda y Timbre-Real Casa de la Moneda^(Spanish Government 2018). Also, the moisture content ofthe samples at each time was obtained by means of theAOAC method No. 934.06 (AOAC 2006).
Modeling
In order to obtain a mathematical model representative ofthe moisture transport during the drying process, the pro-cess was considered to be isothermal and the microscopicmass transfer balance was combined with Fick’s secondlaw. Considering moisture diffusion to be the main trans-port phenomenon, the governing equation for transientmass transfer by effective diffusion in the considered slabgeometry was formulated as (Eq. 1).
De∂2W∂x2
¼ ∂W∂t
ð1Þ
The constant and effective diffusion coefficient (De), rep-resentative of the global transport process, might include mo-lecular diffusion, liquid diffusion through the solid pores, va-por diffusion, and all other factors which affect drying char-acteristics (Rodríguez et al. 2013). As an initial condition, themoisture distribution inside the solid was considered to beuniform at the beginning of the process (Eq. 2). Moisturedistribution symmetry (Eq. 3) and the external mass transferat the solid surface (Eq. 4) were considered as boundary con-ditions.
W xð Þ��t¼0
¼ W0 ð2Þ
∂W∂x
����x¼0;t>0
¼ 0 ð3Þ
−Deρdm∂W∂x
����x¼L;t>0
¼ hm φe−φ∞ð Þ ð4Þ
The sorption isotherm reported by Iglesias and Chirife(1982), the shrinkage correlations and the psychrometric datawere considered to complete the model.
COMSOL Multiphysics® 5.1 software (COMSOL Inc.,Sweden) was used to solve the mathematical model, applyingthe finite elements method. After the mesh independence test,a domain composed of about 54 elements, resulting in about110 degrees of freedom was used. Matlab 2014a® software(The Mathworks, Inc., Natick, USA) was used to develop thealgorithm, by using the Bfminseach^Matlab function, to iden-tify both the effective diffusion (De, m
2/s) and the externalmass transfer (hm, kg water/m2 s) coefficients from each dry-ing curve through the minimization of the objective function:mean relative error between calculated and experimental av-erage moisture content, given by the Eq. 5.
MRE %ð Þ ¼ 100
n∑n
i¼1
Wexpi−Wcali
Wexpi
�������� ð5Þ
Microstructure Observation
According to the methodology described by Eim et al. (2013)with minor modifications, dried mushroom slices at 5, 10, and15 °C without (AIR) and with ultrasound application (AIR+US) were prepared for the light microscopy observation.Formaldehyde (10%) was used to fix the samples followedby dehydration, embedded in paraffin (60 °C for 3 h) andsectioned by a microtome Finesse 325 (Thermo Shandon,UK) into 4–5-μm sections. The sections were stained withHematoxilin Eosin (H-E) and Periodic Acid–Schiff (PAS) to
Food Bioprocess Technol (2019) 12:839–851 841
137
visualize cell walls (Paciulli et al. 2015). In order to obtain themicrostructural images, an optical microscope BX41(Olympus, Japan) and a camera DP71 (Olympus, Japan) at100 magnifications were used. Six sections of each samplewere prepared and 12 micrographs of each sample were ob-tained, at least.
Bioactive Compounds and Antioxidant ActivityAnalyses
The samples dried at 5, 10, and 15 °C without (AIR) and with(AIR+US) ultrasound application were analyzed to determinetheir ergosterol (EC) and total polyphenol (TPC) contents andantioxidant activity (AA).
Ergosterol Content
A simple direct extraction of ergosterol using hexanewas usedaccording to the methodology proposed by Shao et al. (2010)with minor modifications. An internal standard (cholecalcif-erol 1 mg/mL) was used during the extraction of the samplepowder. To prepare the mushroom powders, dried sampleswere pulverized in an A10 grinder (Janke and Kunkel IKALabortechnik, Germany) and sieved in an FTL-0200 sieve(Filtra, Spain) in order to obtain a particle size powder of90–180 μm. The mushroom powder of 0.05 g was vortexedwith 6 mL of hexane and 0.5 mL of internal standard for 1 minand centrifuged at 4000 rpm for 10 min. The supernatant(hexane phase) was decanted and transferred into a vial.Two more extractions were carried out to the mushroom res-idue also with 6 mL of hexane. All the hexane extract wasdried by using a steam of argon and dissolved in 2 mL ofethanol. Finally, it was filtered through a 0.22-μm PVDF filterbefore HPLC analysis.
An HPLC system 600 (Waters, USA) equipped with aninline degasser, a quaternary pump Delta 600E (Waters,USA), a thermostatic autosampler 717 plus (Waters,USA), and a photodiode array detector (PDA detector)2996 (Waters, USA) was used. A Nova-Pak 4 μm C18column (3.9 × 150 mm) (Waters, USA) was used for theseparation. The mobile phase consisted of solvent metha-nol/water, 80:20 v/v. The injection volume was of 2 μLfor the standard and samples and the flowrate was of1.0 mL/min. Absorbance at 280 nm was used to monitorand quantify ergosterol. A combination of the retentiontime in HPLC chromatograms and UV spectra was usedto tentatively identify ergosterol in mushroom samples.Absorbance measurements were correlated with standardcurves of commercial ergosterol (0.05–0.7 mg/mL) to-gether with the internal standard. The results wereexpressed as mg of ergosterol/g d.m.
Total Polyphenol Content and Antioxidant Activity
According to the methodology described by Heredia andCisneros-Zevallos (2009) with some modifications, methanolextracts from the mushroom slices were prepared. Twentymilliliters of methanol extraction solvent was added to sam-ples accurately weighed (ca. 0.1 g of dried samples). By usingUltra-Turrax© T25 Digital (IKA, Germany) at 13,000 rpm for1 min at 4 °C the mixture was homogenized and then theobtained solution was refrigerated overnight. Mixtures werecentrifuged at 4000 rpm for 10 min before filtration. The ex-tracts were refrigerated at 4 °C until analysis. At least, fourmethanol extracts were prepared for each sample.
According to Eim et al. (2013) by means of the Folin-Ciocalteu assay, total polyphenol content (TPC) was deter-mined. By using FRAP, CUPRAC, and ABTS methods ac-cording to González-Centeno et al. (2012) the antioxidantactivity (AA) was determined. An UV/Vis/NIR spectropho-tometer Multiskan Spectrum (Thermo Scientific, Finland) at25 °C and at 745, 593, 450, and 734 nm was used to carry outthe absorbance measurements in TPC, FRAP, CUPRAC, andABTS methods, respectively. Absorbance values were corre-lated with standard curves (0–250 mg/L gallic acid for TPCand 0–400mg/L trolox for AA). The results were expressed asmilligram of gallic acid equivalent (GAE)/g d.m. for the TPC,while the AAwas expressed as milligram of trolox equivalent(TE)/g d.m.
Color Determinations
Color of mushroom samples dried at 5, 10, and 15° withoutand with ultrasound application was measured using thesieved powder at a particle size of 90–180 μm. The CIElabcolor space was used to estimate the color values of mush-room samples. The coordinates were L* (whiteness or bright-ness/darkness) a* (redness/greenness), and b* (yellowness/blueness). A CM-5 colorimeter (Konica Minolta, Japan) witha D65 illuminant and 2° observer (Urun et al. 2015) was usedto carry out themeasurements. The browning index (BI) of thedried samples was determined according to the equations pro-posed by Farokhian et al. (2017) (Eq. 6).
BI ¼ 100 x−0:31ð Þ½ �0:17
;where x
¼ a* þ 1:75L*� �
5:645L* þ a*−3:012b*� � ð6Þ
Hydration Properties and Fat Adsorption Capacity
Properties measured in this study included hydration proper-ties, such as swelling (SW) and water retention capacity
842 Food Bioprocess Technol (2019) 12:839–851
138

(WRC), and fat adsorption capacity (FAC). These propertieswere determined according to the methodology described byFemenia et al. (2009) with minor modifications. All the prop-erties were measured using dried samples powders (90–180 μm), which preparation was specified above.
Swelling (SW) was determined hydrating approximately60 mg of sample powder with excess of water (10 mL) during24 h and measuring the final volume of sample. SW resultswere expressed as mL/g d.m. Water retention capacity (WRC)was determined hydrating ca. 10 mg of sample powder withwater in excess (5 mL) in a 10-mL tube during 24 h. Thesample was then centrifuged at 2000 rpm for 20 min, thesupernatant was decanted and the sample weight was taken.WRC was expressed as g/g d.m. Finally, fat adsorption capac-ity (FAC) was determined as the oil adsorption capacity.Samples (ca. 10 mg of powder) were mixed with sunfloweroil (5mL), rested 24 h, centrifuged at 2000 rpm for 20min, thesupernatant was decanted and the sample weight was taken.FAC was expressed as g/g d.m.
Statistical Analyses
Data were averaged from corresponding replicates and report-ed as average values ± standard deviations. Analysis of vari-ance (ANOVA) was applied to analyze the effects of both thedrying temperature and the ultrasound application during dry-ing on the identified coefficients of the diffusion model, er-gosterol and total polyphenol contents, antioxidant activity,color, hydration properties, and fat adsorption capacity.Means were compared by Tukey’s test at α = 0.05. Statisticalanalyses were carried out using R: Language andEnvironment for Statistical Computing (R Core Team,Austria).
Additionally, besides MRE, the percentage of explainedvariance (Eq. 7) was used to further evaluate the accuracy ofthe obtained simulation of the drying curves.
var %ð Þ ¼ 1−SxySy
� �� 100 ð7Þ
Results and Discussion
Drying Kinetics
Initial moisture content of fresh mushroom after blanchingwas of 11.8 ± 0.8 kg/kg d.m., which was similar to the report-ed by Zhang et al. (2016) in fresh mushroom (11.5 ± 0.1 kg/kgd.m.). Final moisture content was of 0.95 ± 0.04 kg/kg d.m.after 85% of weight loss. The experimental drying kinetics ofmushroom slices at 5, 10, and 15 °C and 1 m/s, without (AIR)and with ultrasound application (AIR+US) (20.5 kW/m3), are
shown in Fig. 1. No significant differences (p ≥ 0.05) wereobserved between drying kinetics at 5 and 10 °C when ultra-sound was not applied (5 °C AIR and 10 °C AIR experi-ments). However, the drying kinetics at 15 °C was significant-ly shorter (p < 0.05) than those at 5 and 10 °C, without usingultrasound. When ultrasound was applied (AIR+US), signifi-cantly shorter (p < 0.05) drying kinetics than the correspond-ing kinetics without ultrasound application (AIR) were ob-served at every temperature used. Thus, drying time neededat 5 °C of air temperature without ultrasound application(AIR) to reach a moisture content of ca. 1 kg/kg d.m. (0.99± 0.07 kg/kg d.m.) was of 21 h and, when ultrasound wasapplied (AIR+US), the drying time was shortened by 41%.In the case of drying at a temperature of 10 °C without ultra-sound application (AIR), drying time was of 20 h and it wasshortened by 57% with ultrasound application (AIR+US).Finally, 18 h were needed when drying was carried out at15 °C without ultrasound application (AIR) and when ultra-sound was applied (AIR+US), drying time was shortened a66%, thus only 6 h were needed.
No bibliography of mushroom drying intensification byultrasound application during drying was found. In otherproducts, similar drying time reductions were observed bySantacatalina et al. (2014) (60%), Ozuna et al. (2014) (36–55%) and Santacatalina et al. (2016c) (44%) in low-temperature drying of apple cubes (at 0, 5, and 10 °C and2 m/s), cod parallelepipeds (at 0, 10, and 20 °C and 2 m/s),and eggplant cubes (at 10 °C and 4 m/s), respectively, whenultrasound was applied (20.5 kW/m3).
As the temperature rises, higher drying time reductionswere observed when ultrasound was applied (AIR+US exper-iments) compared with AIR experiments. Similar behaviorwas observed by Ozuna et al. (2014) and by Santacatalinaet al. (2016b) in cod low-temperature drying at 0–10 °C and0–20 °C, respectively. Thus, these authors observed higherdrying time reductions when applying ultrasound at highertemperatures. Moreover, Gamboa-Santos et al. (2014) report-ed also higher drying time reductions in strawberry hot airdrying when the temperature rose from 40 to 50 and to60 °C, although at 70 °C the drying time reduction was lowerthan at 50 °C. Santacatalina et al. (2014) and Santacatalinaet al. (2016c) reported higher drying time reductions whentemperature rose from 0 to 10 °C in low-temperature dryingassisted by ultrasound of apple and eggplant, respectively.Therefore, it seems that the range of temperatures tested andthe structure of the product may affect the ultrasound effectswhen temperatures rise.
Shrinkage Correlations
Shrinkage of the sample was monitored during drying ofmushroom samples at 15 °C without ultrasound application.Shrinkage was assumed to be constant in the range of
Food Bioprocess Technol (2019) 12:839–851 843
139
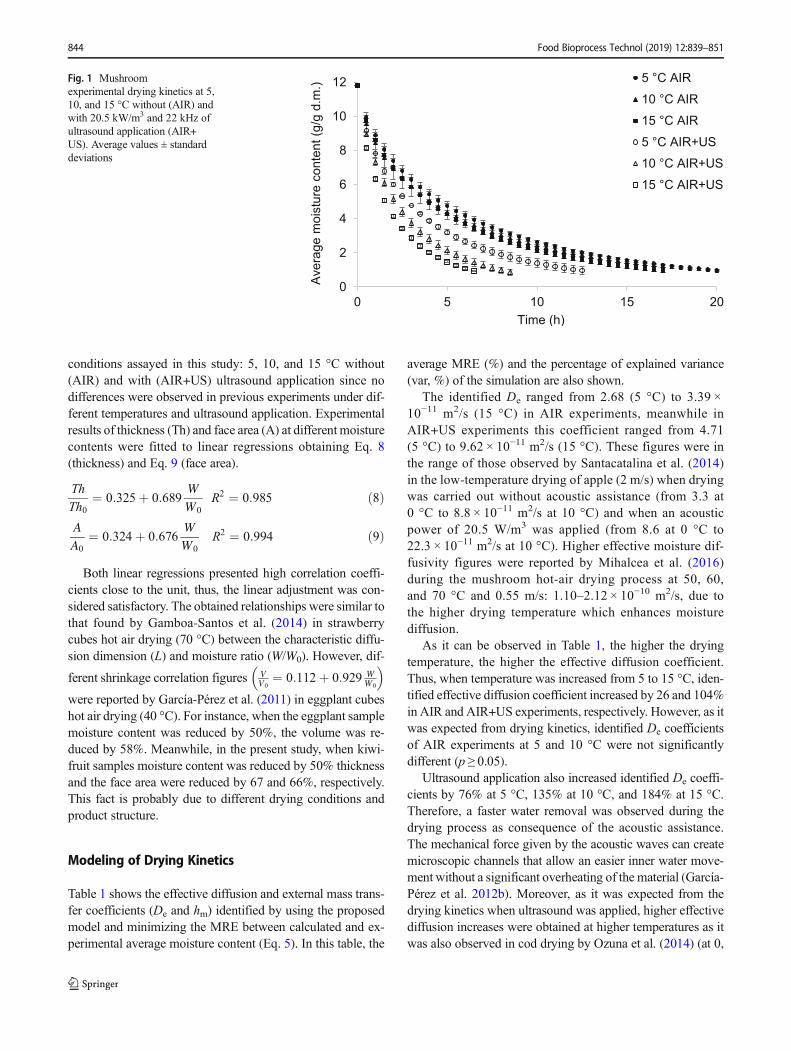
conditions assayed in this study: 5, 10, and 15 °C without(AIR) and with (AIR+US) ultrasound application since nodifferences were observed in previous experiments under dif-ferent temperatures and ultrasound application. Experimentalresults of thickness (Th) and face area (A) at different moisturecontents were fitted to linear regressions obtaining Eq. 8(thickness) and Eq. 9 (face area).
ThTh0
¼ 0:325þ 0:689WW0
R2 ¼ 0:985 ð8Þ
AA0
¼ 0:324þ 0:676WW0
R2 ¼ 0:994 ð9Þ
Both linear regressions presented high correlation coeffi-cients close to the unit, thus, the linear adjustment was con-sidered satisfactory. The obtained relationships were similar tothat found by Gamboa-Santos et al. (2014) in strawberrycubes hot air drying (70 °C) between the characteristic diffu-sion dimension (L) and moisture ratio (W/W0). However, dif-
ferent shrinkage correlation figures VV0
¼ 0:112þ 0:929 WW0
� �were reported by García-Pérez et al. (2011) in eggplant cubeshot air drying (40 °C). For instance, when the eggplant samplemoisture content was reduced by 50%, the volume was re-duced by 58%. Meanwhile, in the present study, when kiwi-fruit samples moisture content was reduced by 50% thicknessand the face area were reduced by 67 and 66%, respectively.This fact is probably due to different drying conditions andproduct structure.
Modeling of Drying Kinetics
Table 1 shows the effective diffusion and external mass trans-fer coefficients (De and hm) identified by using the proposedmodel and minimizing the MRE between calculated and ex-perimental average moisture content (Eq. 5). In this table, the
average MRE (%) and the percentage of explained variance(var, %) of the simulation are also shown.
The identified De ranged from 2.68 (5 °C) to 3.39 ×10⁻¹¹ m2/s (15 °C) in AIR experiments, meanwhile inAIR+US experiments this coefficient ranged from 4.71(5 °C) to 9.62 × 10⁻¹¹ m2/s (15 °C). These figures were inthe range of those observed by Santacatalina et al. (2014)in the low-temperature drying of apple (2 m/s) when dryingwas carried out without acoustic assistance (from 3.3 at0 °C to 8.8 × 10⁻¹¹ m2/s at 10 °C) and when an acousticpower of 20.5 W/m3 was applied (from 8.6 at 0 °C to22.3 × 10−11 m2/s at 10 °C). Higher effective moisture dif-fusivity figures were reported by Mihalcea et al. (2016)during the mushroom hot-air drying process at 50, 60,and 70 °C and 0.55 m/s: 1.10–2.12 × 10⁻¹⁰ m2/s, due tothe higher drying temperature which enhances moisturediffusion.
As it can be observed in Table 1, the higher the dryingtemperature, the higher the effective diffusion coefficient.Thus, when temperature was increased from 5 to 15 °C, iden-tified effective diffusion coefficient increased by 26 and 104%in AIR and AIR+US experiments, respectively. However, as itwas expected from drying kinetics, identified De coefficientsof AIR experiments at 5 and 10 °C were not significantlydifferent (p ≥ 0.05).
Ultrasound application also increased identified De coeffi-cients by 76% at 5 °C, 135% at 10 °C, and 184% at 15 °C.Therefore, a faster water removal was observed during thedrying process as consequence of the acoustic assistance.The mechanical force given by the acoustic waves can createmicroscopic channels that allow an easier inner water move-ment without a significant overheating of the material (García-Pérez et al. 2012b). Moreover, as it was expected from thedrying kinetics when ultrasound was applied, higher effectivediffusion increases were obtained at higher temperatures as itwas also observed in cod drying by Ozuna et al. (2014) (at 0,
0
2
4
6
8
10
12
0 5 10 15 20
).m.
dg/
g(
tn
etn
oc
er
utsi
om
eg
ar
ev
ATime (h)
5 °C AIR
10 °C AIR
15 °C AIR
5 °C AIR+US
10 °C AIR+US
15 °C AIR+US
Fig. 1 Mushroomexperimental drying kinetics at 5,10, and 15 °C without (AIR) andwith 20.5 kW/m3 and 22 kHz ofultrasound application (AIR+US). Average values ± standarddeviations
844 Food Bioprocess Technol (2019) 12:839–851
140
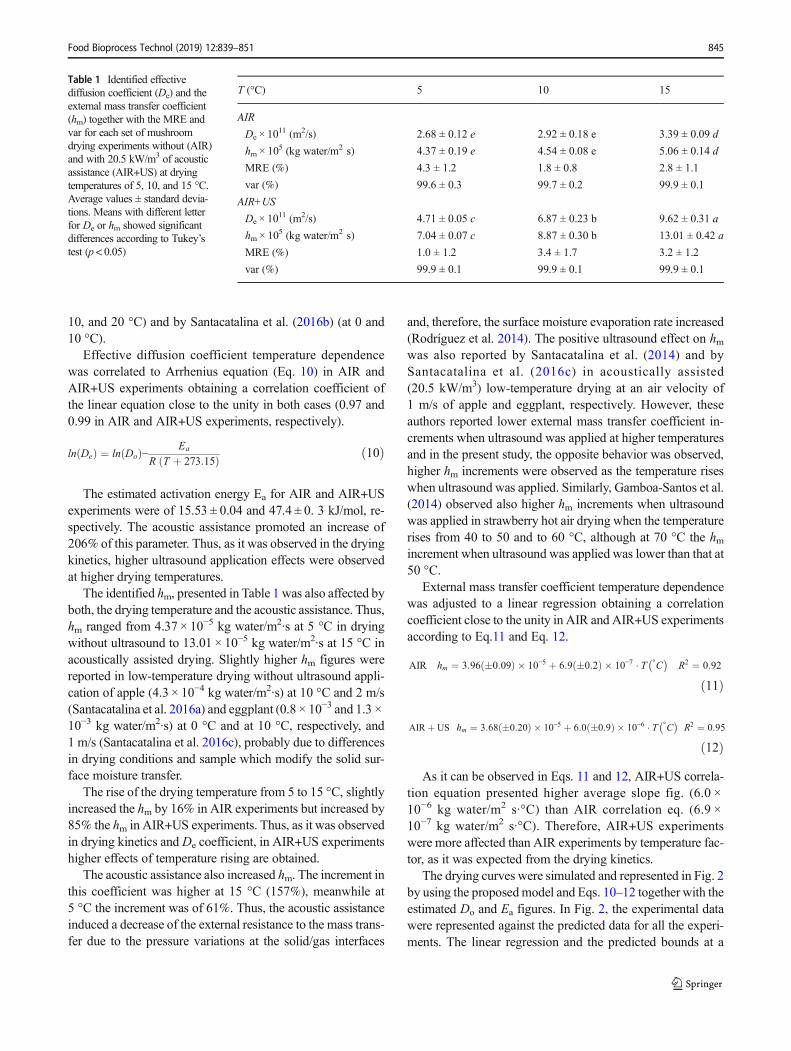
10, and 20 °C) and by Santacatalina et al. (2016b) (at 0 and10 °C).
Effective diffusion coefficient temperature dependencewas correlated to Arrhenius equation (Eq. 10) in AIR andAIR+US experiments obtaining a correlation coefficient ofthe linear equation close to the unity in both cases (0.97 and0.99 in AIR and AIR+US experiments, respectively).
ln Deð Þ ¼ ln Doð Þ− Ea
R T þ 273:15ð Þ ð10Þ
The estimated activation energy Ea for AIR and AIR+USexperiments were of 15.53 ± 0.04 and 47.4 ± 0. 3 kJ/mol, re-spectively. The acoustic assistance promoted an increase of206% of this parameter. Thus, as it was observed in the dryingkinetics, higher ultrasound application effects were observedat higher drying temperatures.
The identified hm, presented in Table 1 was also affected byboth, the drying temperature and the acoustic assistance. Thus,hm ranged from 4.37 × 10⁻⁵ kg water/m2·s at 5 °C in dryingwithout ultrasound to 13.01 × 10⁻⁵ kg water/m2·s at 15 °C inacoustically assisted drying. Slightly higher hm figures werereported in low-temperature drying without ultrasound appli-cation of apple (4.3 × 10⁻⁴ kg water/m2·s) at 10 °C and 2 m/s(Santacatalina et al. 2016a) and eggplant (0.8 × 10⁻³ and 1.3 ×10⁻³ kg water/m2·s) at 0 °C and at 10 °C, respectively, and1 m/s (Santacatalina et al. 2016c), probably due to differencesin drying conditions and sample which modify the solid sur-face moisture transfer.
The rise of the drying temperature from 5 to 15 °C, slightlyincreased the hm by 16% in AIR experiments but increased by85% the hm in AIR+US experiments. Thus, as it was observedin drying kinetics and De coefficient, in AIR+US experimentshigher effects of temperature rising are obtained.
The acoustic assistance also increased hm. The increment inthis coefficient was higher at 15 °C (157%), meanwhile at5 °C the increment was of 61%. Thus, the acoustic assistanceinduced a decrease of the external resistance to the mass trans-fer due to the pressure variations at the solid/gas interfaces
and, therefore, the surface moisture evaporation rate increased(Rodríguez et al. 2014). The positive ultrasound effect on hmwas also reported by Santacatalina et al. (2014) and bySantacatalina et al. (2016c) in acoustically assisted(20.5 kW/m3) low-temperature drying at an air velocity of1 m/s of apple and eggplant, respectively. However, theseauthors reported lower external mass transfer coefficient in-crements when ultrasound was applied at higher temperaturesand in the present study, the opposite behavior was observed,higher hm increments were observed as the temperature riseswhen ultrasound was applied. Similarly, Gamboa-Santos et al.(2014) observed also higher hm increments when ultrasoundwas applied in strawberry hot air drying when the temperaturerises from 40 to 50 and to 60 °C, although at 70 °C the hmincrement when ultrasound was applied was lower than that at50 °C.
External mass transfer coefficient temperature dependencewas adjusted to a linear regression obtaining a correlationcoefficient close to the unity in AIR and AIR+US experimentsaccording to Eq.11 and Eq. 12.
AIR hm ¼ 3:96 �0:09ð Þ � 10−5 þ 6:9 �0:2ð Þ � 10−7 � T °C� �
R2 ¼ 0:92
ð11Þ
AIRþ US hm ¼ 3:68 �0:20ð Þ � 10−5 þ 6:0 �0:9ð Þ � 10−6 � T °C� �
R2 ¼ 0:95
ð12Þ
As it can be observed in Eqs. 11 and 12, AIR+US correla-tion equation presented higher average slope fig. (6.0 ×10⁻⁶ kg water/m2 s·°C) than AIR correlation eq. (6.9 ×10⁻⁷ kg water/m2 s·°C). Therefore, AIR+US experimentswere more affected than AIR experiments by temperature fac-tor, as it was expected from the drying kinetics.
The drying curves were simulated and represented in Fig. 2by using the proposedmodel and Eqs. 10–12 together with theestimated Do and Ea figures. In Fig. 2, the experimental datawere represented against the predicted data for all the experi-ments. The linear regression and the predicted bounds at a
Table 1 Identified effectivediffusion coefficient (De) and theexternal mass transfer coefficient(hm) together with the MRE andvar for each set of mushroomdrying experiments without (AIR)and with 20.5 kW/m3 of acousticassistance (AIR+US) at dryingtemperatures of 5, 10, and 15 °C.Average values ± standard devia-tions. Means with different letterfor De or hm showed significantdifferences according to Tukey’stest (p < 0.05)
T (°C) 5 10 15
AIR
De × 1011 (m2/s) 2.68 ± 0.12 e 2.92 ± 0.18 e 3.39 ± 0.09 d
hm × 105 (kg water/m2 s) 4.37 ± 0.19 e 4.54 ± 0.08 e 5.06 ± 0.14 d
MRE (%) 4.3 ± 1.2 1.8 ± 0.8 2.8 ± 1.1
var (%) 99.6 ± 0.3 99.7 ± 0.2 99.9 ± 0.1
AIR+US
De × 1011 (m2/s) 4.71 ± 0.05 c 6.87 ± 0.23 b 9.62 ± 0.31 a
hm × 105 (kg water/m2 s) 7.04 ± 0.07 c 8.87 ± 0.30 b 13.01 ± 0.42 a
MRE (%) 1.0 ± 1.2 3.4 ± 1.7 3.2 ± 1.2
var (%) 99.9 ± 0.1 99.9 ± 0.1 99.9 ± 0.1
Food Bioprocess Technol (2019) 12:839–851 845
141
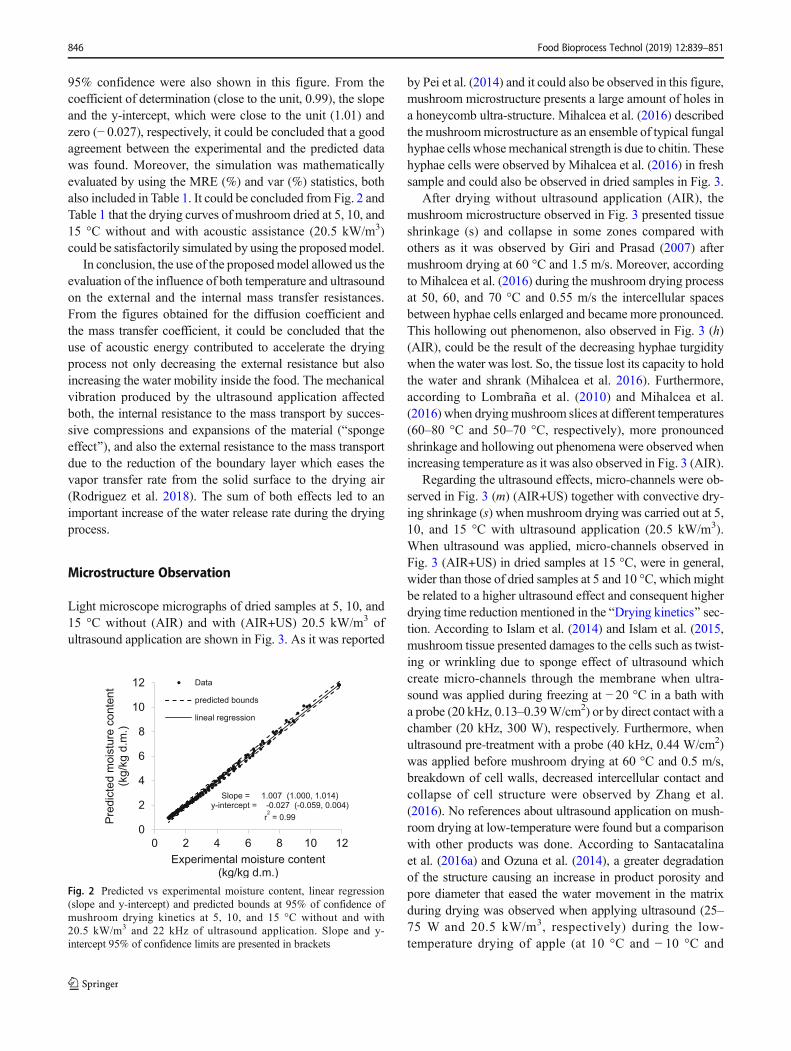
95% confidence were also shown in this figure. From thecoefficient of determination (close to the unit, 0.99), the slopeand the y-intercept, which were close to the unit (1.01) andzero (− 0.027), respectively, it could be concluded that a goodagreement between the experimental and the predicted datawas found. Moreover, the simulation was mathematicallyevaluated by using the MRE (%) and var (%) statistics, bothalso included in Table 1. It could be concluded from Fig. 2 andTable 1 that the drying curves of mushroom dried at 5, 10, and15 °C without and with acoustic assistance (20.5 kW/m3)could be satisfactorily simulated by using the proposedmodel.
In conclusion, the use of the proposedmodel allowed us theevaluation of the influence of both temperature and ultrasoundon the external and the internal mass transfer resistances.From the figures obtained for the diffusion coefficient andthe mass transfer coefficient, it could be concluded that theuse of acoustic energy contributed to accelerate the dryingprocess not only decreasing the external resistance but alsoincreasing the water mobility inside the food. The mechanicalvibration produced by the ultrasound application affectedboth, the internal resistance to the mass transport by succes-sive compressions and expansions of the material (Bspongeeffect^), and also the external resistance to the mass transportdue to the reduction of the boundary layer which eases thevapor transfer rate from the solid surface to the drying air(Rodriguez et al. 2018). The sum of both effects led to animportant increase of the water release rate during the dryingprocess.
Microstructure Observation
Light microscope micrographs of dried samples at 5, 10, and15 °C without (AIR) and with (AIR+US) 20.5 kW/m3 ofultrasound application are shown in Fig. 3. As it was reported
by Pei et al. (2014) and it could also be observed in this figure,mushroom microstructure presents a large amount of holes ina honeycomb ultra-structure. Mihalcea et al. (2016) describedthe mushroommicrostructure as an ensemble of typical fungalhyphae cells whose mechanical strength is due to chitin. Thesehyphae cells were observed by Mihalcea et al. (2016) in freshsample and could also be observed in dried samples in Fig. 3.
After drying without ultrasound application (AIR), themushroom microstructure observed in Fig. 3 presented tissueshrinkage (s) and collapse in some zones compared withothers as it was observed by Giri and Prasad (2007) aftermushroom drying at 60 °C and 1.5 m/s. Moreover, accordingto Mihalcea et al. (2016) during the mushroom drying processat 50, 60, and 70 °C and 0.55 m/s the intercellular spacesbetween hyphae cells enlarged and became more pronounced.This hollowing out phenomenon, also observed in Fig. 3 (h)(AIR), could be the result of the decreasing hyphae turgiditywhen the water was lost. So, the tissue lost its capacity to holdthe water and shrank (Mihalcea et al. 2016). Furthermore,according to Lombraña et al. (2010) and Mihalcea et al.(2016) when dryingmushroom slices at different temperatures(60–80 °C and 50–70 °C, respectively), more pronouncedshrinkage and hollowing out phenomena were observed whenincreasing temperature as it was also observed in Fig. 3 (AIR).
Regarding the ultrasound effects, micro-channels were ob-served in Fig. 3 (m) (AIR+US) together with convective dry-ing shrinkage (s) when mushroom drying was carried out at 5,10, and 15 °C with ultrasound application (20.5 kW/m3).When ultrasound was applied, micro-channels observed inFig. 3 (AIR+US) in dried samples at 15 °C, were in general,wider than those of dried samples at 5 and 10 °C, which mightbe related to a higher ultrasound effect and consequent higherdrying time reduction mentioned in the BDrying kinetics^ sec-tion. According to Islam et al. (2014) and Islam et al. (2015,mushroom tissue presented damages to the cells such as twist-ing or wrinkling due to sponge effect of ultrasound whichcreate micro-channels through the membrane when ultra-sound was applied during freezing at − 20 °C in a bath witha probe (20 kHz, 0.13–0.39W/cm2) or by direct contact with achamber (20 kHz, 300 W), respectively. Furthermore, whenultrasound pre-treatment with a probe (40 kHz, 0.44 W/cm2)was applied before mushroom drying at 60 °C and 0.5 m/s,breakdown of cell walls, decreased intercellular contact andcollapse of cell structure were observed by Zhang et al.(2016). No references about ultrasound application on mush-room drying at low-temperature were found but a comparisonwith other products was done. According to Santacatalinaet al. (2016a) and Ozuna et al. (2014), a greater degradationof the structure causing an increase in product porosity andpore diameter that eased the water movement in the matrixduring drying was observed when applying ultrasound (25–75 W and 20.5 kW/m3, respectively) during the low-temperature drying of apple (at 10 °C and − 10 °C and
0
2
4
6
8
10
12
0 2 4 6 8 10 12
tn
etn
oc
er
utsi
om
det
cid
er
P
(kg
/kg
d.m
.)
Experimental moisture content
(kg/kg d.m.)
Data
predicted bounds
lineal regression
Slope = 1.007 (1.000, 1.014)
y-intercept = -0.027 (-0.059, 0.004)
r2
= 0.99
Fig. 2 Predicted vs experimental moisture content, linear regression(slope and y-intercept) and predicted bounds at 95% of confidence ofmushroom drying kinetics at 5, 10, and 15 °C without and with20.5 kW/m3 and 22 kHz of ultrasound application. Slope and y-intercept 95% of confidence limits are presented in brackets
846 Food Bioprocess Technol (2019) 12:839–851
142
2 m/s) and salted cod (at − 10, 0, 10, and 20 °C and 2 m/s),respectively.
Bioactive Compounds and Antioxidant ActivityAnalyses
Ergosterol content (EC) and total polyphenol content (TPC)(mg of ergosterol or GAE/g d.m.) (Fig. 4), and the antioxidantactivity (AA) according to FRAP, CUPRAC, and ABTSmethods (mg TE/g d.m.) (Fig. 5) in dried mushroom samplesat 5, 10, and 15 °C without (AIR) and with 20.5 kW/m3 ofacoustic assistance (AIR+US), are shown in Figs. 4 and 5.
No significant (p ≥ 0.05) differences were observed be-tween EC of samples dried at 5 and 10 °C without ultra-sound application (AIR) but significantly lower (p < 0.05)EC was observed in samples dried at 15 °C comparedwith samples dried at 5 °C. However, regarding TPC, nosignificant differences (p ≥ 0.05) among dried samples at5, 10, and 15 °C without ultrasound application (AIR)were observed. Comparing AA of dried samples withoutultrasound application (AIR), significantly lower(p < 0.05) AA according to FRAP and CUPRAC methodswere observed at 15 °C compared with dried sample at
5 °C but no significantly different (p ≥ 0.05) AA in ABTSmethod were observed between them. Similar results wereobserved by Santacatalina et al. (2014) when drying appleat 5, 10, and 15 °C and 2 m/s. According to Santacatalinaet al. (2014) TPC, total flavonoid content and AA accord-ing to CUPRAC and DPPH methods of dried samples at0, 5, and 10 °C presented significantly lower (p < 0.05)figures with the increase of the temperature, meanwhileAA according to FRAP and ABTS methods presented nosignificant differences (p ≥ 0.05) among those samples.
Considering dried samples at 5, 10, and 15 °C without(AIR) and with (AIR+US) ultrasound application, signif-icantly higher (p < 0.05) EC and TPC figures were ob-served when ultrasound was applied during drying at eachtemperature. The increments were between 24 and 27% inEC and between 15 and 41% in TPC, compared withcorresponding sample without ultrasound application, be-ing higher as the temperature increased. AA figures ac-cording to all methods were not significantly different(p ≥ 0.05) between samples dried at 5 °C without (AIR)and with (AIR+US) ultrasound application. However, sig-nificantly higher (p < 0.05) AA figures according to allmethods were observed when ultrasound application was
AIR AIR+US
5 °C
10 °C
15 °C
m
s
m
s
s
m
s
sh
h
s
h
Fig. 3 Light microscopephotographs of dried samples at 5,10, and 15 °C without (AIR) andwith 20.5 kW/m3 and 22 kHz ofultrasound application (AIR+US).s, shrinkage; h, hollows; m,micro-channels
Food Bioprocess Technol (2019) 12:839–851 847
143

carried out (AIR+US) at 10 and 15 °C compared withsamples dried without ultrasound application (AIR). Inthis case, the increments ranged from 15 and 92% com-pared with the corresponding sample without ultrasoundapplication, being also higher in samples dried at 15 °Cthan at 10 °C.
According to the results of Lagnika et al. (2013), ultra-sound bath treatment (400 W during 10 min) on mushroomhas been reported to maintain the TPC. Comparing with low-temperature drying of other products, since no bibliographyabout mushroom low-temperature drying was found, higherfigures of TPC were also observed by Moreno et al. (2017)when ultrasound was applied (30.8 kW/m3) in apple slabsdrying (at − 10 °C and 2 m/s). Moreover, no significantlydifferent (p ≥ 0.05) AA figures according to FRAP andDPPH between apple-dried samples (at 5, 10, and 15 °C and2 m/s) without and with ultrasound application (20.5 kW/m3)were reported by Santacatalina et al. (2014). Santacatalinaet al. (2016a) reported also no significant differences (p ≥0.05) in TPC and AA according to FRAP between apple-dried samples (at − 10 and 10 °C and 2 m/s) without and withultrasound application (20.5 kW/m3).
Color Determinations
Figure 6 presents the browning index (BI) figures of driedmushroom samples at 5, 10, and 15 °C without (AIR) andwith 20.5 kW/m3 of ultrasound application (AIR+US). In av-erage, dried samples without ultrasound application (AIR)presented a BI between 27 and 36 units which was close tothe range of those reported by Nölle et al. (2017) in hot-airconvective drying of mushroom at 40, 60, and 80 °C and0.6 m/s (BI between 23 and 39 units). It can be observed thatsamples dried at 10 and 15 °C (AIR) presented significantlyhigher (p < 0.05) BI values than samples dried at 5 °C (AIR).Thereby, the increment of temperature from 5 to 10 °C pro-moted higher color coordinates changes and, consequently,higher BI figures. Also, significantly higher (p < 0.05) BI fig-ures with higher temperatures were observed by Nölle et al.(2017) in hot-air convective drying of mushroom at 40, 60,and 80 °C and 0.6 m/s (23, 27, and 39 units, respectively).
The samples dried with ultrasound application (AIR+US)at 10 and 15 °C presented significantly lower (p < 0.05) BIthan corresponding dried samples without ultrasound applica-tion (AIR). Significantly lower (p < 0.05) BI was also
cdde
e
a
b bc
0
1
2
3
4
5
6
7
8
9
5 °C 10 °C 15 °C
).m.
dg/l
or
ets
og
re
gm
(C
E
AIR
AIR+US
c cc
bb
a
0
2
4
6
8
10
12
5 °C 10 °C 15 °C
TP
C (
mg
GA
E/g
d.m
.)
AIR
AIR+US
Fig. 4 Ergosterol content (EC)and total polyphenol contents(TPC) (mg of ergosterol or GAE/g d.m.) in dried mushroom sam-ples at 5, 10, and 15 °C without(AIR, white bars) and with20.5 kW/m3 and 22 kHz ofacoustic assistance (AIR+US,gray bars). Average values ±standard deviations. Means withdifferent letter for EC or TPCshowed significant differencesaccording to Tukey’s test(p < 0.05)
b
d
e
bc c
a
0
5
10
15
20
25
30
35
5 °C 10 °C 15 °C
).m.
dg/
ET
gm
(P
AR
F
AIR
AIR+US
c c
d
c
b
a
0
5
10
15
20
25
30
35
40
5 °C 10 °C 15 °C
CU
PR
AC
(m
g T
E/g
d.m
.)
AIR
AIR+US
cd
c c
d
b
a
0
10
20
30
40
50
60
70
80
5 °C 10 °C 15 °C
AB
TS
(m
g T
E/g
d.m
.)
AIR
AIR+US
Fig. 5 Antioxidant activity (AA)according to FRAP, CUPRAC, andABTS methods (mg TE/g d.m.) indried mushroom samples at 5, 10,and 15 °C without (AIR, whitebars) and with 20.5 kW/m3 and22 kHz of acoustic assistance(AIR+US, gray bars). Averagevalues ± standard deviations.Means with different letter for AA,according to FRAP, CUPRAC, orABTS methods, showed signifi-cant differences according toTukey’s test (p < 0.05)
848 Food Bioprocess Technol (2019) 12:839–851
144

observed by Çakmak et al. (2016) in dried mushroom samplesat 50 °C and 1.5 m/s with ultrasound bath pre-treatment at450 W during 30 min (BI of 30.72 ± 0.06) compared withdried sample without pre-treatment (BI of 36.89 ± 0.12).However, BI of dried sample at 5 °C with ultrasound applica-tion (AIR+US) was significantly higher (p < 0.05) than thecorresponding dried sample without ultrasound application(AIR), probably due to a longer ultrasound Bsponge effect^exposure.
Hydration Properties and Fat Adsorption Capacity
Figure 7 shows swelling (SW), water retention capacity (WRC),and fat adsorption capacity (FAC) of sieved powder (90–180μm) of mushroom samples dried at 5, 10, and 15 °Cwithout
(AIR) and with 20.5 kW/m3 of ultrasound application (AIR+US). No references about hydration properties and fat adsorptioncapacity of driedmushroomwere found. Therefore, comparisonswith other dried products were carried out. SWandWRC valuesof mushroom samples dried without ultrasound application(AIR) were of 14.6–16.6 mL/g and 5.2–6.9 g/g, respectively,which were in the range of those reported by Femenia et al.(1997) for dried cauliflower florets and upper stems at 40 and75 °C (4.2–17.5 mL/g and 5.7–18.2 g/g). FAC values of samplesdried without ultrasound application (AIR) were of 4.6–4.9 g/gand they were in the range of the values reported by Femeniaet al. (2009) in kiwi dried at 30 to 90 °C (4–10 g/g). In overall,compared with other fruits and vegetables, mushroom presentedhigh hydration properties and fat adsorption capacity figures. Infact, Ekunseitan et al. (2017) observed significantly higher(p< 0.05) WRC and FAC in composite flour (wheat, cassava,and mushroom flour) when mushroom flour ratio was increased.
Samples dried at 5, 10, and 15 °C without ultrasound appli-cation (AIR) presented no significantly different (p ≥ 0.05) SWand FAC.However,WRCvalues of samples dried at 5 and 15 °Cwithout ultrasound application (AIR) were significantly different(p< 0.05). Thus, when ultrasound was not applied (AIR) lowerWRC value was observed when the highest drying temperaturewas applied (15 °C). Similar results were observed by Garauet al. (2006) in WRC and FAC values of orange skin dried at30–90 °C (particle size of 180 μm). According to these authors,significantly lower (p< 0.05) WRC value was observed whenincreasing drying temperature and no significant differences (p ≥0.05) in FAC values were observed when increasing drying tem-perature, excluding FAC value of sample dried at 90 °C whichwas significantly lower.
When ultrasound was applied (AIR+US), no significant dif-ferences (p ≥ 0.05) in SW and WRC values were observedamong dried samples at 5 and 10 °Cwithout andwith ultrasoundapplication (AIR and AIR+US). However, sample dried at 15 °Cwith ultrasound application (AIR+US) presented significantlyhigher (p < 0.05) SW and WRC values than the corresponding
bb
bbb
a
0
5
10
15
20
25
5 °C 10 °C 15 °C
SW
(m
L/g
d.m
.)
AIR
AIR+US
a
a
b
aa
a
0
1
2
3
4
5
6
7
8
5 °C 10 °C 15 °C
WR
C (
g/g
d.m
.)
AIR
AIR+US
b b b
aa a
0
2
4
6
8
10
12
14
5 °C 10 °C 15 °C
FA
C (
g/g
d.m
.)
AIR
AIR+US
Fig. 7 Swelling (SW), waterretention capacity (WRC), and fatadsorption capacity (FAC) ofdried mushroom samples at 5, 10,and 15 °C without (AIR, whitebars) and with 20.5 kW/m3 and22 kHz of ultrasound application(AIR+US, gray bars). Averagevalues ± standard deviations.Means with different letter forSW, WRC, or FAC showed sig-nificant differences according toTukey’s test (p < 0.05)
e
abbc
a
cd
de
0
5
10
15
20
25
30
35
40
45
5 °C 10 °C 15 °C
BI
AIR
AIR+US
Fig. 6 Browning index (BI) of dried mushroom samples at 5, 10, and15 °C without (AIR, white bars) and with 20.5 kW/m3 and 22 kHz ofultrasound application (AIR+US, gray bars). Average values ± standarddeviations. Means with different letter for BI showed significant differ-ences according to Tukey’s test (p < 0.05)
Food Bioprocess Technol (2019) 12:839–851 849
145
sample dried without ultrasound application (AIR). With regardto FAC, all samples dried with ultrasound application (AIR+US)presented significantly higher (p < 0.05) values than correspond-ing samples without ultrasound application (AIR). Similar resultswere obtained also by Malik et al. (2017), thus, significantlyhigher (p < 0.05) FAC value was observed after ultrasound treat-ment of sunflower protein in bath (500 Wand 40 kHz) or probe(500 W and 20 kHz) during 5, 10, 20, and 30 min, comparedwith sample without treatment.
Conclusions
When ultrasound was applied (AIR+US), significantly shorter(p < 0.05) drying times were observed (41–66% decrease) andsignificantly higherDe (76–184% increase) and hm (61–157%increase) coefficients were identified with the proposed diffu-sion model, compared with the drying without ultrasound ap-plication (AIR), within the studied temperature range (5–15 °C). Effects of ultrasound application were higher at higherdrying temperature. Mushroom microstructure presented tis-sue shrinkage and hollows after drying at 5, 10, and 15 °C;meanwhile, ultrasound application during drying promotedmicro-channels formation due to sponge effect, which werewider when increasing the temperature.
With regard to quality parameter changes when drying atdifferent temperatures (5, 10, and 15 °C), significantly lowerEC and AA (FRAP and CUPRAC), higher BI figures, andlower WRC value were observed when drying temperature in-creased up to 15 °C. However, when ultrasound was appliedcompared with experiments without ultrasound application(AIR), EC, TPC, and AA (all methods) figures were significant-ly higher or no significantly different at every temperature test-ed, significantly lower BI figures were observed at 10 and 15 °Cand significantly higher hydration properties and fat adsorptioncapacity (SW, WRC, and FAC) values were obtained at 15 °C.
In brief, mushroom low-temperature drying process wasintensified by using ultrasound application since mass transferprocess was enhanced and, at the same time, quality parame-ters were preserved or improved comparing with drying pro-cess without ultrasound application, particularly when dryingwas carried out at 15 °C.
Funding Information The authors would like to acknowledge the finan-cial support of the National Institute of Research and Agro-FoodTechnology (INIA) and co-financed with ERDF funds (RTA2015-00060-C04-03), the Balearic Government for the research projectAAEE045/2017 co-financed with ERDF funds, and the SpanishGovernment (MINECO) for the BES-2013-064131 fellowship.Nomenclature A, Face area (m2); BI, Browning index; De, Effectivewater diffusion coefficient (m2/s);Do, Parameter in the effective diffusiv-ity model (m2/s); Ea, Activation energy (kJ/mol); hm, External mass trans-fer coefficient (kg water/m2s); L, Length (m); n, Number of experimentaldata; MRE, Mean relative error (%); R, Universal gas constant (J/mol·K);Sx, Standard deviation (sample); Syx, Standard deviation (estimation); T,
Temperature (°C); Th, Thickness (m); t, Time (h); V, Sample volume(m3); var, Percentage of explained variance (%); W, Average moisturecontent (kg/kg d.m.); x, Spatial coordinate (m); ρdm, Dry matter density(kg d.m./m3); φ, Relative humiditySubscripts 0 , initial; ∞, drying air; cal, calculated; e, equilibrium at thesurface; exp, experimental
References
AOAC. (2006).Moisture in dried fruits (16th ed.). Maryland: Associationof Analytical Communities.
Çakmak, R. Ş., Tekeoğlu, O., Bozkır, H., Ergün, A. R., & Baysal, T.(2016). Effects of electrical and sonication pretreatments on thedrying rate and quality of mushrooms. LWT - Food Science andTechnology, 69(Supplement C), 197–202.
Eim, V. S., Urrea, D., Rosselló, C., García-Pérez, J. V., Femenia, A., &Simal, S. (2013). Optimization of the drying process of carrot(Daucus carota v. Nantes) on the basis of quality criteria. DryingTechnology, 31(8), 951–962.
Ekunseitan, O. F., Obadina, A. O., Sobukola, O. P., Omemu, A. M.,Adegunwa, M. O., Kajihausa, O. E., Adebowale, A.-R. A., Sanni,S. A., Sanni, L. O., & Keith, T. (2017). Nutritional composition,functional and pasting properties of wheat, mushroom, and highquality cassava composite flour. Journal of Food Processing andPreservation, 41(5), 1–8.
Farokhian, F., Jafarpour, M., Goli, M., & Askari-Khorasgani, O. (2017).Quality preservation of air-dried sliced button mushroom (Agaricusbisporus) by lavender (Lavendula angustifolia mill.) essential oil.Journal of Food Process Engineering, 40(3), e12432.
Femenia, A., Lefebvre, A. C., Thebaudin, J. Y., Robertson, J., &Bourgeois, C. M. (1997). Physical and sensory properties of modelfoods supplementedwith cauliflower fiber. Journal of Food Science,62(4), 635–639.
Femenia, A., Sastre-Serrano, G., Simal, S., Garau, M. C., Eim, V. S., &Rosselló, C. (2009). Effects of air-drying temperature on the cellwalls of kiwifruit processed at different stages of ripening. LWT -Food Science and Technology, 42(1), 106–112.
Gamboa-Santos, J., Montilla, A., Cárcel, J. A., Villamiel, M., & Garcia-Perez, J. V. (2014). Air-borne ultrasound application in the convec-tive drying of strawberry. Journal of Food Engineering, 128, 132–139.
Garau, M. C., Simal, S., Femenia, A., & Rosselló, C. (2006). Drying oforange skin: drying kinetics modelling and functional properties.Journal of Food Engineering, 75(2), 288–295.
García-Pérez, J. V., Ozuna, C., Ortuño, C., Cárcel, J. A., & Mulet, A.(2011). Modeling ultrasonically assisted convective drying of egg-plant. Drying Technology, 29(13), 1499–1509.
García-Pérez, J. V., Cárcel, J. A., Riera, E., Rosselló, C., & Mulet, A.(2012a). Intensification of low-temperature drying by using ultra-sound. Drying Technology, 30(11–12), 1199–1208.
García-Pérez, J. V., Ortuño, C., Puig, A., Cárcel, J. A., & Perez-Munuera,I. (2012b). Enhancement of water transport and microstructuralchanges induced by high-intensity ultrasound application on orangepeel drying. Food and Bioprocess Technology, 5(6), 2256–2265.
Giri, S. K., & Prasad, S. (2007). Drying kinetics and rehydration charac-teristics of microwave-vacuum and convective hot-air dried mush-rooms. Journal of Food Engineering, 78(2), 512–521.
González-Centeno, M. R., Jourdes, M., Femenia, A., Simal, S., Rosselló,C., & Teissedre, P.-L. (2012). Proanthocyanidin composition andantioxidant potential of the stem winemaking byproducts from 10different grape varieties (Vitis vinifera L.). Journal of Agriculturaland Food Chemistry, 60(48), 11850–11858.
Guan, W., Zhang, J., Yan, R., Shao, S., Zhou, T., Lei, J., & Wang, Z.(2016). Effects of UV-C treatment and cold storage on ergosterol
850 Food Bioprocess Technol (2019) 12:839–851
146

and vitamin D2 contents in different parts of white and brownmush-room (Agaricus bisporus). Food Chemistry, 210(Supplement C),129–134.
Heredia, J. B., & Cisneros-Zevallos, L. (2009). The effects of exogenousethylene and methyl jasmonate on the accumulation of phenolicantioxidants in selected whole and wounded fresh produce. FoodChemistry, 115(4), 1500–1508.
Iglesias, H. A., & Chirife, J. (1982). Handbook of food isotherms: watersorption parameters for food and food components. New York:Academic.
Islam, M. N., Zhang, M., Adhikari, B., Xinfeng, C., & Xu, B.-G. (2014).The effect of ultrasound-assisted immersion freezing on selectedphysicochemical properties of mushrooms. International Journalof Refrigeration, 42(Supplement C), 121–133.
Islam, M. N., Zhang, M., Fang, Z., & Sun, J. (2015). Direct contactultrasound assisted freezing of mushroom (Agaricus bisporus):growth and size distribution of ice crystals. International Journalof Refrigeration, 57(Supplement C), 46–53.
Lagnika, C., Zhang, M., & Mothibe, K. J. (2013). Effects of ultrasoundand high pressure argon on physico-chemical properties of whitemushrooms (Agaricus bisporus) during postharvest storage.Postharvest Biology and Technology, 82(Supplement C), 87–94.
Lombraña, J. I., Rodríguez, R., & Ruiz, U. (2010). Microwave-drying ofsliced mushroom. Analysis of temperature control and pressure.Innovative Food Science & Emerging Technologies, 11(4), 652–660.
Malik, M. A., Sharma, H. K., & Saini, C. S. (2017). High intensityultrasound treatment of protein isolate extracted from dephenolizedsunflower meal: effect on physicochemical and functional proper-ties. Ultrasonics Sonochemistry, 39(Supplement C), 511–519.
Mihalcea, L. I., Bucur, F. C., Cantaragiu, A. M. M., Gurgu, L. C., Borda,D. D., & Iordachescu, G. S. (2016). Temperature influence on theAgaricus bisporus mushrooms dehydration process. Scientific Studyand Research: Chemistry and Chemical Engineering,Biotechnology, Food Industry, 17(4), 323–333.
Moreno, C., Brines, C., Mulet, A., Rosselló, C., & Cárcel, J. A. (2017).Antioxidant potential of atmospheric freeze-dried apples as affectedby ultrasound application and sample surface. Drying Technology,35(8), 957–968.
Nölle, N., Argyropoulos, D., Müller, J. & Biesalski, H. K. (2017).Temperature stability of vitaminD2 and color changes during dryingof UVB-treated mushrooms. Drying Technology, 36(3), 307–315.https://doi.org/10.1080/07373937.2017.1326501.
Ozuna, C., Cárcel, J. A., Walde, P. M., & Garcia-Perez, J. V. (2014). Low-temperature drying of salted cod (Gadus morhua) assisted by highpower ultrasound: Kinetics and physical properties. Innovative FoodScience & Emerging Technologies, 23(Supplement C), 146–155.
Paciulli, M., Ganino, T., Pellegrini, N., Rinaldi, M., Zaupa, M., Fabbri,A., & Chiavaro, E. (2015). Impact of the industrial freezing processon selected vegetables — Part I. Structure, texture and antioxidantcapacity. Food Research International, 74, 329–337.
Palacios, I., Lozano, M., Moro, C., D’Arrigo, M., Rostagno, M. A.,Martínez, J. A., García-Lafuente, A., Guillamón, E., & Villares, A.(2011). Antioxidant properties of phenolic compounds occurring inedible mushrooms. Food Chemistry, 128(3), 674–678.
Pei, F., Yang,W.-J., Shi, Y., Sun, Y., Mariga, A.M., Zhao, L.-Y., Fang, Y.,Ma, N., An, X.-X., & Hu, Q.-H. (2014). Comparison of freeze-dryingwith three different combinations of dryingmethods and theirinfluence on colour, texture, microstructure and nutrient retention ofbutton mushroom (Agaricus bisporus) slices. Food and BioprocessTechnology, 7(3), 702–710.
Reay, D., Ramshaw, C., & Harvey, A. (2013). Process intensification:engineering for efficiency, sustainability and flexibility. Amsterdam:Elsevier Science.
Reis, F. S., Martins, A., Vasconcelos, M. H., Morales, P., & Ferreira, I. C.F. R. (2017). Functional foods based on extracts or compoundsderived from mushrooms. Trends in Food Science & Technology,66(Supplement C), 48–62.
Rodríguez, Ó., Eim, V. S., Simal, S., Femenia, A., & Rosselló, C. (2013).Validation of a difussion model using moisture profiles measured bymeans of TD-NMR in apples (Malus domestica). Food andBioprocess Technology, 6(2), 542–552.
Rodríguez, Ó., Santacatalina, J. V., Simal, S., Garcia-Perez, J. V.,Femenia, A., & Rosselló, C. (2014). Influence of power ultrasoundapplication on drying kinetics of apple and its antioxidant and mi-crostructural properties. Journal of Food Engineering, 129, 21–29.
Rodriguez, O., Eim, V., Rossello, C., Femenia, A., Carcel, J. A., & Simal,S. (2018). Application of power ultrasound on the convective dryingof fruits and vegetables: effects on quality. Journal of the Science ofFood and Agriculture, 98(5), 1660–1673.
Salehi, F., Kashaninejad, M., & Jafarianlari, A. (2017). Drying kineticsand characteristics of combined infrared-vacuum drying of buttonmushroom slices. Heat and Mass Transfer, 53(5), 1751–1759.
Santacatalina, J., Rodríguez, O., Simal, S., Cárcel, J., Mulet, A., &García-Pérez, J. (2014). Ultrasonically enhanced low-temperaturedrying of apple: influence on drying kinetics and antioxidant poten-tial. Journal of Food Engineering, 138, 35–44.
Santacatalina, J. V., Contreras, M., Simal, S., Cárcel, J. A., & Garcia-Perez, J. V. (2016a). Impact of applied ultrasonic power on thelow temperature drying of apple. Ultrasonics Sonochemistry,28(Supplement C), 100–109.
Santacatalina, J. V., Guerrero, M. E., Garcia-Perez, J. V., Mulet, A., &Cárcel, J. A. (2016b). Ultrasonically assisted low-temperature dry-ing of desalted codfish. LWT - Food Science and Technology,65(Supplement C), 444–450.
Santacatalina, J. V., Soriano, J. R., Cárcel, J. A., & Garcia-Perez, J. V.(2016c). Influence of air velocity and temperature on ultrasonicallyassisted low temperature drying of eggplant. Food and BioproductsProcessing, 100(Part A), 282–291.
Shao, S., Hernandez, M., Kramer, J. K. G., Rinker, D. L., & Tsao, R.(2010). Ergosterol profiles, fatty acid composition, and antioxidantactivities of button mushrooms as affected by tissue part and devel-opmental stage. Journal of Agricultural and Food Chemistry,58(22), 11616–11625.
Spanish Government. (2018). Fábrica Nacional de Moneda y Timbre-Real Casa de la Moneda. Available at http://www.fnmt.es/en/institucion/informacion-institucional. Accessed 28/11/2018 2018.
Urun, G. B., Yaman, Ü. R., & Köse, E. (2015). Determination of dryingcharacteristics and quality properties of eggplant in different dryingconditions. Italian Journal of Food Science, 27(4), 459–467.
Vallespir, F., Rodriguez, O., Carcel, J. A., Rossello, C. & Simal, S.(2018). Ultrasound assisted low-temperature drying of kiwifruit:effects on drying kinetics, bioactive compounds and antioxidantactivity. Journal of the Science of Food Agriculture. https://doi.org/10.1002/jsfa.9503.
Wu, X., Guan, W., Yan, R., Lei, J., Xu, L., & Wang, Z. (2016). Effects ofUV-C on antioxidant activity, total phenolics and main phenoliccompounds of the melanin biosynthesis pathway in different tissuesof button mushroom. Postharvest Biology and Technology, 118, 51–58.
Zhang, Z., Liu, Z., Liu, C., Li, D., Jiang, N., & Liu, C. (2016). Effects ofultrasound pretreatment on drying kinetics and quality parameters ofbutton mushroom slices. Drying Technology, 34(15), 1791–1800.
Publisher’s Note Springer Nature remains neutral with regard to juris-dictional claims in published maps and institutional affiliations.
Food Bioprocess Technol (2019) 12:839–851 851
147

148

ADDITIONAL DISCUSSION
149

Doctoral thesis Francisca Vallespir Torrens ADDITIONAL DISCUSSION
150
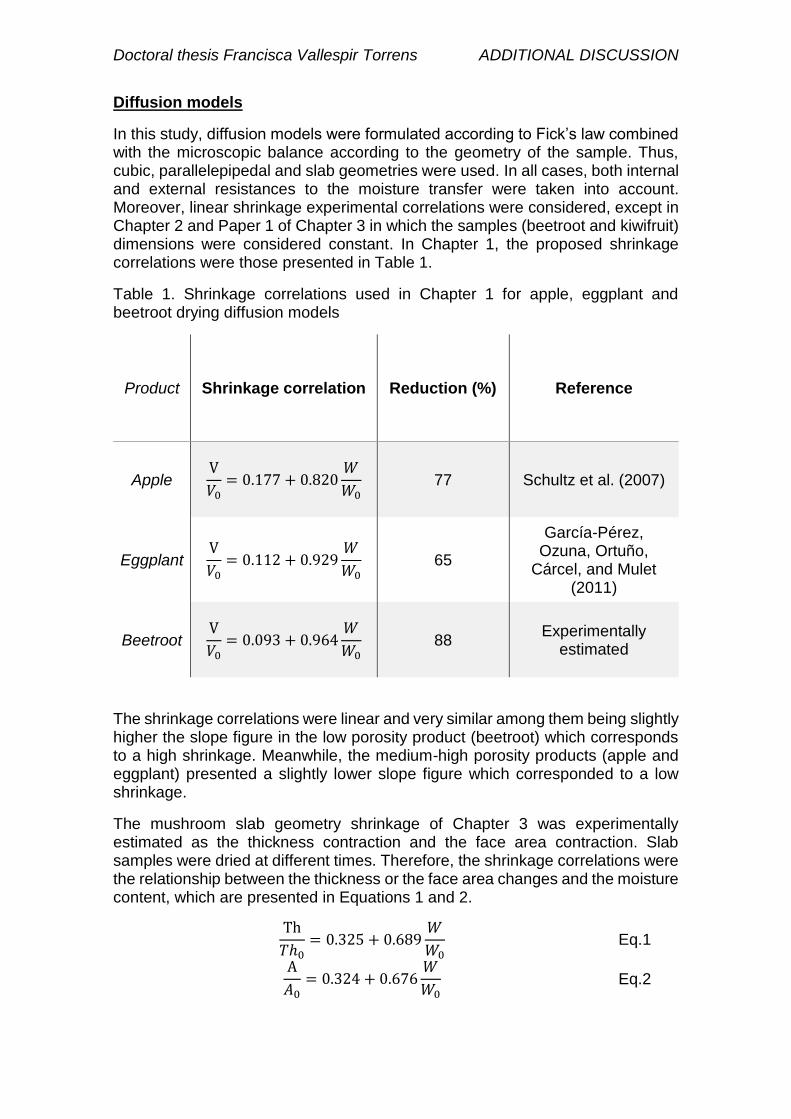
Doctoral thesis Francisca Vallespir Torrens ADDITIONAL DISCUSSION
Diffusion models
In this study, diffusion models were formulated according to Fick’s law combined with the microscopic balance according to the geometry of the sample. Thus, cubic, parallelepipedal and slab geometries were used. In all cases, both internal and external resistances to the moisture transfer were taken into account. Moreover, linear shrinkage experimental correlations were considered, except in Chapter 2 and Paper 1 of Chapter 3 in which the samples (beetroot and kiwifruit) dimensions were considered constant. In Chapter 1, the proposed shrinkage correlations were those presented in Table 1.
Table 1. Shrinkage correlations used in Chapter 1 for apple, eggplant and beetroot drying diffusion models
Product Shrinkage correlation Reduction (%) Reference
Apple V
𝑉0= 0.177 + 0.820
𝑊
𝑊0 77 Schultz et al. (2007)
Eggplant V
𝑉0= 0.112 + 0.929
𝑊
𝑊0 65
García-Pérez, Ozuna, Ortuño,
Cárcel, and Mulet (2011)
Beetroot V
𝑉0= 0.093 + 0.964
𝑊
𝑊0 88
Experimentally estimated
The shrinkage correlations were linear and very similar among them being slightly higher the slope figure in the low porosity product (beetroot) which corresponds to a high shrinkage. Meanwhile, the medium-high porosity products (apple and eggplant) presented a slightly lower slope figure which corresponded to a low shrinkage.
The mushroom slab geometry shrinkage of Chapter 3 was experimentally estimated as the thickness contraction and the face area contraction. Slab samples were dried at different times. Therefore, the shrinkage correlations were the relationship between the thickness or the face area changes and the moisture content, which are presented in Equations 1 and 2.
Th
𝑇ℎ0= 0.325 + 0.689
𝑊
𝑊0 Eq.1
A
𝐴0= 0.324 + 0.676
𝑊
𝑊0 Eq.2
151

Doctoral thesis Francisca Vallespir Torrens ADDITIONAL DISCUSSION
The proposed diffusion models allowed the proper evaluation of the different samples drying kinetics under the different conditions tested since the mean relative error (MRE) was lower than 5% and the percentage of explained variance (var) was higher than 99.5%.
From the obtained results, it could be concluded that freezing treatments at −20
C, at −80 C and by liquid nitrogen immersion before hot-air drying of beetroot,
apple and eggplant at 40 C enhanced drying process increasing the effective diffusion coefficient by up to 72%, compared with drying experiments of untreated samples. Moreover, both freezing pre-treatment and ultrasound application at low temperatures drying synergistically affected the mass transfer rate.
Comparing between beetroot hot-air drying at 50 and 40 C when freezing pre-treatment were not applied, higher effective diffusion coefficient and higher external mass transfer coefficient were identified since faster internal mass transfer is observed.
Furthermore, the drying operation at low-temperature could be intensified by ultrasound application. Ultrasound application at 20.5 kW/m3 during drying of
kiwifruit and mushroom at low-temperature (5, 10 and 15 C) enhanced mass transfer rate, increasing both the effective diffusion and the external mass transfer coefficients (76-184% and 61-231%, respectively), compared with the corresponding drying process without ultrasound application
Comparing between the identified parameters in low-temperature drying of kiwifruit and mushroom, higher effective diffusion coefficient and higher external mass transfer coefficient were observed in mushroom compared with kiwifruit when no ultrasound power density was applied. The initial food matrix of both products was different as well as the initial moisture content and the sample geometry. Therefore, faster drying kinetics were observed in mushroom drying than in kiwifruit drying and, consequently, higher parameters were identified in the diffusion model proposed.
Energy concerns
Additionally, drying process research focuses on different objectives. One of them is the reduction of the operating costs and the improvement of drying equipment capacity (Chua and Chou, 2014). Thus, to really ascertain the overall drying efficiency of freezing pre-treatments and ultrasound application, another important aspect to consider is the energy efficiency. Although freezing pre-treatment and ultrasound application required an additional power feed, a reduced drying time due to accelerated heat and mass transfer process may cause a corresponding reduction in the amount of energy required in comparison with conventional convective drying.
Therefore, as an additional information, the energy considerations of the experiments done in this doctoral thesis have been taken into account. However, it might be difficult to calculate an energy cost per kg of dry product so, an estimation of the specific energy consumption was done according to the equipment technical datasheet for each experiment and following the methodology proposed by Zielinska, Sadowski, and Błaszczak (2015).
152
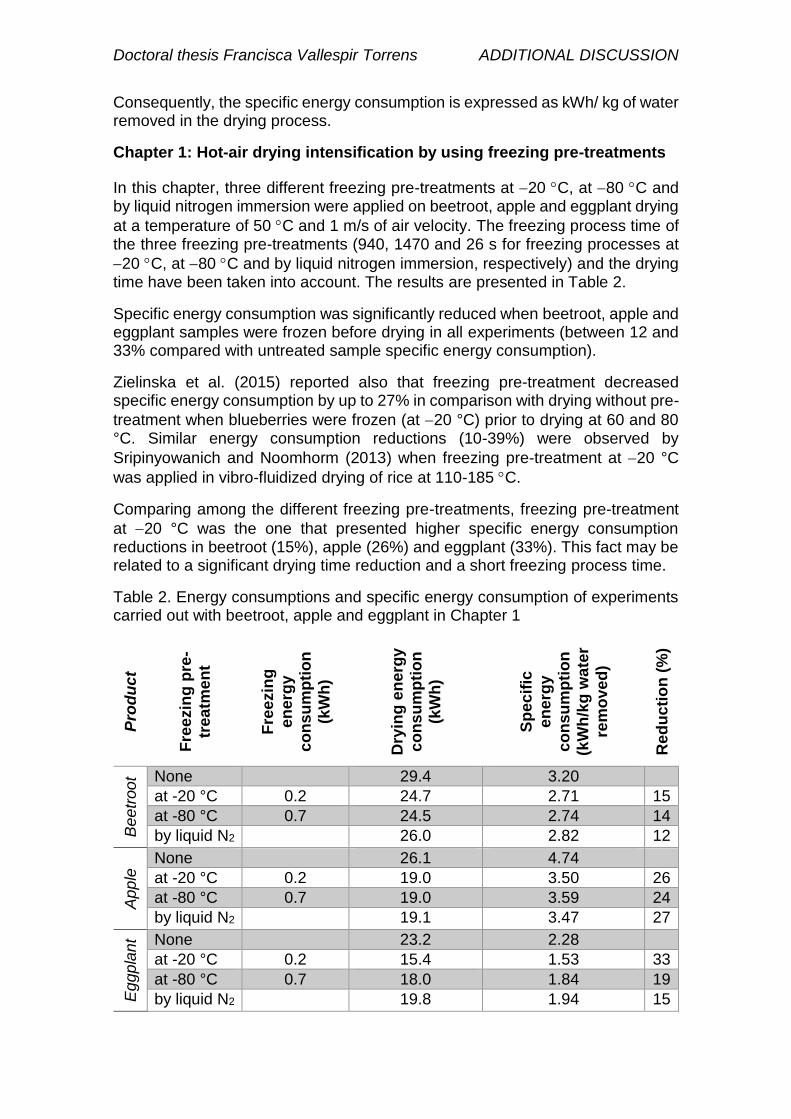
Doctoral thesis Francisca Vallespir Torrens ADDITIONAL DISCUSSION
Consequently, the specific energy consumption is expressed as kWh/ kg of water removed in the drying process.
Chapter 1: Hot-air drying intensification by using freezing pre-treatments
In this chapter, three different freezing pre-treatments at −20 C, at −80 C and by liquid nitrogen immersion were applied on beetroot, apple and eggplant drying
at a temperature of 50 C and 1 m/s of air velocity. The freezing process time of the three freezing pre-treatments (940, 1470 and 26 s for freezing processes at
−20 C, at −80 C and by liquid nitrogen immersion, respectively) and the drying time have been taken into account. The results are presented in Table 2.
Specific energy consumption was significantly reduced when beetroot, apple and eggplant samples were frozen before drying in all experiments (between 12 and 33% compared with untreated sample specific energy consumption).
Zielinska et al. (2015) reported also that freezing pre-treatment decreased specific energy consumption by up to 27% in comparison with drying without pre-
treatment when blueberries were frozen (at −20 °C) prior to drying at 60 and 80 °C. Similar energy consumption reductions (10-39%) were observed by
Sripinyowanich and Noomhorm (2013) when freezing pre-treatment at −20 °C
was applied in vibro-fluidized drying of rice at 110-185 C.
Comparing among the different freezing pre-treatments, freezing pre-treatment
at −20 °C was the one that presented higher specific energy consumption reductions in beetroot (15%), apple (26%) and eggplant (33%). This fact may be related to a significant drying time reduction and a short freezing process time.
Table 2. Energy consumptions and specific energy consumption of experiments carried out with beetroot, apple and eggplant in Chapter 1
Pro
du
ct
Fre
ezin
g p
re-
trea
tmen
t
Fre
ezin
g
en
erg
y
co
nsu
mp
tio
n
(kW
h)
Dry
ing
en
erg
y
co
nsu
mp
tio
n
(kW
h)
Sp
ec
ific
en
erg
y
co
nsu
mp
tio
n
(kW
h/k
g w
ate
r
rem
ov
ed
)
Red
uc
tio
n (
%)
Be
etr
oo
t None
29.4 3.20
at -20 °C 0.2 24.7 2.71 15
at -80 °C 0.7 24.5 2.74 14
by liquid N2
26.0 2.82 12
Ap
ple
None
26.1 4.74
at -20 °C 0.2 19.0 3.50 26
at -80 °C 0.7 19.0 3.59 24
by liquid N2
19.1 3.47 27
Eg
gp
lan
t None
23.2 2.28
at -20 °C 0.2 15.4 1.53 33
at -80 °C 0.7 18.0 1.84 19
by liquid N2
19.8 1.94 15
153
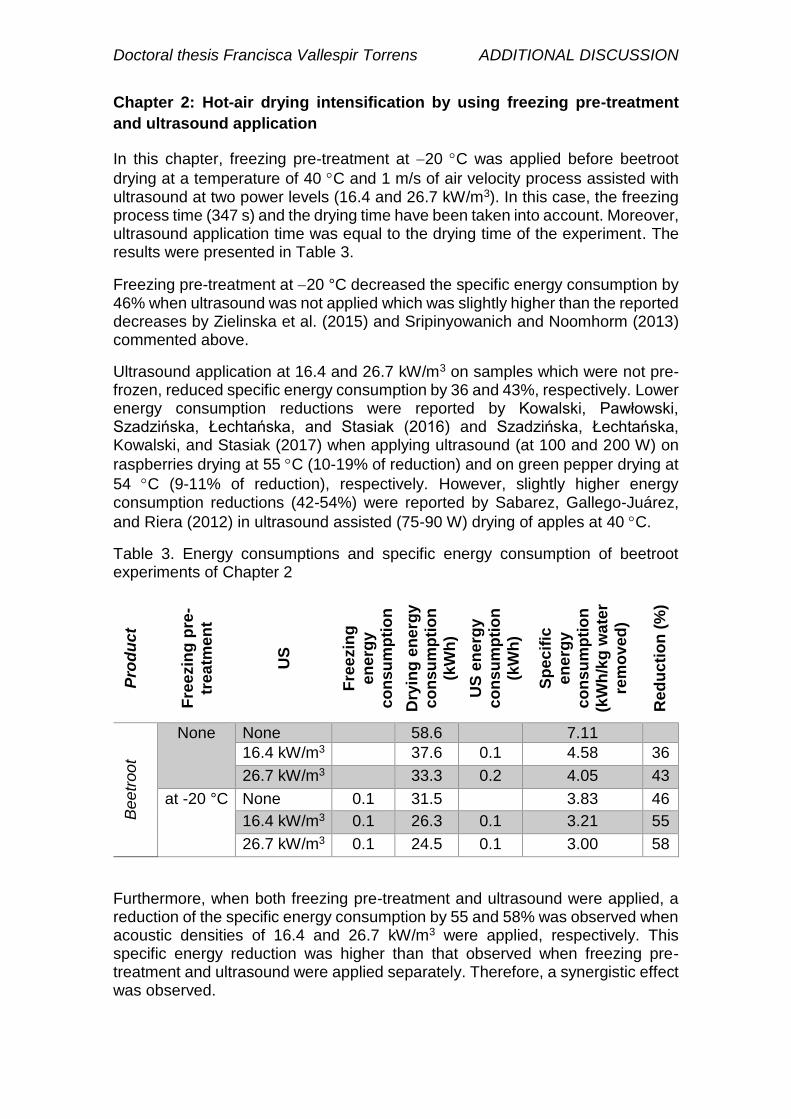
Doctoral thesis Francisca Vallespir Torrens ADDITIONAL DISCUSSION
Chapter 2: Hot-air drying intensification by using freezing pre-treatment
and ultrasound application
In this chapter, freezing pre-treatment at −20 C was applied before beetroot
drying at a temperature of 40 C and 1 m/s of air velocity process assisted with ultrasound at two power levels (16.4 and 26.7 kW/m3). In this case, the freezing process time (347 s) and the drying time have been taken into account. Moreover, ultrasound application time was equal to the drying time of the experiment. The results were presented in Table 3.
Freezing pre-treatment at −20 °C decreased the specific energy consumption by 46% when ultrasound was not applied which was slightly higher than the reported decreases by Zielinska et al. (2015) and Sripinyowanich and Noomhorm (2013) commented above.
Ultrasound application at 16.4 and 26.7 kW/m3 on samples which were not pre-frozen, reduced specific energy consumption by 36 and 43%, respectively. Lower energy consumption reductions were reported by Kowalski, Pawłowski, Szadzińska, Łechtańska, and Stasiak (2016) and Szadzińska, Łechtańska, Kowalski, and Stasiak (2017) when applying ultrasound (at 100 and 200 W) on
raspberries drying at 55 C (10-19% of reduction) and on green pepper drying at
54 C (9-11% of reduction), respectively. However, slightly higher energy consumption reductions (42-54%) were reported by Sabarez, Gallego-Juárez,
and Riera (2012) in ultrasound assisted (75-90 W) drying of apples at 40 C.
Table 3. Energy consumptions and specific energy consumption of beetroot experiments of Chapter 2
Pro
du
ct
Fre
ezin
g p
re-
trea
tmen
t
US
Fre
ezin
g
en
erg
y
co
nsu
mp
tio
n
(kW
h)
Dry
ing
en
erg
y
co
nsu
mp
tio
n
(kW
h)
US
en
erg
y
co
nsu
mp
tio
n
(kW
h)
Sp
ec
ific
en
erg
y
co
nsu
mp
tio
n
(kW
h/k
g w
ate
r
rem
ov
ed
)
Red
uc
tio
n (
%)
Be
etr
oo
t
None None
58.6
7.11
16.4 kW/m3
37.6 0.1 4.58 36
26.7 kW/m3
33.3 0.2 4.05 43
at -20 °C None 0.1 31.5
3.83 46
16.4 kW/m3 0.1 26.3 0.1 3.21 55
26.7 kW/m3 0.1 24.5 0.1 3.00 58
Furthermore, when both freezing pre-treatment and ultrasound were applied, a reduction of the specific energy consumption by 55 and 58% was observed when acoustic densities of 16.4 and 26.7 kW/m3 were applied, respectively. This specific energy reduction was higher than that observed when freezing pre-treatment and ultrasound were applied separately. Therefore, a synergistic effect was observed.
154
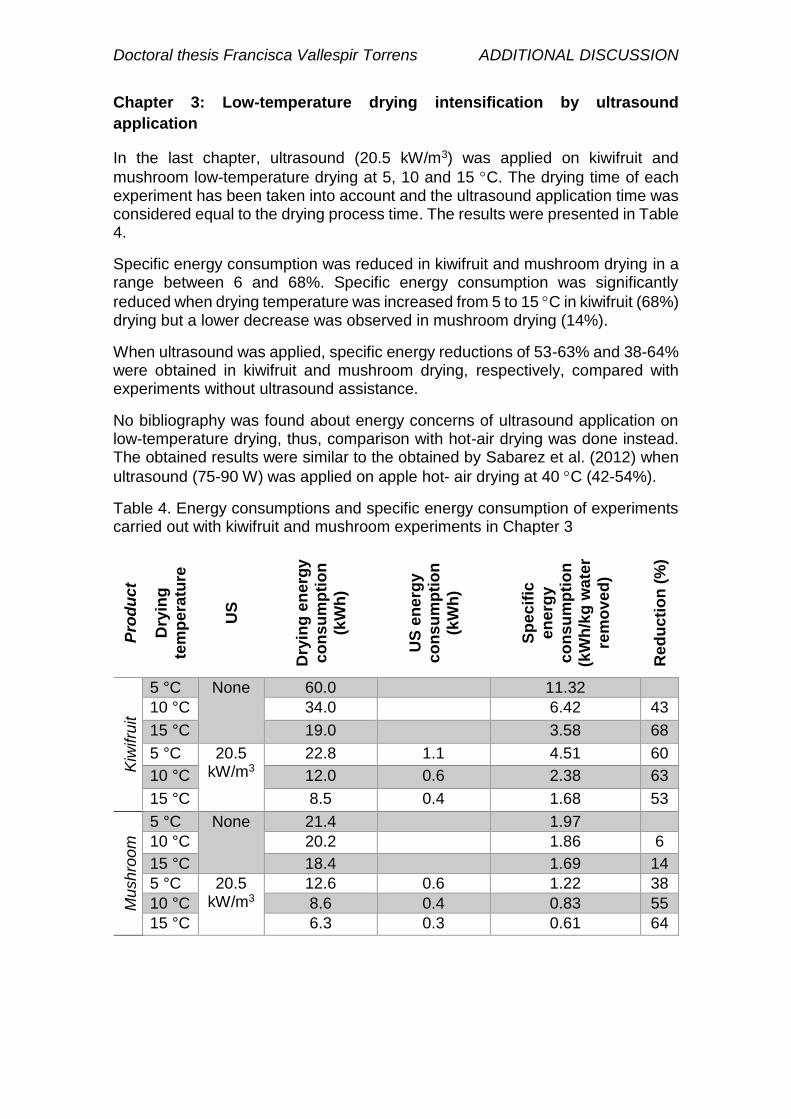
Doctoral thesis Francisca Vallespir Torrens ADDITIONAL DISCUSSION
Chapter 3: Low-temperature drying intensification by ultrasound
application
In the last chapter, ultrasound (20.5 kW/m3) was applied on kiwifruit and
mushroom low-temperature drying at 5, 10 and 15 C. The drying time of each experiment has been taken into account and the ultrasound application time was considered equal to the drying process time. The results were presented in Table 4.
Specific energy consumption was reduced in kiwifruit and mushroom drying in a range between 6 and 68%. Specific energy consumption was significantly
reduced when drying temperature was increased from 5 to 15 C in kiwifruit (68%) drying but a lower decrease was observed in mushroom drying (14%).
When ultrasound was applied, specific energy reductions of 53-63% and 38-64% were obtained in kiwifruit and mushroom drying, respectively, compared with experiments without ultrasound assistance.
No bibliography was found about energy concerns of ultrasound application on low-temperature drying, thus, comparison with hot-air drying was done instead. The obtained results were similar to the obtained by Sabarez et al. (2012) when
ultrasound (75-90 W) was applied on apple hot- air drying at 40 C (42-54%).
Table 4. Energy consumptions and specific energy consumption of experiments carried out with kiwifruit and mushroom experiments in Chapter 3
Pro
du
ct
Dry
ing
tem
pe
ratu
re
US
Dry
ing
en
erg
y
co
nsu
mp
tio
n
(kW
h)
US
en
erg
y
co
nsu
mp
tio
n
(kW
h)
Sp
ec
ific
en
erg
y
co
nsu
mp
tio
n
(kW
h/k
g w
ate
r
rem
ov
ed
)
Red
uc
tio
n (
%)
Kiw
ifru
it
5 °C None 60.0
11.32
10 °C 34.0
6.42 43
15 °C 19.0
3.58 68
5 °C 20.5 kW/m3
22.8 1.1 4.51 60
10 °C 12.0 0.6 2.38 63
15 °C 8.5 0.4 1.68 53
Mu
sh
roo
m
5 °C None 21.4
1.97
10 °C 20.2
1.86 6
15 °C 18.4
1.69 14
5 °C 20.5 kW/m3
12.6 0.6 1.22 38
10 °C 8.6 0.4 0.83 55
15 °C 6.3 0.3 0.61 64
155

Doctoral thesis Francisca Vallespir Torrens ADDITIONAL DISCUSSION
In conclusion, ultrasound application in low-temperature drying of kiwifruit and mushroom presented higher specific energy reductions than freezing pre-treatment and/or ultrasound application in hot-air dying of beetroot, apple and eggplant.
156

Doctoral thesis Francisca Vallespir Torrens ADDITIONAL DISCUSSION
References
Chua, K. J., and Chou, S. K. (2014). Chapter 24 - Recent Advances in Hybrid Drying Technologies. In D.-W. Sun (Ed.), Emerging Technologies for Food Processing (Second Edition) (pp. 447-459). San Diego: Academic Press.
García-Pérez, J. V., Ozuna, C., Ortuño, C., Cárcel, J. A., and Mulet, A. (2011). Modeling ultrasonically assisted convective drying of eggplant. Drying Technology, 29(13), 1499-1509. doi: 10.1080/07373937.2011.576321
Kowalski, S. J., Pawłowski, A., Szadzińska, J., Łechtańska, J., and Stasiak, M. (2016). High power airborne ultrasound assist in combined drying of raspberries. Innovative Food Science & Emerging Technologies, 34, 225-233. doi: 10.1016/j.ifset.2016.02.006
Sabarez, H. T., Gallego-Juárez, J. A., and Riera, E. (2012). Ultrasonic-assisted convective drying of apple slices. Drying Technology, 30(9), 989-997. doi: 10.1080/07373937.2012.677083
Schultz, E. L., Mazzuco, M. M., Machado, R. A. F., Bolzan, A., Quadri, M. B., and Quadri, M. G. N. (2007). Effect of pre-treatments on drying, density and shrinkage of apple slices. Journal of Food Engineering, 78(3), 1103-1110. doi: 10.1016/j.jfoodeng.2005.12.024
Sripinyowanich, J., and Noomhorm, A. (2013). Effects of freezing pretreatment, microwave-assisted vibro-fluidized bed drying and drying temperature on instant rice production and quality. Journal of Food Processing and Preservation, 37(4), 314-324. doi: 10.1111/j.1745-4549.2011.00651.x
Szadzińska, J., Łechtańska, J., Kowalski, S. J., and Stasiak, M. (2017). The effect of high power airborne ultrasound and microwaves on convective drying effectiveness and quality of green pepper. Ultrasonics Sonochemistry, 34(Supplement C), 531-539. doi: 10.1016/j.ultsonch.2016.06.030
Zielinska, M., Sadowski, P., and Błaszczak, W. (2015). Freezing/thawing and microwave-assisted drying of blueberries (Vaccinium corymbosum L.). LWT - Food Science and Technology, 62(1, Part 2), 555-563. doi: 10.1016/j.lwt.2014.08.002
157

Doctoral thesis Francisca Vallespir Torrens ADDITIONAL DISCUSSION
158

CONCLUSIONS
159

Doctoral thesis Francisca Vallespir Torrens CONCLUSIONS
160
Doctoral thesis Francisca Vallespir Torrens CONCLUSIONS
Based on the results obtained in this doctoral thesis, the following conclusions can be stated:
1. Freezing pre-treatment allowed the drying time shortening. However, both microstructure and quality were affected.
1.1. Freezing treatments at −20 C, at −80 C and by liquid nitrogen immersion before hot-air drying of beetroot, apple and eggplant at 40
C enhanced drying process reducing drying time by up to 34% and increasing the effective diffusion coefficient by up to 72%, compared with drying experiments of untreated samples.
1.2. Microstructure, colour, texture, bioactive compounds and antioxidant activity of beetroot, apple and eggplant, before and after drying, were
significantly affected by freezing at −20 C, at −80 C and by liquid nitrogen immersion, compared with those of untreated samples. It seemed that ice crystals growing promoted structure damage.
1.3. Freezing affected differently depending on the porosity of the initial structure of the product. The original microstructure seemed to be more fragile in apple and eggplant but more compact in beetroot. Thus, freezing pre-treatment effects on drying rate, microstructure and quality parameters were more pronounced on medium-high porosity products (apple and eggplant) than on low porosity product (beetroot).
1.4. Freezing pre-treatment rate affected the drying process. Freezing pre-
treatments with a slow-medium freezing rate (at −20 C and at −80 C) had more impact on beetroot and eggplant drying rate, microstructure and quality parameters than freezing pre-treatment by liquid nitrogen immersion, which took place at a very fast rate. This fact could be related to the formation of bigger ice crystals in slow freezing rates than in fast ones.
2. Both freezing pre-treatment and ultrasound application during drying synergistically affected the mass transfer rate but also affected the microstructure, the bioactive compounds contents and the antioxidant activity.
2.1. Freezing pre-treatment at −20 C promoted beetroot hot-air drying at
40 C time shortening by 46% and effective diffusion coefficient increment by 158%, compared with the raw sample, which can be related to sample tissue disorders due to ice crystals growing. Meanwhile ultrasound application at 16.4 and 26.7 kW/m3 reduced drying time by 36 and 43%, respectively, and increased both effective diffusion and external mass transfer coefficients (60-73% and 28-49%, respectively) due to ultrasound mechanical effect. Moreover, when both freezing pre-treatment and ultrasound application at 16.4 and 26.7 kW/m3 were applied, beetroot drying time was also shortened by 55 and 58%, respectively, and both effective diffusion and external mass transfer coefficients were also increased by 204-211% and 28-49%, respectively.
161
Doctoral thesis Francisca Vallespir Torrens CONCLUSIONS
2.2. Although freezing pre-treatment and ultrasound application during drying could be used to increase the mass transfer rate in beetroot, processing affected the microstructure and the bioactive compounds contents and the antioxidant activity, especially when both were applied. Thus, disruptions and fissures were observed when freezing pre-treatment was applied due to ice crystals growing into the product structure and micro-channels were promoted by ultrasound compressions and expansions of the material. Moreover, significant reductions of bioactive compounds contents and antioxidant activity were observed after drying when freezing pre-treatment or/and ultrasound were applied (although betalains contents were preserved when freezing pre-treatment was applied).
3. The drying operation at low-temperature could be intensified by ultrasound application and it could help to preserve quality.
3.1. Ultrasound application at 20.5 kW/m3 during drying of kiwifruit and
mushroom at low-temperature (5, 10 and 15 C) enhanced mass transfer rate, reducing drying time between 41 and 66%, and increasing both the effective diffusion and the external mass transfer coefficients (76-184% and 61-231%, respectively), compared with the corresponding drying process without ultrasound application. Thus, ultrasound compressions and expansions effect enhanced mass transfer process. These effects were lower as the temperature rose in kiwifruit drying but higher in mushroom drying. Consequently, different products presented different behaviours under ultrasound application
at 20.5 kW/m3 during drying at low-temperature (5, 10 and 15 C).
3.2. Low-temperature drying assisted by ultrasound promoted greater microstructure changes. Mushroom microstructure exhibited shrinkage and hollows after drying which were wider as the temperature rose to
15 C and presented also micro-channels when ultrasound was applied during drying due to ultrasound mechanical effect.
3.3. Loss of quality was observed when air drying temperature increased
from 5 to 15 C. In general, quality parameters of kiwifruit and mushroom, such as bioactive compounds contents, antioxidant activity, colour, hydration properties and fat adsorption capacity, were significantly affected by the rise of the drying temperature from 5 to 15
C due to higher thermal degradation of the sample.
3.4. When drying at 5 C, ultrasound application promoted important losses of quality parameters in kiwifruit and mushroom compared with drying
without ultrasound application. However, drying at 15 C with ultrasound application promoted lower kiwifruit and mushroom quality parameters losses compared with drying without ultrasound application, probably due to drying time shortening and consequent thermal and air exposure reduction. Therefore, it could be said that drying intensification was achieved under these conditions because significant drying process enhancement as well as quality parameters retention were observed.
162

RECOMMENDATIONS
163

Doctoral thesis Francisca Vallespir Torrens RECOMMENDATIONS
164
Doctoral thesis Francisca Vallespir Torrens RECOMMENDATIONS
Taking into account the conclusions obtained from this doctoral thesis, the recommendations for future studies are:
➢ Evaluate and quantify the changes in the microstructure, through image analysis, and other quality parameters of a wider range of fruits and vegetables products with high porosity figures and subjected to different low rate freezing pre-treatments and drying with ultrasound application at different power densities in order to better determine the relationship between the initial microstructure and the effects of the combined methods.
➢ Increase/decrease the ultrasound power density applied during low-
temperature drying at temperatures between 10 to 20 C of different fruits and vegetables in order to asses if the mass transfer could be further enhanced preserving the final product quality parameters and also with the aim of observe if the different initial microstructures may be affected differently by the ultrasound application at different temperatures.
➢ Analyse the use of the ultrasound application in intermittent acoustic drying processes at low temperature, evaluating the influence of the process variables on the quality of the final product. The ultrasound effect has been reported to be more important at the first moments of the drying process when the moisture content is high. The high free water content in the material at the beginning of the drying process aids the easy penetration and transmission of ultrasound waves inside the solid. Consequently, the pressure is increased and the cavitation take place. Moreover, further application of ultrasound could result in higher sample degradation which may be avoided by optimizing the ultrasound application period.
➢ Deeply determine the specific energy consumption of the system in order to evaluate more precisely the energy efficiency of the combined methods used and decide the optimal process conditions when applying freezing pre-treatments and/or ultrasound application.
165

Doctoral thesis Francisca Vallespir Torrens RECOMMENDATIONS
166

ANNEX I
Here are presented the co-authors agreement letters.
167

168
169

170
171
172

FORMAT CRITERIA FOR DOCTORAL THESES IN THE UNIVERSITY OF THE ILLES BALEARS Annex 4: Model document of agreement between the co-authors of articles when the thesis is presented as a compendium of publications
Dr Francesco Marra, as co-author of the following articles -Vallespir, F., Cárcel, J. A., Marra, F., Eim, V. S., & Simal, S. (2018). Improvement of mass transfer by freezing pre-treatment and ultrasound application on the convective drying of beetroot (Beta vulgaris L.). Food and Bioprocess Technology, 11(1), 72-83. doi: 10.1007/s11947-017-1999-8 -Francisca Vallespir, Laura Crescenzo, Óscar Rodríguez, Francesco Marra, Susana Simal. Intensification of low-temperature drying of mushroom by means of power ultrasound: effects on drying kinetics and quality parameters. Food and Bioprocess Technology, submitted. I DECLARE: Accepts that Ms Francisca Vallespir Torrens presents the cited articles as the principal author and as a part of her doctoral thesis and that said articles cannot, therefore, form part of any doctoral thesis. And for all intents and purposes, hereby signs this document. Signature Palma de Mallorca, 12 December 2018
173

174
ANNEX II
Contributions to congresses
From the studies of this doctoral thesis, the following contributions to national
and international congresses were carried out:
1. Title: Effect of freezing pre-treatments on drying kinetics and quality
parameters of apple.
Authors: F. Vallespir, V.S. Eim, E. Dalmau, O. Rodriguez, C. Rosselló
Event: ANQUE-ICCE-BIOTEC MADRID2014
Kind of event: Congress
Participation: Poster
Place: Madrid (España)
Date: 1-4 July 2014
Objectives: The aim of this study was to evaluate the effect of different
freezing pre-treatments on the drying kinetics and the quality parameters
of apple (colour change and microstructure).
2. Title: Estudio de la congelación como tratamiento previo al secado
convectivo. Efecto sobre la cinética y calidad de la remolacha.
Authors: F. Vallespir, V. S. Eim, S. Simal, A. Femenia, C. Rosselló
Event: XI Simposio de Investigadores Jóvenes RSEQ- Sigma Aldrich
Kind of event: Symposium
Participation: Poster
Place: Bilbao, Spain
Date: 4-7 November de 2014
Objectives: El objetivo del presente trabajo es evaluar el efecto de las
condiciones de congelación, como tratamiento previo al secado, sobre la
cinética de secado y la calidad final (características de color y
microestructura) de remolacha (var. Beta vulgaris).
3. Title: Efectos de la congelación sobre la cinética de secado y el
contenido en antioxidantes de manzana, remolacha y berenjena.
Authors: F. Vallespir, V. S. Eim, Dalmau E., S. Simal, C. Rosselló
Event: VIII Congreso Español de Ingeniería de Alimentos/ Ciencia y
Tecnología de Alimentos
Kind of event: Congress
Participation: Oral communication
Place: Badajoz, Spain
Date: 7-10 April 2015
Objectives: El objetivo del presente trabajo es analizar el efecto de la
temperatura de congelación en tratamientos previos al secado sobre la
175
cinética, el contenido en polifenoles totales y la capacidad antioxidante
de manzana, remolacha y berenjena.
4. Title: Effects of freezing pretreatment on drying kinetics of apple.
Authors: F. Vallespir, V. S. Eim, C. Rosselló, J. A. Cárcel, A. Femenia,
S. Simal
Event: 5th European Drying Conference (Eurodrying 2015)
Kind of event: Congress
Participation: Poster
Place: Budapest, Hungary
Date: 21-23 October 2015
Objectives: The main aim of this study was to evaluate the effect of the
different freezing pre-treatments on the drying kinetics and the
microstructure of apple.
5. Title: Freezing pre-treatment and ultrasonic enhancement of convective
drying of beetroot: influence on drying kinetics.
Authors: F. Vallespir, F. Comas-Serra, M. A. Frau, J. A. Cárcel, C.
Rosselló
Event: 20th International Drying Symposium (IDS) 2016
Kind of event: Congress
Participation: Poster
Place: Gifu, Japan
Date: 7-10 August 2016
Objectives: To evaluate, by using a diffusion model, the influence of the
freezing pretreatment and the ultrasound application during the
convective drying on the drying curves of beetroot.
6. Title: Influence of freezing pre-treatment and ultrasound assisted
convective drying on quality parameters of beetroot.
Authors: F. Vallespir, V. S. Eim, R. Minjares-Fuentes, C. Garau, S.
Simal
Event: 20th International Drying Symposium (IDS) 2016
Kind of event: Congress
Participation: Poster
Place: Gifu, Japan
Date: 7-10 August 2016
Objectives: Evaluate the effects of both freezing as a treatment before
drying, and convective drying assisted by ultrasound, on the total
polyphenol and betaxanthin contents of beetroot.
7. Title: Freezing pre-treatment application on beetroot and eggplant
drying: quality considerations
176
Authors: F. Vallespir, Ó. Rodríguez, R. González, V. Eim, C. Rosselló
Event: 6th European Drying Conference (Eurodrying 2017)
Kind of event: Congress
Participation: Poster
Place: Lièje, Belgium
Date: 19-21 June 2017
Objectives: Evaluate the effect of the different freezing pre-treatments
on the antioxidant activity and colour of beetroot and eggplant after
drying.
8. Title: Intensification of beetroot and eggplant convective drying by
freezing pre-treatments
Authors: F. Vallespir, Ó. Rodríguez, J. Cárcel, A. Femenia, S. Simal
Event: 6th European Drying Conference (Eurodrying 2017)
Kind of event: Congress
Participation: Oral Communication
Place: Lièje, Belgium
Date: 19-21 June 2017
Objectives: Evaluate the effect of the different freezing pre-treatments
on the drying kinetics of beetroot and eggplant.
9. Title: Intensification of low-temperature drying of mushrooms by means
of power ultrasound.
Authors: F. Vallespir, C. Reche, L. Crescenzo, F. Marra, C. Rossello
Event: 21th International Drying Symposium (IDS) 2018
Kind of event: Congress
Participation: Poster
Place: Valencia, Spain
Date: 11-14 September 2018
Objectives: The effect of the drying temperature (5, 10 and 15 °C) and
the application of ultrasound (20.5 kW/m3) on the drying kinetics (at 1 m/s
of air velocity) and the functional properties such as swelling (SW), water
retention capacity (WRC) and fat adsorption capacity (FAC) of button
mushrooms have been studied.
10. Title: Efecto de los ultrasonidos sobre el secado a baja temperatura y la
microestructura de kiwi.
Authors: F. Vallespir, C. Reche, C. Garau, C. Ratti, C. Rossello
Event: X Congreso Español de Ingeniería de Alimentos/ Ciencia y
Tecnología de Alimentos
Kind of event: Congress
Participation: Poster
Place: León, Spain
177

Date: 15-17 May 2019
Objectives: El objetivo del estudio ha sido evaluar el efecto de los
ultrasonidos de potencia sobre secado a baja temperatura de kiwi. Para
alcanzar dicho objetivo, se ha determinado el tiempo de secado hasta
una pérdida de peso del 80 %, a 5, 10 y 15 C, sin y con asistencia de
ultrasonidos (a 20.5 kW/m3) y se ha evaluado la microestructura del kiwi
después del secado.
178