doing more with less transforming business …/media/accenture/conversion... · transforming...
TRANSCRIPT
28 harvarddeustobusinessreview
Mark O. GeorgeSenior Executive, Operations Consulting, Accenture Process and Innovation Performance service line and author of The Lean Six Sigma Guide to Doing More with Less.
Transforming Business Performance through Execution Excellence
Achieving operational excellence is more critical than ever, as companies come under increasing pressure to enhance their efficiency and extract more value from the same or even scarcer resources. Erosion of operating margins, reduced return on investment and the dwindling of traditional sources of growth are all focusing executives’ attention on their companies’ operations.
Doing More with Less

TrAnSfOrmIng BuSInESS PErfOrmAnCE ThrOugh ExECuTIOn ExCEllEnCE
january2011 29
A chieving operational excellence is more critical than ever, as companies come under increasing
pressure to enhance their efficiency and extract more value from the same or even scarcer resources. Ero-sion of operating margins, reduced return on invest-ment and the dwindling of traditional sources of growth are all focusing executives’ attention on their companies’ operations. Through operational excel-lence, companies not only trim costs, they also improve financial performance in significant and measurable terms as well as adapt swiftly and appropriately to changes in their business landscape.
But the ultimate power of operational excellence is that it enables enterprises to sustain performance no matter what’s going on in the larger economy. Indeed, Accenture studies of past economic crises find that when recessions end, the companies that lead their competitive set are those that have regularly applied practices associated with operational excellence.
Execution excellence: The engine of operational excellence Current economic woes, demanding customers and in-tensifying competition have increased the premium on superior execution. While we expect global economies to emerge from the recent downturn, we will likely see a period of even greater volatility as the economic pic-ture continues to brighten. The growing strength of emerging markets, shifting consumer expectations and geo-political events will bring more uncertainty tomor-row than what businesses are experiencing today.
Perhaps not surprisingly, execution excellence is con-sistently identified as a priority by C-level decision mak-ers who understand that putting their company’s strat-egy into action can differentiate their business from ri-vals and create a sustainable competitive advantage. The Conference Board’s 2010 report on CEOs’ top 10 chal-lenges bears this out. In the report’s list of challenges constituting surveyed executives’ greatest concern in the coming year, excellence in execution occupies first place. Other leading challenges reported are consistent execu-tion of strategy by top management, organizational speed, flexibility and adaptability to change.
To some, execution excellence may sound similar to continuous improvement (CI)—but it’s much more. Most major companies currently have CI programs in place. However, as the Conference Board survey re-veals, CEOs are still worried about execution, speed, and agility—the very things that continuous improve-ment programs are supposed to address. Why the dis-
connection? Most CI programs are too tactical, too fo-cused on one set of process-improvement tools and not designed to work from the top down. (Think about it: mechanistically applying just one set of tools to a per-formance-enhancement effort is like preparing for a team pentathlon by training in only one of the five dis-ciplines that will be featured in the race.) And while CI tools are valuable, too many companies don’t use them correctly—and thus don’t get the business results promised by the tool. (See Figure 1.)
Companies demonstrating execution excellence take a far more holistic, end-to-end approach from those re-lying on CI; their approach is outcome focused and not exclusively characterized by the simple dissemination of tactical tools and training. They start by clarifying their business strategy. They then identify what’s need-ed operationally to execute the strategy. They also pin-point operations that are hindering strategy execution. Finally, they construct a plan for carrying out strategy-critical operations and removing roadblocks, drawing on the appropriate tools and methodologies—and us-ing them correctly.
To build execution excellence, companies must ac-tivate five “enablers”:
• Focus—targeting and prioritizing actions to gener-ate rapid payback, so the effort pays for itself and
Spotlight on Lean Six Sigma
lean Six Sigma (lSS) is a performance discipline that has built a proven track record since it was developed in the late 1990s. It combines two of the most powerful performance-improvement engines: Lean, which offers mechanisms to quickly and dramatically reduce time and waste in any process anywhere in the organiza-tion, and Six Sigma, which provides the organizational tools and guidelines for laying data-based foundations for an improvement geared to key customer-related objectives. many organizations have used lSS in their continuous improvement efforts, but many have made mistakes in the design and launch of the program. for example, they often place about 80 percent of their ef-fort and investment in training resources on the use of tactical tools. Yet they pay little attention to the develop-ment of an enterprise portfolio of high-value projects and even less attention to change management. Conse-quently, they do not achieve the fast, considerable and sustainable performance improvements promised by this methodology.
Figure 1

TrAnSfOrmIng BuSInESS PErfOrmAnCE ThrOugh ExECuTIOn ExCEllEnCE
30 harvarddeustobusinessreview
contributes long-term to the company’s bottom line.
• Simplicity—identifying ways to reduce the adverse impacts of complexity on profitable growth.
• Speed—creating customer value through accelerat-ed, agile and waste-free processes across the enter-prise; responding swiftly and flexibly to changes in the business environment, market demand and cus-tomer preferences.
• Discipline—sustaining momentum and direction through a sound performance management system, while establishing repeatable, reproducible process-es that deliver certainty of outcomes and no varia-tion.
• Journey—understanding that achieving execution excellence is a process, not a single step, and map-ping out the required route, including knowing where the company is starting from, how far it wants to go, and what the organizations’ objectives are. This enabler serves as a foundation for the other four enablers. (See Figure 2.)
FocusWe define focus as identification of the operational improvements required to achieve execution excellence, the trans-lation of these projects into a financial business case and the leveraging of core analytics to quantify each project’s im-pact on the company’s performance and bottom line. Focus is critical for driving faster and higher-impact results as well as maintaining enthusiasm and mo-mentum for change. It can also help companies surmount challenges en-countered during its execution excel-lence journey. One of the most daunt-ing of these challenges takes the form of pressure to show financial benefits early on. Many companies fail to create a clear business case for the transforma-tion effort, so commitment wavers if benefits are slow to materialize or if, when they do materialize, they’re less than what everyone expected. Confu-sion and wastage of resources can also occur if people throughout the organi-zation are working on a lot of projects in parallel without a clear sense of which projects are most important to execution.
Enterprises that excel at focus apply four steps:
1. Identify value drivers and projects to leverage them. Value drivers are key value streams that contribute to growth, return on invested capital and operating margin. Develop value driver trees to correlate val-ue creation or destruction to process and execution gaps and improvement opportunities. Identify proj-ects that will leverage and optimize the value driv-ers. Develop realistic estimates of the value that each initiative might produce. The active and continual engagement of senior leadership in this stage is vi-tal to ensure that the resulting project portfolio di-rectly supports business strategy.
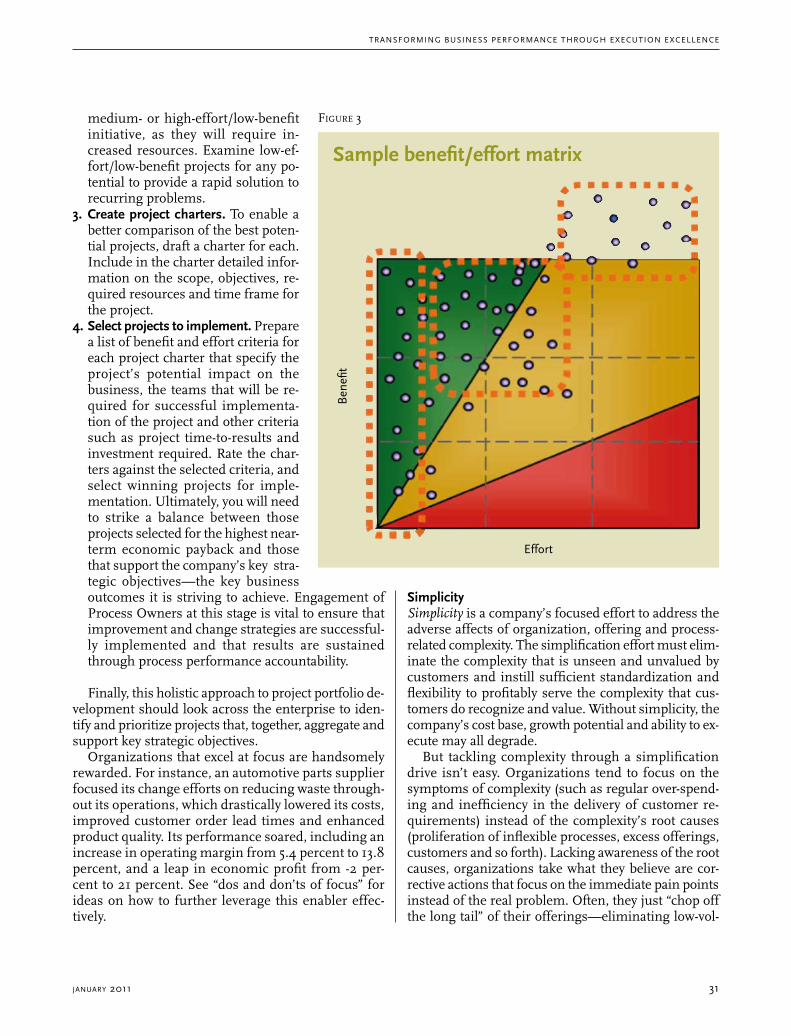
2. Narrow down the project list. Subject each project in the list to a benefit/effort analysis, where benefit is defined as the savings or other valuable impacts the project would deliver, and effort is defined as the time needed to implement the project. Depict the results in a matrix. (See Figure 3.) Give top priority to low-effort/high-benefit projects. Use caution with
The five enablers of execution excellence
Figure 2
Simplicity
Discipline
focus SpeedExecution Excellence
Journey
Journey
Journey
Journey
TrAnSfOrmIng BuSInESS PErfOrmAnCE ThrOugh ExECuTIOn ExCEllEnCE
january2011 31
medium- or high-effort/low-benefit initiative, as they will require in-creased resources. Examine low-ef-fort/low-benefit projects for any po-tential to provide a rapid solution to recurring problems.
3. Create project charters. To enable a better comparison of the best poten-tial projects, draft a charter for each. Include in the charter detailed infor-mation on the scope, objectives, re-quired resources and time frame for the project.
4. Select projects to implement. Prepare a list of benefit and effort criteria for each project charter that specify the project’s potential impact on the business, the teams that will be re-quired for successful implementa-tion of the project and other criteria such as project time-to-results and investment required. Rate the char-ters against the selected criteria, and select winning projects for imple-mentation. Ultimately, you will need to strike a balance between those projects selected for the highest near-term economic payback and those that support the company’s key stra-tegic objectives—the key business outcomes it is striving to achieve. Engagement of Process Owners at this stage is vital to ensure that improvement and change strategies are successful-ly implemented and that results are sustained through process performance accountability.
Finally, this holistic approach to project portfolio de-velopment should look across the enterprise to iden-tify and prioritize projects that, together, aggregate and support key strategic objectives.
Organizations that excel at focus are handsomely rewarded. For instance, an automotive parts supplier focused its change efforts on reducing waste through-out its operations, which drastically lowered its costs, improved customer order lead times and enhanced product quality. Its performance soared, including an increase in operating margin from 5.4 percent to 13.8 percent, and a leap in economic profit from -2 per-cent to 21 percent. See “dos and don’ts of focus” for ideas on how to further leverage this enabler effec-tively.
SimplicitySimplicity is a company’s focused effort to address the adverse affects of organization, offering and process-related complexity. The simplification effort must elim-inate the complexity that is unseen and unvalued by customers and instill sufficient standardization and flexibility to profitably serve the complexity that cus-tomers do recognize and value. Without simplicity, the company’s cost base, growth potential and ability to ex-ecute may all degrade.
But tackling complexity through a simplification drive isn’t easy. Organizations tend to focus on the symptoms of complexity (such as regular over-spend-ing and inefficiency in the delivery of customer re-quirements) instead of the complexity’s root causes (proliferation of inflexible processes, excess offerings, customers and so forth). Lacking awareness of the root causes, organizations take what they believe are cor-rective actions that focus on the immediate pain points instead of the real problem. Often, they just “chop off the long tail” of their offerings—eliminating low-vol-
Sample benefit/effort matrix
Figure 3
Ben
efit
Effort

TrAnSfOrmIng BuSInESS PErfOrmAnCE ThrOugh ExECuTIOn ExCEllEnCE
32 harvarddeustobusinessreview
ume products and services. But this typically yields sub-optimal and temporary results, and the symptoms of complexity either reemerge or crop up again in an-other part of the business.
The high cost typically associated with low-volume offerings often stems from complexity “hot spots”—points in the stream where problems (such as inflex-ibility, capacity limitations, long cycle times, defects and rework) recur. Organizations must understand not only where hot spots are destroying value but al-so what kinds of complexity customers are willing to pay for—and then be able to deliver it profitably.
Ultimately the organization must understand the effect that introducing additional products or services will have on each point in the stream. At every place along the stream, how would supporting the newly added offering affect the organization’s agility and pro-cess flexibility? (See Figure 5.)
A key to battling the effects of complexity is to iden-tify and quantify its costs throughout the organization and then design simplification initiatives that produce the most profitable improvements. “Dos and don’ts of simplicity” provides additional ideas for leveraging this execution excellence enabler.
Organizations that achieve simplicity can eliminate duplication, rework and low-value activities; clarify de-cision-making authority; standardize and harmonize processes; streamline the product and service portfo-
lio; serve customers more efficiently; and achieve sus-tainable cost reductions. To illustrate, a computer hard-ware manufacturer eliminated an estimated US$10.3 million in margin-leak by standardizing its buy-sell sub-processes. It also improved working capital by about US$16 million by improving invoicing process-es in its logistics and original design manufacturing operations.
SpeedWe define speed as the acceleration of end-to-end pro-cess cycle times across the enterprise to drive rapid execution of strategy. Speed and agility at the enter-prise level enable organizations to achieve true, de-fensible competitive advantage through step-change reductions in operating cost, increased returns on invested capital and revenue growth by means of market responsiveness and higher customer service levels.
While few can argue about the benefits of a fast and agile enterprise, it’s the rare organization that truly ev-er achieves it. Why? The causes of slow and cumber-some processes are seldom understood. An under-standing of enterprise speed requires not only a pro-cess perspective but also a comprehension of workflow management and scheduling, the impacts of the offer-ings served by processes and the adverse effects of vari-ability.
Figure 4
Dos and don’ts of focus
Dos
• Do look for projects that can help you score early successes that will keep people in the organization committed to the execution excellence journey.
• Do translate each project’s estimated value into the tangible financial metrics that matter most to the organization—such as economic value added, income before tax, capital invested, operating costs and revenue.
• Do consider a project’s potential to positively affect speed, quality and cost in the organization.
• Do identify, align and sequence projects that together support key strategic objectives.
Don’ts
• Don’t forget to consider projects related to the organization’s operating model (the what, where, and who of operations) in addition to its executional capabilities (the how).
• Don’t neglect to consider how a project would address specific customer priorities.
• Don’t waste time considering projects you’ve deemed low-benefit or that require too much effort to make the benefits worthwhile.
• Don’t fail to actively engage senior leadership and process owners throughout the development and on-going management of the project portfolio.

TrAnSfOrmIng BuSInESS PErfOrmAnCE ThrOugh ExECuTIOn ExCEllEnCE
january2011 33
To begin to understand enterprise speed, let’s begin with a simple yet powerful metric, Process Cycle Effi-ciency (PCE).
Process Cycle Efficiency =
Customer Value Add Time = __________________________
Total Cycle Time
PCE is a measure of how efficiently a process uti-lizes the organization’s capital to create customer val-ue. Those processes with a high PCE percentage will deliver outputs to customers (in terms of goods or ser-vices) with a minimum amount of waste. Conversely, processes with low PCE are fraught with waste that in no way adds customer-perceived value to delivered outputs. There are eight activities commonly referred to as process waste. These include transportation or conveyance (usually internal), inspection, excess mo-tion, waiting time, over-processing, over production, defects and ineffective use of capital (human and fi-nancial).
To mitigate these manifestations of process waste, organizations can implement an array of continuous improvement tools such as those of the Lean Six Sig-ma toolset. These tools improve process flow and the work environment, reduce waiting or queue time, im-prove equipment availability and eliminate defects, rework, hand-offs and so on. Note that creating waste not only consumes resources, it also consumes time. Hence, improving PCE goes a long way toward simul-taneously improving process quality, cost and speed.
Is a focus on PCE and the related waste elimination enough to enable enterprise speed? After all, don’t waiting or queue time constitute primary forms of waste? Waiting time indeed should be reduced as much as possible. But improving waiting time at the local pro-cess level usually provides only incremental, gradual benefit. It is speed and agility at the enterprise level—across multiple functions and value streams—that con-fers true competitive advantage. To better understand how this works, let’s go beyond PCE, the metric of waste, and discuss some other determinants of enter-prise speed. The first and foremost of these is Little’s Law, first postulated by Dr. John Little of MIT in 1961.
Figure 5
Searching for complexity “hot spots”
Complexity Value Stream mapping: Identifiying complexity hot spots at the intersections of Offerings and Processes
Rework loop
Áreas of operating complexity and/ or process inefficiency
Cust. Svc.
Planning
Purch. Supplier Mat. Mgmt.QA / QS
Mfg.
Ship
Logistics
Planning: adjustments and modifications returns: expensive and inefficient
Capacity limitations
QA process is long
Sample QA requests pulling
product

TrAnSfOrmIng BuSInESS PErfOrmAnCE ThrOugh ExECuTIOn ExCEllEnCE
34 harvarddeustobusinessreview
Like PCE, Little’s Law is elegantly simple but equal-ly powerful in determining enterprise speed.
Little’s Law
Lead Time =
The number of items in Process= ___________________________________
Completion Rate
Little’s Law indicates that the lead time of any pro-cess—how long the next outcome of the process (such as production of an order or delivery or a service) will have to wait to be produced—depends on the ratio of the number of “items” or “work” in process (WIP) to the completion rate per item for that process. For ex-ample, if you have 90 orders in a process that has the capability to complete 12 orders per hour, process lead time (PLT) is 7.5 hours:
PLT is a key enabler of enterprise speed. And Lit-tle’s Law makes it clear that PLT is determined not only by how quickly work is performed at the task lev-el (completion rate) but also by the amount of work introduced to processes. Adding work (a common managerial move when greater output is required) only increases PLT—forcing stakeholders of the pro-
cess (such as customers) to wait longer. Reducing WIP is actually the simplest way to improve PLT. Companies can gain further speed by accelerating their process completion rates; for example, through use of Lean Six Sigma continuous improvement tools as stated earlier.
Little’s Law reveals the need to link process capabil-ity directly to work scheduling and planning—wheth-er in manufacturing or in services. This means that true enterprise speed can only be achieved when the operating metrics, targets and incentives across dispa-rate functions (those related to execution and those re-lated to planning and scheduling) are all aligned to-ward driving speed. Managers must establish metrics, dashboards and leading indicators of process capabil-ity. Equally important, they must understand total de-mand (number of “items” in process) at any given time and the amount of work being introduced into their company’s processes. Only by understanding and monitoring all these aspects of Little’s Law can man-agers determine how best to increase their enterprise’s speed.
A third key determinant of enterprise speed is pro-cess stability. Yet this concept has been overlooked by some who have embraced only the traditional Lean toolset (and strayed from Six Sigma’s rigor, which ad-dresses variation reduction). As we shall see, process variation can exponentially increase completion rates and thus degrade enterprise speed and agility. Our ex-
Figure 6
Dos and don’ts of simplicity
Dos
• Do take a holistic view of complexity in your organization, instead of focusing simplification efforts on just the weakest segments in your business.
• Do focus corrective actions on the root causes of the complexity in your organization—not on the company’s immediate pain points.
• Do identify, quantify and prioritize specific simplification initiatives to optimize operations and achieve the highest levels of future economic profit.
Don’ts
• Don’t focus on isolated issues if simplification efforts in your organization lack enterprise-wide sponsorship. You’ll only end up solving short-term problems that eventually translate into a new issue somewhere else in your business or reemerge as a similar problem.
• Don’t fail to understand which forms of complexity customers are willing to pay for and fail to eliminate hidden complexity.
• Don’t mistake symptoms of complexity (such as delays, quality problems and increased costs) for root causes of complexity.

TrAnSfOrmIng BuSInESS PErfOrmAnCE ThrOugh ExECuTIOn ExCEllEnCE
january2011 35
perience has shown that, by contrast, process stability can greatly improve completion time. (See Figure 7.)
Processes that have sufficient reserve capacity are not greatly affected by their degree of variability in terms of its effects on completion time. However, as processes are pushed to their upper limits of utiliza-tion, the impact on completion time can become great if the process exhibits even moderate degrees of varia-tion. As processes with variation are tasked with more work, they experience an exponential increase in com-pletion time for every 1 percent of utilization con-sumed. In today’s increasingly competitive landscape, businesses around the globe are trying to do more with less—reducing headcount and capital expenditure, and tasking remaining resources with higher degrees of expected utilization. Such actions erode customer sat-isfaction – especially when organizations don’t address process stability and its root causes while reducing op-erating budgets.
The fourth key determinant of enterprise speed is complexity, especially in the breadth and varying attri-butes of an organization’s products and services. Of-fering standardization, platform design and standard work are common approaches to neutralizing the ad-
verse effects of complexity. As the offering portfolio ex-pands, processes and resources must be able to flexi-bly serve the attributes unique to each product or ser-vice. Most organizations have few dedicated channels that serve only one offering or customer group. But proliferation of offerings and transaction types re-quires resources and equipment to literally switch or changeover from executing one type of task to another. Whether in a product or service environment, change-overs are disruptive, time consuming and often costly. To negate the cost of complexity and impact on enter-prise speed, organizations, at a minimum, must im-prove process flexibility at the same rate they increase complexity.
“Dos and don’ts of speed” summarizes tips for gain-ing these and other related benefits from this execu-tion excellence enabler.
DisciplineDiscipline is the ability to drive accountability for actions and behaviors across an organization. Discipline man-ifests itself as an effective performance management (PM) system. Performance management is the process of deploying strategic goals in a top-down approach
The price of process variability
Figure 7
60% 70% 80% 90% 100%
Percent utilization
Proc
ess
Com
plet
ion
Tim
e
Process Variabilityhighmoderatelow
40
35
30
25
20
15
10
5
0

TrAnSfOrmIng BuSInESS PErfOrmAnCE ThrOugh ExECuTIOn ExCEllEnCE
36 harvarddeustobusinessreview
Figure 9
Performance management questions for executives
Vision & Strategy
Operating Future State
Operating Model
Blueprint
What do we aspire to be (3-5+ years)?• how will we achieve that purpose?• What goals do we set for success? What is the timing?• how will we compete, grow and differentiate ourselves?
How must we operate to execute our strategy and achieve our business objectives?• What principles will guide the change in operating model?• What factors must be present for each capability to execute?
What functional capabilities will be needed for execution?• What will the process implications be?• What individual capabilities will be needed - culture, skills, structure,
behaviors, and performance measures?
through an organization to link goals and effect behav-ior toward corrective actions when the current state and the goal state are not in alignment. A performance man-agement system is the infrastructure by which strategic goals are deployed and needed action is taken.
A PM system compromises performance metrics, tar-gets, review cycles and corrective actions. To build a PM system, executives must ask a series of questions related to their organization’s vision and strategy, operating fu-ture state and operating model blueprint. (See Figure 9.)
Figure 8
Dos and don’ts of speed
Dos
• Do adopt Process Cycle Efficiency (PCE) as a primary metric of process performance.
• Do know total demand (number of “items” in process) at any given time, and continuously monitor your company’s process capabilities and completion rates, as well as the amount of work being introduced into your processes at any given moment.
• Do place rigor around measuring process utilization / capacity and stability. understand the root causes of critical process variability, and take steps to mitigate and continually control them.
• Do make conscious, organized efforts to increase process flexibility at least at the same rate complexity is being increased
Don’ts
• Don’t expect the elimination of waste alone to make substantive improvements in speed across the enterprise.
• Don’t neglect to craft and communicate a compelling vision of how greater speed will benefit everyone in the organization (such as making jobs easier or less frustrating)—as well as enhance the overall performance of the organization itself. You’ll win stakeholders’ buy-in for speed-related change initiatives.
• Don’t try to speed up execution merely by adding more work into the pipeline—you’ll only increase process lead time by increasing work in process.

TrAnSfOrmIng BuSInESS PErfOrmAnCE ThrOugh ExECuTIOn ExCEllEnCE
january2011 37
Figure 10
From undisciplined to disciplinedThe goal of discipline is to go from this...
To this...
Communication Ceiling
Overall review, Assessment and redirection
Strategic Planning, Direction and review
Overall review, Assessment and redirection
reporting, long Term Actions
new Projects Creation, reporting, mediate Term
Actions
Project results and Immediate Corrective
Actions
Project Execution
Project Creation and management
Translation of Strategic Plan into Operational goals
Strategic Planning, Direction and review
CEO and
Senior Staff
CEO and
Senior Staff
Executive management Sr VPs
Executive management Sr VPs
Jr VPs and Directors
Jr VPs and Directors
front line management
front line management
Staff Associates and Employees
Staff Associates and Employees
real Time Information and Ideas filtered from Sr leaders
goal Alignment
Issues

TrAnSfOrmIng BuSInESS PErfOrmAnCE ThrOugh ExECuTIOn ExCEllEnCE
38 harvarddeustobusinessreview
Perhaps the biggest challenge to achieving disci-pline through an effective PM system is that holding people accountable is difficult for most managers. We human beings have an innate desire to be liked. Hold-ing people accountable for their performance can make some managers feel that they’re acting like disciplinar-ians—hardly a likeable quality. Moreover, it’s hard to enforce discipline in an organization unless the enter-prise is facing dire straits. In tough circumstances, ev-eryone understands that an easygoing style is not ac-ceptable. During boom times, when the economy and markets are thriving, there is little impetus for man-agers to establish discipline and to demand better-than-ever performance.
To complicate things even further, many vice presi-dents reporting to the C-suite “filter” information about their units’ performance when communicating with the CEO, COO and CFO. This “communication ceil-ing” hampers efforts to establish discipline and ac-countability, as review of the organization’s overall per-formance and strategic planning remain cloistered within the C-suite. The goal of discipline is to remove that ceiling, get information (about projects initiated and results obtained) flowing from the bottom of the organization to the top, and get strategic direction, op-erational goals and project execution efforts commu-nicated from the top to the bottom. (See Figure 10.)
As an added boon of discipline, business operations become repeatable and reproducible, and their out-comes become certain.
To achieve discipline, an organization needs to es-tablish an infrastructure of cascading performance
metrics and feedback reviews from those who are for-mulating the company’s strategy down to every em-ployee in the organization. Executives, managers and team leaders all play critical roles in establishing and using this infrastructure.
When companies establish discipline by implement-ing a robust performance management system, results show up across the P&L statement. For example, rev-enue increases as the company’s innovation and new product development efforts produce offerings that are needed by the market and that support the company’s strategy. Cost and process cycle time decrease as prog-ress against these goals is measured daily, weekly and monthly. “Dos and don’ts of discipline” shows addi-tional recommendations for using this execution ex-cellence enabler.
JourneyWe define journey as a coordinated set of strategies, methods, approaches, tools, capabilities, practices and actions uniquely tailored to transform a company from its current state of executional performance and ma-turity toward true excellence—while delivering tangi-ble business benefits, a positive change in culture and defensible competitive advantage.
An organization’s execution excellence journey com-prises the following steps:
1. Diagnose current executional capabilities. Managers assess four key elements of execution, looking for gaps between what’s needed and where the compa-ny is already excelling. The four elements are people
Figure 11
Dos and don’ts of discipline
Dos
• Do clearly communicate expectations about performance.
• Do regularly measure actual performance against targets.
• Do ensure that short- and long-term goals are translated into measures and targets that support the company’s strategy.
Don’ts
• Don’t avoid holding people accountable for supporting the company’s strategy just because you worry that they won’t like you anymore.
• Don’t assume that discipline is needed only during tough times; it’s just as vital when things are going well.
• Don’t assume that business unit performance is being fully and accurately communicated to the C-suite.
TrAnSfOrmIng BuSInESS PErfOrmAnCE ThrOugh ExECuTIOn ExCEllEnCE
january2011 39
Figure 12
Determining execution readiness
Results Engine
Project Identification and Selection Process
Project Portfolio management
Project reviews
financial guidelines to track projects
use of Tool sets
Culture Process
People
roles and responsibilities
Job Descriptions and Career Path
reward and recognition
Team Development
leadership
Top Down Commitment
Engaged management
rigor and discipline to sustain gains
Communication and “Walk the Talk”
Infrastructure
Strategic Alignment to other initiatives
Engaged Project Sponsors & Process Owners
Deployment strategy & implementation
requires design, implementation and monitoring leverage, revise and monitor link and monitor
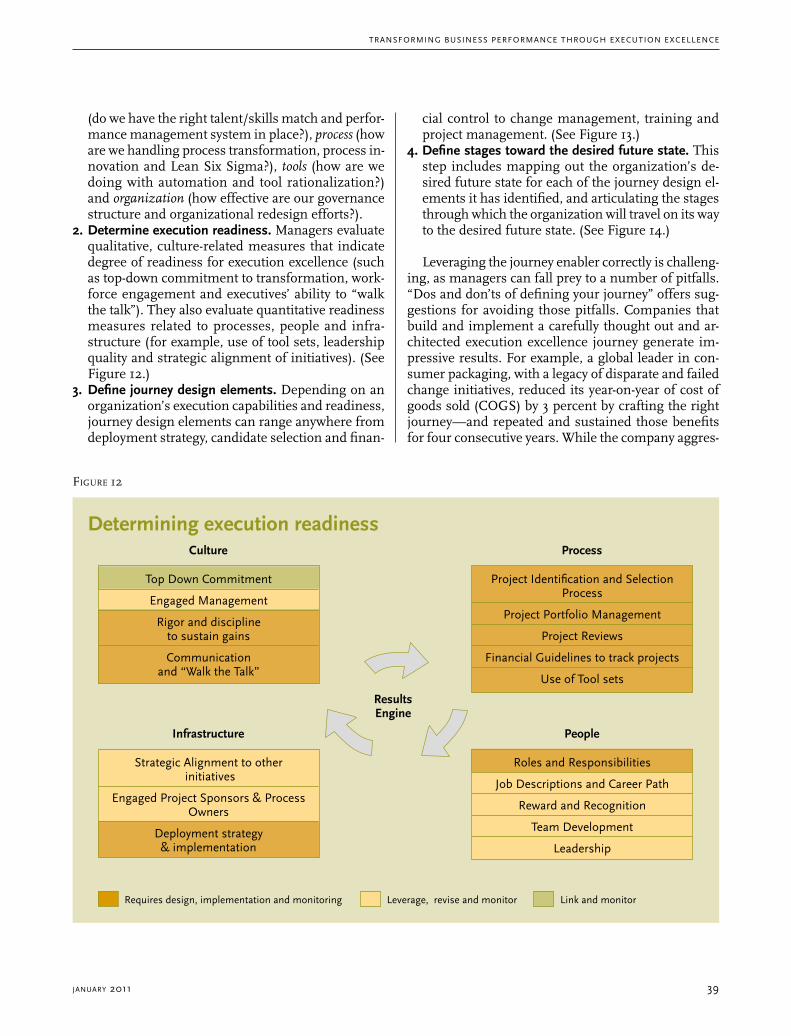
(do we have the right talent/skills match and perfor-mance management system in place?), process (how are we handling process transformation, process in-novation and Lean Six Sigma?), tools (how are we doing with automation and tool rationalization?) and organization (how effective are our governance structure and organizational redesign efforts?).
2. Determine execution readiness. Managers evaluate qualitative, culture-related measures that indicate degree of readiness for execution excellence (such as top-down commitment to transformation, work-force engagement and executives’ ability to “walk the talk”). They also evaluate quantitative readiness measures related to processes, people and infra-structure (for example, use of tool sets, leadership quality and strategic alignment of initiatives). (See Figure 12.)
3. Define journey design elements. Depending on an organization’s execution capabilities and readiness, journey design elements can range anywhere from deployment strategy, candidate selection and finan-
cial control to change management, training and project management. (See Figure 13.)
4. Define stages toward the desired future state. This step includes mapping out the organization’s de-sired future state for each of the journey design el-ements it has identified, and articulating the stages through which the organization will travel on its way to the desired future state. (See Figure 14.)
Leveraging the journey enabler correctly is challeng-ing, as managers can fall prey to a number of pitfalls. “Dos and don’ts of defining your journey” offers sug-gestions for avoiding those pitfalls. Companies that build and implement a carefully thought out and ar-chitected execution excellence journey generate im-pressive results. For example, a global leader in con-sumer packaging, with a legacy of disparate and failed change initiatives, reduced its year-on-year of cost of goods sold (COGS) by 3 percent by crafting the right journey—and repeated and sustained those benefits for four consecutive years. While the company aggres-

TrAnSfOrmIng BuSInESS PErfOrmAnCE ThrOugh ExECuTIOn ExCEllEnCE
40 harvarddeustobusinessreview
sively set out to simultaneously reconfigure thousands of processes around the globe and strengthen its inter-nal capabilities, the initiative was cost-neutral in less than one year.
Execution excellence: A case in pointAn automotive parts supplier we worked with provides a useful case study of a company that leveraged the ex-ecution excellence enablers and achieved remarkable results.1 The company, which supplies hoses and fit-tings to the automotive industry, was barely profitable, generating a negative 2 percent economic profit. Cus-tomer order lead time was 14 days; the industry aver-age, 7 days. Quality was also a problem; the company frequently shipped defective brake and steering parts to its primary customers.
Executives embarked on a carefully architected transformation journey that unfolded over several years. Top management defined the overall focus of the journey as enterprise speed—which the organiza-tion sought to improve by reducing waste across and between functional units. The goal? Lower costs, im-prove process cycle efficiency and sharpen the compa-ny’s competitive edge.
Simplicity played a key role in this drive to increase speed. One of the company’s clients was a leading manufacturer of heavy-duty trucks. Unlike other cus-tomers, the truck manufacturer created a high prolif-eration of end items (mostly low-volume runners) re-quired for its wide variety of vehicle models. Through complexity analytics, the parts supplier discovered that the major culprit behind long manufacturing lead times was the imperative to provide the vast number of part numbers for the truck customer. Management decided to drop the truck company as a client. This move eliminated the related complexity and enabled the company to focus on its remaining clients—those with higher volumes and fewer part numbers.
By eliminating complexity, the company could also concentrate on reducing the number of defective brake and steering components shipped to clients. Execu-tives established discipline around quality by commit-ting the organization to delivering reliably on what cus-tomers cared about most and to ensuring certainty of outcome of manufacturing processes. It launched an all-out assault on quality-control processes, prioritiz-ing project identification and selection around defect prevention (which demonstrated focus on the project-management level).
1 Adapted from mark O. george, The Lean Six Sigma Guide to Doing More with Less: Cut Costs, Reduce Waste, and Lower Your Overhead (John Wiley & Sons, 2010, pp. 1-5).
Figure 13
Examples of journey design elements
• Deployment Strategy– Business Case.– lean Six Sigma goals and Objectives.– Key deployment metrics.– lean Six Sigma roles & responsibilities.– Deployment infrastructure (number of
Champions, Black Belts, Kaizen leaders, green Belts, etc.).
– Overall training calendar creation.– Customer and supplier integration strategy.– linkages to other organizational initiatives– Project Selection method and Portfolio
Development.
• Candidate Selection and Retention– Compensation.– Selection guidelines and Processes.– rewards & recognition strategy.– Job descriptions.
• Financial Control– Individual project financial objectives.– Benefit calculation guidelines.– Benefit tracking strategy (Web based tool or other).– Project financial auditing practices.
• Change Management and Communications– Communication plan development.– feedback process.– Project replication and Best Practice Sharing.
• Training Coordination and Support– Training event management and logistics.– Coordinate executive participation in training
events.– Certification criteria and certification evaluation
process for mBB, BB, Kaizen leaders and gB.
• Project Management and Deployment Tracking– hardware/Software requirements.

TrAnSfOrmIng BuSInESS PErfOrmAnCE ThrOugh ExECuTIOn ExCEllEnCE
january2011 41
With product quality under control, the company fo-cused again on speed as well as flexibility. It initiated a series of operations assessments that identified the cause of long process lead times and developed a mit-igation plan that included the synchronized deploy-ment of Lean tools (such as 5S, work cells, process flow improvement, setup reduction and eventually pull sys-tems).
This holistic approach—combining complexity re-duction, quality improvement and elimination of process waste—delivered remarkable results. For ex-
ample, in less than two years, profit margins dou-bled, COGS plummeted as lead times dropped and manufacturing cycle time went from 14 days on av-erage to just 2 days. Indeed, once cycle time was 50 percent less than the lead time demanded by custom-ers, the company could close a large warehouse and quality containment facility. These changes in turn generated additional reductions in the considerable costs associated with what’s often referred to as the “hidden factory.” These included inventory, capital and equipment, energy, insurance, taxes, excess la-
Figure 14
Examples of desired future state stages
Characteristics Stage 1 Stage 2 Stage 3
Customer focus
Asset/Resource Effectiveness
Production/Service Scheduling
Network Management
Customer focus limited to special requests and responding to complaints. reactive rather tan proactive gathering of voice of customer.
regular communication with customer, joint problem solving.
formal processes to understand customer expectations including those which are unstated. Customer engages ‘us’ to identify improvement opportunities.
Constraints are understood and efforts exist to improve their utilization. Pm program exists.
Productivity metrics are tracked for key resources. Pm used extensively. Starting to use Pdm.
Specific strategies for key resources and Work management programs in place. View is holistic rather than individual.
Entirely driven by forecast, long product and service lead times, informal efforts to control WIP inventor. no corporate wide method for handling requests greater than capacity.
WIP is controlled within the plant through localized pull systems but not linked directly for customer demand.
Production/Service directly driven by customer demand, e.g. replenishment of finished goods shipped daily. has an effective Sales and Operations planning methodology.
Senior management takes a network view for capacity planning but it is informal. Best practices are shared at plan manager level. Transactional backoffice and service nodes are invisible. Boundaries exist and are not violated at functional and office and floor levels.
Active efforts to optimize the network rather than individual plants, best practice sharing at mid-manager level and transactional nodes recognized.
Continuous focus on optimizing the resources for the best rOIC while meeting variable customer needs. resources and asset usage is thought is handled at global levels. Extensive and formal best practice sharing betweeen sites at all levels.

TrAnSfOrmIng BuSInESS PErfOrmAnCE ThrOugh ExECuTIOn ExCEllEnCE
42 harvarddeustobusinessreview
bor, transportation and handling to address product damage.
* * *
In a world of ever-increasing uncertainty, the ability to execute strategy has become the differentiator between enterprises that pull ahead—and stay ahead—of the competition, and those that are left struggling to catch up. But building execution excellence is not for the faint-hearted: It requires immense will, clarity of thought and patience. Activating five powerful and mu-tually reinforcing enablers—journey, focus, simplicity,
speed and discipline—can help companies seize the advantages essential for remaining competitive in good times and bad, including low costs, greater profitabil-ity and the power to respond quickly and flexibly to a constantly shifting business landscape.
Figure 15
Dos
• Do be objective and honest when assessing the strength of your company’s execution capabilities and its readiness for change.
• Do pay adequate attention to the human condition in implementing your journey—including investing in change management efforts.
• Do hold people accountable at all levels for sustaining momentum as the organization moves toward its desired future state.
Don’ts
• Don’t forget to identify the attributes and activities in your organization that present the greatest impediments to execution and develop strategies for removing these roadblocks.
• Don’t assume that your execution excellence journey will deliver optimal performance immediately. “Quick hit” projects will contribute to rapid program payback but won’t, in themselves, transform the organization.
• Don’t over-rely on experts in tactical process-improvement tools, such as master Black Belts or lean Senseis, to lead your journey.
«Transforming Business Performance through Execution Excellence». © Accenture 2010. reference no. 3743 hDBr.
Dos and don’ts of journey