double ended guillotine break in a...
TRANSCRIPT

DOUBLE ENDED GUILLOTINE BREAK IN A PRISMATIC BLOCK
VHTR LOWER PLENUM AIR INGRESS SCENARIO
A Thesis
by
JESSICA LAUREN HARTLEY
Submitted to the Office of Graduate Studies of
Texas A&M University
in partial fulfillment of the requirements for the degree of
MASTER OF SCIENCE
August 2011
Major Subject: Mechanical Engineering

Double Ended Guillotine Break in a Prismatic Block VHTR Lower Plenum Air
Ingress Scenario
Copyright 2011 Jessica Lauren Hartley

DOUBLE ENDED GUILLOTINE BREAK IN A PRISMATIC BLOCK
VHTR LOWER PLENUM AIR INGRESS SCENARIO
A Thesis
by
JESSICA LAUREN HARTLEY
Submitted to the Office of Graduate Studies of
Texas A&M University
in partial fulfillment of the requirements for the degree of
MASTER OF SCIENCE
Approved by:
Chair of Committee, Yassin Hassan
Committee Members, William Marlow
Kalyan Annamalai
Head of Department, Jerald Caton
August 2011
Major Subject: Mechanical Engineering

iii
ABSTRACT
Double Ended Guillotine Break in a Prismatic Block VHTR Lower Plenum Air
Ingress Scenario. (August 2011)
Jessica Lauren Hartley, B.S., West Texas A&M University
Chair of Advisory Committee: Dr. Yassin Hassan
The double ended guillotine break leading to density-driven air ingress has been
identified as a low probability yet high consequence event for Very High Temperature
Reactor (VHTR). The lower plenum of the VHTR contains the core support structure
and is composed of graphite. During an air ingress event, oxidation of the graphite
structure under high temperature conditions in an oxygen containing environment could
degrade the integrity of the core support structure. Following this large break, air from
the reactor containment will begin to enter the lower plenum via two mechanisms:
diffusion or density driven stratified flow. The large difference in time scales between
the mechanisms leads to the need to perform high fidelity experimental studies to
investigate the dominant air ingress mechanism. A scaled test facility has been designed
and built that allows the acquisition of velocity measurements during stratification after
a pipe break. A non-intrusive optical measurement technique provides full-field velocity
measurement profiles of the two species particle image velocimetry. The data allow a
more developed understanding of the fundamental flow features, the development of
improved models, and possible mitigation strategies in such a scenario.
iv
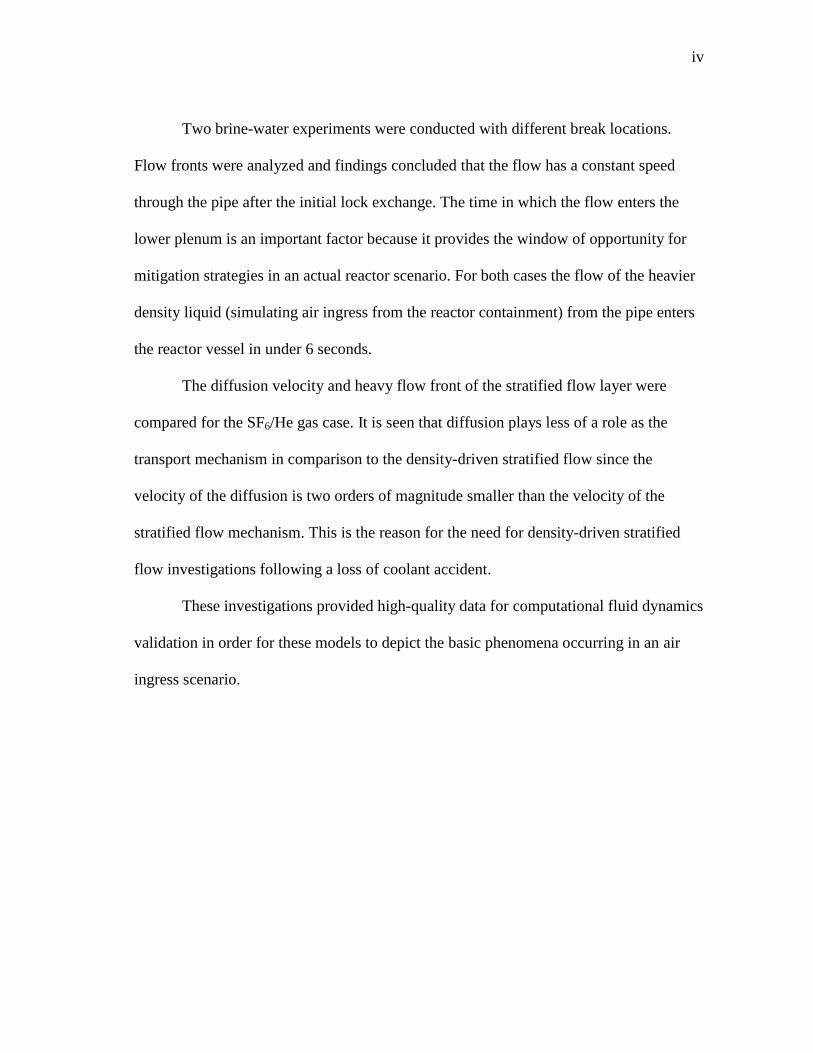
Two brine-water experiments were conducted with different break locations.
Flow fronts were analyzed and findings concluded that the flow has a constant speed
through the pipe after the initial lock exchange. The time in which the flow enters the
lower plenum is an important factor because it provides the window of opportunity for
mitigation strategies in an actual reactor scenario. For both cases the flow of the heavier
density liquid (simulating air ingress from the reactor containment) from the pipe enters
the reactor vessel in under 6 seconds.
The diffusion velocity and heavy flow front of the stratified flow layer were
compared for the SF6/He gas case. It is seen that diffusion plays less of a role as the
transport mechanism in comparison to the density-driven stratified flow since the
velocity of the diffusion is two orders of magnitude smaller than the velocity of the
stratified flow mechanism. This is the reason for the need for density-driven stratified
flow investigations following a loss of coolant accident.
These investigations provided high-quality data for computational fluid dynamics
validation in order for these models to depict the basic phenomena occurring in an air
ingress scenario.
v
DEDICATION
This thesis is dedicated to my dad (Texas A&M Centennial Class of 1976) who
has been my inspiration to always pursue what I love and has always believed in me no
matter what and to my mom (Texas A&M Centennial Class of 1976) who helps me
realize there is more to life than work.

vi
ACKNOWLEDGEMENTS
I would like to thank my committee chair, Dr. Hassan, and my mentor, Nate
Salpeter, for their guidance and support throughout the course of this research.
I also want to extend my gratitude to the Nuclear Energy University Programs for
supporting the work done for this project. Thanks also go to my friends and colleagues
for their support and for making my time at Texas A&M University a great experience.
Finally, thanks to my parents for their never ending encouragement and love through the
course of my life that has led me to this point.

vii
NOMENCLATURE
dP Particle Diameter (μm)
DSF6-He Diffusion Coefficient of SF6-He (m2/s)
dt Change in Time (s)
dx Change in Position (m)
Fr Froude Number
g Gravity Term (m/s2)
g‟ Reduced Gravity Term (m/s2)
H Hot Duct Diameter (m)
L Diffusion Length (m)
MSF6-He Molecular Weight for the Binary Species (kg/kmol)
ΩD Diffusion Collision Integral
P Pressure (atm)
ρ Density of Fluid (kg/m3)
ρHeavy Density of Dense Fluid (kg/m3)
ρLight Density of Less Dense Fluid (kg/m3)
ρP Density of Seeding Particle (kg/m3)
Ri Richardson Number
σSF6-He Entropy Generation (Angstrom)
T Temperature (K)
TDiff Diffusion Time Scale (s)

viii
μ Viscosity (Pa*s)
u Discharge Velocity (m/s)
uHeavy Flow Front Velocity of Heavy Density Fluid (m/s)
uLight Flow Front Velocity of Light Density Fluid (m/s)
Ug Gravitational Velocity (m/s)
VDiff Diffusion Velocity (m/s)
Subscipts
g Gravitational
m Model
p Prototype
ix
TABLE OF CONTENTS
Page
ABSTRACT .............................................................................................................. iii
DEDICATION .......................................................................................................... v
ACKNOWLEDGEMENTS ...................................................................................... vi
NOMENCLATURE .................................................................................................. vii
TABLE OF CONTENTS .......................................................................................... ix
LIST OF FIGURES ................................................................................................... xi
LIST OF TABLES .................................................................................................... xiii
1. INTRODUCTION ............................................................................................... 1
1.1 Very High Temperature Reactors ........................................................ 3
1.2 Air Ingress Accident Scenario ............................................................. 5
2. LITERATURE SURVEY ................................................................................... 8
2.1 Air Ingress Investigations ..................................................................... 8
2.2 This Work ............................................................................................. 12
3. THEORY ............................................................................................................. 13
4. SCALING ANALYSIS ....................................................................................... 16
5. EXPERIMENTAL APPROACH ........................................................................ 20
5.1 Experimental Set-up ............................................................................. 20
5.2 Visualization Techniques ..................................................................... 22
6. UNCERTAINTY ................................................................................................ 29
6.1 Experimental Uncertainty .................................................................... 29
6.2 PIV Seeding Tracer Particle Uncertainty ............................................. 32
x
Page
7. RESULTS AND DISCUSIONS ......................................................................... 33
7.1 Liquid-liquid Air Ingress Investigations .............................................. 33
7.2 Gas-gas Air Ingress Investigation ........................................................ 45
8. FUTURE WORK ................................................................................................ 49
9. SUMMARY AND CONCLUSIONS .................................................................. 50
REFERENCES .......................................................................................................... 52
VITA ......................................................................................................................... 55

xi
LIST OF FIGURES
FIGURE Page
1 Department of Energy's Reference VHTR Schematic [1] ......................... 4
2 CFX Results of Two-Bulb Simulation with 16-mm Pipe [4] ..................... 9
3 Simplified 2-D Geometry of GT-MHR for Stratified Flow
Simulation [5] ............................................................................................. 10
4 A Schematic Diagram of an Idealized Gravity Current ............................. 14
5 Air Ingress Test Facility ............................................................................. 19
6 Isothermal Stratified Flow Experimental Setup ......................................... 21
7 Schematic for the Isothermal Air Ingress Experiment ............................... 22
8 Brine-water Camera Setup for Long Pipe Case ......................................... 25
9 Shadowgraphy in a Post Brine-water Experiment ..................................... 26
10 Gas-gas Investigation Camera Setup for Long Pipe Case .......................... 28
11 Uncertainty Associated with the Field of View in Case A. ....................... 30
12 Uncertainty Associated with the Field of View in Case B. ........................ 31
13 Progression of Gravity Currents and Stratified Flow in Case A. ............... 35
14 Progression of Gravity Currents and Stratified Flow in Case B ................ 36
15 Experimental Results for the Pipe Flow Front Velocity versus Location
in Case A .................................................................................................... 37
16 Experimental Results for the Pipe Flow Front Velocity versus Location
in Case B .................................................................................................... 38
17 Experimental Results for the Pipe Flow Front Location versus Time in
the Pipe ....................................................................................................... 38
xii
FIGURE Page
18 Highly Periodic Interfacial Instabilities between the Brine and Water. ..... 42
19 Experimental Results for Flow Front Location versus Time of the Lower
Plenum ........................................................................................................ 43
20 Experimental Results for Spreading Rate versus Location in the Lower
Plenum ........................................................................................................ 44
21 Zinc Stearate Particle Analysis (Ferro) ...................................................... 47
22 Zinc Stearate Particle Analysis (Struktol) .................................................. 48
xiii
LIST OF TABLES
TABLE Page
1 Fluids Used for Reactor Similarity ............................................................. 18
2 Camera Specifications ................................................................................ 24
3 Description of Brine-water Investigations ................................................. 34
4 Comparison of Flow Front Velocity between Experimental and
Benjamin‟s Theoretical Model ................................................................... 39
5 Comparison of Flow Front Velocity between Experimental and CFD ...... 40
6 Comparison of Diffusion Velocity to Density-driven Stratified Flow ....... 46

1
1. INTRODUCTION
A new program for future nuclear energy systems, Generation IV, has been
created in effort to provide next-generation technologies that will compete in all markets
with the most cost-effective technologies expected to be available over the next three
decades [1]. This program creates advantages which include reduced capital cost,
enhanced nuclear safety, minimal generation of nuclear waste, and further reduction of
the risk of weapons materials proliferation. One of the six reactor technologies
considered under this program is the Very High Temperature Reactor (VHTR).
VHTRs are a part of the Next Generation Nuclear Plant (NGNP) or Generation
IV reactors. The reactor core technology will either be a prismatic block or a pebble bed
concept [1] with the cores composed of some type of fuel graphite cladding. The VHTR
uses helium as coolant to produce core outlet temperatures in the range of 700-900°C.
These higher temperatures generate higher power conversion efficiencies and provide
high quality process heat for chemical processes, including hydrogen production. A level
of passive safety is built into all the VHTR‟s conceptual designs for the next generation
nuclear reactors [1]. Passive safety includes safety components which do not require
active controller operational intervention to avoid accidents in the event of malfunction.
Passive safety may rely on pressure differentials, gravity, natural convection, or the
natural response of materials to high temperatures. Past studies have shown that density-
____________
This thesis follows the style of Journal of Fluids Engineering.
2
gradient dominated stratified flow is an inherent characteristic of passive systems in
advanced reactors [2] thus enabling VHTR‟s to be highly susceptible to this
phenomenon.
In the VHTR, air ingress following a loss of coolant accident (LOCA) has been
classified as being potentially one of the most severe accidents that can occur [2]. Air
ingress occurs when a pipe connecting the reactor vessel and power conversion unit
breaks and external air is allowed to enter the reactor vessel from the surrounding reactor
cavity. The most catastrophic of these events occurs when there is a double ended
guillotine break in the hot duct between the pressure vessel and the power conversion
unit [2-4].
The double ended guillotine break leading to a gravity driven air ingress has been
identified as a low probability yet high consequence event for VHTR. The lower plenum
of the VHTR contains the core support structure and is composed of graphite [2, 3].
During an air ingress event, oxidation of the graphite structure under high temperature
conditions could degrade the integrity of the core support structure. Following this large
break, air from the reactor containment enters the lower plenum via two mechanisms:
diffusion or density driven stratified flow. The large difference in time scales, and hence
reaction time, between the mechanisms leads to the need to perform high fidelity
experimental and numerical studies to investigate the dominant the air ingress
mechanism. A scaled small test facility has been designed and built that allows the
acquisition of velocity measurements during stratification and inflow/outflow behavior
through a broken duct. Non-intrusive Particle Image Velocimetry (PIV) measurement

3
techniques provide full-field velocity measurements, and concentration profiles of the
two species. These experiments provide new high fidelity full-field data of velocities
and concentrations with high spatial and temporal resolution. The data allows for fuller
concentrations with high spatial and temporal resolution. The data will allow for better
understanding of the fundamental flow features, the development of improved models,
and possible mitigation strategies in such a scenario.
1.1 Very High Temperature Reactors
The VHTR is one of the proposed reactor designs to play a role in future power
generation. This reactor is one of six new reactor designs for the Generation IV reactor
concepts. The main objective of the VHTR is cogeneration of electricity and hydrogen,
as well as to other process heat applications. The major added benefits of the VHTR
concept over previous reactors are higher thermal efficiency, hydrogen production,
process heat applications, and high degree of passive safety [2]. The general schematic
of the VHTR design is seen in Fig. 1. [1].

4
Figure 1: Department of Energy's Reference VHTR Schematic [1]
The basic technology for the VHTR has been well established in former High
Temperature Gas Reactor (HTGR) plants, such as Dragon, Peach Bottom, and Fort St
Vrain and is being advanced in concepts such as the Gas Turbine-Modular Helium
Reactor (GT-MHR) and Pebble Bed Modular Reactor (PBMR) [1]. The VHTR is a
helium gas-cooled, graphite-moderated, thermal neutron spectrum reactor with a core
outlet temperature greater than 950°C [5]. These characteristics make the VHTR
sufficient to support production of hydrogen by thermo-chemical processes. The
preliminary reactor design is a 600MWth core connected to a steam generator to deliver

5
process heat [2]. This specific thermal power level is set to allow passive decay heat
removal.
There are two configurations for the VHTR core: prismatic block or pebble-bed
core. The main difference between the configurations is the geometry of the fuel. The
main interest of this paper is the prismatic block core configuration. The prismatic core
consists of an inner reflector region surrounded by an annulus of fuel blocks which is in
turn surrounded by an annulus of outer reflector elements [6]. The basic fuel concept for
the VHTR is TRISO coated particles which combined create compacts that fit into the
fuel blocks. The fuel blocks are composed of hexagonal columns of graphite with
circular holes coolant that run the full length of the column.
1.2 Air Ingress Accident Scenario
Prior literature pertaining to the air ingress accident scenario is initiated with a
pipe break [2-6, 7, 8]. Immediately thereafter, depressurization begins and the hot
helium coolant from the reactor vessel escapes. During this process, the helium mixes
with the air in the external reactor cavity. Depressurization ceases and air ingress occurs
when the pressure in the reactor vessel is equal to the pressure in the containment.
Initial studies focused on molecular diffusion as the primary ingress mechanism
with a time scale of around 150 hours [2]. However, recent studies have shown that
assuming molecular diffusion as the driving factor in air ingress is physically incorrect.
Instead, the primary mechanism for air ingress is shown to be a gravity driven process
that occurs due to the large density difference between the internal helium coolant and

6
the external helium-air mixture following a break. The different densities result in a
gravity driven flow between the cooler, higher density helium-air mixture in the
containment and the hotter, lower density helium present in the reactor vessel. A
counter-current exchange flow similar to that modeled by Benjamin‟s equation [1, 9]
occurs and the time scale for helium-air mixture to penetrate the lower plenum is
expected to be less than 10 seconds depending on break location. The main difference in
this presented research case from the previous Benjamin study [9] is that the duct is
cylindrical rather than rectangular. Further differentiation of this work from previous
air-ingress studies is the presence of a co-annular duct at the break. This duct used in
this study is geometrically scaled to model the General Atomics Gas Turbine-Modular
Helium Reactor (GT-MHR) [2]. As the gravity driven flow enters the lower plenum
region of the vessel, the helium-air mixture begins to heat up at which point natural
convection is thought to take place as the now heated mixture begins to rise and drive
cooler gasses down the walls of the reactor vessel and out through the cool duct.
Because of the differing time scales of interaction, the primary air ingress
mechanism, whether it is dominated by diffusion or density driven stratified flow needs
to be verified. Air ingress may result in the oxidation of in-core graphite structures and
fuel. Although the amount of oxygen present in the containment is unlikely to cause
oxidation to the point of collapse, superficial oxidation of support structures and core
materials may result in significant dust generation and resulting fission product release
as flows entrain ash particles off the graphite surfaces. By understanding the full cycle of

7
the air ingress scenario through careful experimentation, mitigation strategies may be
developed for such an accident.
8
2. LITERATURE SURVEY
2.1 Air Ingress Investigations
To obtain a thorough understanding of the physical phenomena that occurs
during a LOCA of a VHTR and for the air ingress scenario as a whole a survey of
literature needed to be conducted. The methods and results of various air ingress
accident scenario simulations and experiments for LOCA in VHTRs are presented in the
following section.
Numerical studies were conducted by Idaho National Laboratory (INL) on
Duncan and Toor‟s [10] two bulb studies using GAMMA and CFX [4]. Duncan and
Toor‟s two bulb studies consist of two bulbs connected by a small diameter pipe of 2.08
mm. One bulb is filled with a heavier gas, CO2 (simulating the ingress of air into the
reactor), and the other with a lighter gas, H2 (simulating the reactor coolant). The bulbs
are closed to one another prior to the start of the experiment. In this numerical study the
exact dimensions of the experimental equipment were used. The findings reveal that the
small pipe molecular diffusion is a main phenomenon for gas transport. Findings show
that diffusion is a slow process. Even after 200 seconds the gas concentrations of the
lighter gas bulb and the heavier gas bulb are not changed [4]. For the second numerical
study conducted in 2009 at INL [4], the same dimensions were used as in the experiment
and the diffusion two bulb analyses except for the diameter of the capillary tube. The
capillary tube was changed to a diameter of 16 mm. Figure 2 shows the simulation after
30 seconds and depicts the heavier gas CO2 flows to the bottom and the lighter gas
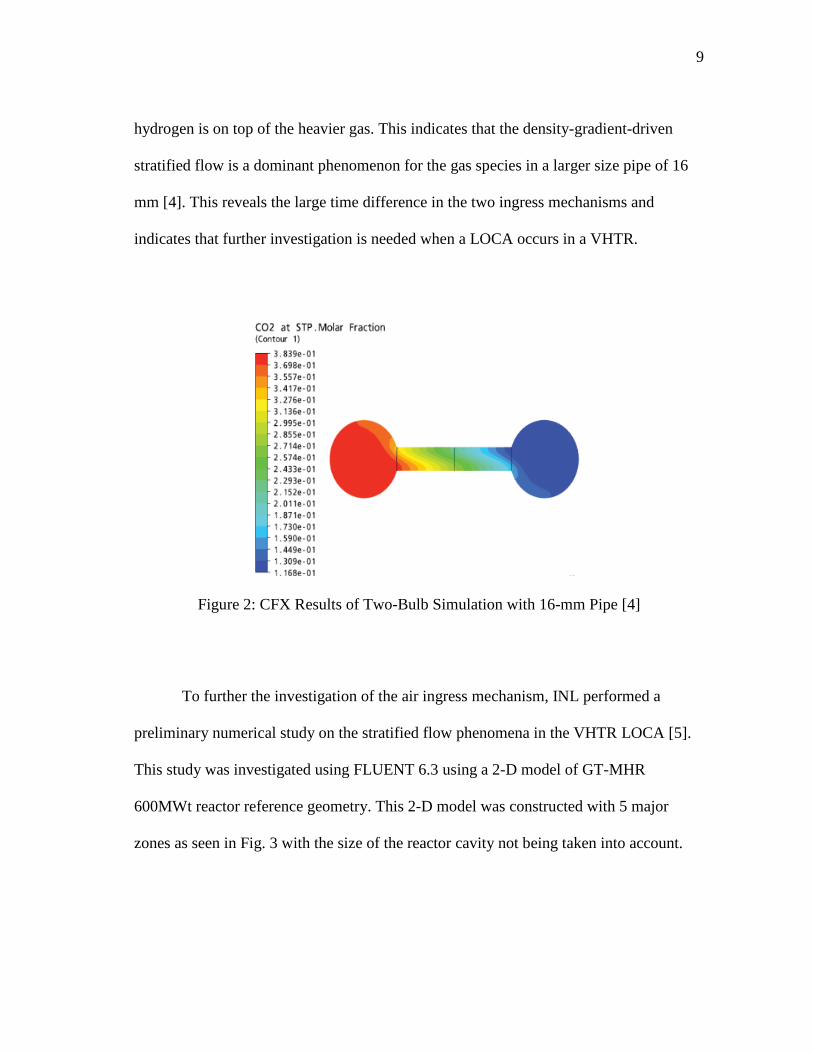
9
hydrogen is on top of the heavier gas. This indicates that the density-gradient-driven
stratified flow is a dominant phenomenon for the gas species in a larger size pipe of 16
mm [4]. This reveals the large time difference in the two ingress mechanisms and
indicates that further investigation is needed when a LOCA occurs in a VHTR.
Figure 2: CFX Results of Two-Bulb Simulation with 16-mm Pipe [4]
To further the investigation of the air ingress mechanism, INL performed a
preliminary numerical study on the stratified flow phenomena in the VHTR LOCA [5].
This study was investigated using FLUENT 6.3 using a 2-D model of GT-MHR
600MWt reactor reference geometry. This 2-D model was constructed with 5 major
zones as seen in Fig. 3 with the size of the reactor cavity not being taken into account.
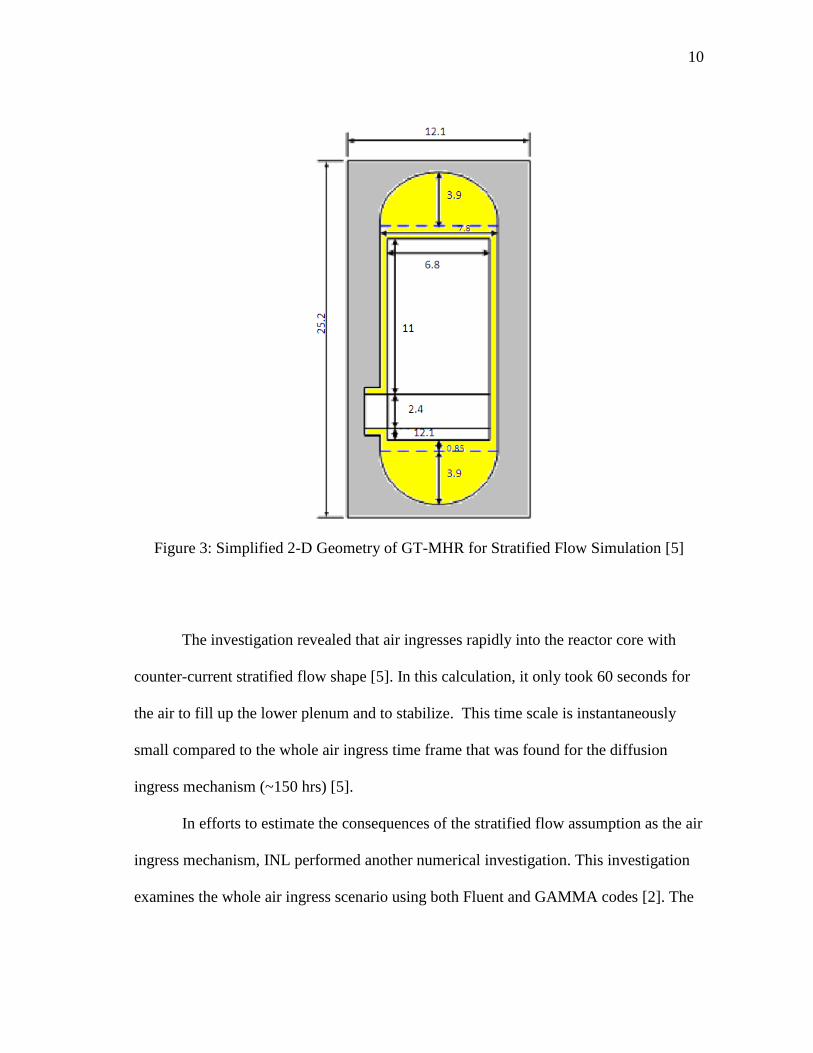
10
Figure 3: Simplified 2-D Geometry of GT-MHR for Stratified Flow Simulation [5]
The investigation revealed that air ingresses rapidly into the reactor core with
counter-current stratified flow shape [5]. In this calculation, it only took 60 seconds for
the air to fill up the lower plenum and to stabilize. This time scale is instantaneously
small compared to the whole air ingress time frame that was found for the diffusion
ingress mechanism (~150 hrs) [5].
In efforts to estimate the consequences of the stratified flow assumption as the air
ingress mechanism, INL performed another numerical investigation. This investigation
examines the whole air ingress scenario using both Fluent and GAMMA codes [2]. The
11
main purpose for this investigation was to understand the stratified flow effect as air
ingresses into the reactor and to find the onset of natural convection. The GT-MHR was
used as the reference geometry and the Fluent simulations reveal that natural convection
was initiated 160 seconds after stratified flow was started and also the whole reactor
vessel was filled with air after 4 minutes [2]. This accelerated onset of natural
convection leads to much faster oxidation in the graphite structures. The conclusion
(new assumption-stratified flow) was that air ingress is a much more severe than
previously thought and the previous assumption on air-ingress accident will lead to the
underestimation on their consequences. It is therefore recommended by INL that the
original air-ingress scenario based on molecular diffusion be replaced with the new
assumption considering stratified flow.
Studies on density-gradient-driven stratified flow in advanced reactor systems
has been the subject of active research for over a decade because density-gradient
dominated stratified flow is an inherent characteristic of passive systems used in Light
Water Reactors (LWR) [7]. Liou, 2007 performed density driven stratified flow
experiments using water as the working fluid instead of helium. In one experiment he
used air, oil, and water to develop a visualization of the role density plays on varying
fluids in a pipe. The LWR is conceptually identical and directly applicable to the
phenomenological behavior that occurs in the NGNP. The governing equations from this
experiment are identical to the ones used in the air ingress event of a VHTR [7].
In 2010, Oh and Kim [8] conducted experiments to investigate density driven
stratified flow during a LOCA of a VHTR. The experiments were conducted in two

12
acrylic tanks connected by a pipe using brine and water as the working fluids. The fluids
were separated by a large valve to simulate the pipe break and the facility was scaled
down model of a GT-MHR as the reference reactor. The isothermal experiments had two
objectives:
1) to understand stratified flow phenomena in the VHTR and
2) to provide experimental data for validating computer codes.
The experiment shows clear stratified flow between the heavy and light fluids. Also,
Benjamin‟s model provides a good prediction for flow front speed for internal stratified
flow. This model was used as a comparison to the experimental data in which less than
10% error was found [8].
All of these investigations provide insight into the air ingress scenario. Without
knowing what has been done in the past, nothing can be improved in the future.
2.2 This Work
In this work, experiments were performed to investigate the dominant air ingress
mechanism during a LOCA. A small scaled test facility was designed and built to allow
the acquisition of velocity measurements during stratification and inflow/outflow
behavior through the broken duct. Investigations include two shadowgraphy
investigations with different pipe break locations and one Particle Image Velocimetry
(PIV) investigation.

13
3. THEORY
Density driven currents, or often called gravity driven currents, are induced by
density variations due to a difference in temperature, presence of a dispersed solid phase,
or heavier dense gas. Lock exchange flows are a class of density currents in which
surface tension can be neglected and counter current flows are produced. These are
simple flow configurations, which may, however, result in very complex flows
characterized by physical processes such as the emergence of Kelvin-Helmholtz-like
instabilities, the formation of lobes and clefts at the front leading edge, etc [11].
Lock exchange flows consists of two fluids of different densities initially
separated by a gate. When the gate is removed, differences in the hydrostatic pressure
cause the denser fluid to flow in one direction along the bottom boundary of the tank,
while the lighter fluid flows in the opposite direction along the top boundary of the tank
[12]. A basic configuration of the flow is shown in Fig. 4.
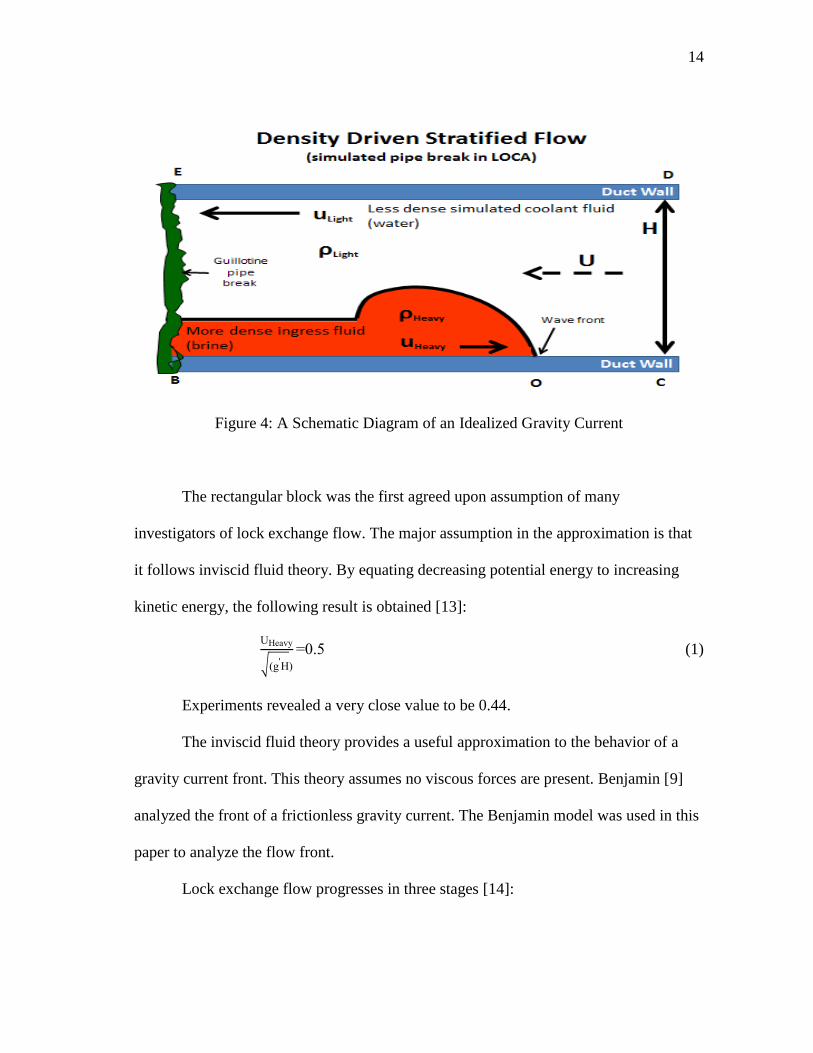
14
Figure 4: A Schematic Diagram of an Idealized Gravity Current
The rectangular block was the first agreed upon assumption of many
investigators of lock exchange flow. The major assumption in the approximation is that
it follows inviscid fluid theory. By equating decreasing potential energy to increasing
kinetic energy, the following result is obtained [13]:
Heavy
(g H)
0 5 (1)
Experiments revealed a very close value to be 0.44.
The inviscid fluid theory provides a useful approximation to the behavior of a
gravity current front. This theory assumes no viscous forces are present. Benjamin [9]
analyzed the front of a frictionless gravity current. The Benjamin model was used in this
paper to analyze the flow front.
Lock exchange flow progresses in three stages [14]:
15
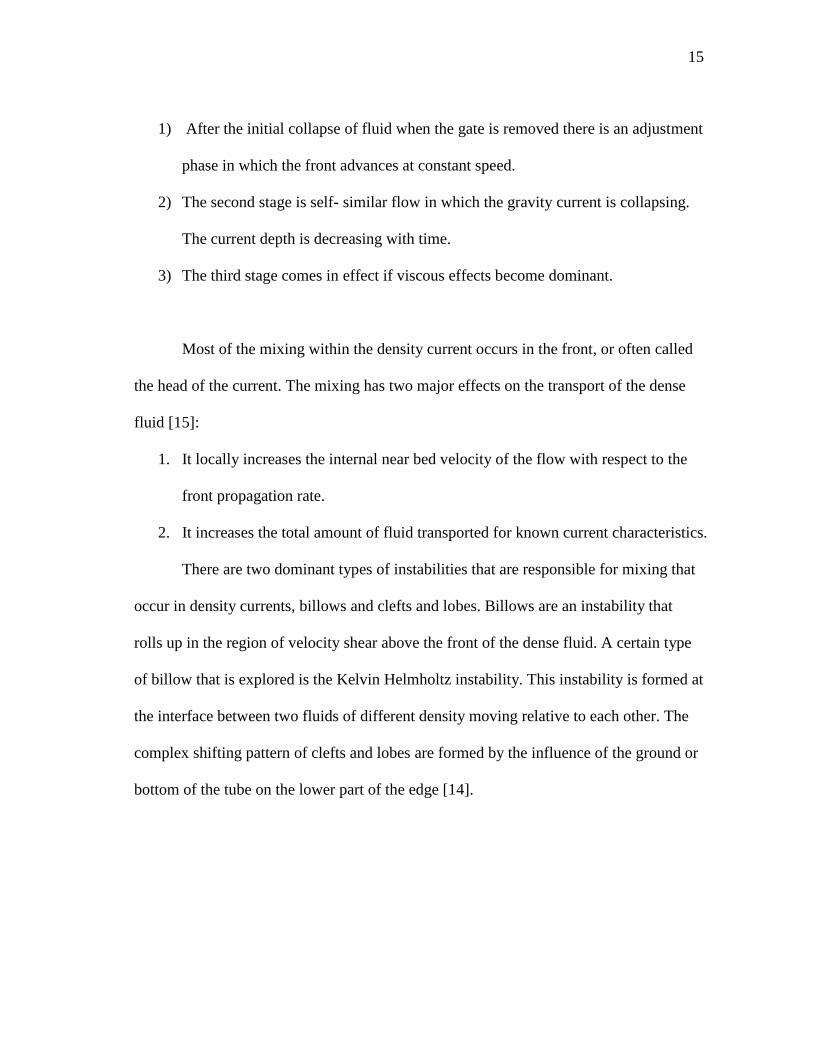
1) After the initial collapse of fluid when the gate is removed there is an adjustment
phase in which the front advances at constant speed.
2) The second stage is self- similar flow in which the gravity current is collapsing.
The current depth is decreasing with time.
3) The third stage comes in effect if viscous effects become dominant.
Most of the mixing within the density current occurs in the front, or often called
the head of the current. The mixing has two major effects on the transport of the dense
fluid [15]:
1. It locally increases the internal near bed velocity of the flow with respect to the
front propagation rate.
2. It increases the total amount of fluid transported for known current characteristics.
There are two dominant types of instabilities that are responsible for mixing that
occur in density currents, billows and clefts and lobes. Billows are an instability that
rolls up in the region of velocity shear above the front of the dense fluid. A certain type
of billow that is explored is the Kelvin Helmholtz instability. This instability is formed at
the interface between two fluids of different density moving relative to each other. The
complex shifting pattern of clefts and lobes are formed by the influence of the ground or
bottom of the tube on the lower part of the edge [14].
16
4. SCALING ANALYSIS
To validate the fact that the scaled down laboratory scale experimental apparatus
effectively simulates conditions expected in the VHTR, this section discusses the scaling
analysis for air ingress via density driven stratified flow phenomenon in the
experimental simulation of the VHTR during a LOCA. This section identifies the
respective dimensionless groups and similarity criteria used to describe this
phenomenon.
Scaling analysis was performed for the density driven stratified flow phenomena
in a VHTR. Commonly used dimensionless numbers to characterize stratified flow are
Richardson and Froude numbers under the Boussinesq approximation. The essence of
the Boussinesq approximation is that the difference in inertia is negligible but gravity is
sufficiently strong to make the specific weight appreciably different between the two
fluids.
In the scaling analysis, the flow front velocity of the light and heavy fluids are
assumed to closely follow Benjamin‟s equation, Eq (2) and (3), based on previous
studies with a single cylindrical pipe [9]. The dimensionless numbers are matched in the
model and prototype with a reduced gravity term, Eq. (4) and are set to unity as seen in
Eq. (5) and Eq. (6).
uHeavy 0 44 g H (2)

17
uLight 0 44 gH(ρHeavy-ρLight) (3)
g gρHeavy-ρLight
ρ vg (4)
Rim
Rip up2gm
hm
um2gp hp 1 (5)
Frm
Frp um gp
hp
up gm hm
1 (6)
As seen in the previous equations, the Froude number (Frm/Frp) is the ratio of
inertial forces to gravitational forces and the Richardson number (Rim/Rip) is the ratio of
potential energy to kinetic energy. Both are highly dependent on the density ratio and the
characteristic length scale (H). With the scaled down experimental test facility and the
resulting scaled down characteristic length, there was a need to adjust the density ratio to
obtain the necessary Froude and Richardson numbers that represent reactor conditions
during a LOCA to provide representative results. To accomplish this, different fluids
were used to adjust the density ratio to obtain the same dimensionless numbers as in the
actual reactor. The density ratio for the actual reactor is 0.14 and to obtain this same
ratio a variation in concentrations for the fluids are used. These fluids are found in Table
1.
18
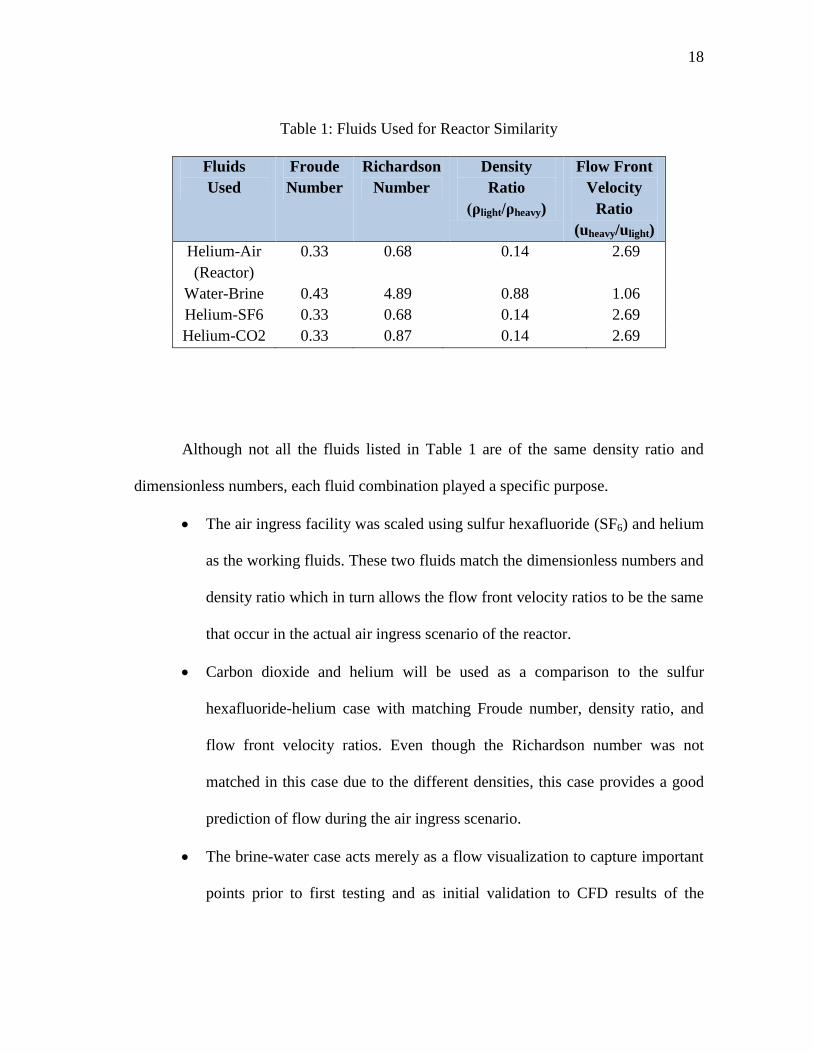
Table 1: Fluids Used for Reactor Similarity
Fluids
Used
Froude
Number
Richardson
Number
Density
Ratio
(ρlight/ρheavy)
Flow Front
Velocity
Ratio
(uheavy/ulight)
Helium-Air
(Reactor)
0.33 0.68 0.14 2.69
Water-Brine 0.43 4.89 0.88 1.06
Helium-SF6 0.33 0.68 0.14 2.69
Helium-CO2 0.33 0.87 0.14 2.69
Although not all the fluids listed in Table 1 are of the same density ratio and
dimensionless numbers, each fluid combination played a specific purpose.
The air ingress facility was scaled using sulfur hexafluoride (SF6) and helium
as the working fluids. These two fluids match the dimensionless numbers and
density ratio which in turn allows the flow front velocity ratios to be the same
that occur in the actual air ingress scenario of the reactor.
Carbon dioxide and helium will be used as a comparison to the sulfur
hexafluoride-helium case with matching Froude number, density ratio, and
flow front velocity ratios. Even though the Richardson number was not
matched in this case due to the different densities, this case provides a good
prediction of flow during the air ingress scenario.
The brine-water case acts merely as a flow visualization to capture important
points prior to first testing and as initial validation to CFD results of the
19
brine-water case. The brine-water case does not match the dimensionless
numbers as in the reactor due to the fluids needed for the flow visualization.
Prior to the flow visualization experiment, the density of the brine solution
and water were measured by a hydrometer and the viscosity measured by a
rheometer to ensure accurate estimates of the flow front velocity. These
dimensionless parameters along with the Reynolds number were used to
calculate the flow regime.
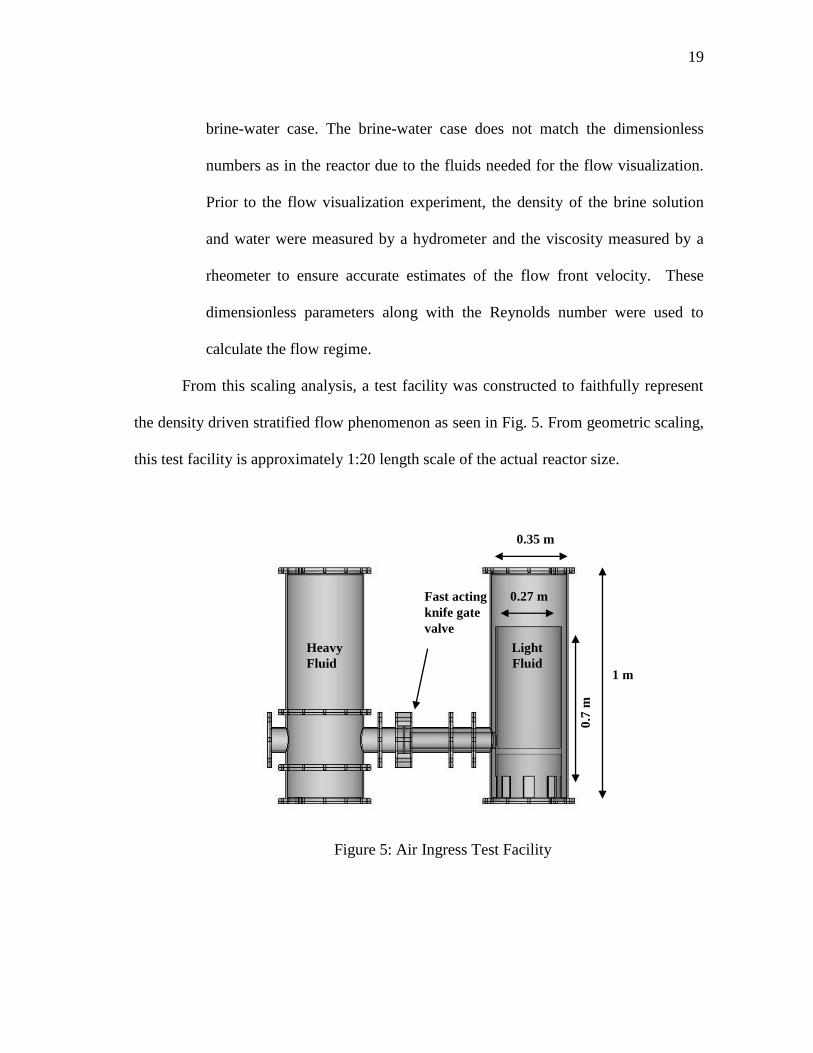
From this scaling analysis, a test facility was constructed to faithfully represent
the density driven stratified flow phenomenon as seen in Fig. 5. From geometric scaling,
this test facility is approximately 1:20 length scale of the actual reactor size.
Figure 5: Air Ingress Test Facility
Fast acting
knife gate
valve
Light
Fluid
Heavy
Fluid 1 m
0.35 m
0.7
m
0.27 m
20
5. EXPERIMENTAL APPROACH
5.1 Experimental Set-up
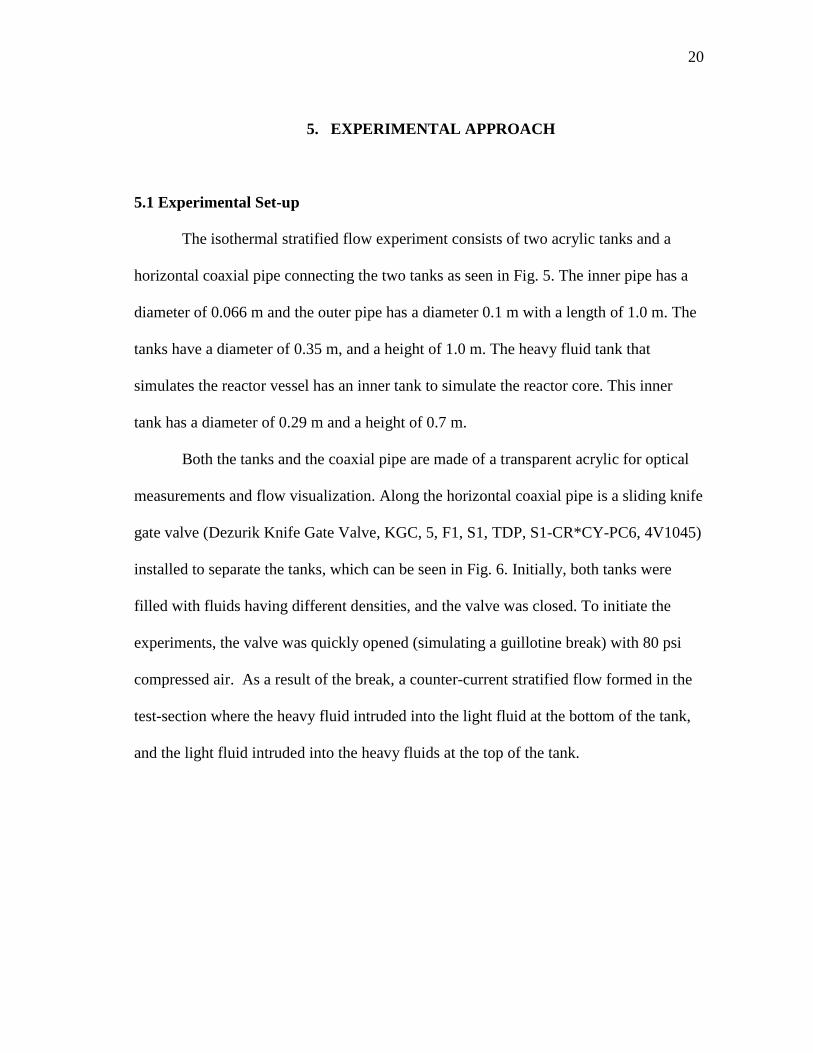
The isothermal stratified flow experiment consists of two acrylic tanks and a
horizontal coaxial pipe connecting the two tanks as seen in Fig. 5. The inner pipe has a
diameter of 0.066 m and the outer pipe has a diameter 0.1 m with a length of 1.0 m. The
tanks have a diameter of 0.35 m, and a height of 1.0 m. The heavy fluid tank that
simulates the reactor vessel has an inner tank to simulate the reactor core. This inner
tank has a diameter of 0.29 m and a height of 0.7 m.
Both the tanks and the coaxial pipe are made of a transparent acrylic for optical
measurements and flow visualization. Along the horizontal coaxial pipe is a sliding knife
gate valve (Dezurik Knife Gate Valve, KGC, 5, F1, S1, TDP, S1-CR*CY-PC6, 4V1045)
installed to separate the tanks, which can be seen in Fig. 6. Initially, both tanks were
filled with fluids having different densities, and the valve was closed. To initiate the
experiments, the valve was quickly opened (simulating a guillotine break) with 80 psi
compressed air. As a result of the break, a counter-current stratified flow formed in the
test-section where the heavy fluid intruded into the light fluid at the bottom of the tank,
and the light fluid intruded into the heavy fluids at the top of the tank.
21
Figure 6: Isothermal Stratified Flow Experimental Setup
Light
Fluid
Light
Fluid Heavy
Fluid
Heavy
Fluid

22
Figure 7: Schematic for the Isothermal Air Ingress Experiment
5.2 Visualization Techniques
Several visualization techniques were used to analyze the density driven
stratified flow front in the simulated air ingress scenario of a VHTR during a LOCA.
Among these techniques were Shadowgraphy and Particle Image Velocimetry (PIV).
5.2.1 Shadowgraphy, Setup, and Flow Measurement
Initial flow visualization tests were conducted using a brine solution to simulate
the heavy helium-air mixture in the reactor containment, and water to simulate the hot
23
helium exiting the reactor vessel. Flow visualizations using shadowgraphy techniques
were conducted to investigate the stratified flow that occurs following a pipe break.
Shadowgraphy is an optical method that depicts fluid flow patterns made visible by
using differences in index-of-refraction in the flow. The fluid is illuminated by a beam of
light which bends toward regions of higher refractive index while passing through a
transparent material. In our experiment, the light beam used in shadowgraphy is the LEC
light source which provides a monochromatic source of light.
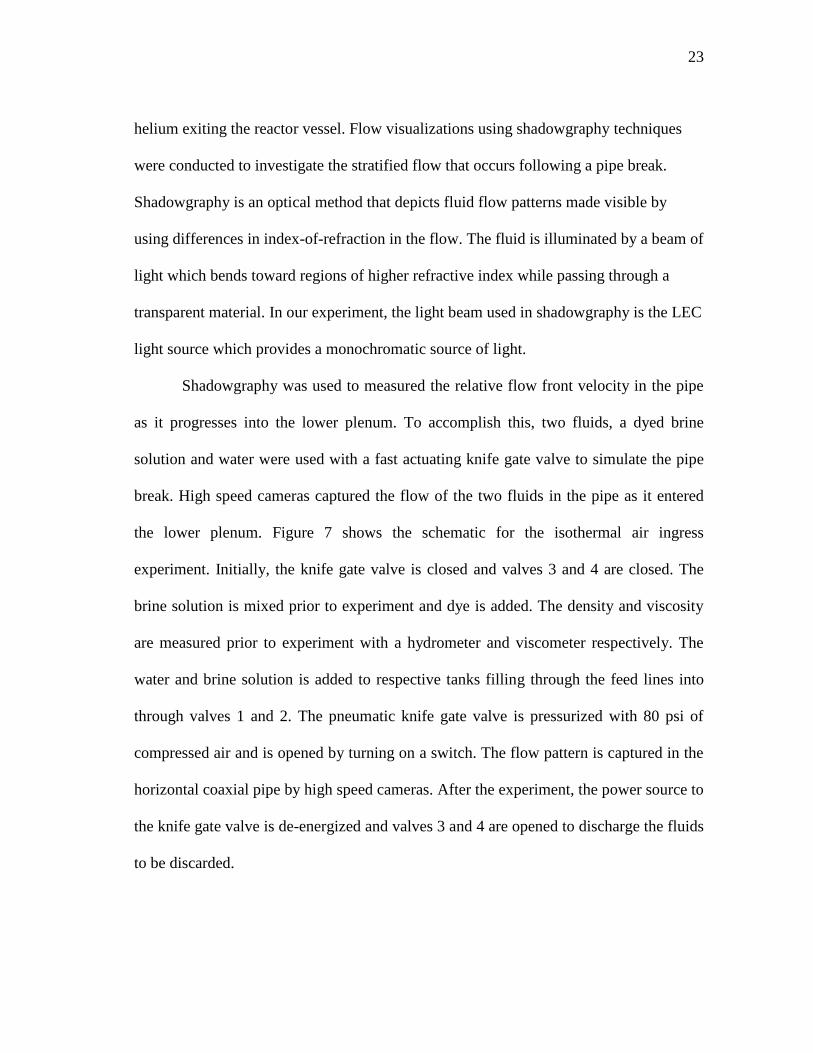
Shadowgraphy was used to measured the relative flow front velocity in the pipe
as it progresses into the lower plenum. To accomplish this, two fluids, a dyed brine
solution and water were used with a fast actuating knife gate valve to simulate the pipe
break. High speed cameras captured the flow of the two fluids in the pipe as it entered
the lower plenum. Figure 7 shows the schematic for the isothermal air ingress
experiment. Initially, the knife gate valve is closed and valves 3 and 4 are closed. The
brine solution is mixed prior to experiment and dye is added. The density and viscosity
are measured prior to experiment with a hydrometer and viscometer respectively. The
water and brine solution is added to respective tanks filling through the feed lines into
through valves 1 and 2. The pneumatic knife gate valve is pressurized with 80 psi of
compressed air and is opened by turning on a switch. The flow pattern is captured in the
horizontal coaxial pipe by high speed cameras. After the experiment, the power source to
the knife gate valve is de-energized and valves 3 and 4 are opened to discharge the fluids
to be discarded.
24
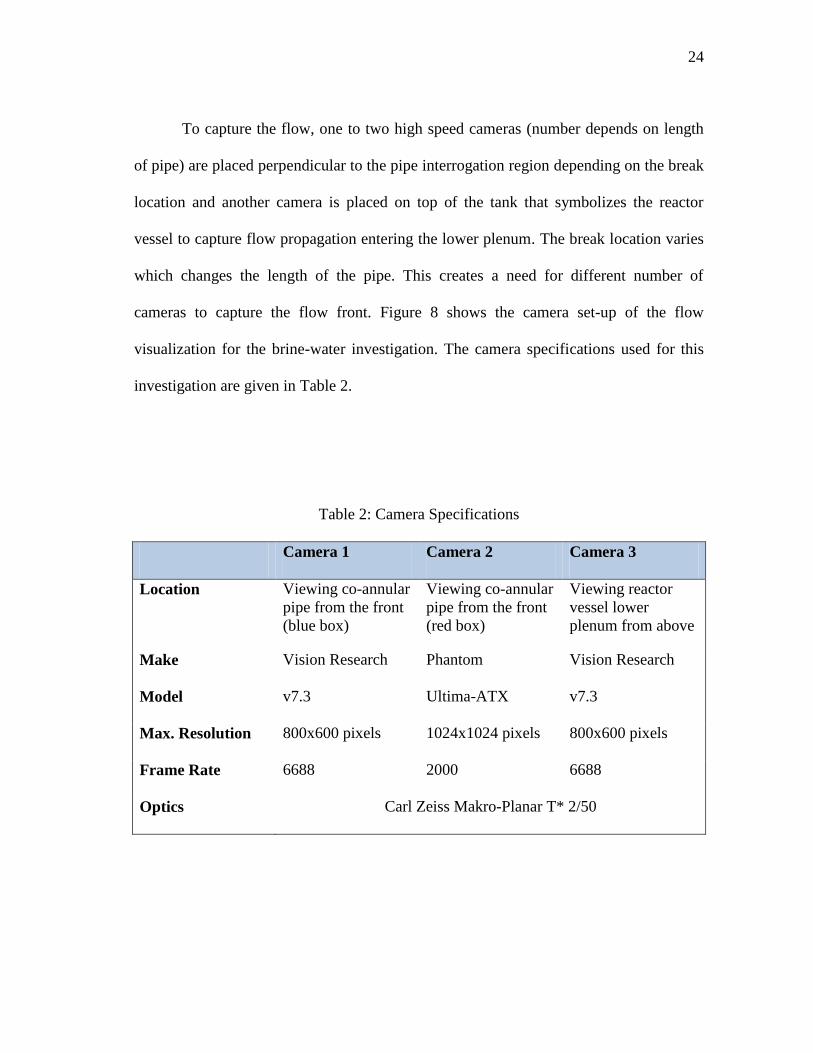
To capture the flow, one to two high speed cameras (number depends on length
of pipe) are placed perpendicular to the pipe interrogation region depending on the break
location and another camera is placed on top of the tank that symbolizes the reactor
vessel to capture flow propagation entering the lower plenum. The break location varies
which changes the length of the pipe. This creates a need for different number of
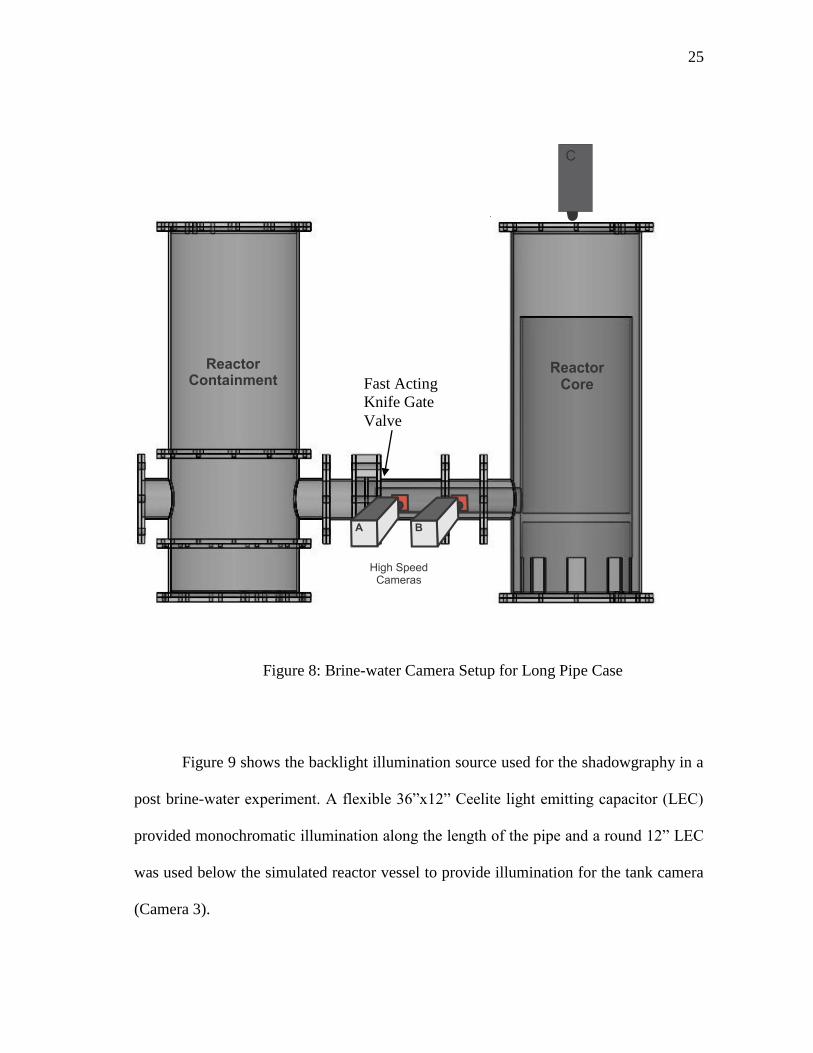
cameras to capture the flow front. Figure 8 shows the camera set-up of the flow
visualization for the brine-water investigation. The camera specifications used for this
investigation are given in Table 2.
Table 2: Camera Specifications
Camera 1 Camera 2 Camera 3
Location Viewing co-annular
pipe from the front
(blue box)
Viewing co-annular
pipe from the front
(red box)
Viewing reactor
vessel lower
plenum from above
Make Vision Research Phantom Vision Research
Model v7.3 Ultima-ATX v7.3
Max. Resolution 800x600 pixels 1024x1024 pixels 800x600 pixels
Frame Rate 6688 2000 6688
Optics Carl Zeiss Makro-Planar T* 2/50
25
Figure 8: Brine-water Camera Setup for Long Pipe Case
Figure 9 shows the backlight illumination source used for the shadowgraphy in a
post brine-water experiment flexible 36”x12” Ceelite light emitting capacitor (LEC)
provided monochromatic illumination along the length of the pipe and a round 12” LEC
was used below the simulated reactor vessel to provide illumination for the tank camera
(Camera 3).
Fast Acting
Knife Gate
Valve

26
Figure 9: Shadowgraphy in a Post Brine-water Experiment
Flow front velocity measurements were conducted using one to two high speed
cameras at the pipe and spreading rate measurements were conducted using one camera
over the simulated reactor tank (light water tank in Fig. 8). Each camera has a known
frame rate (Table 2). Prior to the experiment, the distance from the guillotine break
along the tube is measured and marked. These distance measurements are used to
measure the wave front travel as it propagates down the tube. With the use of image
27
processing software, the change in distance of the wave front is correlated with the
number of frames to determine the wave front travel time. The comparison of the travel
time with the travel distance along the tube provides the wave front velocity.
5.2.2 Particle Image Velocimetry (PIV) Technique, Setup, and Flow Measurement
Particle Image Velocimetry (PIV) is a non-intrusive optical measurement
technique that provides full-field quantitative and qualitative information of the flow
with high spatial and temporal resolution. The measuring principle is based on the fact
that instantaneous fluid velocities can be measured by recording the position of images
produced by small tracers suspended in the fluid, at successive time increments.
PIV methods inherently measure the Lagrangian velocities of the tracer particles
[16]. The underlying assumption is that these tracer particles closely follow the fluid
motion with minimal lag. This assumption holds true for a wide variety of flows of
interest, provided that the tracers are small enough and/or their density approaches that
of the fluid. To improve measurement accuracy of the flow velocity, PIV needs a high
concentration of tracers with the measurement of the "local" fluid velocity being
obtained from an average over many tracers contained in a measurement volume.
Experiments were performed in a specially designed small test facility that
allowed the measurement of the velocity and the temperature during stratifications and
as a result evaluate the inflow/outflow behavior through the broken duct. The
experimental setup for PIV investigations of gas-gas scenarios is seen in Fig. 10. The
visualization system consisted of particles flow tracers, a high-speed high-resolution
camera, a high-power laser, a continuous halogen lamp, mirrors, translational stages, and

28
lenses. These experiments provided full-field data of velocity with a high degree of
spatial and temporal resolution. The analysis of the data provided an understanding of
the fundamental flow features which could lead to improved CFD models the air ingress
scenario.
Figure 10: Gas-gas Investigation Camera Setup for Long Pipe Case

29
6. UNCERTAINTY
6.1 Experimental Uncertainty
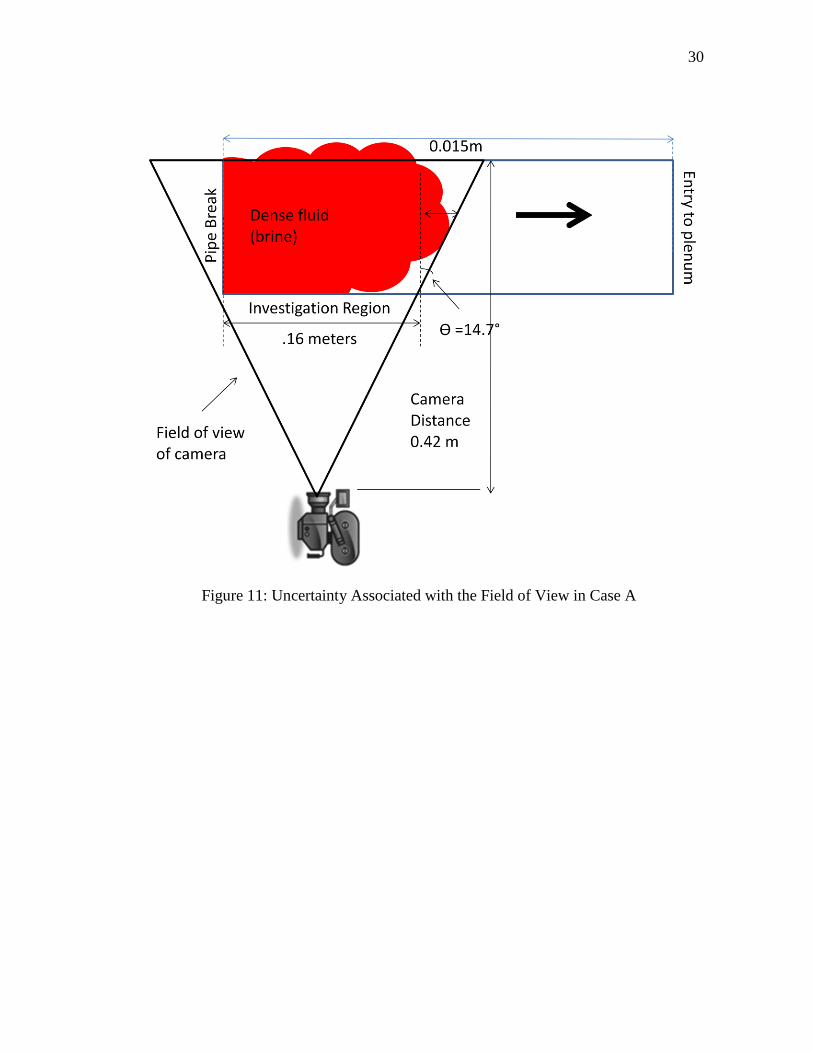
This section identifies uncertainties associated with field of view errors in the
flow visualization investigations. For both case A and case B, uncertainties arise when
measuring flow front velocity. The cameras are lined up to catch the flow after the pipe
break and the flow as it propagates down the investigation region of the pipe (these
investigation regions are different for both cases and are specified in Figs. 11 and 12).
The cameras are aligned to the edge of the pipe and measurements of the flow front
occur from the middle of the pipe. Therefore the maximum uncertainty occurs at the
edge of the pipe where the flow front is at the widest angle.
Uncertainty measurements were calculated by measuring the angle projected by
the field of view and the pipe. This angle was then used to calculate the skewed length
from where the flow front measurements are taken place. The maximum uncertainty is
calculated using Eq. (7).
Max ncert kewed Region
Investigation Region kewed Region (7)
Schematics of these uncertainty measurements are seen in Fig. 11 and 12.
30
Figure 11: Uncertainty Associated with the Field of View in Case A

31
Figure 12: Uncertainty Associated with the Field of View in Case B
Case A was found to have a maximum uncertainty of 4.29% due to the angle of
14.7° skewed angle. Case B utilized two cameras which both have their own uncertainty
associated with the angle. Case B was found to have a maximum uncertainty of 1.8%
and 1.89% respectively of the two cameras due to the skewed angles of the two cameras
used. These two uncertainties for Case B were combined to get the maximum

32
uncertainty of 3.69%. All of the uncertainties were propagated to the velocity
calculations.
6.2 PIV Seeding Tracer Particle Uncertainty
On the PIV measurements, a source of error is induced by gravitational forces if
tracer particles‟ density differs largely from that of the fluid. An indication whether
gravitational forces becomes important can be obtained from Stokes drag law [17], from
which the gravitational induced velocity Ug is given by
g dp2 (ρp-ρ)
18μg (8)
where dp and ρp are diameter and density of the particles, ρ and μ are the density and
dynamic viscosity of the fluid, and g is the gravitational acceleration. In the PIV
investigation for air ingress seen in this work, sulfur hexafluoride (SF6) is the gas used
for the working fluid and zinc stearate as the tracer particle used to monitor its flow
through the tube. The large density difference is the main drive for this initial
calculation. In this investigation the fluid density gradient induced a maximum
gravitational velocity of Ug=50 μm/s in comparison to the initial calculation using the
Benjamin equation of 1.29 m/s flow speed of the SF6 gas. Therefore the influence of
fluid density changes on velocity estimation can be neglected.

33
7. RESULTS AND DISCUSSION
The flowing section describes separate effect experiments for understanding
stratified flow phenomena in the air ingress accident scenario and the data generated for
validation of CFD codes. The experiment investigates density driven stratified flow in an
air ingress scenario following a double ended guillotine break (DEGB) of the large pipe
connecting the reactor and the steam generator.
Three investigations were performed to develop an understanding of this
stratified flow phenomenon: two liquid-liquid investigations using shadowgraphy to
study the effects of varying pipe break locations and one gas-gas investigation utilizing
PIV. The three experiments investigate the flow front as it propagates though the pipe
after the break. In addition, the lower plenum spreading rate is investigated in the liquid-
liquid scenario.
7.1 Liquid-liquid Air Ingress Investigations
Liquid-liquid investigations are important to help understand important flow
features dominant during an air ingress scenario in the scaled down experimental facility
used in this investigation. The liquids used for this investigation were brine, used as the
heavy working fluid (representing air ingress from reactor containment), and water as
the light working fluid (representing the loss of hot coolant from the reactor core). Two
investigations were conducted to investigate the effect of pipe break location. The pipe
break locations are characterized based on the length of coaxial pipe that connects the
34
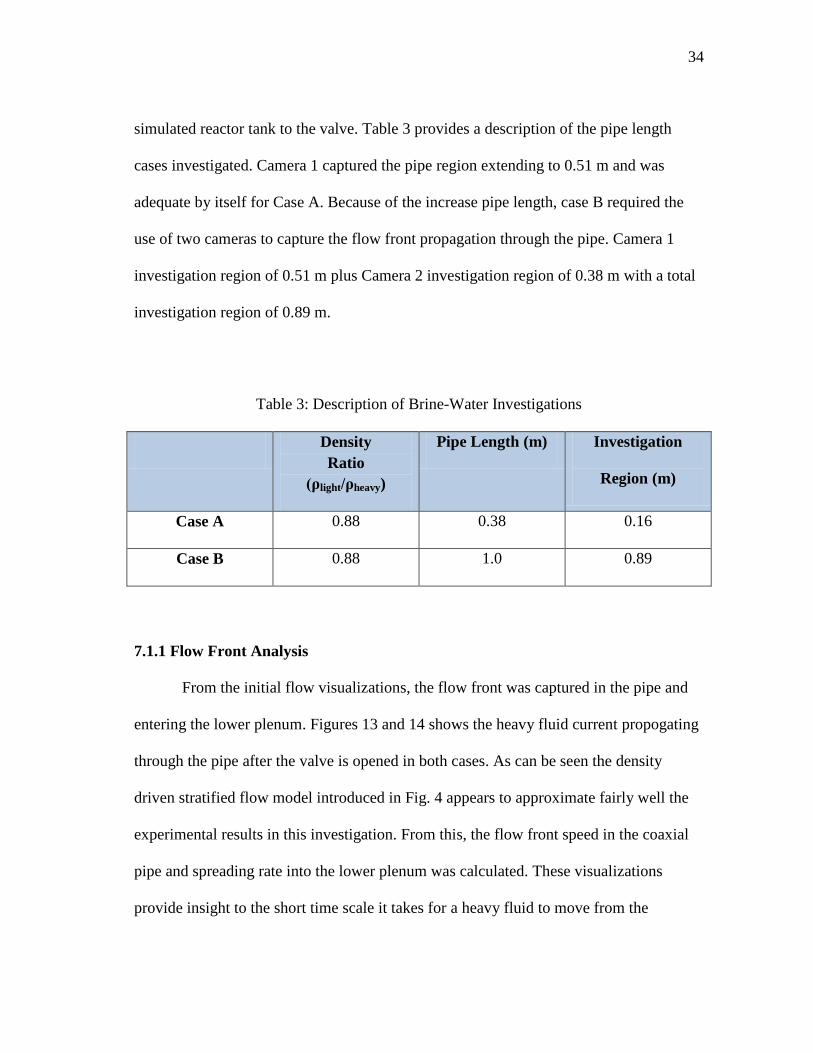
simulated reactor tank to the valve. Table 3 provides a description of the pipe length
cases investigated. Camera 1 captured the pipe region extending to 0.51 m and was
adequate by itself for Case A. Because of the increase pipe length, case B required the
use of two cameras to capture the flow front propagation through the pipe. Camera 1
investigation region of 0.51 m plus Camera 2 investigation region of 0.38 m with a total
investigation region of 0.89 m.
Table 3: Description of Brine-Water Investigations
Density
Ratio
(ρlight/ρheavy)
Pipe Length (m) Investigation
Region (m)
Case A 0.88 0.38 0.16
Case B 0.88 1.0 0.89
7.1.1 Flow Front Analysis
From the initial flow visualizations, the flow front was captured in the pipe and
entering the lower plenum. Figures 13 and 14 shows the heavy fluid current propogating
through the pipe after the valve is opened in both cases. As can be seen the density
driven stratified flow model introduced in Fig. 4 appears to approximate fairly well the
experimental results in this investigation. From this, the flow front speed in the coaxial
pipe and spreading rate into the lower plenum was calculated. These visualizations
provide insight to the short time scale it takes for a heavy fluid to move from the

35
initiated pipe break through the pipe to the reactor and potentially cause an earlier onset
of oxidation (on the order of a tens of seconds).
Figure 13: Progression of Gravity Currents and Stratified Flow in Case A. The Dashed Line Signifies the Inner Pipe Location
36
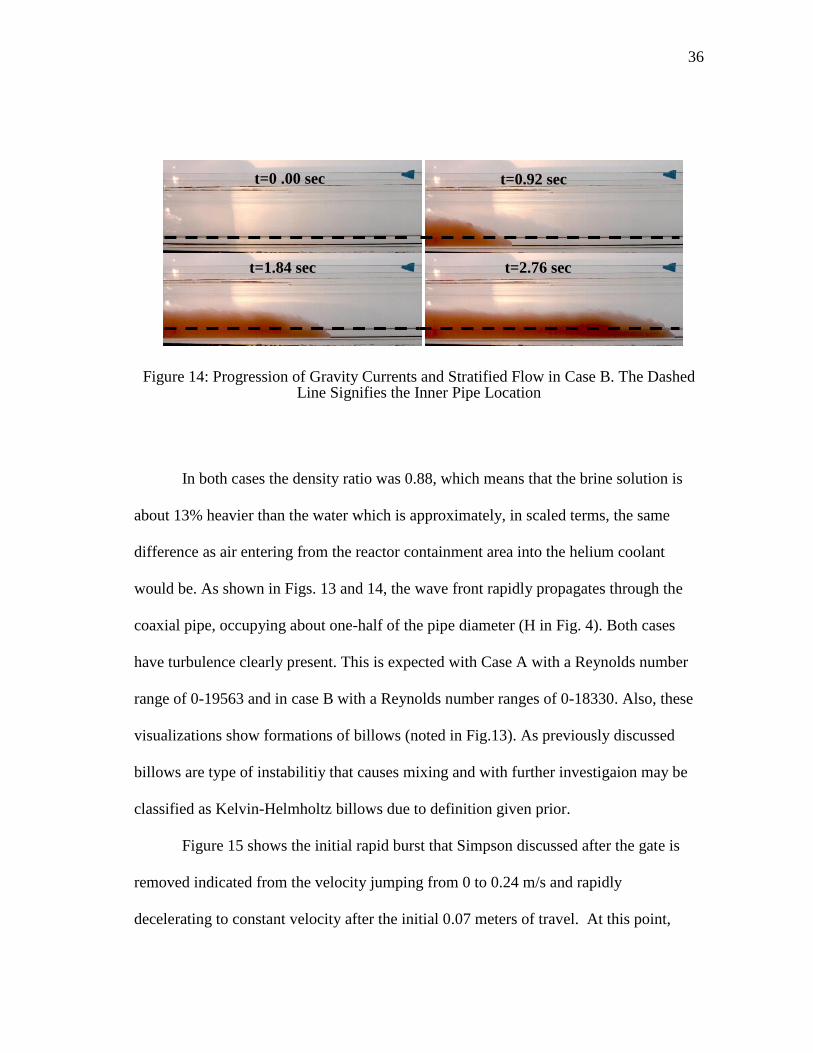
Figure 14: Progression of Gravity Currents and Stratified Flow in Case B. The Dashed Line Signifies the Inner Pipe Location
In both cases the density ratio was 0.88, which means that the brine solution is
about 13% heavier than the water which is approximately, in scaled terms, the same
difference as air entering from the reactor containment area into the helium coolant
would be. As shown in Figs. 13 and 14, the wave front rapidly propagates through the
coaxial pipe, occupying about one-half of the pipe diameter (H in Fig. 4). Both cases
have turbulence clearly present. This is expected with Case A with a Reynolds number
range of 0-19563 and in case B with a Reynolds number ranges of 0-18330. Also, these
visualizations show formations of billows (noted in Fig.13). As previously discussed
billows are type of instabilitiy that causes mixing and with further investigaion may be
classified as Kelvin-Helmholtz billows due to definition given prior.
Figure 15 shows the initial rapid burst that Simpson discussed after the gate is
removed indicated from the velocity jumping from 0 to 0.24 m/s and rapidly
decelerating to constant velocity after the initial 0.07 meters of travel. At this point,
t=0 .00 sec t=0.92 sec
t=1.84 sec t=2.76 sec

37
phase one is initiated as seen with the nearly constant velocity as the fluid propagates in
the axial direction.
Figure 15: Experimental Results for the Pipe Flow Front Velocity versus Location in
Case A
Figure 16 shows the same initial burst for Case B.

38
Figure 16: Experimental Results for the Pipe Flow Front Velocity versus Location in
Case B
The heavy flow front velocity is consistent with the previous observations
reported for the lock exchange flow in the Boussinesq flow regimes following
Benjamin‟s equation [9], Eq. 2. In both previous evaluations, the theoretical heavy flow
front velocity was estimated to be ~0.1608 m/s from Benjamin‟s equation The velocities
are the same for both previous evaluations due to the dependence of Benjamin‟s
equation on the diameter only of the pipe and not on the break location.
Table 4 shows the comparison of the flow front velocities between the current
experimental values and Benjamin‟s theoretical value In both Case A and Case B, the
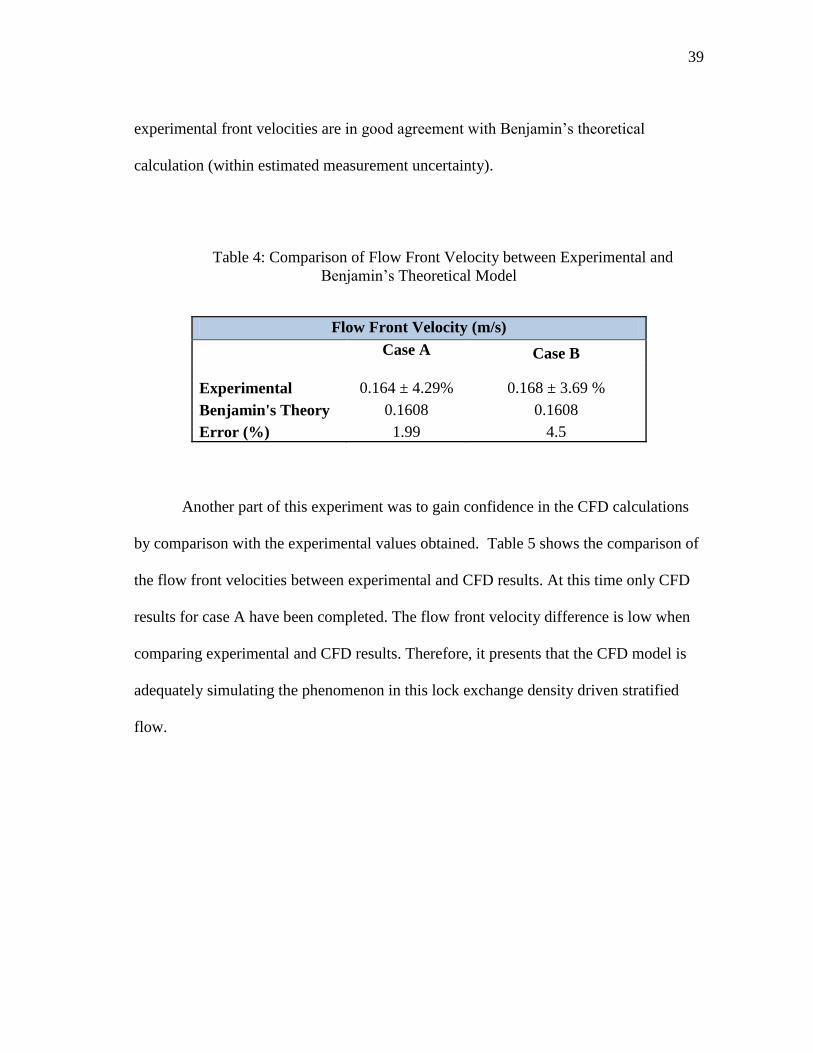
39
experimental front velocities are in good agreement with Benjamin‟s theoretical
calculation (within estimated measurement uncertainty).
Table 4: Comparison of Flow Front Velocity between Experimental and
Benjamin‟s Theoretical Model
Flow Front Velocity (m/s)
Case A Case B
Experimental 0.164 ± 4.29% 0.168 ± 3.69 %
Benjamin's Theory 0.1608 0.1608
Error (%) 1.99 4.5
Another part of this experiment was to gain confidence in the CFD calculations
by comparison with the experimental values obtained. Table 5 shows the comparison of
the flow front velocities between experimental and CFD results. At this time only CFD
results for case A have been completed. The flow front velocity difference is low when
comparing experimental and CFD results. Therefore, it presents that the CFD model is
adequately simulating the phenomenon in this lock exchange density driven stratified
flow.

40
Table 5: Comparison of Flow Front Velocity between Experimental and CFD
Flow Front Velocity (m/s)
Case A Case B
Experimental 0.164 ± 4.29% 0.168 ± 3.69 %
CFD 0.17 TBD
Difference (%) 3.5 NA
Flow front velocity and spreading rate measurements were conducted using high
speed cameras and image processing software. Further analysis was done to measure
change in position of the flow front relative to time and it's velocity as a function of
position. Case A used one camera for the pipe location and one to investigate the lower
plenum (125 frames per second). Case B used two cameras for the pipe location (250 fps
and 300 fps) and one to investigate the lower plenum (150 fps). Flow front velocity
measurements were conducted with the image processing software by using the simple
equation seen in Eq. (9):
V dx
dt (9)
Distance of the investigation area was measured prior to the experiment and the
frame rate is known. Using the image processing software pixels were correlated to
distance covered in a time stamp. This time stamp was calculated by the frame rate of
each camera. The results are seen in Figure 17.
41
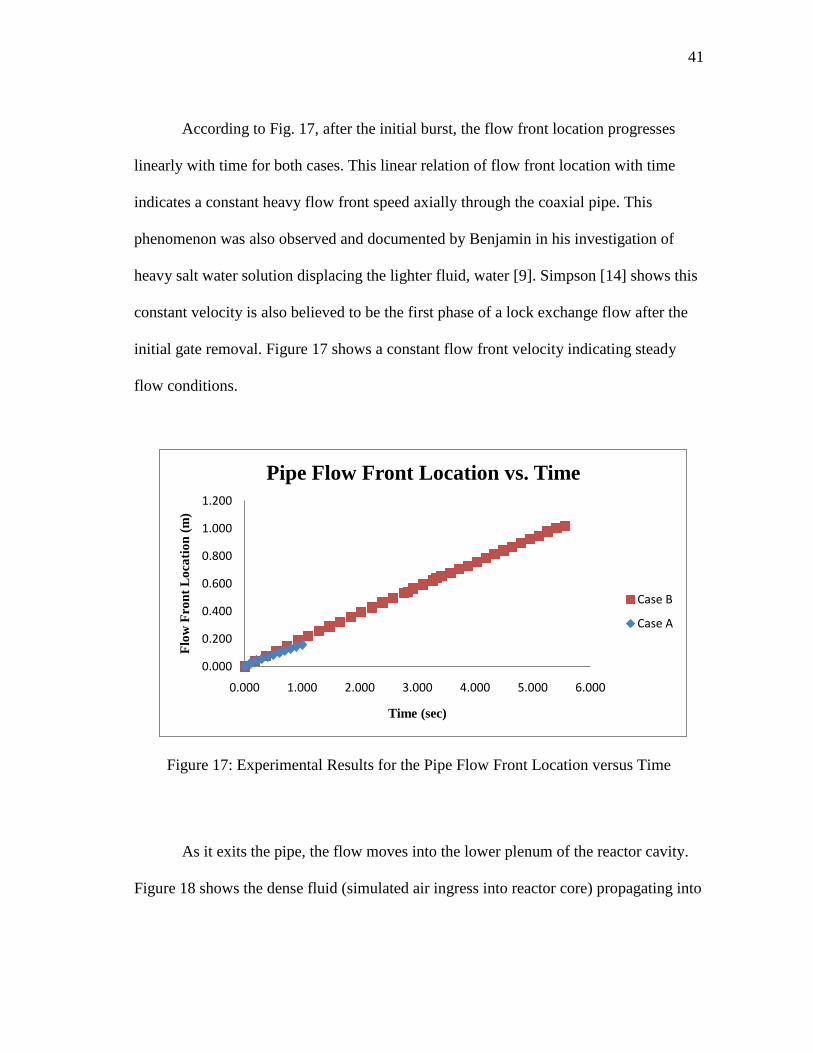
According to Fig. 17, after the initial burst, the flow front location progresses
linearly with time for both cases. This linear relation of flow front location with time
indicates a constant heavy flow front speed axially through the coaxial pipe. This
phenomenon was also observed and documented by Benjamin in his investigation of
heavy salt water solution displacing the lighter fluid, water [9]. Simpson [14] shows this
constant velocity is also believed to be the first phase of a lock exchange flow after the
initial gate removal. Figure 17 shows a constant flow front velocity indicating steady
flow conditions.
Figure 17: Experimental Results for the Pipe Flow Front Location versus Time
As it exits the pipe, the flow moves into the lower plenum of the reactor cavity.
Figure 18 shows the dense fluid (simulated air ingress into reactor core) propagating into
0.000
0.200
0.400
0.600
0.800
1.000
1.200
0.000 1.000 2.000 3.000 4.000 5.000 6.000
Flo
w F
ro
nt
Lo
ca
tio
n (
m)
Time (sec)
Pipe Flow Front Location vs. Time
Case B
Case A

42
the lower plenum from the coaxial pipe. In Fig. 18, the camera is positioned above the
lower plenum and ingress through the hot duct is indicated by flow arrow.
Figure 18: Highly Periodic Interfacial Instabilities between the Brine and Water
Following the initial break, the gravity driven flow spreads into the lower
plenum, creating Kelvin-Helmholtz instabilities at the interface between the heavy and
light flows just after the entrance region The initial folding of waves is indicated by „ ‟
in Fig. 18, which eventually leads to a breaking wave at point „B ‟ In addition to the
Flow
43
formation of a breaking wave pattern, rib vortices are formed transverse to the waves
and move outward towards the edges of the wave as it propagates.
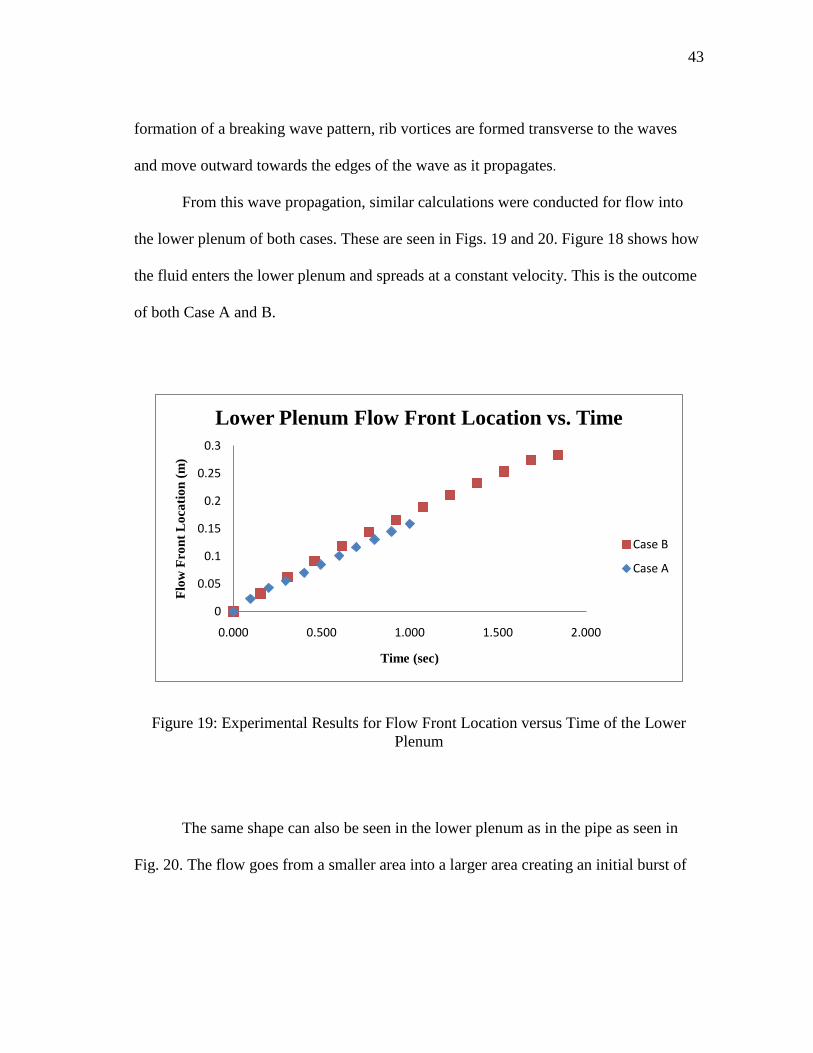
From this wave propagation, similar calculations were conducted for flow into
the lower plenum of both cases. These are seen in Figs. 19 and 20. Figure 18 shows how
the fluid enters the lower plenum and spreads at a constant velocity. This is the outcome
of both Case A and B.
Figure 19: Experimental Results for Flow Front Location versus Time of the Lower
Plenum
The same shape can also be seen in the lower plenum as in the pipe as seen in
Fig. 20. The flow goes from a smaller area into a larger area creating an initial burst of
0
0.05
0.1
0.15
0.2
0.25
0.3
0.000 0.500 1.000 1.500 2.000
Flo
w F
ron
t L
oca
tio
n (
m)
Time (sec)
Lower Plenum Flow Front Location vs. Time
Case B
Case A
44
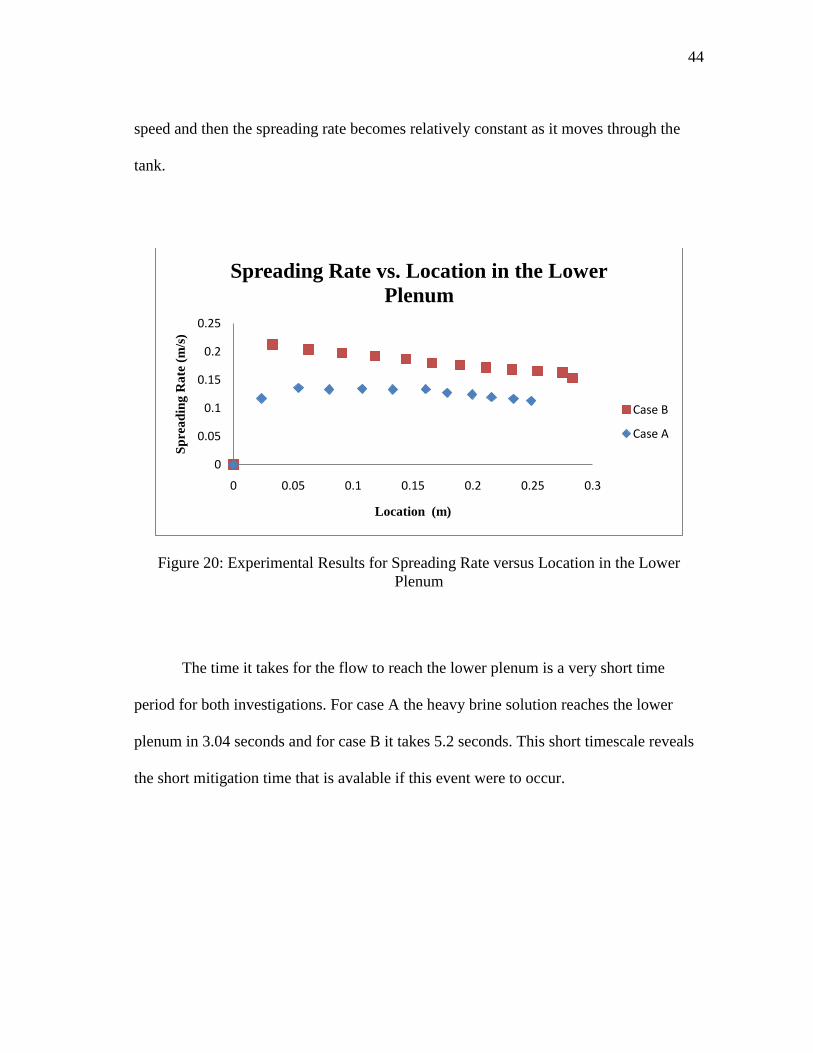
speed and then the spreading rate becomes relatively constant as it moves through the
tank.
Figure 20: Experimental Results for Spreading Rate versus Location in the Lower
Plenum
The time it takes for the flow to reach the lower plenum is a very short time
period for both investigations. For case A the heavy brine solution reaches the lower
plenum in 3.04 seconds and for case B it takes 5.2 seconds. This short timescale reveals
the short mitigation time that is avalable if this event were to occur.
0
0.05
0.1
0.15
0.2
0.25
0 0.05 0.1 0.15 0.2 0.25 0.3
Sp
rea
din
g R
ate
(m
/s)
Location (m)
Spreading Rate vs. Location in the Lower
Plenum
Case B
Case A
45
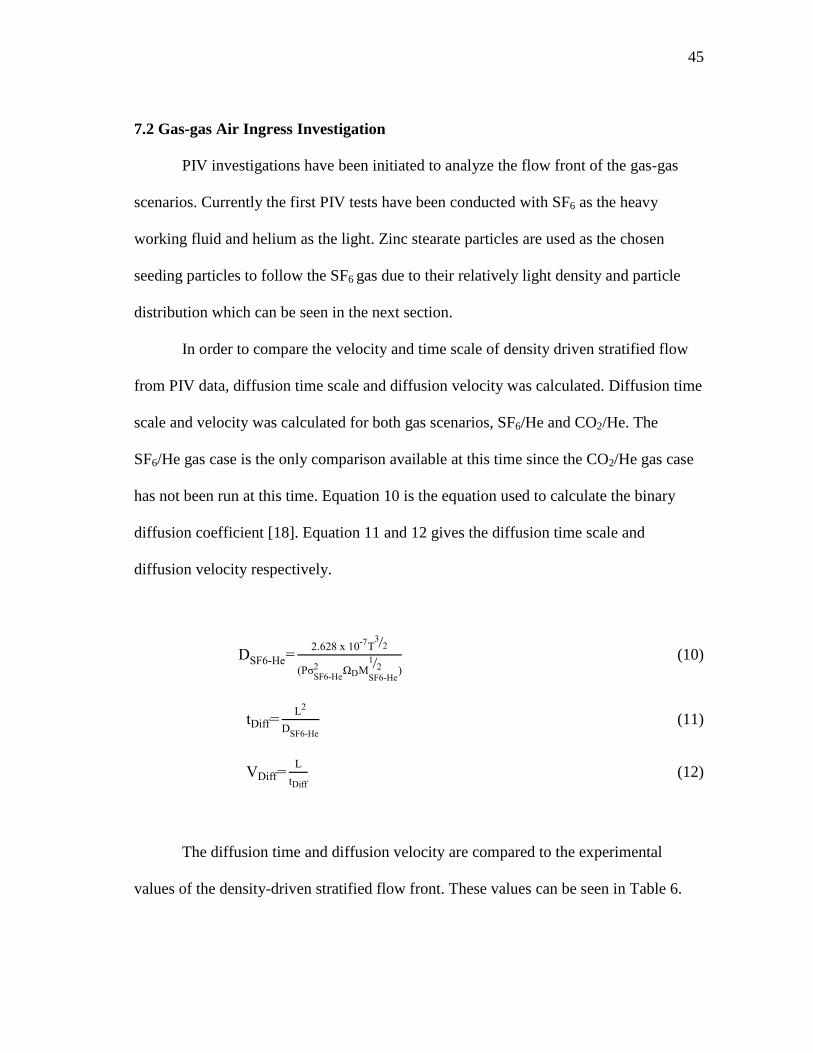
7.2 Gas-gas Air Ingress Investigation
PIV investigations have been initiated to analyze the flow front of the gas-gas
scenarios. Currently the first PIV tests have been conducted with SF6 as the heavy
working fluid and helium as the light. Zinc stearate particles are used as the chosen
seeding particles to follow the SF6 gas due to their relatively light density and particle
distribution which can be seen in the next section.
In order to compare the velocity and time scale of density driven stratified flow
from PIV data, diffusion time scale and diffusion velocity was calculated. Diffusion time
scale and velocity was calculated for both gas scenarios, SF6/He and CO2/He. The
SF6/He gas case is the only comparison available at this time since the CO2/He gas case
has not been run at this time. Equation 10 is the equation used to calculate the binary
diffusion coefficient [18]. Equation 11 and 12 gives the diffusion time scale and
diffusion velocity respectively.
D F6-He 2 628 x 10
-7T32
(Pσ F6-He2 ΩDM
F6-He
12 )
(10)
tDiff L2
D F6-He
(11)
VDiff L
tDiff (12)
The diffusion time and diffusion velocity are compared to the experimental
values of the density-driven stratified flow front. These values can be seen in Table 6.

46
The heavy flow front of the density-driven stratified flow was measured from the PIV
data. This velocity is two orders of magnitude larger than the diffusion velocity. This
shows the differing importance of the two mechanisms and the reason density-driven
stratified flow needs to be investigated.
Table 6: Comparison of Diffusion Velocity to Density-driven Stratified Flow
SF6-He CO2-He
tDiff (s) 195.4 141.1
VDiff (m/s) 0.0046 0.0063
uHeavy (m/s) 0.31 ----
7.2.1 PIV Seeding Analysis
An important factor in PIV is the ability of the seeding particles, or tracer
particles, to move with the flow. Thus, the selection of particles is key to ensure an
accurate representation of the flow features present in the air ingress scenario. Zinc
stearate seeding particles were chosen based on particle size distribution and density.
The average particle size is ~2 µm with a density of 400 kg/m3.
It is important to ensure that particles are the particular size obtained from the
manufacturers. Normally a manufacturer gives the particle diameter according to the
largest particle diameter but not the distribution. It is important to know the distribution
of the particles to ensure the correct particles are chosen.
Particle size distributions of various manufacture samples were performed using
a TSI Aerodynamic Particle Sizer (APS model number 3321) to ensure the particles
47
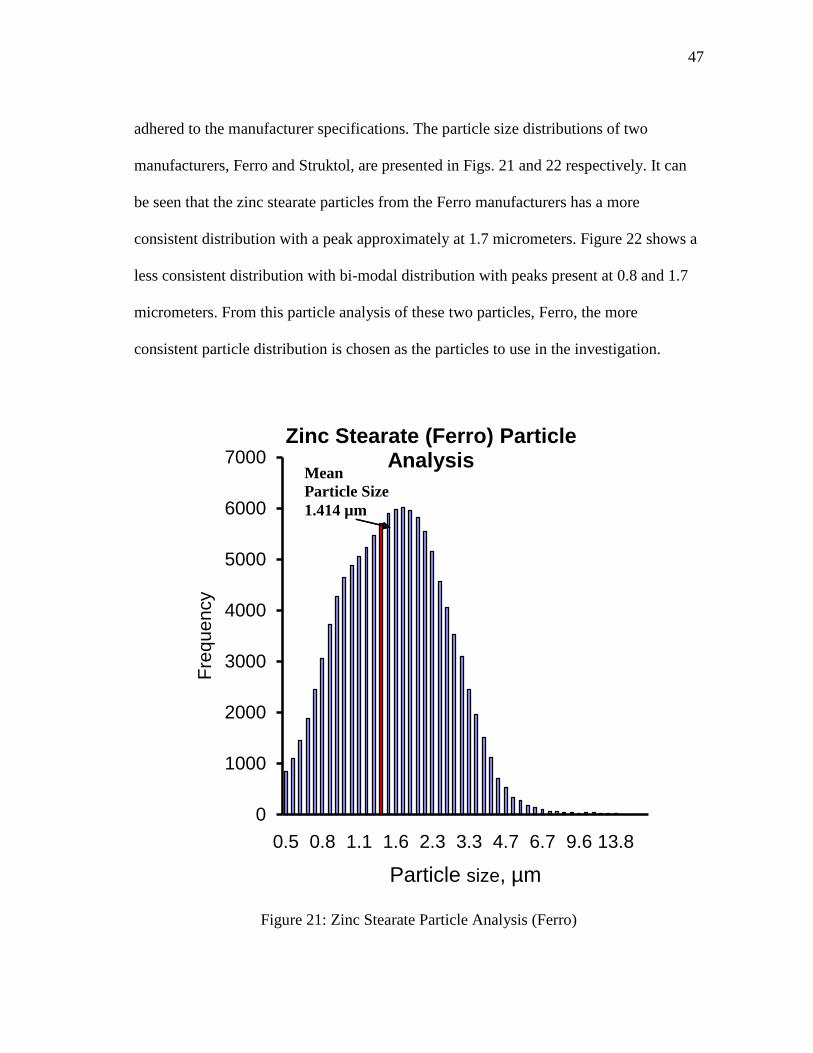
adhered to the manufacturer specifications. The particle size distributions of two
manufacturers, Ferro and Struktol, are presented in Figs. 21 and 22 respectively. It can
be seen that the zinc stearate particles from the Ferro manufacturers has a more
consistent distribution with a peak approximately at 1.7 micrometers. Figure 22 shows a
less consistent distribution with bi-modal distribution with peaks present at 0.8 and 1.7
micrometers. From this particle analysis of these two particles, Ferro, the more
consistent particle distribution is chosen as the particles to use in the investigation.
Figure 21: Zinc Stearate Particle Analysis (Ferro)
0
1000
2000
3000
4000
5000
6000
7000
0.5 0.8 1.1 1.6 2.3 3.3 4.7 6.7 9.6 13.8
Fre
qu
en
cy
Particle size, µm
Zinc Stearate (Ferro) Particle Analysis
Mean
Particle Size
1.414 µm

48
Figure 22: Zinc Stearate Particle Analysis (Struktol)
0
5000
10000
15000
20000
25000
0.5 0.8 1.1 1.6 2.3 3.3 4.7 6.7 9.613.8
Fre
qu
ency
Particle size, µm
Zinc Stearate (Struktol) Particle Analysis
Mean
Particle Size
1.135 µm

49
8. FUTURE WORK
Future work will include more detailed investigations of the gas to gas cases that
are presented. This will include furthering investigations with current SF6 and He to look
at different areas of areas of interest of the pipe location. Another interest will be
incorporating Laser Induced Fluorescence (LIF) to capture full-field velocity
concentration profiles of the gases used in addition to the current PIV. Hot-wire
anemometers will also be inserted into the duct and the tanks to obtain local velocity
values to correlate back to the PIV data for validation. Once these investigation
techniques are employed in the first gas case, and then the other gas case, carbon dioxide
and helium, presented in Table 1, will be investigated in order to obtain a full catalog of
information regarding this accident scenario.
50
9. SUMMARY AND CONCLUSIONS
Due to the differing time scales of interaction, the air ingress mechanism,
whether it is dominated by diffusion or density-driven stratified flow need to be verified.
Air ingress could possibly result in oxidation of in-core graphite structures and fuel,
potentially collapsing the bottom structures of the core and releasing fission products
and hazardous levels of carbon monoxide [2]. The shorter the time scale indicated by the
density driven stratified flow causes a faster onset of natural circulation leading to earlier
graphite oxidation. This earlier onset of oxidation provides less time for outside
mitigation.
From the experimental investigation, the gravity driven ingress mechanism is
verified as being a shorter time scale by using selected fluids. Brine was used as the
heavy fluid and water as the light with a density ratio of 0.88. The experiment shows
stratification of the two fluids. The flow front analysis for the coaxial pipe is in
agreement with Benjamin‟s theoretical value and with CFD results.
The time it takes for the flow to reach the lower plenum is a very short time
period for both investigations. Both cases results in the heavy fluid entering the lower
plenum in under 6 seconds. This short timescale reveals the short mitigation time that is
avalable if this event were to occur.
The diffusion velocity and heavy flow front of the stratified flow layer were
compared for the SF6/He gas case. It is seen that the diffusion plays less of a role as the
transport mechanism in comparison to the density-driven stratified flow since the

51
velocity of the diffusion is two orders of magnitude smaller than the velocity of the
stratified flow mechanism. This is the reason for the need for density-driven stratified
flow investigations following a LOCA.
52
REFERENCES
[1] U.S. DOE Nuclear Energy Research Advisory Committee and the Generation IV
International Forum, 2002, “ Technical Roadmap for Generation IV Nuclear
Energy ystems,” Generation IV International Forum.
[2] Oh, C. H, Kim, E. S., NO, H. C, Cho, N. Z., 2008 “Experimental Validation of
Stratified Flow Phenomena, Graphite Oxidation, and Mitigation Strategies of Air
Ingress Accidents,” INL/EXT-08-14840, Idaho National Laboratory, Idaho Falls,
ID.
[3] Oh, C., Davis, C., Siefken, L., Moore, R., NO, H., Kim, J., Park, G.C., Lee, J., and
Martin, W., 2006, “Development of Safety Analysis Codes and Experimental
Validation for a Very High Temperature Gas-Cooled Reactor,” Final Report,
INL/EXT-06-01362, Idaho National Laboratory, Idaho Falls, ID.
[4] Oh, C., Kim, E., Schultz R., Petti D., 2009, “Computational Fluid Dynamics
nalyses on Very High Temperature Reactor ir Ingress,” ICONE 17-75863 17th
International Conference on Nuclear Engineering, July 12-16, Brussels, Belgium.
[5] Oh, C H, Kim, E , chultz, R , Petti, D , and Liou, C P , 2008, “Implications of
Air Ingress Induced by Density-Difference Driven tratified Flow,” 8023,
International Congress on Advances in Nuclear Power Plants, pp. 313-322.
[6] Schultz, R., Nigg, D., Johnson, R., Oh, C., Johnsen, G., 2006, “Next Generation
Nuclear Plant Methods Technical Program Plan,” INL/EXT-06-11804, Rev 0.26,
Idaho National Laboratory, Idaho Falls, ID.

53
[7] Williams, B., Liou, C., Schultz, R., Kadakia, H., Phoenix, B., Horrocks, D., 2007,
“Providing the Basis for Innovative Improvements in dvanced LWR Reactor
Passive afety ystems Design: n Educational R&D Project,” Idaho tate niv
Pocatello, ID, Final Report-DE-FG07-03ID14500.
[8] Oh, C H and Kim, E , 2010, “Isothermal Air Ingress Validation Experiments at
Idaho National Laboratory: Description and ummary of Data,” INL/EXT-10-
19727, Idaho National Laboratory, Idaho Falls, ID.
[9] Benjamin, T B , 1968, “Gravity Currents and Related Phenomena,” J. Fluid
Mechanics, 31, pp. 209–248.
[10] Duncan, J. B., and H. L. Toor, 1962, "An Experimental Study of Three Component
Gas Diffusion," A.I.Ch.E. Journal, 8, pp. 1-38.
[11] Lakehal, D., Lemonnier, H., 2003, “Test-case Number 28: The Lock-Exchange
Flow,” Nuclear Engineering Laboratory, Zurich, Switzerland, March 17, 2003.
[12] Shin, J.O., Dalziel, S. B., Linden, P.F., 2004, “Gravity Currents Produced by Lock
Exchange,” J Fluid Mech 521, pp. 1-34.
[13] Simpson, J. S., 1997, “Chapter 11: The Anatomy of a Gravity Current and Chapter
12 Spread of Dense Fluid,” Gravity Currents in the Environment and the
Laboratory, 2nd Edn. Cambridge University Press, Cambridge, UK.
[14] Turner, J.S., 1973, Buoyancy Effects in Fluids, Cambridge Monographs on
Mechanics and Applied Mathematics. Cambridge University Press, Cambridge,
UK, pp. 70–74.
[15] Parsons, J., “Conservative Gravity Currents,” Ocean Engineering, University of

54
Washington, Seattle, WA.
[16] Adrian, R., 1991, “Particle-Imaging Techniques for Experimental Fluid
Mechanics,” nnu Rev. Fluid Mech., 23, pp. 261-304.
[17] Riethmuller, M.L., 2000, “Particle Image Velocimetry and Associated
Techniques,” von Karman Institute for Fluid Dynamics, Genese, Belgium.
[18] Annamalai, K. and Puri, I.K., 2007, “Chapter 6: Mass Transfer,” Combustion
Science and Engineering, CRC Press, Boca Raton, FL.
55
VITA
Name: Jessica Lauren Hartley
Address: Department of Mechanical Engineering
c/o Dr. Yassin Hassan
Texas A & M University
College Station, TX 77843-3133
Email Address: [email protected]
Education: B.S., Mechanical Engineering, West Texas A&M University, 2009
M.S., Mechanical Engineering, Texas A&M University, 2011