dowduponts21.q4cdn.com/813101928/files/doc_financials/2017/q4/4q...safe harbor statement regulation...
TRANSCRIPT

DowDuPont4Q17 Earnings Conference Call
February 1, 2018

Safe Harbor Statement
Regulation G
This presentation includes information that does not conform to U.S. GAAP and are considered non-GAAP measures. These measures include the Company's pro forma consolidated
results and pro forma earnings per share on an adjusted basis, which excludes the after-tax impact of pro forma significant items and the after-tax impact of pro forma amortization
expense associated with DuPont's intangible assets. Management uses these measures internally for planning, forecasting and evaluating the performance of the Company's
segments, including allocating resources. DowDuPont's management believes that these non-GAAP measures best reflect the ongoing performance of the Company during the periods
presented and provide more relevant and meaningful information to investors as they provide insight with respect to ongoing operating results of the Company and a more useful
comparison of year-over-year results. These non-GAAP measures supplement the Company's U.S. GAAP disclosures and should not be viewed as an alternative to U.S. GAAP
measures of performance. Furthermore, such non-GAAP measures may not be consistent with similar measures provided or used by other companies. Reconciliations of non-GAAP
measures to GAAP are provided in the financial schedules attached to the earnings news release and the Investor Relations section of the Company’s website. DowDuPont does not
provide forward-looking GAAP financial measures or a reconciliation of forward-looking non-GAAP financial measures to the most comparable GAAP financial measures on a forward-
looking basis because the Company is unable to predict with reasonable certainty the ultimate outcome of pending litigation, unusual gains and losses, foreign currency exchange gains
or losses, potential future asset impairments and purchase accounting fair value adjustments, as well as discrete taxable events, without unreasonable effort. These items are
uncertain, depend on various factors, and could have a material impact on GAAP results for the guidance period.
Operating EBITDA is defined as earnings (i.e.,” Income (loss) from continuing operations before income taxes”) before interest, depreciation, amortization and foreign exchange gains
(losses), excluding significant items. Pro forma Operating EBITDA is defined as pro forma earnings (i.e., pro forma “Income (loss) from continuing operations before income taxes”)
before interest, depreciation, amortization and foreign exchange gains (losses), excluding the impact of adjusted significant items.
Adjusted EPS is defined as “Loss per common share from continuing operations – diluted” excluding the after-tax impact of significant items and the after-tax impact of amortization
expense associated with DuPont’s intangible assets. Pro forma Adjusted EPS is defined as “Pro forma loss per common share from continuing operations – diluted” excluding the
after-tax impact of pro forma significant items and the after-tax impact of pro forma amortization expense associated with DuPont’s intangible assets. Full year and prior year
information is on a pro forma basis and was determined in accordance with Article 11 of Regulation S-X
Cautionary Statement about Forward-Looking Statements
This communication contains “forward-looking statements” within the meaning of the federal securities laws, including Section 27A of the Securities Act of 1933, as amended, and
Section 21E of the Securities Exchange Act of 1934, as amended. In this context, forward-looking statements often address expected future business and financial performance and
financial condition, and often contain words such as “expect,” “anticipate,” “intend,” “plan,” “believe,” “seek,” “see,” “will,” “would,” “target,” similar expressions, and variations or negatives
of these words.
On December 11, 2015, The Dow Chemical Company (“Dow”) and E. I. du Pont de Nemours and Company (“DuPont”) entered into an Agreement and Plan of Merger, as amended on
March 31, 2017, (the “Merger Agreement”) under which the companies would combine in an all-stock merger of equals transaction (the “Merger Transaction”). Effective August 31,
2017, the Merger Transaction was completed and each of Dow and DuPont became subsidiaries of DowDuPont Inc. (“DowDuPont”). For more information, please see each of
DowDuPont’s, Dow’s and DuPont’s latest annual, quarterly and current reports on Forms 10-K, 10-Q and 8-K, as the case may be, and the joint proxy statement/prospectus included in
the registration statement on Form S-4 filed by DowDuPont with the SEC on March 1, 2016 (File No. 333-209869), as last amended on June 7, 2016, and declared effective by the
SEC on June 9, 2016 (the “Registration Statement”) in connection with the Merger Transaction.
2©2018 DowDuPont. All rights reserved.

Safe Harbor Statement, continued
Forward-Looking Statements, continued
Forward-looking statements by their nature address matters that are, to different degrees, uncertain, including the intended separation of DowDuPont’s agriculture, materials science and
specialty products businesses in one or more tax efficient transactions on anticipated terms (the “Intended Business Separations”). Forward-looking statements are not guarantees of
future performance and are based on certain assumptions and expectations of future events which may not be realized. Forward-looking statements also involve risks and uncertainties,
many of which are beyond the company’s control. Some of the important factors that could cause DowDuPont’s, Dow’s or DuPont’s actual results to differ materially from those projected in
any such forward-looking statements include, but are not limited to: (i) successful integration of the respective agriculture, materials science and specialty products businesses of Dow and
DuPont, including anticipated tax treatment, unforeseen liabilities, future capital expenditures, revenues, expenses, earnings, productivity actions, economic performance, indebtedness,
financial condition, losses, future prospects, business and management strategies for the management, expansion and growth of the combined operations; (ii) impact of the divestitures
required as a condition to consummation of the Merger Transaction as well as other conditional commitments; (iii) achievement of the anticipated synergies by DowDuPont’s agriculture,
materials science and specialty products businesses; (iv) risks associated with the Intended Business Separations, including those that may result from the comprehensive portfolio review
undertaken by the DowDuPont board, changes and timing, including a number of conditions which could delay, prevent or otherwise adversely affect the proposed transactions, including
possible issues or delays in obtaining required regulatory approvals or clearances related to the Intended Business Separations, disruptions in the financial markets or other potential
barriers; (v) the risk that disruptions from the Intended Business Separations will harm DowDuPont’s business (either directly or as conducted by and through Dow or DuPont), including
current plans and operations; (vi) the ability to retain and hire key personnel; (vii) potential adverse reactions or changes to business relationships resulting from the completion of the
merger or the Intended Business Separations; (viii) uncertainty as to the long-term value of DowDuPont common stock; (ix) continued availability of capital and financing and rating agency
actions; (x) legislative, regulatory and economic developments; (xi) potential business uncertainty, including changes to existing business relationships, during the pendency of the
Intended Business Separations that could affect the company’s financial performance and (xii) unpredictability and severity of catastrophic events, including, but not limited to, acts of
terrorism or outbreak of war or hostilities, as well as management’s response to any of the aforementioned factors.
These risks, as well as other risks associated with the merger and the Intended Business Separations, are more fully discussed in (1) the Registration Statement and (2) the current,
quarterly and annual reports filed with the SEC by DowDuPont and to the extent incorporated by reference into the Registration Statement, by Dow and DuPont. While the list of factors
presented here is, and the list of factors presented in the Registration Statement are, considered representative, no such list should be considered to be a complete statement of all
potential risks and uncertainties. Unlisted factors may present significant additional obstacles to the realization of forward-looking statements. Consequences of material differences in
results as compared with those anticipated in the forward-looking statements could include, among other things, business disruption, operational problems, financial loss, legal liability to
third parties and similar risks, any of which could have a material adverse effect on DowDuPont’s, Dow’s or DuPont’s consolidated financial condition, results of operations, credit rating or
liquidity. None of DowDuPont, Dow or DuPont assumes any obligation to publicly provide revisions or updates to any forward-looking statements whether as a result of new information,
future developments or otherwise, should circumstances change, except as otherwise required by securities and other applicable laws.
The Dow Diamond, DuPont Oval logo, DuPont™, the DowDuPont logo and all products, unless otherwise noted, denoted with ™, ℠ or ® are trademarks, service marks or registered
trademarks of The Dow Chemical Company, E. I. du Pont de Nemours and Company, DowDuPont Inc. or their affiliates.
Supplemental unaudited pro forma information for DowDuPont is presented to illustrate the estimated effects of the Merger, assuming that the Merger had been consummated on January
1, 2016. For 2017, activity prior to August 31, 2017 (the “Merger Date”) was prepared on a pro forma basis and activity after the Merger Date was prepared on a combined U.S. GAAP
basis. The unaudited pro forma information was prepared in accordance with Article 11 of Regulation S-X. Pro forma adjustments have been made for (1) the preliminary purchase
accounting impact, (2) accounting policy alignment, (3) eliminate the effect of events that are directly attributable to the Merger Agreement (e.g., one-time transaction costs), (4) eliminate
the impact of transactions between Dow and DuPont, and (5) eliminate the effect of consummated or probable and identifiable divestitures agreed to with certain regulatory agencies as a
condition of approval for the Merger. Events that are not expected to have a continuing impact on the combined results (e.g., inventory step-up costs) are excluded. The unaudited pro
forma information does not reflect restructuring or integration activities or other costs following the Merger that may be incurred to achieve cost or growth synergies of DowDuPont. The
unaudited pro forma financial information provides shareholders with summary financial information and historical data that is on a basis consistent with how DowDuPont reports current
financial information.
3©2018 DowDuPont. All rights reserved.

4Q17 and Full-Year Summary
4©2018 DowDuPont. All rights reserved.
• Delivered strong 4Q17 results
– Sales increased 13%
– Volume rose 6%, well ahead of global GDP
– Operating EBITDA grew 24%
– Adjusted EPS increased 41%
• Sales growth in every operating segment and geography
• Robust full-year¹ growth on a pro forma basis
– Sales increased 12%
– Operating EBITDA grew 15%
– Adjusted EPS increased 22%
1. Full year and prior year information is on a pro forma basis and was determined in accordance with Article 11 of Regulation S-X

• Forms 10
• Complete equity roadshows
• Complete IT systems and
legal entity transitions
• File initial Forms 10
• Begin to deploy IT systems
and stand up legal entities
• Finalize assets and liabilities
by spin
• Finalize agreement terms
• Complete IT design and test
• Establish new legal entities in ~60 countries
• Secure right to operate
• Separate facilities by spin
• Design, test and implement IT systems; transfer IT
system to respective spin
• Set up public company-ready corporate functions,
employees and facilities in each spin
• Assign all assets and liabilities to spins
• Negotiate terms of agreements (site services,
material purchases, IP, separation agreements)
• Finalize capital structures of spins
• Draft, cycle and obtain effectiveness of Forms 10
with the SEC
• Name management teams for intended companies
• Hold equity roadshows
Spins to occur ~14-16 months from today
Materials Science by end of 1Q 2019
Specialty Products formed when Ag separates by June 1, 2019
©2018 DowDuPont. All rights reserved. 5
Anticipated Timeline to Expected SpinsS
ep
ara
tio
n A
cti
vit
ies
Tra
nsa
cti
on
Ac
tivit
ies
3Q19
3Q18
AgCo
Spin
SpecCo
Formed
1Q191Q18
MatCo
Spin

4Q 2017 Financial Highlights1
6
4Q 2017 Pro Forma Adjusted EPS Variance Highlights
• Volume growth in key end-markets, supported by new capacity start-ups
• Cost synergies
• Lower pension/OPEB costs
• Pricing gains and currency tailwinds
• Higher equity earnings led by Sadara
• Lower operational tax rate
• Higher feedstock costs
• Remaining cost and production impact of hurricanes
• Start-up spending on USGC growth projects, primarily for NORDEL™ and LDPE
• Higher interest expense on start up of the growth projects
$0.47
$1.08
4Q
16
Volu
me g
row
th
Cost
synerg
ies
Pensi
on/O
PEB
Marg
in g
row
thfr
om
price
gain
s &
curr
ency
tailw
inds
Equity E
arn
ings
Op. ta
x r
ate
Sta
rt-u
p e
xpense
s&
hurr
icane
impact
Net
Inte
rest
Expense
4Q
17
$0.50
$0.83
$0.59
©2018 DowDuPont. All rights reserved.
1. Prior year net sales and non-GAAP information is on a pro forma basis and was determined in accordance with Article 11 of Regulation S-X.
Financial Performance Snapshot 4Q17 4Q16 B/(W)
Net Sales ($MM) 20,066 17,734 2,332
Operating EBITDA ($MM) 3,938 3,185 753
GAAP EPS from Continuing Operations ($/share) (0.52) (0.03) (0.49)
Adjusted EPS ($/share) 0.83 0.59 0.24

Agriculture: 4Q 2017 and FY 2017 Highlights1
4Q17 4Q16
Net Sales ($MM) 2,787 2,664
Op. EBITDA ($MM) 224 100
Op. EBITDA Margin 8.0% 3.8%
YoY Sales change: Vol +2%, Local Price (1)%
Currency +1%, Port./Other +3%
Fourth Quarter
Full Year
Innovation
• Seed sales of $1.2 billion grew 10% driven by portfolio-related actions, volume
improvement, mainly in EMEA and Argentina, and pricing gains
• Crop Protection sales of $1.6 billion grew 1% driven by increased volumes
primarily in North America, partially offset by decreased local pricing primarily in
Latin America from generic pricing pressure
• Operating EBITDA more than doubled to $224 million from $100 million in the
prior period. Improvements were driven by synergies and other cost reductions,
lower pension/OPEB costs, volume increases and a net portfolio gain
7
Results for Agriculture for the fourth quarter and
full year of 2017 includes $16 million and $28
million of operating EBITDA respectively from a
select portion of Dow AgroSciences’ corn seed
remedy in Brazil for the months of September,
October and November. Results of this business
prior to the Merger were excluded from the pro
forma results, in accordance with Article 11 of
Regulation S-X.
FY17 FY16
Net Sales ($MM) 14,342 14,060
Op. EBITDA ($MM) 2,611 2,322
Op. EBITDA Margin 18.2% 16.5%
YoY Sales change: Vol +1%, Local Price 0%
Currency 0%, Port./Other +1%
• Seed sales of $8.2 billion grew 5% driven by local price improvement enabled by
new products, portfolio-related actions, volume improvement and favorable
currency movement
• Crop Protection sales of $6.1 billion declined 1% as increased new product
volume was more than offset by local pricing declines due to generic pressure
• Pro forma operating EBITDA increased 12% to $2.6 billion due to volume
improvement, synergies, lower pension/OPEB costs and currency. This was
partially offset by lower local pricing and higher soybean royalties
1. Prior year and full-year information is on a pro forma basis and was determined in accordance with Article 11 of
Regulation S-X.
©2018 DowDuPont. All rights reserved.
• Select new products contributing to growth in 2018
• RinskorTM and ArylexTM herbicides
• VessaryaTM and ZorvecTM fungicides
• PyraxaltTM and IsoclastTM insecticides
• EnlistTM corn and cotton
• Pioneer® brand A-series soybeans
2017 Net Sales
Seed Crop Protection
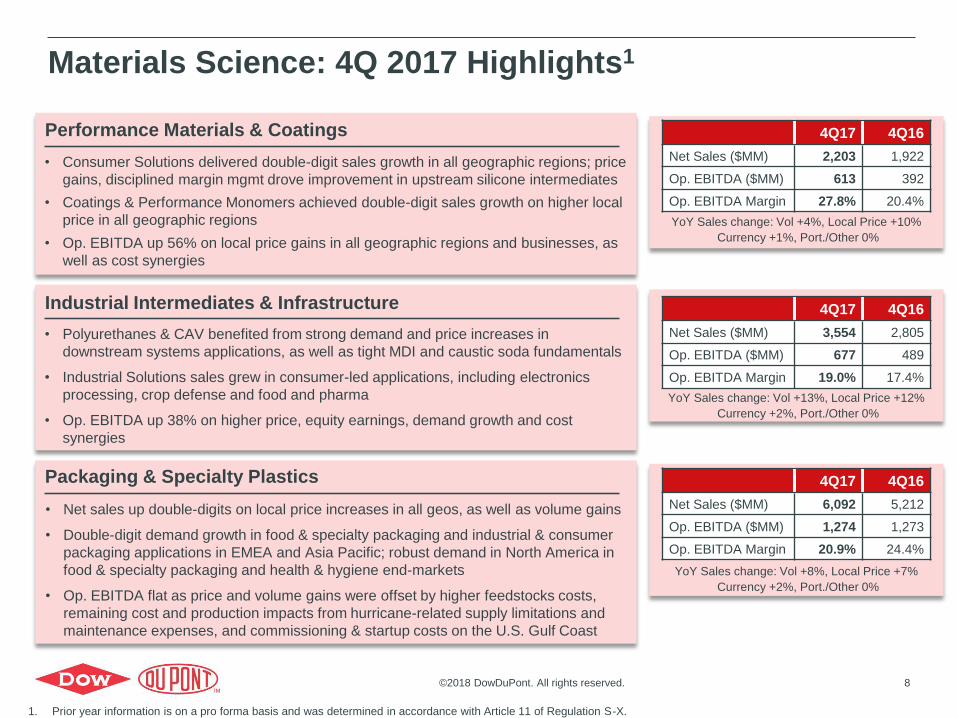
Materials Science: 4Q 2017 Highlights1
Performance Materials & Coatings
Industrial Intermediates & Infrastructure
Packaging & Specialty Plastics
4Q17 4Q16
Net Sales ($MM) 2,203 1,922
Op. EBITDA ($MM) 613 392
Op. EBITDA Margin 27.8% 20.4%
4Q17 4Q16
Net Sales ($MM) 3,554 2,805
Op. EBITDA ($MM) 677 489
Op. EBITDA Margin 19.0% 17.4%
4Q17 4Q16
Net Sales ($MM) 6,092 5,212
Op. EBITDA ($MM) 1,274 1,273
Op. EBITDA Margin 20.9% 24.4%
YoY Sales change: Vol +8%, Local Price +7%
Currency +2%, Port./Other 0%
YoY Sales change: Vol +4%, Local Price +10%
Currency +1%, Port./Other 0%
YoY Sales change: Vol +13%, Local Price +12%
Currency +2%, Port./Other 0%
• Consumer Solutions delivered double-digit sales growth in all geographic regions; price
gains, disciplined margin mgmt drove improvement in upstream silicone intermediates
• Coatings & Performance Monomers achieved double-digit sales growth on higher local
price in all geographic regions
• Op. EBITDA up 56% on local price gains in all geographic regions and businesses, as
well as cost synergies
• Polyurethanes & CAV benefited from strong demand and price increases in
downstream systems applications, as well as tight MDI and caustic soda fundamentals
• Industrial Solutions sales grew in consumer-led applications, including electronics
processing, crop defense and food and pharma
• Op. EBITDA up 38% on higher price, equity earnings, demand growth and cost
synergies
8
• Net sales up double-digits on local price increases in all geos, as well as volume gains
• Double-digit demand growth in food & specialty packaging and industrial & consumer
packaging applications in EMEA and Asia Pacific; robust demand in North America in
food & specialty packaging and health & hygiene end-markets
• Op. EBITDA flat as price and volume gains were offset by higher feedstocks costs,
remaining cost and production impacts from hurricane-related supply limitations and
maintenance expenses, and commissioning & startup costs on the U.S. Gulf Coast
©2018 DowDuPont. All rights reserved.
1. Prior year information is on a pro forma basis and was determined in accordance with Article 11 of Regulation S-X.
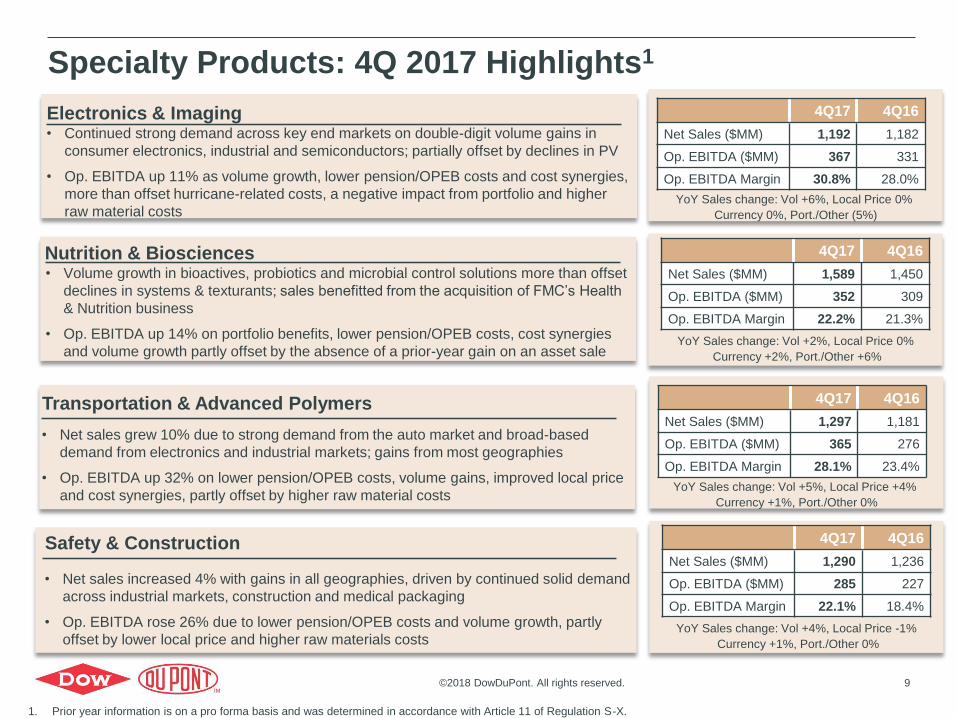
Specialty Products: 4Q 2017 Highlights1
Safety & Construction 4Q17 4Q16
Net Sales ($MM) 1,290 1,236
Op. EBITDA ($MM) 285 227
Op. EBITDA Margin 22.1% 18.4%
YoY Sales change: Vol +4%, Local Price -1%
Currency +1%, Port./Other 0%
Transportation & Advanced Polymers 4Q17 4Q16
Net Sales ($MM) 1,297 1,181
Op. EBITDA ($MM) 365 276
Op. EBITDA Margin 28.1% 23.4%
YoY Sales change: Vol +5%, Local Price +4%
Currency +1%, Port./Other 0%
• Net sales grew 10% due to strong demand from the auto market and broad-based
demand from electronics and industrial markets; gains from most geographies
• Op. EBITDA up 32% on lower pension/OPEB costs, volume gains, improved local price
and cost synergies, partly offset by higher raw material costs
9
• Net sales increased 4% with gains in all geographies, driven by continued solid demand
across industrial markets, construction and medical packaging
• Op. EBITDA rose 26% due to lower pension/OPEB costs and volume growth, partly
offset by lower local price and higher raw materials costs
4Q17 4Q16
Net Sales ($MM) 1,589 1,450
Op. EBITDA ($MM) 352 309
Op. EBITDA Margin 22.2% 21.3%
YoY Sales change: Vol +2%, Local Price 0%
Currency +2%, Port./Other +6%
4Q17 4Q16
Net Sales ($MM) 1,192 1,182
Op. EBITDA ($MM) 367 331
Op. EBITDA Margin 30.8% 28.0%
YoY Sales change: Vol +6%, Local Price 0%
Currency 0%, Port./Other (5%)
• Continued strong demand across key end markets on double-digit volume gains in
consumer electronics, industrial and semiconductors; partially offset by declines in PV
• Op. EBITDA up 11% as volume growth, lower pension/OPEB costs and cost synergies,
more than offset hurricane-related costs, a negative impact from portfolio and higher
raw material costs
• Volume growth in bioactives, probiotics and microbial control solutions more than offset
declines in systems & texturants; sales benefitted from the acquisition of FMC’s Health
& Nutrition business
• Op. EBITDA up 14% on portfolio benefits, lower pension/OPEB costs, cost synergies
and volume growth partly offset by the absence of a prior-year gain on an asset sale
Nutrition & Biosciences
Electronics & Imaging
©2018 DowDuPont. All rights reserved.
1. Prior year information is on a pro forma basis and was determined in accordance with Article 11 of Regulation S-X.

10
©2018 DowDuPont. All rights reserved.
1Q18 Modeling Guidance1
Q1
8
Corporate Segment Operating EBITDA ($175) – ($200)MMOperational Tax Rate(excl. EGL, DuPont Amort. & Sig. Items)
20-23%
D&A (includes the DuPont Amortization expense
below)
$1.4B – $1.5B(includes step-up D&A)
DuPont Non-operating pension/OPEB (included in Op. EBITDA)
~$90 – $100MM credit in
1Q18
DuPont Amortization expense(this is added back while calculating Adj. EPS)
~$320MM pre-taxTaxed at ~21%
Net Interest Expense (net of Interest Income, which is reported in
Sundry Income/Expense line)
$300 – $325MM
Net Income attributable to non-controlling
Interests (reduced from net income)~$45MM Share Count ~2,340MM
Segment Outlook 1Q18 vs. 1Q171 Net Sales Op. EBITDA (incl. Equity Earnings)
Agriculture2 ― Flat first half; 45% of half in 1Q ― Flat first half; 45% of half in 1Q
Performance Materials & Coatings Up mid-single digits percent Up low-single digits percent
Industrial Intermediates & Infrastructure Up mid-twenties percent Up mid-teens percent
Packaging & Specialty Plastics Up low-single digits percent Up mid-single-digits percent
Electronics & Imaging ― Flat Up mid-teens percent
Nutrition & Biosciences Up low-teens percent Up high-teens percent
Transportation & Advanced Polymers Up high-single digits percent Up low-twenties percent
Safety & Construction Up mid-single digits percent Up low-twenties percent
Net Sales: $20.5 - $21.3B up ~2%Net Sales (excl. Ag) up ~8%
Op. EBITDA: $4.6 - $4.8B up ~2%Op. EBITDA (excl. Ag) up ~13%
1 All 1Q17 numbers are on a pro forma basis
2 Ag segment outlook provided for first half. 45% of first half sales and earnings expected to land in the first quarter.
Refer to slide 18 in Appendix for additional commentary on segment outlook
Synergy Savings Realized in 1Q18: $225MM - $275MM YOY

11
©2018 DowDuPont. All rights reserved.
FY18 Modeling GuidanceFY
18
Corporate Segment Operating EBITDA ($725) – ($750)MMOperational Tax Rate(excl. EGL, DuPont Amort. & Sig. Items)
20-23%
D&A (includes the DuPont Amortization expense
below)
$5.6B – $5.8B(includes step-up D&A)
DuPont Non-operating pension /OPEB (included in Op. EBITDA)
$350 - $375MM credit in
FY18
DuPont Amortization expense(this is added back while calculating Adj. EPS)
~$1,250MM pre-taxTaxed at ~21%
Net Interest Expense (net of Interest Income, which is reported in
Sundry Income/Expense line)
$1,300 - $1,350MM
Net Income attributable to non-controlling
Interests (reduced from net income)~$130MM Share Count ~2,335MM
Refer to slide 18 in Appendix for additional commentary on segment outlook
1 All FY17 numbers are on a pro forma basis
Synergy Savings Realized in FY18: ~$1B YOY
Segment Outlook FY18 vs. FY171 Net Sales Op. EBITDA (incl. Equity Earnings)
Agriculture Up mid-single digits percent Up high-teens percent
Performance Materials & Coatings Up mid-single digits percent ― Flat
Industrial Intermediates & Infrastructure Up ~10 percent Up high-single digits percent
Packaging & Specialty Plastics ― Flat Up low-teens percent
Electronics & Imaging Up low-single digits percent Up high-single digits percent
Nutrition & Biosciences Up low-teens percent Up low-twenties percent
Transportation & Advanced Polymers ― Flat Up mid-teens percent
Safety & Construction Up mid-single digits percent Up low-twenties percent
Full-year sales up mid-single digits percent Full-year EPS up mid- to high-teens percent

©2018 DowDuPont. All rights reserved.
Sadara – A Powerful Foundation for Growth
12
Financial Impacts to Materials Science Division
2017Act.
• Product marketing added ~$1.4B of revenue Diluted overall EBITDA margin by ~150 bps
• Equity losses ($452MM) were $65MM fav YoY YoY tailwind in both P&SP and II&I
• Cash contributions down $280MM vs. 2016
2018Est.
• Product marketing adds >$1.5B of revenue YoY
• YoY tailwind to EBITDA of ~$200MM
• Lender Reliability Test (LRT) timing of 4Q18/1H19
ForwardActionPlan
• Execute pathway to ~$400MM avg. annual EBITDA contribution over the cycle Further ramp operating rates Sunset startup, commissioning, LRT activities Product mix improvements
Close proximity to high-growth emerging regions
Powerful feedstock and technology integration
Operations ramping
Market channels and supply chains in place
Dow and Saudi Aramco share a strong partnership and passion for innovation-led growth
13
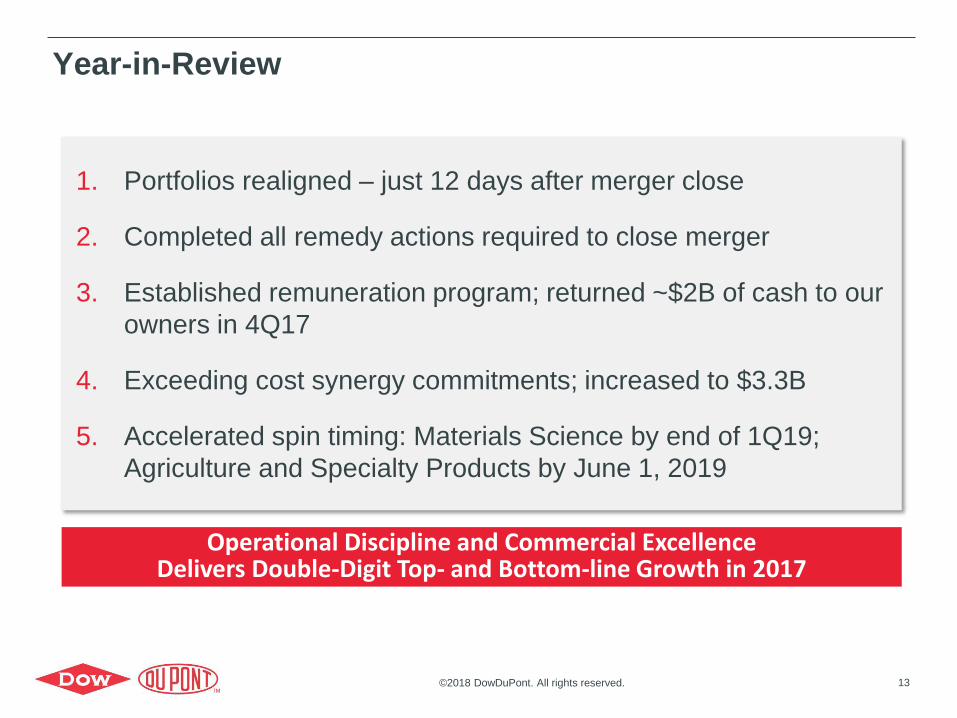
Year-in-Review
Corporate Segment Operating EBITDA ($200) – ($230)MMOperational Tax Rate(excl. EGL, DuPont Amort. & Sig. Items)
24-26%
D&A (includes the DuPont Amortization expense
below)
$1,380 – $1,410MM(includes step-up D&A)
DuPont Non-operating pension
/OPEB2 (included in Op. EBITDA)
~$90 – $110MM credit in
4Q17
DuPont Amortization expense(this is added back while calculating Adj. EPS)
~$270MM pre-taxTaxed at ~32%
Net Interest Expense (net of Interest Income, which is reported in
Sundry Income/Expense line)
$300 – $325MM
Net Income attributable to non-controlling
Interests (reduced from net income)~$30MM Share Count ~2,350MM
Segment Outlook 4Q17 vs. 4Q16 Net Sales Op. EBITDA (incl. Equity Earnings)
Agriculture Up ~10% ~$225MM
Performance Materials & Coatings Up high-single-digits percent Up mid-teens percent
Industrial Intermediates & Infrastructure Up high-teens percent Up 10-11%
Packaging & Specialty Plastics Up ~10% Up low-single-digits percent
Electronics & Imaging Down mid-single-digits percent Up low-single-digits percent
Nutrition & Biosciences Up high-single-digits percent Up 10-11%
Transportation & Advanced Polymers Up mid-single-digits percent Up mid-teens percent
Safety & Construction Up mid-single-digits percent Up low-twenties percent
1. Portfolios realigned – just 12 days after merger close
2. Completed all remedy actions required to close merger
3. Established remuneration program; returned ~$2B of cash to our
owners in 4Q17
4. Exceeding cost synergy commitments; increased to $3.3B
5. Accelerated spin timing: Materials Science by end of 1Q19;
Agriculture and Specialty Products by June 1, 2019
Operational Discipline and Commercial ExcellenceDelivers Double-Digit Top- and Bottom-line Growth in 2017
©2018 DowDuPont. All rights reserved.
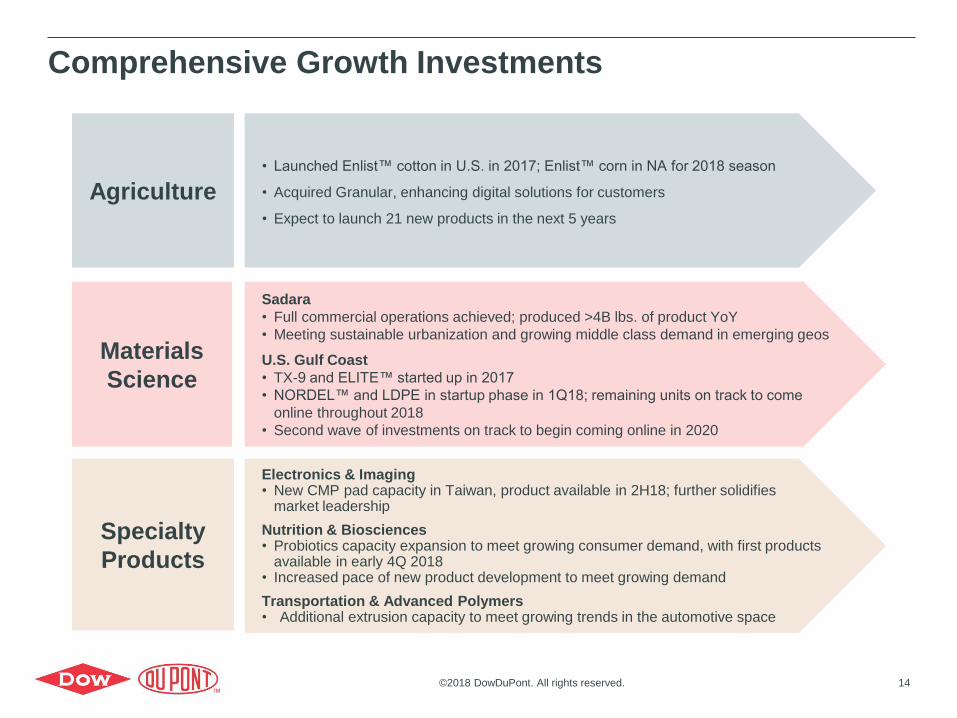
Comprehensive Growth Investments
14
Sadara
• Full commercial operations achieved; produced >4B lbs. of product YoY
• Meeting sustainable urbanization and growing middle class demand in emerging geos
U.S. Gulf Coast
• TX-9 and ELITE™ started up in 2017
• NORDEL™ and LDPE in startup phase in 1Q18; remaining units on track to come
online throughout 2018
• Second wave of investments on track to begin coming online in 2020
• Launched Enlist™ cotton in U.S. in 2017; Enlist™ corn in NA for 2018 season
• Acquired Granular, enhancing digital solutions for customers
• Expect to launch 21 new products in the next 5 years
Electronics & Imaging• New CMP pad capacity in Taiwan, product available in 2H18; further solidifies
market leadership
Nutrition & Biosciences• Probiotics capacity expansion to meet growing consumer demand, with first products
available in early 4Q 2018• Increased pace of new product development to meet growing demand
Transportation & Advanced Polymers• Additional extrusion capacity to meet growing trends in the automotive space
Agriculture
Materials
Science
Specialty
Products
©2018 DowDuPont. All rights reserved.
Outlook
15
• Macros bode well for DowDuPont’s products and technology portfolio
• Ag fundamentals remain soft; self-help cost savings and innovation deliver top-
and bottom-line growth for DowDuPont
• Packaging fundamentals remain healthy globally; measured pace of capacity
adds reduces duration and severity of supply/demand imbalance
Market Outlook
• Global economic expansion gaining momentum – particular strength in
developed economies– Consumer and business confidence; employment/wage growth; manufacturing and
infrastructure investment activity
– Early signs point to U.S. tax reform as catalyst for capital investments
• Sustainable urbanization and growing middle class continues to drive growth in
emerging regions
Macro Outlook
©2018 DowDuPont. All rights reserved.

Priorities Going Forward
16
Deliver operating and financial plan
• Continued focus on earnings, margin and volume growth
• Deliver growth projects, launch innovations and focus on
manufacturing excellence
Achieve synergy commitments
• Achieve enhanced $3.3 billion cost synergy run-rate in 3Q19
• Advance growth synergies playbook
Stand and spin the intended companies
• Complete carve-out activities based on portfolio realignments
• Stand-up each intended company as soon as possible
• Separate Materials Science by end of 1Q19; Agriculture and
Specialty Products by June 1, 2019
1
2
3
©2018 DowDuPont. All rights reserved.


18
1Q18 Segment Expectations
1 1Q17 on a pro forma basis
2 Ag segment expectations provided for
periods beyond 1Q18.
Segments Key Sales and Operating EBITDA Outlook Drivers (1Q18 vs. 1Q171)
Safety & ConstructionSales to be up by the mid-single digits percent on currency and volume gains from Tyvek and filtration. Operating EBITDA
estimated to increase by low-twenties percent on lower pension/OPEB costs, improved plant performance and cost synergies,
partly offset by higher raw material costs.
Transportation &
Advanced Polymers
Sales to rise by the high-single digits percent due to volume gains and local price. Operating EBITDA projected to increase by the
low-twenties percent on gains from volume, currency, synergies and lower pension/OPEB expense.
Nutrition & BiosciencesSales expected to increase low-teens percent on benefits from portfolio-related actions (FMC acquisition), volume growth
and currency. Operating EBITDA expected to grow in the high-teens percent range on benefits from portfolio, volume
growth, lower pension/OPEB costs and cost synergies.
Electronics & ImagingSales expected to be about flat with year-ago period as volume growth will be offset by a negative impact from portfolio-
related actions. Operating EBITDA expected to increase mid-teens percent on volume growth, lower pension/OPEB costs
and cost synergies.
Agriculture2
Full year sales expected to be up mid-single digits percent and full year operating EBITDA expected to be up high-teens
percent driven by new product introductions, cost synergy delivery and lower pension/OPEB costs. First half sales and
operating EBITDA expected to be about equal to last year, which is in line with the estimated corn area planted in North
America in 2018, and reflective of the challenging price environment. Due to timing of seed deliveries, anticipate about 45
percent of the first half results landing in the first quarter and 55 percent landing in the second quarter.
Refer in conjunction with Slide 10
Packaging & Specialty
Plastics
Sales growth supported by new capacity from both the U.S. Gulf Coast & Sadara growth projects. Op. EBITDA up modestly
as earnings contribution from new capacity and pricing gains are partly offset by higher feedstock and continued startup
costs (~40MM in 1Q18). 1Q18 equity earnings expected to improve (up ~$20MM), driven by ramp up in Sadara volume.
Industrial Intermediates
& Infrastructure
Sales and Op. EBITDA growth on pricing momentum and volume gains supported by tight supply-demand fundamentals
partly offset by higher turnaround activity. Isocyanates markets remain tight but with gradual improving supply. Polyol
margins under pressure from higher feedstock costs. 1Q18 equity earnings expected to improve (up ~$30MM), driven by
ramp up in Sadara volume. PDH downtime total impact $60-$80MM headwind (2/3rd in this segment).
Perf. Materials &
Coatings
Sales up on pricing momentum supported by strong market demand. Op. EBITDA expected to increase slightly as improved
volume/mix and pricing gains are partly offset by lower equity earnings (~$50-$60MM decrease due to absence of one time
customer settlement at HSC in 1Q17). 1Q18 HSC total gross equity earnings are expected to be $20-30MM. PDH downtime
total impact $60-$80MM headwind (1/3rd in this segment).
©2018 DowDuPont. All rights reserved.