downer edi limited abn 97 003 872 848 north …2019/08/22 · downer edi limited robert regan...
TRANSCRIPT

Page 1 of 1
22 August 2019
Company Announcements Office ASX Limited Exchange Centre Level 4, 20 Bridge Street SYDNEY NSW 2000
Dear Sir/Madam
Please find attached the following documents:
1. Appendix 4E – results for announcement to the market for the year ended 30 June 2019;
2. 2019 Annual Report;
3. Market release dated 22 August 2019;
4. Investor Presentation; and
5. Appendix 4G – Key to Disclosures Corporate Governance Principles and Recommendations.
Yours sincerely, Downer EDI Limited
Robert Regan Company Secretary
Downer EDI Limited ABN 97 003 872 848
Triniti Business Campus 39 Delhi Road
North Ryde NSW 2113
1800 DOWNER www.downergroup.com
For
per
sona
l use
onl
y

Results for announcement to the marketfor the year ended 30 June 2019
Appendix 4E
2019 2018 % $'m $'m change
Revenue from ordinary activities 12,789.4 12,016.6 Other income 23.3 14.3 Total revenue and other income from ordinary activities 12,812.7 12,030.9 6.5%
Total revenue including joint ventures and other income 13,448.3 12,620.2 6.6%
462.2 204.8 125.7%
532.6 271.5 96.2%
261.8 71.4 266.7%
325.6 117.9 176.2%
2019 2018 % cents cents change
Basic earnings per share 42.9 10.7 300.9%
Diluted earnings per share(i) 42.3 10.7 295.3%
Net tangible asset backing per ordinary share (13.5) 26.0 (151.9%)
(i) At 30 June 2018, the ROADS are deemed anti-dilutive and consequently, diluted EPS remained at 10.7 cents per share.
Dividend 2019 2018Final Final
Dividend per share (cents) 14.0 14.0Franked amount per share (cents) 7.0 7.0Conduit foreign income (CFI) 50% 50%Dividend record date 4/09/2019 30/08/2018Dividend payable date 2/10/2019 27/09/2018
Redeemable Optionally Adjustable Distributing Securities (ROADS)Dividend per ROADS (in Australian cents) 4.18 4.01 New Zealand imputation credit percentage per ROADS 100% 100%
ROADS payment date Quarter 1 Quarter 2 Quarter 3 Quarter 4Instalment date FY2019 17/09/2018 17/12/2018 15/03/2019 17/06/2019Instalment date FY2018 15/09/2017 15/12/2017 15/03/2018 15/06/2018
For commentary on the results for the year and review of operations, please refer to the Directors' Report and separate media release attached.
Earnings before interest and tax
Profit from ordinary activities after tax before amortisation of acquired intangible assets (NPATA)
Downer EDI's Dividend Reinvestment Plan (DRP) has been suspended.
Earnings before interest and tax and amortisation of acquired intangible assets (EBITA)
Profit from ordinary activities after tax attributable to members of the parent entity
For
per
sona
l use
onl
y

Annual Report 2019
For
per
sona
l use
onl
y

This Annual Report includes the Downer EDI Limited Directors’ Report, the Annual Financial Report and Independent Audit Report for the financial year ended 30 June 2019. The Annual Report is available on the Downer website www.downergroup.com.
For
per
sona
l use
onl
y

Annual Report 2019 1
Contents
Highlights
Page 2
Directors’ Report
Page 4
Auditor’s signed reports
Page 53 Auditor’s Independence DeclarationPage 54 Independent Auditor’s Report
Financial Statements
Page 62 Consolidated Statement of Profit or Loss and Other Comprehensive IncomePage 63 Consolidated Statement of Financial PositionPage 64 Consolidated Statement of Changes in EquityPage 65 Consolidated Statement of Cash Flows
Notes to the consolidated financial statements
AAbout this report
Page 66-67
BBusiness performance
Page 68-79
COperating assets and liabilities
Page 80-90
DEmployee benefits
Page 91
ECapital structure and financing
Page 92-99
FGroup structure
Page 100-110
GOther
Page 111-124
B1Segment information
C1Reconciliation of cash and cash equivalents
D1Employee benefits
E1Borrowings
F1Joint arrangements and associate entities
G1New accounting standards
B2Revenue
C2Trade receivables and contract assets
D2Key management personnel compensation
E2Financing facilities
F2Acquisition of businesses
G2Capital and financial risk management
B3Earnings per share
C3Inventories
D3Employee discount share plan
E3Commitments
F3Disposal of business
G3Other financial assets and liabilities
B4Taxation
C4Trade payables and contract liabilities
E4Issued capital
F4Controlled entities
B5Remuneration of auditors
C5Property, plant and equipment
E5Non-controlling interest (NCI)
F5Related party information
B6Subsequent events
C6Intangible assets
E6Reserves
F6Parent entity disclosures
C7Finance lease receivables
E7Dividends
C8Provisions
C9Contingent liabilities
Page 125 Directors’ Declaration
Other information
Page 126 Sustainability Performance Summary 2019Page 131 Corporate GovernancePage 142 Information for Investors
For
per
sona
l use
onl
y

2 Downer EDI Limited
Highlights
Total Revenue
$13,448.3m6.6% increase to
Underlying1 EBITA Margin
4.2%0.4% increase to
$340.1m14.7% increase to
Operating Cash Flow
$630.2m8.0% increase to
Downer’s results for the 2019 financial year featured good revenue growth, a strong increase in earnings, and an improved Group margin. Cash performance remains strong, predictable and reliable with Group cash flow conversion of 89.0% of EBITDA. Statutory NPATA increased from $117.9 million to $325.6 million, while underlying1 NPATA was $340.1 million, 14.7% higher than the prior corresponding period.
1 Underlying EBITA and NPATA are non-IFRS measures that are used by Management to assess the performance of the business. They have been calculated from the statutory measures by adding back the Murra Warra wind farm loss of $45.0 million ($31.5 million after-tax) and deducting the fair value gain on revaluation of the existing interest in the Downer Mouchel JV ($17.0 million; $17.0 million after-tax).
Underlying1 NPATA
For
per
sona
l use
onl
y

Annual Report 2019 3
Urban Services
Mining, Energy and Industrial Services
83% of EBITA 17% of EBITA
76% Revenue5.4% EBITA margin
24% Revenue3.5% EBITA margin
EBITA by Services
Transport 36.8%
Utilities 20.6%
Mining 11.6%
EC&M 5.1%
Facilities 25.9%
TransportUtilitiesFacilities
MiningEngineering, Construction and Maintenance
Urban services now represents 83% of Downer’s EBITA
For
per
sona
l use
onl
y

4 Downer EDI Limited
Directors’ Reportfor the year ended 30 June 2019
The Directors of Downer EDI Limited submit the Annual Financial Report of the Company for the financial year ended 30 June 2019. In compliance with the provisions of the Corporations Act 2001 (Cth), the Directors’ Report is set out below.
Board of Directors
R M HARDING (70)
Chairman since November 2010, Independent Non-executive Director since July 2008
Mr Harding has held management positions around the world with British Petroleum (BP), including President and General Manager of BP Exploration Australia.
Mr Harding is currently the Chairman of Lynas Limited and Horizon Oil Limited and a Director of Cleanaway Waste Management Limited. He is a former Chairman of Roc Oil Company Limited, Clough Limited and ARC Energy Limited and a former Director of Santos Limited.
Mr Harding holds a Masters in Science, majoring in Mechanical Engineering.
Mr Harding lives in Sydney.
G A FENN (54)
Managing Director and Chief Executive Officer since July 2010
Mr Fenn has over 30 years’ experience in operational management, strategic development and financial management. He joined Downer in October 2009 as Chief Financial Officer and was appointed Chief Executive Officer in July 2010.
He was previously a member of the Qantas Executive Committee, holding a number of senior roles over 14 years, as well as Chairman of Star Track Express and a Director of Australian Air Express. He worked at KPMG for eight years before he joined Qantas.
Mr Fenn is currently a Director of Sydney Airport Limited and Spotless Group Holdings Limited and a Member of the UTS Engineering and IT Industry Advisory Board.
Mr Fenn holds a Bachelor of Economics from Macquarie University and is a member of the Australian Institute of Chartered Accountants.
Mr Fenn lives in Sydney.
S A CHAPLAIN (61)
Independent Non-executive Director since July 2008
Ms Chaplain is a former investment banker with extensive experience in public and private sector debt financing. She also has considerable experience as a Non-executive Director of local and state government-owned corporations involved in road, water and port infrastructure.
Ms Chaplain is Chairman of MFF Capital Investments Limited and a Director of Seven Group Holdings Limited and Credible Labs Inc. Ms Chaplain is also Chairman of Canstar Pty Ltd, a financial services research and ratings company and a Director of The Australian Ballet. Her former Board roles include being Chairman of Queensland Airports Limited, a member of the Board of Taxation, a Director of EFIC, Australia’s export credit agency and a Director of PanAust Limited.
A Fellow of the Australian Institute of Company Directors, Ms Chaplain holds a Bachelor of Arts degree majoring in Economics and Mandarin from Griffith University in addition to a Masters of Business Administration (MBA) from the University of Melbourne. She holds an honorary doctorate from Griffith University for her service to banking and finance, and to the Gold Coast community.
Ms Chaplain lives on the Gold Coast.
P S GARLING (65)
Independent Non-executive Director since November 2011
Mr Garling has over 35 years’ experience in the infrastructure, construction, development and investment sectors. He was the Global Head of Infrastructure at AMP Capital Investors, a role he held for nine years. Prior to this, Mr Garling was CEO of Tenix Infrastructure and a long-term senior executive at the Lend Lease Group, including five years as CEO of Lend Lease Capital Services.
Mr Garling is currently the Chairman of Tellus Holdings Limited, Energy Queensland Limited and Newcastle Coal Infrastructure Group and a Director of Charter Hall Limited and the NSW electricity distributor, Essential Energy and the Australian Literacy and Numeracy Foundation. He is a former Director of Spotless Group Holdings Limited and a past President of Water Polo Australia Limited.
Mr Garling holds a Bachelor of Building from the University of New South Wales and the Advanced Diploma from the Australian Institute of Company Directors. He is a Fellow of the Australian Institute of Building, Australian Institute of Company Directors and Institution of Engineers Australia.
Mr Garling lives in Sydney.
For
per
sona
l use
onl
y
Annual Report 2019 5
T G HANDICOTT (56)
Independent Non-executive Director since September 2016Ms Handicott is a former corporate lawyer with over 30 years’ experience in mergers and acquisitions, capital markets and corporate governance. She was a partner of national law firm Corrs Chambers Westgarth for 22 years, serving as a member of its National Board for seven years including four years as National Chairman. She also has extensive experience in governance of local and state government organisations.
Ms Handicott is currently the Chairman of listed company PWR Holdings Limited and of Peak Services Holdings Pty Ltd, which is the subsidiary of the Local Government Association of Queensland that is responsible for its commercial operations. Ms Handicott is also a Director of Bangarra Dance Theatre Limited and a Divisional Councillor of the Queensland Division of the Australian Institute of Company Directors.
Ms Handicott is a former Director of CS Energy Limited, a former member of the Queensland University of Technology (QUT) Council, the Takeovers Panel and Corporations and Markets Advisory Committee and a former Associate Member of the Australian Competition and Consumer Commission.
A Senior Fellow of Finsia, Fellow of the Australian Institute of Company Directors and Member of Chief Executive Women, Ms Handicott holds a Bachelor of Laws (Hons) degree from the Queensland University of Technology.
Ms Handicott lives in Brisbane.
N M HOLLOWS (48)
Independent Non-executive Director since June 2018Ms Hollows has over 20 years’ experience in the resources sector in a number of senior managerial roles across both the public and private sectors, including in mining, utilities and rail. Her experience spans operational management, accounting and finance, mergers and acquisitions, capital management and corporate governance.
Ms Hollows is currently the Chief Executive Officer of SunWater Limited, a Queensland Government owned corporation. She is the Chair of The Salvation Army Brisbane Red Shield Appeal Committee and an advisory committee member of the Salvation Army Queensland Advisory Council and also a Board member of the Water Services Association of Australia and a member of the CEO Advisory Committee for Dean of Queensland University of Technology Business School.
She was formerly the Chief Financial Officer and subsequently Chief Executive Officer of Macarthur Coal Limited, Managing Director of AMCI Australia and South East Asia and Interim Chair of Queensland Rail Limited.
A Fellow of the Australian Institute of Company Directors and a Member of Chief Executive Women and the Institute of Chartered Accountants, Ms Hollows holds a Bachelor of Business – Accounting and a Graduate Diploma in Advanced Accounting (Distinction) from the Queensland University of Technology and is a Graduate of Harvard Business School’s Program for Management Development.
Ms Hollows lives in Brisbane.
C G THORNE (69)
Independent Non-executive Director since July 2010Dr Thorne has over 36 years’ experience in the mining and extraction industry, specifically in senior operational and executive roles with Rio Tinto. His experience spanned a range of product groups and functional activities in Australia and overseas. After serving in London as Group Mining Executive from 1996 to 1998, Dr Thorne moved to Indonesia as President Director of Kaltim Prima Coal and then returned to Australia to manage Rio Tinto’s Australian coal business as Managing Director of Rio Tinto Coal Australia and the publicly listed Coal and Allied Industries. He was President of the Queensland Resources Council in 2001-2003.
In 2006, Dr Thorne was appointed global head of Rio Tinto’s technology, innovation and project engineering functions, reporting to the Chief Executive. He was a member of Rio Tinto’s Executive Committee and Investment Committee. He retired from Rio Tinto in 2011.
Dr Thorne is a Director of Spotless Group Holdings Limited and a former Director of Wesley Research Institute, JK Tech and Queensland Energy Resources Limited. He is a Fellow of the Australasian Institute of Mining and Metallurgy.
Dr Thorne also holds directorships with a number of private companies.
He holds Bachelor and Doctoral degrees in Metallurgy from the University of Queensland and is a Graduate of the Australian Institute of Company Directors.
Dr Thorne lives on the Sunshine Coast.
P L WATSON (62)
Independent Non-executive Director since May 2019Mr Watson has extensive experience in the construction and engineering sectors in senior executive and governance roles, including in the industrial, transport, defence, health, justice and utilities sectors. He was Chief Executive Officer and Managing Director of Transfield Services Limited, now known as Broadspectrum for ten years. During this period, he led the business through a successful transition, cultivating a sustainable and successful public company. He also has considerable experience in various Non-executive Director roles.
Mr Watson is currently a Consultant of Stephenson Mansell Group where he provides coaching and mentoring to senior executives.
Mr Watson is a former Chairman of LogiCamms Limited, Watpac Limited, Regional Rail Link Authority in Victoria and AssetCo Management which managed PPP assets, a former Director of the Major Transport Infrastructure Board in Victoria, Yarra Trams and Save the Children Australia and was a Board member of Infrastructure Australia.
A Fellow of the Australian Academy of Technological Sciences and Engineering and Member of the Institute of Engineers Australia and Australian Institute of Company Directors, Mr Watson holds a Diploma of Civil Engineering from the Caulfield Institute of Technology and is a Graduate of the Wharton Advanced Management Program of the University of Pennsylvania.
Mr Watson lives in Melbourne.
For
per
sona
l use
onl
y

6 Downer EDI Limited
Directors’ Report – continuedfor the year ended 30 June 2019
Directors’ shareholdings
The following table sets out each Director’s relevant interest (direct and indirect) in shares, debentures, and rights or options in shares or debentures (if any) of the Company at the date of this report. No Director has any relevant interest in shares, debentures and rights or options in shares or debentures, of a related body corporate as at the date of this report.
DirectorNumber of Fully Paid
Ordinary SharesNumber of Fully Paid Performance Rights
Number of Fully Paid Performance Options
R M Harding 28,856 – –
G A Fenn1 1,582,218 1,137,477 –
S A Chaplain 103,799 – –
P S Garling 19,962 – –
T G Handicott 14,000 – –
N M Hollows 3,000 – –
C G Thorne 82,922 – –
P L Watson – – –
1 Performance rights granted to Mr Fenn are subject to performance and/or service period conditions over the period 2016 to 2022. Further details regarding the conditions relating to these restricted shares and performance rights are outlined in sections 6.4 and 9.2 the Remuneration Report.
Company Secretary
The Company Secretarial function is responsible for ensuring that the Company complies with its statutory duties and maintains proper documentation, registers and records. It also provides advice to Directors and officers about corporate governance and gives practical effect to any decisions made by the Board.
Mr Robert Regan was appointed Group General Counsel and Company Secretary in January 2019. He has qualifications in law from the University of Sydney and is an admitted solicitor in New South Wales. Mr Regan was formerly a partner of Corrs Chambers Westgarth and has over 30 years of experience in legal practice.
Mr Peter Lyons was appointed joint Company Secretary in July 2011. A Member of CPA Australia and the Governance Institute of Australia, he has qualifications in commerce from the University of Western Sydney and corporate governance from the Governance Institute of Australia. Mr Lyons was previously Deputy Company Secretary and has been in financial and secretarial roles at Downer for over 15 years.
Review of operations
Principal activities
Downer EDI Limited (Downer) designs, builds and sustains assets, infrastructure and facilities and is a leading provider of integrated services in Australia and New Zealand. Downer employs more than 53,000 people, mostly in Australia and New Zealand but also in the Asia-Pacific region, South America and Southern Africa.
Our Purpose is to create and sustain the modern environment by building trusted relationships with our customers.
Our Promise is to work closely with our customers to help them succeed, using world-leading insights and solutions.
Our business is founded on four Pillars:
– Safety: Zero Harm is embedded in Downer’s culture and is fundamental to the Company’s future success
– Delivery: we build trust by delivering on our promises with excellence while focusing on safety, value for money and efficiency
– Relationships: we collaborate to build and sustain enduring relationships based on trust and integrity
– Thought leadership: we remain at the forefront of our industry by employing the best people and having the courage to challenge the status quo.
Downer reports its results under five service lines (Transport, Utilities, Facilities, Mining and Engineering, Construction & Maintenance) and an outline of each service line is set out below.
For
per
sona
l use
onl
y
Annual Report 2019 7
Transport
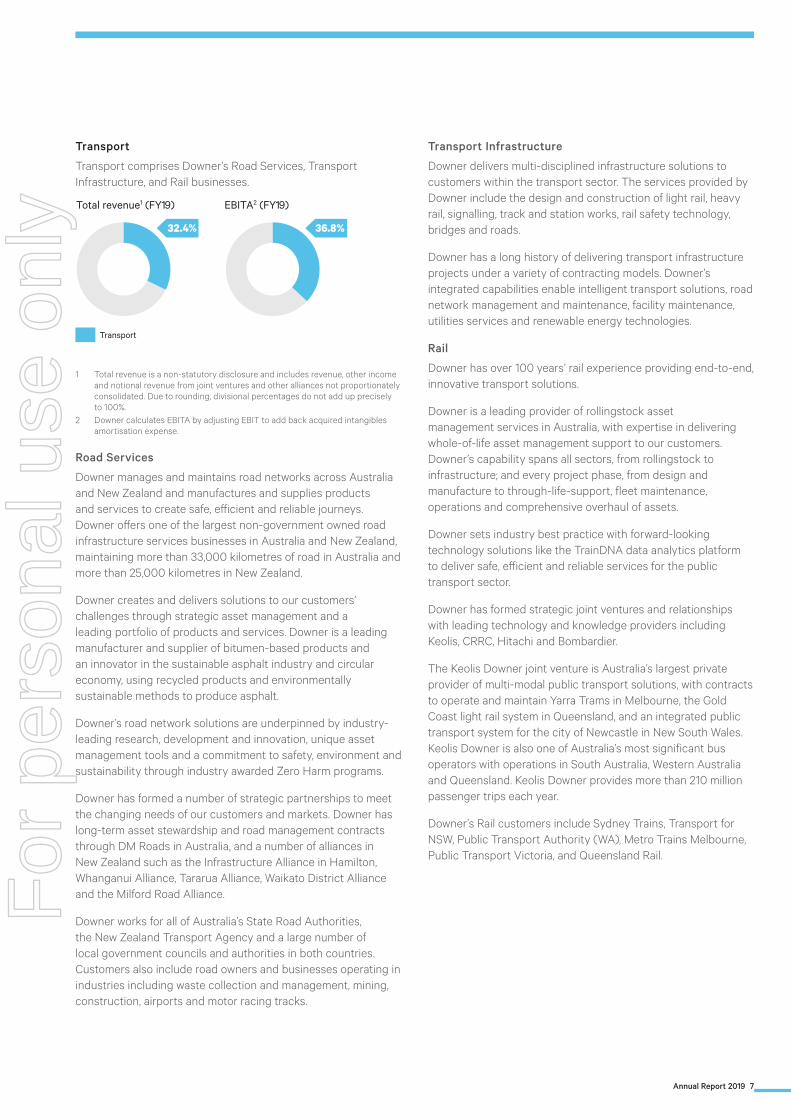
Transport comprises Downer’s Road Services, Transport Infrastructure, and Rail businesses.
Total revenue1 (FY19)
Transport
EBITA2 (FY19)
32.4% 36.8%
1 Total revenue is a non-statutory disclosure and includes revenue, other income and notional revenue from joint ventures and other alliances not proportionately consolidated. Due to rounding, divisional percentages do not add up precisely to 100%.
2 Downer calculates EBITA by adjusting EBIT to add back acquired intangibles amortisation expense.
Road Services
Downer manages and maintains road networks across Australia and New Zealand and manufactures and supplies products and services to create safe, efficient and reliable journeys. Downer offers one of the largest non-government owned road infrastructure services businesses in Australia and New Zealand, maintaining more than 33,000 kilometres of road in Australia and more than 25,000 kilometres in New Zealand.
Downer creates and delivers solutions to our customers’ challenges through strategic asset management and a leading portfolio of products and services. Downer is a leading manufacturer and supplier of bitumen-based products and an innovator in the sustainable asphalt industry and circular economy, using recycled products and environmentally sustainable methods to produce asphalt.
Downer’s road network solutions are underpinned by industry-leading research, development and innovation, unique asset management tools and a commitment to safety, environment and sustainability through industry awarded Zero Harm programs.
Downer has formed a number of strategic partnerships to meet the changing needs of our customers and markets. Downer has long-term asset stewardship and road management contracts through DM Roads in Australia, and a number of alliances in New Zealand such as the Infrastructure Alliance in Hamilton, Whanganui Alliance, Tararua Alliance, Waikato District Alliance and the Milford Road Alliance.
Downer works for all of Australia’s State Road Authorities, the New Zealand Transport Agency and a large number of local government councils and authorities in both countries. Customers also include road owners and businesses operating in industries including waste collection and management, mining, construction, airports and motor racing tracks.
Transport Infrastructure
Downer delivers multi-disciplined infrastructure solutions to customers within the transport sector. The services provided by Downer include the design and construction of light rail, heavy rail, signalling, track and station works, rail safety technology, bridges and roads.
Downer has a long history of delivering transport infrastructure projects under a variety of contracting models. Downer’s integrated capabilities enable intelligent transport solutions, road network management and maintenance, facility maintenance, utilities services and renewable energy technologies.
Rail
Downer has over 100 years’ rail experience providing end-to-end, innovative transport solutions.
Downer is a leading provider of rollingstock asset management services in Australia, with expertise in delivering whole-of-life asset management support to our customers. Downer’s capability spans all sectors, from rollingstock to infrastructure; and every project phase, from design and manufacture to through-life-support, fleet maintenance, operations and comprehensive overhaul of assets.
Downer sets industry best practice with forward-looking technology solutions like the TrainDNA data analytics platform to deliver safe, efficient and reliable services for the public transport sector.
Downer has formed strategic joint ventures and relationships with leading technology and knowledge providers including Keolis, CRRC, Hitachi and Bombardier.
The Keolis Downer joint venture is Australia’s largest private provider of multi-modal public transport solutions, with contracts to operate and maintain Yarra Trams in Melbourne, the Gold Coast light rail system in Queensland, and an integrated public transport system for the city of Newcastle in New South Wales. Keolis Downer is also one of Australia’s most significant bus operators with operations in South Australia, Western Australia and Queensland. Keolis Downer provides more than 210 million passenger trips each year.
Downer’s Rail customers include Sydney Trains, Transport for NSW, Public Transport Authority (WA), Metro Trains Melbourne, Public Transport Victoria, and Queensland Rail.
For
per
sona
l use
onl
y

8 Downer EDI Limited
Directors’ Report – continuedfor the year ended 30 June 2019
Utilities
Downer offers a range of services to customers across the power and gas, water, renewable energy and communications sectors.
Total revenue1 (FY19)
Utilities
EBITA2 (FY19)
18.7% 20.6%
1 Total revenue is a non-statutory disclosure and includes revenue, other income and notional revenue from joint ventures and other alliances not proportionately consolidated. Due to rounding, divisional percentages do not add up precisely to 100%.
2 Downer calculates EBITA by adjusting EBIT to add back acquired intangibles amortisation expense.
Power and gas
Downer’s services include planning, designing, constructing, operating, maintaining, managing and decommissioning power and gas network assets. A collaborative approach has made Downer a benchmark end-to-end service provider to owners of utility assets.
Downer designs and constructs steel lattice transmission towers, designs and builds substations, constructs and maintains electricity and gas networks, provides asset inspection and monitoring services, connects tens of thousands of new power and gas customers each year and provides meter, energy and water efficiency services for governments, utilities and corporations.
Water
Downer is dedicated to delivering complete water lifecycle solutions for municipal and industrial water users.
Downer’s expertise includes water treatment, wastewater treatment, water and wastewater network construction and rehabilitation, desalination and biosolids treatment.
As a leading provider of asset management services, Downer supports its customers across the full asset lifecycle from conceptual development through to design, construction, commissioning and into operations and maintenance.
Downer collaborates with customers to manage their assets, so they create community benefits that are sustainable, innovative, cost-effective and provide value to all stakeholders.
Renewable energy
Downer is one of Australia’s largest and most experienced providers in the renewable energy market, delivering services to customers requiring both utility and commercial scale sustainable energy solutions.
Downer offers trusted services and integrated solutions required for the entire asset lifecycle including procurement, assembly, design, construction, commissioning and maintenance for a range of renewable assets specifically in the wind, solar and power systems storage sectors including transmission and substations.
Downer offers flexible services like innovative energy systems that include self-generation and storage, grid services such as frequency control ancillary services (FCAS), fast frequency response (FFR), grid stability and transmission terminal congestion solutions.
Communications
Downer is a leading provider of end-to-end technology and communications service solutions, offering integrated civil construction, electrical, fibre, copper and radio network deployment capability throughout Australia and New Zealand. Key capabilities include:
– Design, engineering and network construction of fixed and wireless networks
– Mobile deployment: site acquisition, environmental and design services
– Network operations and help desk outsourcing
– Network maintenance
– Warehousing and logistics
– Smart metering
– Smart home power and technology solutions
– Fleet management
– Network security
– Remedial works and proactive maintenance
– Customer connections, in-premise installations and service activations.
Facilities
The Facilities service line operates in Australia and New Zealand delivering facilities services to customers across a diverse range of industry sectors including: defence; education; government; healthcare; senior living; sports and venues; resources; leisure and hospitality; airports; industrial; commercial; property; utilities and public private partnerships.
Total revenue1 (FY19)
Facilities
EBITA2 (FY19)
25.3% 25.9%
1 Total revenue is a non-statutory disclosure and includes revenue, other income and notional revenue from joint ventures and other alliances not proportionately consolidated. Due to rounding, divisional percentages do not add up precisely to 100%.
2 Downer calculates EBITA by adjusting EBIT to add back acquired intangibles amortisation expense.
For
per
sona
l use
onl
y
Annual Report 2019 9
Facilities businesses include Spotless, AE Smith, Alliance, Ensign, EPICURE, Hawkins, Mustard, Nuvo, Taylors and Envar.
Spotless is the largest integrated facilities management services provider in Australia and New Zealand. Its key capabilities include:
– Air-conditioning, mechanical and electrical
– Asset maintenance and management
– Catering and hospitality
– Cleaning
– Facilities management
– Laundry management
– Security and electronic solutions
– Utility support.
The Facilities service line also includes Hawkins, New Zealand’s leading construction business. Hawkins delivers unique transformational projects across a variety of sectors including education, health, airports, commercial office buildings and heritage restorations. It leads the industry in civic projects including art galleries, event centres, stadiums and community facilities.
Hawkins' and Downer’s combined technical and construction management expertise provides proven, whole-of-life solutions for customers’ assets using innovative technology to sustainably deliver outcomes.
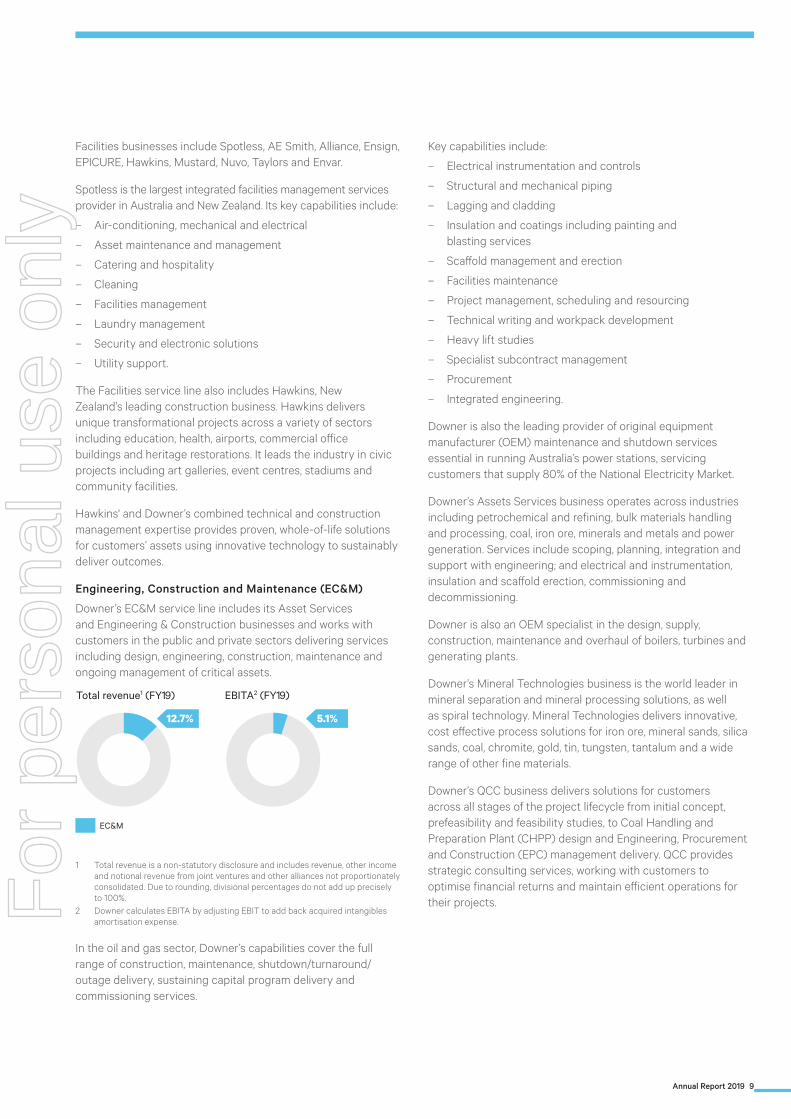
Engineering, Construction and Maintenance (EC&M)
Downer’s EC&M service line includes its Asset Services and Engineering & Construction businesses and works with customers in the public and private sectors delivering services including design, engineering, construction, maintenance and ongoing management of critical assets.
Total revenue1 (FY19)
EC&M
EBITA2 (FY19)
12.7% 5.1%
1 Total revenue is a non-statutory disclosure and includes revenue, other income and notional revenue from joint ventures and other alliances not proportionately consolidated. Due to rounding, divisional percentages do not add up precisely to 100%.
2 Downer calculates EBITA by adjusting EBIT to add back acquired intangibles amortisation expense.
In the oil and gas sector, Downer’s capabilities cover the full range of construction, maintenance, shutdown/turnaround/outage delivery, sustaining capital program delivery and commissioning services.
Key capabilities include:
– Electrical instrumentation and controls
– Structural and mechanical piping
– Lagging and cladding
– Insulation and coatings including painting and blasting services
– Scaffold management and erection
– Facilities maintenance
– Project management, scheduling and resourcing
– Technical writing and workpack development
– Heavy lift studies
– Specialist subcontract management
– Procurement
– Integrated engineering.
Downer is also the leading provider of original equipment manufacturer (OEM) maintenance and shutdown services essential in running Australia’s power stations, servicing customers that supply 80% of the National Electricity Market.
Downer’s Assets Services business operates across industries including petrochemical and refining, bulk materials handling and processing, coal, iron ore, minerals and metals and power generation. Services include scoping, planning, integration and support with engineering; and electrical and instrumentation, insulation and scaffold erection, commissioning and decommissioning.
Downer is also an OEM specialist in the design, supply, construction, maintenance and overhaul of boilers, turbines and generating plants.
Downer’s Mineral Technologies business is the world leader in mineral separation and mineral processing solutions, as well as spiral technology. Mineral Technologies delivers innovative, cost effective process solutions for iron ore, mineral sands, silica sands, coal, chromite, gold, tin, tungsten, tantalum and a wide range of other fine materials.
Downer’s QCC business delivers solutions for customers across all stages of the project lifecycle from initial concept, prefeasibility and feasibility studies, to Coal Handling and Preparation Plant (CHPP) design and Engineering, Procurement and Construction (EPC) management delivery. QCC provides strategic consulting services, working with customers to optimise financial returns and maintain efficient operations for their projects.F
or p
erso
nal u
se o
nly

10 Downer EDI Limited
Directors’ Report – continuedfor the year ended 30 June 2019
Mining
Downer is one of Australia’s leading diversified mining contractors serving its customers across more than 50 sites in Australia, Papua New Guinea, South America and Southern Africa.
Total revenue1 (FY19)
Mining
EBITA2 (FY19)
11.0% 11.6%
1 Total revenue is a non-statutory disclosure and includes revenue, other income and notional revenue from joint ventures and other alliances not proportionately consolidated. Due to rounding, divisional percentages do not add up precisely to 100%.
2 Downer calculates EBITA by adjusting EBIT to add back acquired intangibles amortisation expense.
Downer services coal and metalliferous ore mining customers at all stages of the mining lifecycle, specialising in both surface and underground mining. Key capabilities include:
– Resource definition, exploration drilling and mine feasibility studies
– Open cut mining services to Australian coal, iron ore and gold
– Underground mining services to Australian, Papua New Guinea and South African copper and gold
– Drilling, explosives manufacture and supply, blasting and crushing
– Tyre management (through the subsidiary Otraco International)
– Mine closure and rehabilitation.
In New South Wales, Downer provides mining services at Newcrest Mining’s Cadia Valley underground mine near Orange and Cobar Management Pty Ltd’s CSA underground copper mine located in Cobar, Central Western New South Wales.
In Queensland, Downer has provided mining services at Stanwell Corporation’s Meandu mine in the South Burnett region since 2013. Downer has also been working closely with the BHP Billiton Mitsubishi Alliance (BMA) for many years, providing mining services at several mine sites in the Bowen Basin in Central Queensland including Goonyella Riverside, Daunia, Peak Downs, Saraji, Blackwater, Caval Ridge and Poitrel Mine. Downer also continues to provide full mining services at Millmerran Power Partner’s Commodore mine-site.
In South Australia, Downer provides engineering, procurement and construction (EPC) services and mining services at OZ Minerals' Carrapateena copper and gold mine.
In Western Australia, Downer has been providing mining services to Karara Mining Ltd at its Karara mine since the magnetite operation commenced production in February 2012. Mining services are also provided at the Gruyere gold project in Laverton for joint venture partners Gold Road Resources Ltd and Gold Fields Ltd. Downer also delivers significant mine contracting services at Cape Preston for CITIC Pacific Mining’s Sino Iron Project (high-grade magnetite).
Group Financial Performance
For the 12 months ended 30 June 2019, Downer reported increases in total revenue; earnings before interest, tax and amortisation of acquired intangible assets (EBITA); and net profit after tax (NPAT).
The main features of the result for the 12 months ended 30 June 2019 were:
– Total revenue of $13.4 billion, up 6.6%;
– Statutory EBITA of $532.6 million, up 96.2% from $271.5 million;
– Statutory earnings before interest and tax (EBIT) of $462.2 million, up 125.7% from $204.8 million;
– Underlying1 net profit after tax and before amortisation of acquired intangible assets (NPATA) of $340.1 million, up 14.7% from $296.5 million;
– Statutory net profit after tax and before amortisation of acquired intangible assets (NPATA) of $325.6 million, up 176.2% or $207.7 million from $117.9 million; and
– Statutory net profit after tax (NPAT) of $276.3 million, up 288.6% from $71.1 million.
A reconciliation of the statutory result to the underlying result is set out on page 12.
1 The underlying result is a non-IFRS measure that is used by Management to assess the performance of the business. Non-IFRS measures have not been subject to audit or review.
For
per
sona
l use
onl
y

Annual Report 2019 11
Revenue
Total revenue for the Group increased by $828.1 million, or 6.6%, to $13.4 billion compared to the previous corresponding period (pcp). This was primarily driven by increased activity in Utilities, EC&M and Mining, partially offset by lower revenue in Transport and Facilities.
Transport revenue decreased by 2.8%, or $123.0 million, to $4.3 billion due to completed infrastructure projects not being fully replaced, the Sydney Growth Trains project nearing completion and the divestment of the Freight Rail business in the prior period. This was offset by continuing strong performance in the Road Services business in both Australia and New Zealand, and an increase in Rail Through Life Support (TLS) activity.
Utilities revenue increased by 25.0%, or $501.8 million, to $2.5 billion, due to continuing strong contributions from NBN contracts in Australia as well as new renewable energy projects including Numurkah and Beryl solar farms.
Facilities revenue decreased by 0.8%, or $28.5 million to $3.4 billion due to projects completed in Australia and New Zealand in the prior year not being fully replaced. This was partially offset by higher building activities in New Zealand and from new contracts in the Infrastructure and Construction business in Australia.
EC&M revenue rose by 23.7%, or $326.9 million, to $1.7 billion as a result of increased activities from new maintenance contracts, the acquisition of MHPS Plant Services Pty Ltd (MHPS) and new contracts in Mineral Technologies. This increase was partially offset by a reduction in construction activities at projects including Wheatstone in Western Australia.
Mining revenue increased by 8.8%, or $120.1 million, to $1.5 billion mainly due to increased activities at Blackwater and Carrapateena and from the contribution of newly commenced contracts. This increase was partially offset by the completion of the Boggabri and Roy Hill contracts.
Expenses
Total expenses increased by 4.5% and include a $45.0 million loss due to the provision recognised in relation to Senvion’s scope in the delivery of the Murra Warra wind farm, while the previous corresponding period (pcp) included $208.1 million of Individually Significant Items (ISIs).
Employee benefits expenses increased by 7.6%, or $306.2 million, to $4.3 billion and represent 35.1% of Downer’s cost base. The increase is mainly due to higher activities across the Group. Included in the pcp is $23.4 million of pre-tax ISIs in relation to divisional merger costs and Spotless transition-related costs.
Subcontractor costs increased by 10.9%, or $412.4 million, to $4.2 billion and represent 33.9% of Downer’s cost base. This increase is a result of higher contracts activity and the change in the subcontractor mix on some contracts.
Raw materials and consumables costs decreased by 3.9%, or $85.5 million, to $2.1 billion and represent 17.1% of Downer’s cost base. The decrease is driven by the net impact of the divestment of Freight Rail, lower material requirements and the completion of contracts in Mining.
Plant and equipment costs increased by 1.9%, or $12.7 million, to $689.8 million and represent 5.6% of Downer’s cost base. The lower increase in plant and equipment costs compared to other types of expenses reflects a less capital-intensive business coupled with more efficient maintenance practices.
Depreciation and amortisation decreased by 2.8% or $10.2 million, to $360.0 million and represents 2.9% of Downer’s cost base. This decrease is mainly due to project completion in Mining partially offset by additional amortisation on acquired intangibles following several bolt-on acquisitions and higher amortisation as the business transformation program was completed in 2018.
Other expenses, which include communication, travel, occupancy, professional fees costs and ISIs, have decreased by 13.4%, or $105.9 million due to lower pre-tax ISIs compared to the pcp. Excluding the impact of Murra Warra and ISIs in the pcp, other expenses would have increased by 5.6%, or $33.8 million, and this represents bid costs incurred and the continuous investment in governance and risk management functions.
For
per
sona
l use
onl
y

12 Downer EDI Limited
Directors’ Report – continuedfor the year ended 30 June 2019
Earnings
Statutory EBIT of $462.2 million was $257.4 million higher than pcp driven by higher contributions from Transport, Utilities, Facilities and Mining, partially offset by a lower contribution from EC&M. The full year EBITA result of $532.6 million includes a $17.0 million fair value gain on revaluation of existing interest in the Downer Mouchel joint venture. This gain arises from the revaluation of the proportion of the joint venture already owned by Downer.
Statutory NPAT for the Group was $276.3 million, including $31.5 million (after-tax) provision for Murra Warra wind farm.
Underlying NPATA for the Group increased by 14.7%, or $43.6 million, to $340.1 million.
A reconciliation of the statutory result to the underlying result is set out below:
FY19 $m EBIT
Net interest expense
Tax expense NPAT
Add back amortisation
of acquired intangibles
(post-tax) NPATA
Statutory result 462.2 (82.4) (103.5) 276.3 49.3 325.6Plus: Murra Warra wind farm loss 45.0 – (13.5) 31.5 – 31.5
507.2 (82.4) (117.0) 307.8 49.3 357.1Less: Fair value gain on revaluation of existing interest in Downer Mouchel JV (17.0) – – (17.0) – (17.0)
Underlying result 490.2 (82.4) (117.0) 290.8 49.3 340.1
Transport EBITA increased by 22.5% to $242.4 million due to continued strong performance in road maintenance in Australia and New Zealand and higher contributions from the Waratah TLS contract and from the SGT and HCMT projects. This was partially offset by the divestment of Freight Rail in 2H18 and a lower contribution from Infrastructure Projects in New Zealand.
Utilities EBITA increased by 19.1% to $136.1 million, driven by a strong performance from Communications, partially offset by underperformance in a solar contract.
Facilities EBITA increased by 2.3% to $170.5 million mainly driven by growth in Defence and Hospitality & FM related contracts that offset lower contribution from construction.
EC&M EBITA decreased by 8.3% to $33.3 million due to the completion of the Gorgon and Wheatstone contracts and loss-making construction projects. This was partially offset by strong performance in maintenance contracts and the MHPS acquisition.
Mining EBITA increased by 52.2% to $76.7 million predominantly due to continued strong performance on ongoing and new contracts.
Corporate costs increased by $12.4 million to $98.4 million primarily from the continuous investment in governance and risk management functions and higher amortisation of intangibles following completion of the business transformation program in 2018.
Net finance costs increased by $1.3 million to $82.4 million due to higher net debt balances during the year and the unwind of discount charges relating to onerous provision recognised following the adoption of AASB 15, partially offset by lower average interest rates following debt refinancing.
The effective tax rate is 27.3% which is lower than the statutory rate of 30.0% due to the impact of items including non-taxable distributions from joint ventures and lower overseas tax rates (e.g. New Zealand).
For
per
sona
l use
onl
y

Annual Report 2019 13
Group Financial Position
Funding, liquidity and capital are managed at Group level, with Divisions focused on working capital and operating cash flow management.
Operating Cash Flow
Operating cash flow was strong at $630.2 million, up 8.0% from last year due to strong contract performance, distributions from equity accounted investments and contributions from acquisitions. This represents a cash conversion of 89.0% to adjusted earnings before interest, tax, depreciation and amortisation (EBITDA).
Investing Cash
Total investing cash flow was $509.7 million, $219.9 million lower than the pcp as the prior period included a $391.8 million payment in relation to the additional interest acquired in Spotless. Excluding the Spotless payment, and the proceeds from the divestment of the Freight Rail business, investing cash increased by 9.1% or $42.3 million mainly due to payments made for capital expenditure during the year.
The business continued to invest in capital equipment to support the existing contracted operations and future operations, resulting in net capital expenditure of $330.1 million and $52.6 million payment for lease assets.
Debt and Bonding
The Group’s performance bonding facilities totalled $2,143.1 million at 30 June 2019 with $819.9 million undrawn. There is sufficient available capacity to support the ongoing operations of the Group.
As at 30 June 2019, the Group had liquidity of $1.8 billion comprising cash balances of $710.7 million and undrawn committed debt facilities of $1.1 billion. Total liquidity available is $1.4 billion through Downer’s facilities and $379.9 million through Spotless’ facilities.
The Group continues to be rated BBB (Stable) by Fitch Ratings.
Balance Sheet
The net assets of Downer decreased by 4.8% to $3.0 billion, predominantly due to the impact of the adoption of AASB 15 Revenue from Contracts with Customers. This resulted in an opening retained earnings adjustment of $258.0 million (after-tax). Adjusting for the impact of AASB 15, net assets increased by $97.9 million representing a 3.1% increase to pcp.
Cash and cash equivalents increased by $104.5 million, or 17.2%, to $710.7 million. The increase reflects continued strong cash contributions from operations and proceeds from external borrowings drawn; offset by $78.4 million in relation to business acquisitions, investment in joint ventures and final working capital adjustments on the divestment of Freight Rail in FY18.
Net debt increased from $940.0 million at 30 June 2018 to $1,012.6 million at 30 June 2019 primarily as a result of drawdowns made to support business activities, offset by a higher cash position. The increased net debt position, together with a lower equity balance following $258.0 million of AASB 15 transition adjustments, resulted in an increase in gearing (net debt to net debt plus equity) to 24.9%, up from 22.7% at 30 June 2018.
Trade receivables and contract assets decreased by $165.2 million to $2,065.9 million reflecting the impact on adoption of AASB 15 and strong cash collections.
Inventories increased by $35.8 million to $304.6 million as a result of bogie overhaul activities in Transport and higher bitumen stock levels.
Current tax assets decreased by $11.6 million to $57.7 million due to the timing of tax payments.
Interest in joint ventures and associates increased by $12.8 million. This represents $8.5 million for a 50% interest acquired in Repurpose It, a waste recycling business in Victoria; and Downer’s share of net profits from joint ventures and associates of $30.4 million; offset by $4.0 million interest reduction in MHPS Plant Services Pty Ltd following the 100% ownership acquired during the year and $22.4 million of distributions received.
Property, Plant and Equipment increased $92.9 million, to $1,373.3 million, as additional capital expenditure incurred in Transport and Mining exceeded the depreciation expense.
Intangible assets increased by $80.0 million arising from $128.4 million additional goodwill and other acquired intangible assets recognised from acquisitions made during the period and $45.3 million additional investment in software; offset by $100.0 million amortisation mainly related to Spotless’ acquired intangible assets.
For
per
sona
l use
onl
y

14 Downer EDI Limited
Directors’ Report – continuedfor the year ended 30 June 2019
Total trade payables and contract liabilities increased by $148.7 million primarily as a result of higher business activities. Trade payables and contract liabilities represent 49.6% of Downer’s total liabilities.
Other financial liabilities of $67.4 million decreased by $10.0 million and represents 1.4% of Downer’s total liabilities. The decrease mainly reflects deferred consideration paid for acquisitions during the year.
Deferred tax liability of $137.6 million primarily represents temporary differences arising from work in progress, property, plant and equipment, and the tax effect of the recognition of acquired intangibles.
Provisions of $577.1 million increased by $86.6 million mainly from the recognition of the new Royal Adelaide Hospital and Murra Warra contract provisions and an increase in employee related provisions. Provisions represent 11.6% of Downer’s total liabilities. Employee provisions (annual leave and long service leave) made up 66.8% of this balance with the remainder covering onerous contracts provisions, surplus lease contracts provisions and return conditions obligations for leased assets and property and warranty obligations.
Shareholder equity decreased by $154.9 million driven by a $258.0 million cumulative opening retained earnings adjustment following adoption of AASB 15 and $174.9 million of dividend payments made during the period. This was offset by the net profit after tax of $276.3 million. Net foreign currency gains on translation of foreign operations, particularly in New Zealand, resulted in a movement in the foreign currency translation reserve of $10.1 million.
Dividends
The Downer Board resolved to pay a final dividend of 14.0 cents per share, 50% franked (consistent with the prior corresponding period), payable on 2 October 2019 to shareholders on the register at 4 September 2019. The unfranked portion of the dividend (50%) will be paid out of Conduit Foreign Income (CFI).
The Board also determined to continue to pay a fully imputed dividend on the ROADS security, which having been reset on 15 June 2019 has a yield of 5.49% per annum payable quarterly in arrears, with the next payment due on 16 September 2019. As this dividend is fully imputed (the New Zealand equivalent of being fully franked), the actual cash yield paid by Downer will be 3.95% per annum for the next 12 months.
Zero Harm
Downer’s1 Lost Time Injury Frequency Rate (LTIFR) decreased to 0.57 from 0.78 and our Total Recordable Injury Frequency Rate (TRIFR) decreased to 2.70 from 3.27 per million hours worked2.
TRIFRLTIFR
LTIF
R
TRI
FR
Downer Group Safety Performance (12-month rolling frequency rates)
Jun-
18
Jul-1
8
Aug
-18
Sep-
18
Oct
-18
Nov
-18
Dec
-18
Mar
-19
Apr
-19
May
-19
Feb-
19
Jan-
19
Jun-
19
0.0
0.5
1.0
1.5
2.0
2.5
1.0
1.5
2.0
2.5
3.0
3.5
4.0
3.27
2.70
0.78 0.57
1 Safety data excludes Hawkins and Spotless.2 Lost time injuries (LTIs) are defined as injuries that cause the injured person (employee or contractor) to be unfit to perform any work duties for one whole day or shift, or
more, after the shift on which the injury occurred, and any injury that results, directly or indirectly, in the death of the person. The Lost Time Injury Frequency Rate (LTIFR) is the number of LTIs per million hours worked. Total Recordable Injuries (TRIs) are the number of LTIs + medically treated injuries (MTIs) for employees and contractors. Total Recordable Injury Frequency Rate (TRIFR) is the number of TRIs per million hours worked.
For
per
sona
l use
onl
y

Annual Report 2019 15
Group Business Strategies and Prospects for Future Financial Years
The Downer Group comprises a diverse collection of businesses. Downer’s Purpose is to create and sustain the modern environment by building trusted relationships with customers. Downer’s Promise is to work closely with its customers to help them succeed, using world-leading insights and solutions. Downer’s business is founded on four Pillars which support our Purpose and Promise: Safety, Delivery, Relationships and Thought Leadership.
Downer’s strategy focuses on Zero Harm, driving improvement in existing businesses and operations, investing in targeted growth opportunities, and creating new positions in appropriate markets.
Downer’s strategic objectives, prospects, and the risks that could adversely affect the achievement of these objectives, are set out in the table below.
Strategic Objective Prospects Risks and risk management
Maintain focus on Zero Harm as a cornerstone of the Safety pillar
Downer recognises that a sustainable and embedded Zero Harm culture is fundamental to the Company’s future success.
Zero Harm means sustaining a work environment that supports the health and safety of Downer’s people, and conducting operations in a manner that is environmentally responsible and sustainable.
Downer’s Zero Harm culture is built on leading and inspiring, verifying the effective management of risks that have the potential to cause serious harm, rethinking processes, continuously improving management systems, applying lessons learnt, and adopting and adapting practices that aim to achieve zero work-related injuries and unintentional harm to the environment.
Downer’s approach to Zero Harm enables the Company to work safely, sustainably and environmentally responsibly where there are inherent hazardous environments.
Downer has implemented a strong Critical Risk program throughout its business. This program has provided Downer with the opportunity to understand the risks in its business that could cause serious injury to people or the environment. That knowledge has enabled Downer to implement a program to eliminate or control those risks, and to monitor the performance of those critical controls.
Each Downer Division has in place a Zero Harm management system, certified as a minimum to AS/NZS 4801 or BS OHSAS 18001, and ISO 14001. Each management system is reviewed regularly, undergoing internal and external audit.
Embed asset management and data analytics as a cornerstone of the Delivery pillar
Downer has established an Asset & Data Management Office (ADMO) to coordinate the Group’s extensive asset management knowledge and expertise and use it, for example, to improve the efficiency of its customers’ operations.
As a leader in asset management, Downer aims to adopt and implement world-leading insights and solutions. The proliferation of data points and connected devices allows for more data and business intelligence to be captured. This information can be used to drive service improvement and improve asset performance.
The expectations of Downer’s customers, and their customers, continue to grow with regards to reliable, intuitive, and cost-effective assets and services.
Downer has invested in capability and talent to improve asset management, data analytics and life cycle performance analytics. A number of these investments have Group-wide application in addition to their bespoke customer benefit.
Risks to be managed include: not delivering value-added services to customers and so reducing the need for integrated services partners; scope reduction by customers who elect to use pure maintenance/blue collar services; and an inability to deliver obligations in performance frameworks and service outcome contracts.F
or p
erso
nal u
se o
nly

16 Downer EDI Limited
Directors’ Report – continuedfor the year ended 30 June 2019
Strategic Objective Prospects Risks and risk management
Improve engagement with customers as a cornerstone of the Relationships pillar
Providing valuable and reliable products and services to customers, and their customers, is at the heart of Downer’s culture. It enables Downer’s customers to focus more on their core expertise while Downer delivers non-core operational services.
Through ongoing analysis of markets, customers and competitors, Downer is well positioned to improve value and service for its customers and their customers.
Relationships creating success continues to be Downer’s core operating philosophy that drives delivery of projects and services. It helps to ensure investment, initiatives and activities are focused on helping Downer’s customers to succeed.
Building on existing expertise across the Group, Downer is developing a more coordinated and structured approach to customer engagement, business development and market participation. This will improve Downer’s ability to compete and win in the markets and sectors in which it operates.
Risks to be managed include: the threat of new competitors and disruptors in traditional markets; not keeping pace with changing customer expectations; and the threat of commoditisation of core products and services.
Embed operational technology into core service offerings as a cornerstone of our Thought Leadership pillar
Technology is an inherent feature of today’s world and there is therefore greater demand for technology in Downer’s projects and services.
Customer operations are growing in complexity and this creates opportunities for Downer to connect, manage, monitor and report on core services and infrastructure.
Downer is investing in operational technology, “apps”, platforms and partnerships to meet customer needs. Downer is focused on selecting the right operational technology investments, for example those that can be leveraged across a number of service lines to maximise value for the greatest number of customers.
Risks to be managed include: intensification of competition as customers converge into large single market procurement channels; introduction of foreign and technology based competitors that bring a different value proposition; and a need for greater investment in technology and data services.
For
per
sona
l use
onl
y

Annual Report 2019 17
The following table provides an overview of the key prospects relevant to each of Downer’s service lines and summarises Downer’s intended strategic response across each sector to maximise the Company’s performance and realise future opportunities.
Service line Prospects Downer’s response
Transport The multi-billion dollar market for transport infrastructure and services continues to exhibit good growth in both Australia and New Zealand. Governments in both countries continue to invest in a range of projects to reduce congestion, improve mobility, and provide better linkages between communities.
The cost of bidding for major projects is high and project risks can be significant, so Downer is selective about the projects for which it bids.
Looking forward, potential outsourcing and franchising opportunities across the transport sector may further expand Downer’s portfolio in public transport operations.
Downer is a market leader in road services in both Australia and New Zealand, light rail construction in Australia and heavy rail construction and maintenance in Australia.
In recent years, Downer’s strategy has focused on journey management, asset stewardship, congestion management, and urban revitalisation. The ability to deal with these issues through infrastructure services and solutions is critical to driving the Downer business forward and to provide increasing value to Downer’s customers and their end customers.
Downer maintains strong strategic partnerships with leading global transport solutions providers and, through this model, is pursuing opportunities in rolling stock manufacture and maintenance, and transport network operations and maintenance.
The Keolis Downer joint venture is a leading Australian multi-modal transport operator, through its light rail and bus operations.
Utilities Growth across utility markets is multi-faceted with a good pipeline of prospects in both Australia and New Zealand.
Activity in telecommunications continues to be dynamic, with large capital builds in both Australia and New Zealand coming to a close. Downer’s view is that the timing of these large network builds will extend beyond most analysts’ predictions. However, increasing demand for data services will see a continuing, solid baseload of activity in this sector.
Downer has market leading positions in the electricity, water, gas and telecommunications sectors in both Australia and New Zealand.
Downer is strongly positioned to take advantage of the growth opportunities available in these sectors, with a demonstrable track record of excellence in service delivery, and a greater focus on introducing operational technology to improve the value Downer brings to customers.
Facilities Large-scale and long-term outsourcing contracts continue to come to market, however the long-term nature of contracts in this sector means that a lot of work is already under contract.
The defence, health, education, corrections, and commercial markets continue to provide a range of opportunities on the short-to-medium term horizon in both Australia and New Zealand.
Through the acquisition of Spotless, Downer is now a major force in both Australia and New Zealand with market leading positions across key sectors including: defence; health; education; corrections; commercial; stadia and open space management; leisure; and resources.
There is a focus on leveraging both businesses’ scale and routes to market to position the Group’s core offerings in an integrated way.
For
per
sona
l use
onl
y

18 Downer EDI Limited
Directors’ Report – continuedfor the year ended 30 June 2019
Service line Prospects Downer’s response
EC&M Many large projects are transitioning from greenfield construction to brownfield asset management, sustaining capital and longer-term strategic partnerships.
New resources-related infrastructure projects, including Western Australian iron ore, have begun coming to market.
Downer’s EC&M service line includes its Asset Services and Engineering & Construction businesses.
Downer is a market leader in electrical and instrumentation work, particularly in the oil and gas sector, and is growing its structural mechanical piping business.
Downer has experience working on all of the recent Australian major oil and gas developments. While the first phase of major LNG construction comes to an end, Downer is growing its market share in the maintenance of these facilities.
Outside of oil and gas, Downer continues to be a major player in the delivery of resources related engineering, construction and maintenance services with long and enduring relationships with all of Australia’s major mining and industrial customers.
In 2018, Downer merged its Mining and EC&M Divisions into the Mining, Energy and Industrial Division. This has enhanced Downer’s ability to offer customers a portfolio of complementary services in the resources, energy, power generation and industrial sectors. The Mining, Energy and Industrial Division provides customers with safe, quality, cost-efficient and technology-enabled solutions and services.
Mining The contract mining sector has experienced a recovery over the past 12 months, with production volumes and capital investment confidence returning to markets including metallurgical coal and iron ore.
Mine owners are seeking to maximise supply chain benefits, which opens opportunities for contractors to work collaboratively with them to drive productivity improvements and reduce production costs.
Downer is one of Australia’s leading diversified mining contractors offering customers feasibility studies, open cut mining services, underground mining services, tyre management, drilling and blasting services, mine closure and rehabilitation, and asset management.
In 2018, Downer merged its Mining and EC&M Divisions into the Mining, Energy and Industrial Division. This has enhanced Downer’s ability to offer customers a portfolio of complementary services in the resources, energy, power generation and industrial sectors. The Mining, Energy and Industrial Division provides customers with safe, quality, cost-efficient and technology-enabled solutions and services.
For
per
sona
l use
onl
y

Annual Report 2019 19
Outlook
Downer is targeting consolidated net profit after tax and before amortisation of acquired intangible assets (NPATA) of around $365 million before minority interests for the 2020 financial year.
Subsequent events
In September 2017 Spotless commenced a Facilities Management Sub-Contract (Subcontract) at the New Royal Adelaide Hospital (nRAH). Spotless’ subcontract is with Celsus, which has a head contract with the South Australian Government as part of a Public Private Partnership model.
On 21 August 2019, Spotless reached in-principle agreement with the South Australian Government and Celsus in relation to the delivery of services under the Subcontract. The agreement includes;
– settlement of historical abatement claims previously disclosed as a contingent liability by Downer and Spotless;
– a revised KPI and abatement regime designed to better reflect the services provided by Spotless; and
– an increase to Spotless’ monthly service fee.
The settlement agreement, which is expected to be signed in the first half of the 2020 financial year, will take financial effect from 1 July 2019.
Other than this in-principle agreement, there have been no other matters or circumstances other than those referred to in the financial statements or notes thereto, that have arisen since the end of the financial year, that have significantly affected, or may significantly affect, the operations of the Group, the results of those operations, or the state of affairs of the Group in subsequent financial years.
Changes in state of affairs
During the financial year there was no significant change in the state of affairs of the Group other than that referred to in the financial statements or notes thereto.
Environmental management
Downer believes in the pursuit of environmental excellence and enhancing liveability for all communities in which it operates. Downer’s environmental commitments are outlined in its Environmental Sustainability Policy which can be found on the Downer website at www.downergroup.com/board-policies.
Downer’s Purpose is to create and sustain the modern environment by building trusted relationships with its customers. Downer helps its customers succeed by developing and delivering environmentally responsible and sustainable solutions.
Downer remains focused on developing solutions to reduce its energy consumption and greenhouse gas (GHG) emissions. Downer is committed to transitioning to a low carbon economy and focusing its attention on managing risks associated with environmental management and climate change. Downer is also taking advantage of the commercial opportunities this presents for its business, in particular the energy transition and delivering infrastructure that is resilient to the physical impacts of climate change.
Downer’s Zero Harm Management System Framework sets the minimum standard for health, safety, environment and sustainability within its Divisions, and with regard to environment each Division’s Zero Harm Management System is certified to ISO 14001:2015. Divisions also adhere to environmental management requirements established by customers in addition to all applicable licence and regulatory requirements. Each Division is required to have an Environmental Sustainability Action Plan (ESAP) and strategies in place supported by suitably qualified environment and sustainability professionals. The ESAP allocates internal responsibilities for reducing the impact of its operations and business activities on the environment. In addition, all Divisions’ management systems are audited internally and externally by independent third parties.
Dividends
In respect of the financial year ended 30 June 2019, the Board:
– declared a 50% franked interim dividend of 14.0 cents per share that was paid on 21 March 2019 to shareholders on the register at 21 February 2019 with the unfranked portion paid out of Conduit Foreign Income; and
– declared a 50% franked final dividend of 14.0 cents per share, payable on 2 October 2019 to shareholders on the register at 4 September 2019 with the unfranked portion to be paid out of Conduit Foreign Income.
Consistent with prior periods, the Company’s Dividend Reinvestment Plan remains suspended.
As detailed in the Directors’ Report for the 2018 financial year, the Board declared a fully franked final dividend of 14.0 cents per share, that was paid on 27 September 2018 to shareholders on the register at 30 August 2018 with the unfranked portion paid out of Conduit Foreign Income.
For
per
sona
l use
onl
y

20 Downer EDI Limited
Directors’ Report – continuedfor the year ended 30 June 2019
Employee Discount Share Plan (ESP)
An ESP was instituted in June 2005. In accordance with the provisions of the plan, as approved by shareholders at the 1998 Annual General Meeting, permanent full-time and part-time employees of Downer EDI Limited and its subsidiary companies who have completed six months service may be invited to participate.
No shares were issued under the ESP during the years ended 30 June 2019 or 30 June 2018.
There are no performance rights or performance options, in relation to unissued shares, that are outstanding.
Directors’ meetings
The following table sets out the number of Directors’ meetings (including meetings of Board Committees) held during the 2019 financial year and the number of meetings attended by each Director (while they were a Director or Board Committee member). During the year, 10 Board meetings, six Audit and Risk Committee meetings, five Zero Harm Committee meetings, four Remuneration Committee meetings and three Nominations and Corporate Governance Committee meetings were held. In addition, 23 ad hoc meetings (attended by various Directors) were held in relation to various matters including tender reviews and major projects.
BoardAudit and Risk
CommitteeRemuneration
Committee
Director Held1 Attended Held1 Attended Held1 AttendedR M Harding 10 10 – – 4 4
G A Fenn 10 10 – – – –
S A Chaplain 10 9 6 6 – –
P S Garling2 10 9 5 5 4 4
T G Handicott3 10 10 6 6 4 4
N M Hollows 10 10 6 6 – –
C G Thorne4 10 10 6 6 – –
P L Watson 2 2 1 1 – –
Zero Harm Committee
Nominations and Corporate Governance
Committee
Director Held1 Attended Held1 AttendedR M Harding – – 3 3
G A Fenn 5 4 – –
S A Chaplain 5 5 3 3
P S Garling2 – – – –
T G Handicott3 – – 3 3
N M Hollows – – – –
C G Thorne4 5 5 – –
P L Watson – – – –
1 These columns indicate the number of meetings held during the period each person listed was a Director or member of the relevant Board Committee.2 Mr Garling is also Chairman of the Rail Projects Committee.3 Ms Handicott is also Chairman of the Disclosure Committee which meets on an unscheduled basis.4 Dr Thorne is also Chairman of the Tender Risk Evaluation Committee which meets on an unscheduled basis.
For
per
sona
l use
onl
y

Annual Report 2019 21
Indemnification of officers and auditors
During the financial year, the Company paid a premium in respect of a contract insuring the Directors of the Company, the Company Secretary, all officers of the Company and of any related body corporate against a liability incurred as a Director, secretary or executive officer to the extent permitted by the Corporations Act 2001 (Cth).
The contract of insurance prohibits disclosure of the nature of the liability and the amount of the premium.
Downer’s Constitution includes indemnities, to the extent permitted by law, for each Director and Company Secretary of Downer and its subsidiaries against liability incurred in the performance of their roles as officers. The Directors and the Company Secretaries listed on pages 4 to 5, individuals who act as a Director or Company Secretary of Downer’s subsidiaries and certain individuals who formerly held any of these roles also have the benefit of the indemnity in the Constitution.
The Company has not otherwise, during or since the financial year, indemnified or agreed to indemnify an officer or auditor of the Company or of any related body corporate against a liability incurred as such an officer or auditor.
Corporate Governance
In recognising the need for the highest standards of corporate behaviour and accountability, the Board endorses the ASX Corporate Governance Council’s Corporate Governance Principles and Recommendations (ASX Principles). The Group’s corporate governance statement is set out at pages 131 to 141 of this Annual Report.
Non-audit services
Downer is committed to audit independence. The Audit and Risk Committee reviews the independence of the external auditors on an annual basis. This process includes confirmation from the auditors that, in their professional judgement, they are independent of the Group. To ensure that there is no potential conflict of interest in work undertaken by Downer’s external auditors, KPMG, they may only provide services that are consistent with the role of the Company’s auditor.
The Board has considered the position and, in accordance with the advice from the Audit and Risk Committee, is satisfied that the provision of non-audit services during the year is compatible with the general standard of independence for auditors imposed by the Corporations Act 2001 (Cth).
The Directors are of the opinion that the services as disclosed below do not compromise the external auditor’s independence, based on advice received from the Audit and Risk Committee, for the following reasons:
– All non-audit services have been reviewed and approved to ensure that they do not impact the integrity and objectivity of the auditor; and
– None of the services undermine the general principles relating to auditor independence as set out in the Institute of Chartered Accountants in Australia and CPA Australia’s Code of Conduct APES 110 Code of Ethics for Professional Accountants issued by the Accounting Professional & Ethical Standards Board, including reviewing or auditing the auditor’s own work, acting in a management or decision- making capacity for the Company, acting as advocate for the Company or jointly sharing economic risks and rewards.
A copy of the auditor’s independence declaration is set out on page 53 of this Annual Report.
During the year, details of the fees paid or payable for non-audit services provided by the auditor of the parent entity, its related practices and related audit firms were as follows:
Non-audit services2019
$
Tax services 338,957
Advisory and due diligence services 275,000
613,957
Rounding of amounts
The Company is of a kind referred to in ASIC Corporations (Rounding in Financial/Directors’ reports) Instrument 2016/191, relating to the “rounding off” of amounts in the Directors’ Report and consolidated financial statements. Unless otherwise stated, amounts have been rounded off to the nearest whole number of millions of dollars and one place of decimals representing hundreds of thousands of dollars. Amounts shown as $- represent amounts less that $50,000 which have been rounded down.
For
per
sona
l use
onl
y
22 Downer EDI Limited
Directors’ Report – continuedfor the year ended 30 June 2019
Remuneration Report
Chairman’s letter
Dear Shareholders,
Downer’s 2019 Remuneration Report provides information about the remuneration of its most senior executives and explains how performance has been linked to reward outcomes at Downer for the 2019 financial year.
At the last Annual General Meeting in November 2018, 93.2% of all votes cast by shareholders were in favour of the 2018 Remuneration Report. The structure of the 2019 Remuneration Report has been prepared with the same objective of providing readers with a transparent view of key performance and outcomes using the report structure adopted in previous years.
Strong financial and safety performance
Downer has once again delivered strong financial and safety performance in 2019 and has continued to deliver on its promises:
– Total Revenue was $13.4 billion, an increase of 6.6% from 2018;
– Underlying Net Profit After Tax and before Amortisation of acquired intangibles (NPATA) was $340.1 million, an increase of $5.1 million over underlying guidance given at the start of the year;
– Conversion of EBITDA (earnings before interest, tax, depreciation and amortisation) to cash continued to be strong at 89.0%;
– Work-in-hand is now $44.3 billion, up 5.5% from June 2018; and
– Downer’s Total Shareholder Return over the three years to 30 June 2019 was 116.7%, 85.2% higher than the ASX 100 median comparator group.
Downer’s Lost Time Injury Frequency Rate decreased to 0.57 at 30 June 2019 and the Total Recordable Injury Frequency Rate decreased to 2.70. Many of the activities that Downer’s people perform every day have potential risks and ensuring they remain safe is of paramount importance. Zero Harm is central to Downer’s culture and our commitment to continuous improvement in Zero Harm remains a core strategic objective.
Key remuneration issues in 2019
Downer continued to invest in its future through strategic acquisitions and capital investments that have enhanced the geographic footprint of the existing business, grown capability and created new market positions which will maximise long-term shareholder value. These include the acquisitions of Boleh Consulting, The Roading Company, Envar Group, FH Lismore and Rock N Road, a 50% interest in Repurpose It, as well as the remaining interests in the MHPS Plant Services and Downer Mouchel joint ventures.
The restructuring of Spotless and the integration of the Spotless business into the Downer Group has also been a major activity during 2019.
The impact of these major transactions on executive remuneration can be significant. The Board’s overarching concern is to ensure executives:
– Are accountable for delivery of the annual budget and business plan; and
– Consider potential acquisition or divestment opportunities without the influence of their impact on remuneration outcomes.
For these and other reasons, where a transaction is both material and unbudgeted, the Board’s policy is that it should remove the impact of the transaction when calculating the key performance indicators on which executive performance is measured. This ensures that executives are ‘no better or worse off’ as a result of the transaction.
In 2019, adjustments were made in respect of the Rock N Road and Downer Mouchel acquisitions, in line with policy.
There were three items in 2019 which significantly affected statutory results, which were the acceleration of capital expenditure in the Mining business to take advantage of new and extended contracts that were in the best interest of Downer, a gain on revaluation of the existing interest in the Downer Mouchel joint venture and Murra Warra Wind Farm loss.
The Board considers whether to adjust for the impact of significant items (positive or negative) on a case by case basis, having regard to the circumstances relevant to each item.
In 2019, adjustments were made in respect of the mining capital expenditure and gain on revaluation of the existing interest in the Downer Mouchel joint venture. No adjustment was made in respect of the Murra Warra Wind Farm loss. The adjustments that were made ensured that executives were rewarded for performance against the operational performance targets set at the beginning of the year absent the influence of remuneration outcomes.
The adjustments resulted in the Group Free Cash Flow gateway being met and part achievement of that measure for the Corporate scorecard and reduced the level of achievement of the Corporate NPATA measure and Earnings Before Interest, Tax and Amortisation of acquired intangibles measure for the
For
per
sona
l use
onl
y

Annual Report 2019 23
Mining, Energy and Industrial and Transport and Infrastructure scorecards. For other measures there was no impact on reward outcomes.
More information on the Board’s approach to the above activities and their impact in 2019 can be found at sections 6.5 and 7.4 of the Remuneration Report.
Link between Downer performance and reward outcomes
Downer is one of the few companies in its sector that provides earnings guidance to the market each year. Downer has been successful in meeting or exceeding this earnings guidance for the last eight reporting periods.
Downer’s remuneration framework for key senior employees has been very successful in aligning Downer’s strategy and the creation of alignment between senior executives and shareholders. As set out in this Remuneration Report, Downer’s remuneration strategy continues to provide:
– A significant proportion of remuneration being at risk linked to clear, objective measures;
– A profitability gateway as a precondition to any short-term incentive entitlement;
– For deferral of 50% of short-term incentive payments over a further two-year period; and
– The delivery of a significant proportion of pay in equity.
Remuneration framework review
Downer’s current remuneration framework was established in 2008 and has been developed and refined over the subsequent years.
In recent years, Downer has undergone transformational change, including through the acquisitions of Tenix, Hawkins and Spotless as well as the divestment of the Freight Rail business and its revenue and market capitalisation have grown significantly.
Accordingly, as foreshadowed in last year’s Remuneration Report, the Board undertook a review of whether the remuneration framework currently in place continued to be ‘fit for purpose’ for today’s Downer. Guerdon Associates, the Board’s independent remuneration adviser, was engaged to assist with the review.
The review concluded that Downer’s framework is well designed and implemented to meet its needs. Further commentary on the review can be found on page 25.
We trust that this overview and the accompanying detailed analysis are helpful when forming your own views on Downer’s remuneration arrangements.
R M Harding T G HandicottChairman Remuneration Committee Chairman
For
per
sona
l use
onl
y
24 Downer EDI Limited
Directors’ Report – continuedfor the year ended 30 June 2019
Remuneration Report – AUDITED
The Remuneration Report provides information about the remuneration arrangements for key management personnel (KMP), which means Non-executive Directors and the Group’s most senior executives, for the year to 30 June 2019. The term “executive” in this Report means KMPs who are not Non-executive Directors.
The Report covers the following matters:
1. Year in review;
2. Details of Key Management Personnel;
3. Remuneration policy, principles and practices;
4. Relationship between remuneration policy and company performance;
5. The Board’s role in remuneration;
6. Description of executive remuneration;
7. Details of executive remuneration;
8. Executive equity ownership;
9. Key terms of employment contracts;
10. Related party information; and
11. Description of Non-executive Director remuneration.
1. Year in review
1.1 Summary of changes to remuneration policy
Downer has continued to refine its remuneration policy during the period. The Board considered Company strategy and reward plans based on performance measurement, competitive position and stakeholder feedback. Changes to policy are noted in the relevant sections of this Report and are summarised in the table below.
Policy Enhancements since 2018
Short-term incentive (STI) plan – The Zero Harm measures for safety and environmental performance have been further refined, building upon previous improvements to move with and support growth in organisational maturity and ensure continual stretch and ongoing Zero Harm improvement through requiring executives to:
– Reset the baseline for greenhouse gas (GHG) emissions to FY18 levels and development of three-year plans for GHG emission reductions, setting targets for the achievement of GHG emissions reduction and achieving FY19 targets;
– Conduct an operationally led review of Bow Tie analyses and critical analysis of critical risk control performance and initiating a program of projects to improve the resilience of critical controls; and
– Extend the critical risk observation program to also require observations to be conducted in partnership with clients.
Long-term incentive (LTI) plan Following on from the evolution of the Financial measures for earnings from Net Profit After Tax (NPAT) to Net Profit After Tax and before Amortisation of acquired intangibles (NPATA) at the Group level for the STI plan in 2018, NPATA has now replaced NPAT in the LTI plan. Adopting NPATA ensures that reward remains focused on the delivery of operational performance.
For
per
sona
l use
onl
y

Annual Report 2019 25
1.2 Remuneration Framework Review
Downer’s current remuneration framework was established in 2008 and has been developed and refined over the subsequent years.
In recent years, Downer has undergone transformational change in becoming Australia’s largest integrated services provider, including through the acquisitions of Tenix, Hawkins and Spotless as well as the divestment of the Century Drilling and Freight Rail businesses and its revenue and market capitalisation have grown significantly.
Accordingly, the Board, with the support of management, undertook a review of the framework currently in place to ensure it continues to be ‘fit for purpose’ for today’s Downer. The Board’s independent remuneration adviser, Guerdon Associates, was engaged to assist with this review.
The review included consideration of the objectives of the framework, which were confirmed as simplicity, performance, alignment with shareholders, collaboration, sustainability and retention as well as assessment of the effectiveness of the framework in meeting these objectives and its alignment with strategy and stakeholder expectations to ensure it is well designed to appropriately reward performance and drive corporate culture. This involved comparing each objective against the relevant elements of the framework, including the remuneration component mix, key result areas and measures, targets, payment vehicles, incentive grant basis, deferral or claw back mechanisms, performance modifiers, Board discretion adjustment mechanisms and minimum shareholding requirements.
The review by Guerdon Associates concluded that the framework was well designed to meet its objectives, recommending that consideration be given to enhancing the effectiveness of the framework in meeting the retention objective, notwithstanding that the current framework satisfactorily addressed retention. Following presentation by Guerdon Associates of options to enhance the retention elements of the framework, it was determined that, on balance, any changes would decrease the overall effectiveness of the framework, and accordingly no changes were made.
2. Details of Key Management Personnel
The following persons acted as Directors of the Company during or since the end of the most recent financial year:
Director Role
R M Harding
G A Fenn
S A Chaplain
P S Garling
T G Handicott
N M Hollows
C G Thorne
P L Watson
Chairman, Independent Non-executive Director
Managing Director and Chief Executive Officer
Independent Non-executive Director
Independent Non-executive Director
Independent Non-executive Director
Independent Non-executive Director
Independent Non-executive Director
Independent Non-executive Director
The named persons held their current executive position for the whole of the most recent financial year, except as noted:
Executive Role
S Cinerari
M J Ferguson
S L Killeen
D Nelson
B C Petersen
P J Tompkins
Chief Executive Officer – Transport and Infrastructure
Chief Financial Officer
Chief Executive Officer – New Zealand
Chief Executive Officer – Spotless, to 15 October 2018
Chief Executive Officer – Mining, Energy and Industrial Services
Chief Executive Officer – Spotless, from 16 October 2018For
per
sona
l use
onl
y

26 Downer EDI Limited
Directors’ Report – continuedfor the year ended 30 June 2019
3. Remuneration policy, principles and practices
3.1 Executive remuneration policy
Downer’s executive remuneration policy and practices are summarised in the table below.
Policy Practices aligned with policy
Retain experienced, proven performers, and those considered to have high potential for succession
– Provide remuneration that is internally fair;
– Ensure remuneration is competitive with the external market; and
– Defer a substantial part of pay contingent on continuing service and sustained performance.
Focus performance – Provide a substantial component of pay contingent on performance against targets;
– Focus attention on the most important drivers of value by linking pay to their achievement;
– Require profitability to reach a challenging level before any bonus payments can be made; and
– Provide a LTI plan component that rewards consistent Scorecard performance over multiple years and over which executives have a clear line of sight.
Provide a Zero Harm environment
– Incorporate measures that embody “Zero Harm” for Downer’s employees, contractors, communities and the environment as a significant component of reward.
Manage risk – Encourage sustainability by balancing incentives for achieving both short-term and longer-term results, and deferring equity-based reward vesting after performance has been initially tested;
– Set stretch targets that finely balance returns with reasonable but not excessive risk taking and cap maximum incentive payments;
– Do not provide excessive “cliff” reward vesting that may encourage excessive risk taking as a performance threshold is approached;
– Diversify risk and limit the prospects of unintended consequences from focusing on just one measure in both short-term and long-term incentive plans;
– Stagger vesting of deferred short-term incentive payments to encourage retention and allow forfeiture of rewards that are the result of misconduct or material adjustments;
– Retain full Board discretion to vary incentive payments, including in the event of excessive risk taking; and
– Restrict trading of vested equity rewards to ensure compliance with the Company’s Securities Trading Policy.
Align executive interests with those of shareholders
– Provide that a significant proportion of pay is delivered as equity so part of executive reward is linked to shareholder value performance;
– Provide a long-term incentive that is based on consistent Scorecard performance against challenging targets set each year that reflect sector volatility and prevailing economic conditions as well as relative TSR and earnings per share measures directly related to shareholder value;
– Maintain a guideline minimum shareholding requirement for the Managing Director;
– Exclude the short-term impact of unbudgeted and opportunistic acquisitions and divestments from performance assessment to encourage agility and responsiveness;
– Encourage holding of shares after vesting via a trading restriction for all executives and payment of LTI components in shares; and
– Prohibit hedging of unvested equity and equity subject to a trading lock to ensure alignment with shareholder outcomes.
Attract experienced, proven performers
– Provide a total remuneration opportunity sufficient to attract proven and experienced executives from secure positions in other companies and retain existing executives.
For
per
sona
l use
onl
y

Annual Report 2019 27
4. Relationship between remuneration policy and company performance
4.1 Company strategy and remuneration
Downer’s business strategy includes:
– Maintaining focus on Zero Harm by continually improving health, safety and environmental performance to achieve Downer’s goal of zero work-related injuries and significant environmental incidents;
– Driving growth in core markets through focusing on serving existing customers better across multiple products and service offerings, growing capabilities and investing in innovation, research and development and community and Indigenous partnerships;
– Creating new strategic positions through enhanced value add services that improve propositions for customers and exporting established core competencies into new overseas markets with current customers of the Company;
– Reducing risk and enhancing the Company’s capability to withstand threats, take advantage of opportunities and reduce cyclical volatility;
– Obtaining better utilisation of assets and improved margins through simplifying and driving efficiency;
– Identifying opportunities to manage the Downer portfolio through partnering, acquisition and divestment that deliver long-term shareholder value; and
– Maintaining flexibility to be able to adapt to the changing economic and competitive environment to ensure Downer delivers shareholder value.
The Company’s remuneration policy complements this strategy by:
– Incorporating Company-wide performance requirements for both STI and LTI reward vesting for earnings (NPATA), Free Cash Flow (FFO) and People measures to encourage cross-divisional collaboration;
– Incorporating performance metrics that focus on cash flow to reduce working capital and debt exposure;
– Setting NPATA, EBITA and FFO STI performance and gateway requirements based on effective application of funds employed to run the business for better capital efficiency;
– Employing FFO as the cash measure for the STI to provide more emphasis on control of capital expenditure;
– Excluding the short-term impacts of opportunistic and unbudgeted acquisitions and divestments on incentive outcomes to encourage flexibility, responsiveness and growth consistent with strategy;
– Deferring 50% of STI awards to encourage sustainable performance and a longer-term focus;
– Incorporating consistent financial performance in the LTIP Scorecard measure;
– Emphasis on Zero Harm measures in the STI to maintain the Company’s position as a Zero Harm leader and employer and service provider of choice, thereby delivering a competitive advantage; and
– Encouraging engagement with and the development and retention of its people to help maintain a sustainable supply of talent.
4.2 Remuneration linked to performance
The link to performance is provided by:
– Requiring a significant portion of executive remuneration to vary with short-term and long-term performance;
– Applying a profitability gateway to be achieved before an STI calculation for executives is made;
– Applying further Zero Harm gateways to be achieved before calculating any reward for safety or environmental performance;
– Applying challenging financial and non-financial measures to assess performance;
– Ensuring that these measures focus management on strategic business objectives that create shareholder value; and
– Delivering a significant proportion of payment in equity for alignment with shareholder interests.
Downer measures performance on the following key corporate measures:
– Earnings per share (EPS) growth;
– Total shareholder return (TSR) relative to other ASX 100 companies (excluding ASX “Financials” sector companies);
– Group NPATA;
– Divisional EBITA;
– FFO;
– Engagement with Downer’s people; and
– “Zero Harm” measures of safety and environmental sustainability.
Remuneration for all executives varies with performance on these key measures.
For
per
sona
l use
onl
y

28 Downer EDI Limited
Directors’ Report – continuedfor the year ended 30 June 2019
The following graph shows the Company’s performance compared to the median performance of the ASX 100 over the three-year period to 30 June 2019.
The graphs below illustrate Downer’s performance against key financial and non-financial performance indicators over the last five years.
0
50
100
150
200
250
300
210.2
180.6 181.5
247.81 258.32
$’m
Net profit after tax
2015 2016 20182017 2019
1. Adjusted for material unbudgeted transactions and individually significant items.2. Adjusted for material unbudgeted transactions.
0
10
20
30
40
50
43.9
38.035.8
10.7
42.9
Cen
ts p
er s
hare
Basic earnings per share5
2015 2016 20182017 2019
5. Historical basic earnings per share were restated as a result of 169.9 million shares issued from the capital raising made as part of the Spotless takeover offer announced on 21 March 2017. The weighted average number of shares (WANOS) to calculate EPS was adjusted by an adjustment factor of 0.943.
0
100
200
300
400344.3
242.3
203.03
178.33 185.74
$’m
Free cash flow
2015 2016 20182017 2019
3. Adjusted for material unbudgeted transactions, including payment for Spotless shares.
4. Adjusted for material unbudgeted transactions.
0.0
0.2
0.4
0.6
0.8
1.0
1.2
Lost
Tim
e In
juri
es p
er 1,
000,
000
hour
s
Tota
l Rec
orda
ble
Inju
ries
per
1,00
0,00
0 ho
urs
0
2
4
6
8
10
12
TRIFRLTIFRSafety
0.70
0.87
0.66
0.55
0.78
0.57
2015 2016 20182017 2019
0
* S&P/ASX 100 companies as at 30/06/2016
Tota
l Sha
reho
lder
Ret
urn
(Ind
exed
to 10
0)
S&P/ASX 100 median TSRDowner EDI TSR
Downer EDI TSR compared to S&P/ASX 100 median*
50
100
150
200
250
Jun2016
Dec2016
Jun2017
Dec2017
Jun2018
Dec2018
Jun2019
For
per
sona
l use
onl
y

Annual Report 2019 29
5. The Board’s role in remuneration
The Board engages with shareholders, management and other stakeholders as required, to continuously refine and improve executive and Director remuneration policies and practices.
Two Board Committees deal with remuneration matters. They are the Remuneration Committee and the Nominations and Corporate Governance Committee.
The role of the Remuneration Committee is to review and make recommendations to the Board in relation to executives in respect of:
– Executive remuneration and incentive policy;
– Remuneration of senior executives of the Company;
– Executive reward and its impact on risk management;
– Executive incentive plans;
– Equity-based incentive plans;
– Superannuation arrangements;
– Recruitment, retention, performance measurement and termination policies and procedures for all Key Management Personnel and senior executives reporting directly to the Managing Director;
– Disclosure of remuneration in the Company’s public materials including ASX filings and the Annual Report; and
– Retirement payments for all Key Management Personnel and senior executives reporting directly to the Managing Director.
The Nominations and Corporate Governance Committee is responsible for recommending and reviewing remuneration arrangements for the Executive Director and Non-executive Directors of the Company.
Each Committee has the authority to engage external professional advisers without seeking approval of the Board or management. During the reporting period, the Remuneration Committee retained Guerdon Associates Pty Ltd as its adviser. Guerdon Associates Pty Ltd does not provide services to management and is considered to be independent.
Remuneration arrangements for executives of Spotless are set by the Board of Spotless. Spotless’ People and Remuneration Committee is comprised of two independent Directors and one Director nominated by Downer.
Details of the remuneration structure and arrangements for 2019 for the Chief Executive Officer – Spotless, as established by the Spotless Board, are outlined at section 6.7.
For
per
sona
l use
onl
y

30 Downer EDI Limited
Directors’ Report – continuedfor the year ended 30 June 2019
6. Description of executive remuneration
6.1 Executive remuneration structure
Executive remuneration has a fixed component and a component that varies with performance.
The variable component ensures that a proportion of pay varies with performance. Performance is assessed annually for performance periods covering one year and three years. Payment for performance assessed over one year is an STI. Payment for performance over a three-year period is an LTI.
In order for maximum STIs to be awarded, performance must achieve a stretch goal that is a clear margin above the planned budget for the period. This enables the Company to attract and retain better performing executives, and ensures pay outcomes are aligned with shareholder returns.
Target STIs are less than the maximum STI. Target STI is payable on achievement of planned objectives. For executives the target STI is 75% of the maximum STI. The maximum total remuneration that can be earned by an executive is capped. The maximums are determined as a percentage of fixed remuneration.
Executive position
Target STI % of
fixed remuneration
Maximum STI % of
fixed remuneration
Maximum LTI % of
fixed remuneration
Maximum total performance
based pay as a % of fixed remuneration
Managing DirectorExecutives appointed prior to 2011Executives appointed from 2011
7575
56.25
100100
75
1007550
200175125
The proportions of STI to LTI take into account:
– Market practice;
– The service period before executives can receive equity rewards;
– The behaviours that the Board seeks to encourage through direct key performance indicators; and
– The guideline for the Managing Director to maintain a shareholding as a multiple of pay after long-term incentive rewards have vested.
6.2 Fixed remuneration
Fixed remuneration is the sum of salary and the direct cost of providing employee benefits, including superannuation, motor vehicles, car parking, living away from home expenses and fringe benefits tax.
The level of remuneration is set to be able to retain proven performers and when necessary to attract the most suitable external candidates from secure employment elsewhere.
Remuneration is benchmarked against a peer group of direct competitors and a sector peer group. While market levels of remuneration are monitored on a regular basis, there is no contractual requirement or expectation that any adjustments will be made.
No adjustment has been made to remuneration for the Managing Director since July 2012.
For
per
sona
l use
onl
y

Annual Report 2019 31
6.3 Short-term incentive
6.3.1 STI tabular summary
The following table outlines the major features of the 2019 STI plan.
Purpose of STI plan – Focus performance on drivers of shareholder value over 12-month period;
– Improve “Zero Harm” and people related results; and
– Ensure a part of remuneration costs varies with the Company’s 12-month performance.
Minimum performance “gateway” before any payments can be made
Achievement of a gateway based on budgeted Group NPATA for corporate executives and Division EBITA for divisional heads.
Maximum STI that can be earned – KMP appointed pre 2011: up to 100% of fixed remuneration; and
– KMP appointed from 2011: up to 75% of fixed remuneration.
Percentage of STI that can be earned on achieving target expectations
75% of the maximum. For an executive to receive more, performance in excess of target expectations will be required.
Individual Performance Modifier (IPM)
– An IPM may be applied based on an executive’s individual key performance indicators and relative performance;
– Moderate individual performance may result in an IPM of less than 1 or outstanding performance may result in an IPM greater than 1. The IPM must average 1 across all participants; and
– Application of an IPM cannot result in an award greater than the maximum STI% level set out in section 6.1.
Discretion to vary payments The Board, in its discretion, may vary STI payments by up to + or – 100% from the payment applicable to the level of performance achieved, up to the maximum for that executive.
Performance period 1 July 2018 to 30 June 2019.
Performance assessed August 2019, following audit of accounts.
Additional service period after performance period for payment to be made
50% of the award is deferred with the first tranche of 25% vesting one year following award and the second tranche of 25% vesting two years following award.
Payment timing September 2019 for the first cash payment of 50% of the award. The deferred components of the STI payments will be paid one and two years following the award, in equal tranches of 25% of the award.
Form of payment Cash for initial payment.
The value of deferred components will be settled in cash or shares, net of personal tax. An eligible leaver’s deferred components will be settled in shares or in cash in the sole and absolute discretion of the Board.
Performance requirements Group NPATA and divisional EBITA, FFO, Zero Harm and people measures.
Board discretion The Board may exercise discretion to:
– Reduce partly or fully the value of the deferred components that are due to vest in certain circumstances, including where an executive has acted inappropriately or where the Board considers that the financial results against which the STI performance measures were tested were incorrect in a material respect or have been reversed or restated; and
– Settle deferred components in shares or cash.
New recruits New executives (either new starts or promoted employees) are eligible to participate in the STI in the year in which they commence in their position with a pro-rata entitlement.
Terminating executives There is no STI entitlement where an executive’s employment terminates prior to the end of the financial year. Where an executive’s employment terminates prior to the vesting date, the unvested deferred components will be forfeited. However, the Board has retained discretion to vest deferred awards, in the form of shares or cash, in their ordinary course where the executive is judged to be an eligible leaver.
For
per
sona
l use
onl
y

32 Downer EDI Limited
Directors’ Report – continuedfor the year ended 30 June 2019
6.3.2 STI overview
The STI plan provides for an annual payment that varies with annual performance. This has been applied to performance measured over the Company’s financial year to 30 June 2019.
The basis of the plan is designed to align STI outcomes with financial results. No STI is paid unless a minimum profit gateway is met. For corporate executives, the gateway is based on the Group budgeted profit target. For divisional executives, the gateway is based on the division budgeted profit target. Profit for this purpose is defined as NPATA for corporate executives and EBITA for divisional executives. This minimum must be at a challenging level to justify the payment of STI to an executive, and deliver an acceptable return for the funds employed in running the business. Positive and negative impacts from material but unbudgeted and opportunistic transactions are excluded from gateway assessment. Whether to exclude the impact of significant items (positive or negative) is considered on a case by case basis.
As noted in section 6.1, the maximum STI that can be earned is capped to minimise excessive risk taking.
Deferral is a key feature as part of the STI structure. Payment of 50% of the award is paid at the time of award in cash and the remaining 50% of the award earned is deferred over two years.
The first payment of 50% of the award will be in cash after finalisation of the annual audited results. The payment of the deferred component of the award will be in the form of two tranches, each to the value of 25% of the award.
The deferred components represent an entitlement to cash or shares, subject to the satisfaction of a continued employment condition. The first tranche will vest one year following award and the second tranche will vest two years following award, provided an executive remains employed by the Group at the time of vesting.
The value of deferred components will generally be settled in shares, net of applicable personal tax. This is designed to encourage executive share ownership, and not adversely impact executives who have to meet their taxation obligations arising from the vesting of the deferred components. However, the Board retains the discretion to vest deferred awards, in the form of shares or cash, and will generally have regard to an executive’s individual circumstances and existing level of equity ownership.
No dividend entitlements are attached to the deferred components during the vesting period.
Where an executive ceases employment with the Group prior to the vesting date, the deferred components will be forfeited. However, the Board has retained the discretion to vest deferred awards, in the form of shares or cash, in their ordinary course where the executive is judged to be an eligible leaver.
6.3.3 How STI payments are assessed
Target STI plan percentage of pay An individual’s target incentive under the STI plan is expressed as a percentage of fixed remuneration. The STI plan percentage is set according to policy tabulated in section 6.1.
Organisational or divisional scorecard result
As a principle, “target” achievement would be represented at budget. Thresholds and maximums are also set.
Individual Performance Modifier (IPM)
At the end of the plan year, eligible employees are provided with an IPM against their key performance indicators and relative performance. Individual key performance indicators are set between the individual and the Managing Director (if reporting to the Managing Director) or the Board (if the Managing Director) at the start of the performance period. IPMs must average to 1.
STI plan incentive calculation Fixed remuneration x maximum STI plan percentage x scorecard result x IPM.
For
per
sona
l use
onl
y

Annual Report 2019 33
6.3.4 STI performance requirements
Overall performance is assessed on Group NPATA, Divisional EBITA, FFO, Zero Harm and a measure of employee engagement.
NPATA and EBITA include joint ventures and associates and include, inter alia, changes in accounting policy. NPATA and EBITA provide transparency on operational business performance, align with how Downer presents its results to the market and allow for easier understanding of alignment between performance and remuneration outcomes. The Board considers this approach to be appropriate as the Board is the ultimate decision maker for transactions that give rise to acquired intangibles that result in the amortisation expense and the impact of amortisation of acquired intangibles, which in nature relate to long-term strategic decisions, remains reflected in incentive outcomes through the EPS measure in the LTI plan.
FFO is defined as net cash from operating activities (i.e. EBIT plus non-cash items in operating profit plus distributions received from JVs or associates plus movements in working capital plus movements in operating assets less net interest less tax paid), less investing cash flow.
Zero Harm reflects Downer’s commitment to safety and environmental, social and governance matters. The Zero Harm element includes safety and environmental measures, underscoring Downer’s commitment to customers, employees, regulators and the communities in which it operates.
The measures for the Zero Harm element of the scorecard are as follows:
Measure Target
Safety
TRIFR (total recordable injury frequency rate)
LTIFR (lost time injury frequency rate)
Achieve TRIFR and LTIFR below defined threshold levels for area of responsibility. TRIFR is calculated as the number of recordable injuries x 1,000,000/the hours worked in 12 months. LTIFR is calculated as the number of lost time injuries x 1,000,000/the hours worked in 12 months.
Environmental
GHG Emission Reductions
Reset the baseline year to FY18 and develop three-year Plan for GHG emission reductions. Set targets identified for greenhouse gas emission reductions and the achievement of FY19 greenhouse emission reduction targets for the area of control.
Critical risks Conduct an operationally led review of Bow Tie analyses. Critically analyse critical risk control performance and initiate a program of projects to improve the resilience of critical controls.
Zero Harm Leadership Performance of a minimum number of critical risk observations by senior executives within the relevant area of control, other areas of Downer and in partnership with clients.
Should a workplace fatality or serious environmental incident occur, the relevant safety or environmental portion of the STI is foregone.
Weightings applied to the 2019 STI scorecard measures for all executives, including the Managing Director, are set out in the table below.
Executive Group NPATA Divisional EBITA Free cash flow Zero Harm People
Corporate 30% – 30% 30% 10%
Business unit 7.5% 22.5% 30% (7.5% Group,
22.5% division)
30% 10% (3% Group, 7% division)
The Board has discretion to vary STI payments by up to + or – 100% from the payment applicable to the level of performance achieved, up to the maximum for that executive.
Specific details of STI performance requirements are set out in section 7.3.
The Board retains the right to vary from policy in exceptional circumstances. However, any variation from policy and the reasons for it will be disclosed.
For
per
sona
l use
onl
y

34 Downer EDI Limited
Directors’ Report – continuedfor the year ended 30 June 2019
6.4 Long-term incentive
6.4.1 LTI tabular summary
The following table outlines the major features of the 2019 LTI plan.
Purpose of LTI plan – Focus performance on drivers of shareholder value over three-year period;
– Manage risk by countering any tendency to over-emphasise short-term performance to the detriment of longer-term growth and sustainability; and
– Ensure a part of remuneration costs varies with the Company’s longer-term performance.
Maximum value of equity that can be granted
– Managing Director: 100% of fixed remuneration;
– KMP appointed pre-2011: 75% of fixed remuneration; and
– KMP appointed from 2011: 50% of fixed remuneration.
Performance period 1 July 2018 to 30 June 2021.
Performance assessed September 2021.
Additional service period after performance period for shares to vest
Performance rights for which the relevant performance vesting condition is satisfied will not vest unless executives remain employed with the Group on 30 June 2022.
Performance rights vest July 2022.
Form of award and payment Performance rights.
Performance conditions There are three performance conditions. Each applies to one-third of the performance rights granted to each executive.
Relative TSR
The relative TSR performance condition is based on the Company’s TSR performance relative to the TSR of companies comprising the ASX 100 index, excluding financial services companies, at the start of the performance period, measured over the three years to 30 June 2021.
The performance vesting scale that will apply to the performance rights subject to the relative TSR test is shown in the table below:
Downer EDI Limited’s TSR Ranking
Percentage of performance rights subject to TSR condition that qualify for vesting
< 50th percentile 0%
50th percentile 30%
Above 50th and below 75th percentile
Pro rata so that 2.8% of the performance rights in the tranche will vest for every 1 percentile increase between the 50th percentile and 75th percentile
75th percentile and above 100%
For
per
sona
l use
onl
y

Annual Report 2019 35
EPS growth
The EPS growth performance condition is based on the Company’s compound annual EPS growth over the three years to 30 June 2021.
The performance vesting scale that will apply to the performance rights subject to the EPS growth test is shown in the table below:
Downer EDI Limited’s EPS compound annual growth
Percentage of performance rights subject to EPS condition that qualify for vesting
< 5% 0%
5% 30%
Above 5% to < 10% Pro rata so that 14% of the performance rights in the tranche will vest for every 1% increase in EPS growth between 5% and 10%
10% or more 100%
Scorecard
The Scorecard performance condition is based on the Group’s NPATA and FFO for each of the three years to 30 June 2021. These measures are considered to be key drivers of shareholder value. Accordingly, they have been included in the LTI plan to reward sustainable financial performance.
The performance vesting scale that will apply to the performance rights subject to the Scorecard test is shown in the table below:
Scorecard resultPercentage of performance rights subject to Scorecard condition that qualify for vesting
< 90% 0%
90% 30%
Above 90% to < 110% Pro rata so that 3.5% of the performance rights in the tranche will vest for every 1% increase in the Scorecard result between 90% and 110%
110% or more 100%
How performance rights and shares are acquired
The rights are issued by the Company and held by the participant subject to the satisfaction of the vesting conditions. The number of rights held may be adjusted pro-rata, consistent with ASX adjustment factors, for any capital restructures.
If the rights vest, executives can exercise them to receive shares that are normally acquired on-market.
Treatment of dividends and voting rights on performance rights
Performance rights do not have voting rights or accrue dividends.
Restriction on hedging Hedging of entitlements under the plan by executives is not permitted.
Restriction on trading Vested shares arising from the rights may only be traded with the approval of the Remuneration Committee. Approval requires that trading comply with the Company’s Securities Trading Policy.
New participants New executives (either new starts or promoted employees) are eligible to participate in the LTI on the first grant date applicable to all executives after they commence in their position. An additional pro-rata entitlement if their employment commenced after the grant date in the prior calendar year may be made on a discretionary basis.
Terminating executives Where an executive ceases employment with the Group prior to the vesting date, the rights will be forfeited. However, the Board will retain the discretion to retain executives in the plan in certain circumstances including the death, total and permanent disability or retirement of an executive. In these circumstances, the Board will also retain the discretion to vest awards in the form of cash.
For
per
sona
l use
onl
y

36 Downer EDI Limited
Directors’ Report – continuedfor the year ended 30 June 2019
Change of control On the occurrence of a change of control event, and providing at least 12 months of the grants’ performance period have elapsed, unvested performance rights pro rated with the elapsed service period are tested for vesting with performance against the relevant relative TSR, EPS growth or Scorecard requirements for that relevant period. Vesting will occur to the extent the performance conditions are met. Performance rights that have already been tested, have met performance requirements and are subject to the completion of the service condition, fully vest.
6.4.2 LTI overview
Executives participate in a LTI plan. This is an equity-based plan that provides for a reward that varies with Company performance over three-year measures of performance. Three-year measures of performance are considered to be the maximum reasonable time period for setting incentive targets for earnings per share and are generally consistent with market practice in the Company’s sector.
The payment is in the form of performance rights. The performance rights do not have any dividend entitlements or voting rights. If all the vesting requirements are satisfied, the performance rights will vest and the executives will receive shares in the Company or cash at the discretion of the Board.
The 2019 LTI represents an entitlement to performance rights to ordinary shares exercisable subject to satisfaction of both a performance condition and a continued employment condition. Grants will be in three equal tranches, with each tranche subject to an independent performance requirement. The performance requirements for each tranche will share two common features:
– Once minimum performance conditions are met, the proportion of performance rights that qualify for vesting commences at 30% and gradually increases pro rata with performance. This approach provides a strong motivation for meeting minimum performance, but avoids a large “cliff” which may encourage excessive risk taking; and
– The maximum reward is capped at a “stretch” performance level that is considered attainable without excessive risk taking.
Performance for the 2019 LTI grants will be measured over the three-year period to 30 June 2021.
The proportion of performance rights that can vest will be calculated in September 2021, but executives will be required to remain in service until 30 June 2022 to be eligible to receive any shares.
Where an executive ceases employment with the Group prior to the vesting date, the rights will be forfeited. However, the Board will retain the discretion to retain executives in the plan in certain circumstances such as the death, total and permanent disability or retirement of an executive. In these circumstances, the Board will also retain the discretion to vest awards in the form of cash.
After vesting, any shares will remain subject to a trading restriction that is governed by the Company’s Securities Trading Policy.
All unvested performance rights will be forfeited if the Board determines that an executive has committed an act of fraud, defalcation or gross misconduct or in other circumstances at the discretion of the Board.
For
per
sona
l use
onl
y

Annual Report 2019 37
6.4.3 Performance requirements
One tranche of performance rights in the 2019 LTI grant will qualify for vesting subject to performance relative to other companies, while the other two tranches of performance rights will qualify for vesting subject to separate, independent absolute performance requirements.
The relative performance requirement applicable to the first tranche of performance rights is based on total shareholder return (TSR). TSR is calculated as the difference in share price over the performance period, plus the value of shares earned from reinvesting dividends received over this period, expressed as a percentage of the share price at the beginning of the performance period. If the TSR for each company in the comparator group is ranked from highest to lowest, the median TSR is the percentage return to shareholders that exceeds the TSR for half of the comparison companies. The 75th percentile TSR is the percentage return required to exceed the TSR for 75% of the comparison companies.
Performance rights in the tranche to which the relative TSR performance requirement applies will vest pro rata between the median and 75th percentile. That is, 30% of the tranche vest at the 50th percentile, 32.8% at the 51st percentile, 35.6% at the 52nd percentile and so on until 100% vest at the 75th percentile.
The comparator group for the 2019 LTI grants will be the companies, excluding financial services companies, in the ASX 100 index as at the start of the performance period on 1 July 2018. Consideration has been given to using a smaller group of direct competitors for comparison, however:
– Limiting the comparator group to a small number of direct competitors could result in very volatile outcomes from period to period; and
– Management’s strong focus on improving the Company’s ranking among ASX 100 companies has become embedded in Company culture, so reinforcing this rather than trying to dislodge it with another focus was considered desirable.
The absolute performance requirement applicable to the second tranche of performance rights is based on Earnings per Share (EPS) growth over the three-year performance period to 30 June 2021. The EPS measure is based on AASB 133 Earnings per Share.
The tranche of performance rights dependent on the EPS performance condition will vest pro rata between 5% compound annual EPS growth and 10% compound annual EPS growth.
Vesting applies on a pro-rata basis from 30% upon meeting the minimum compound annual EPS growth performance level of 5% to 100% at 10% annual compound annual EPS growth. Capping reduces the tendency for excessive risk taking and volatility that may be encouraged if the annual compound EPS growth bar is set above 10%.
The absolute performance requirement applicable to the third tranche of performance rights is based on the Scorecard condition over the three-year performance period to 30 June 2021.
The Scorecard condition is designed to:
– Strengthen retention through the setting of challenging targets on an annual basis that reflect prevailing market conditions, for a portion of LTI awards;
– Align with the STI plan to encourage a long-term approach to achieving annual financial performance targets;
– Improve the line of sight for executives so as to increase motivation and focus on consistent performance; and
– Focus on performance sustainability through reward of consistent achievement of absolute performance targets over the long term.
The Scorecard condition is comprised of two independent absolute components of equal weighting. These components are based on Group NPATA and Group FFO.
The performance of each component will be measured over the three-year period to 30 June 2021.
NPATA and FFO targets are set at the beginning of each of the three financial years. The performance of each component will be assessed each year relative to the targets. Performance of each component will be determined as the average of the annual performance assessments for the three years. The performance rights will vest on a pro-rata basis from 30% upon meeting the minimum three-year average component performance level of 90% of target to 100% at the capped maximum three-year average component performance level of 110% of target.
The processes and timing applicable for the Scorecard measure are outlined below:
Timing Actions
At the beginning of the plan
Weighting of components is determined. In 2019 the components are equally weighted.
At the beginning of each financial year
NPATA and FFO target performance levels are set.
At the end of each financial year
– Calculate actual performance; and
– Assess actual performance compared to target to determine performance percentage for the year.
At the end of three years
– Calculate average annual performance for each component; and
– Calculate award based on performance against the vesting range.
At the end of four years
Consider the continued service condition and determine vesting.
For
per
sona
l use
onl
y

38 Downer EDI Limited
Directors’ Report – continuedfor the year ended 30 June 2019
6.4.4 Post-vesting shareholding guideline
The Managing Director is required to continue holding shares after they have vested until the shareholding guideline has been attained. This guideline requires that the Managing Director holds vested long-term incentive shares equal in value to 100% of his fixed remuneration. The Managing Director’s shareholding is currently well in excess of the guideline.
The Remuneration Committee has discretion to allow variations from this guideline requirement. The guideline requirement has been developed to reinforce alignment with shareholder interests.
The Board retains the right to vary from policy in exceptional circumstances. However, any variation from policy and the reasons for it will be disclosed.
6.5 Treatment of major transactions
Downer has delivered significant shareholder value through a long history of strategic mergers, acquisitions and divestments. On each occasion, the Board considers the impact of these transactions. Where a transaction is both material and unbudgeted, the Board considers whether it is appropriate to adjust for its impact on the key performance indicators on which executive performance is measured. The objective of any adjustment is to ensure that opportunities to add value through an opportunistic divestment or acquisition should not be fettered by consideration of the impact on incentive payments. That is, executives should be ‘no better or worse off’ as a result of the transaction. No adjustments are made for market reactions to a transaction as the Board believes that management is accountable for those outcomes.
The Board considers this approach to be appropriate as it:
– Ensures that executives and the Board consider these transactions solely based on the best interests of Downer;
– Means executives remain accountable for transaction execution and post-transaction performance from the next budget cycle;
– Ensures that executives complete opportunistic transactions that are in the long-term interest of shareholders;
– Is consistent with the Board’s long-term view when considering the value of major transactions to Downer’s shareholders; and
– Ensures Downer remains agile and responsive in managing its portfolio by pursuing opportunities as and when they emerge rather than be constrained by the annual budget process.
In assessing Zero Harm performance of executives, the results of acquired businesses are excluded for a period of 12 months post-acquisition to ensure that management is accountable for the objectives set in the annual business planning process and in recognition that an integration period during which Downer’s Zero Harm framework (including systems, processes, definitions and measurement and reporting methods) is implemented
through the acquired business is appropriate. Where this transition to Downer’s framework takes place over a longer period due to the complexity of the implementation or the maturity profile of the acquired business, the Board will consider an extension to a more appropriate period.
6.6 Treatment of significant items
From time to time, Downer’s performance is impacted by significant items. Where these occur, the Board considers whether to adjust for their impact (positive or negative) on a case by case basis, having regard to the circumstances relevant to each item.
The Board considers this approach to be appropriate as it ensures that executives and the Board make decisions solely based on the best interests of Downer.
6.7 Chief Executive Officer – Spotless
Downer has an interest of 87.8% in Spotless Group Holdings Limited (Spotless). Remuneration arrangements for executives of Spotless are set by the Board of Spotless. Spotless’ People and Remuneration Committee is comprised of two independent Directors and one Director nominated by Downer.
Following is a summary of the remuneration structure and arrangements for FY19 for P Tompkins in his role as Chief Executive Officer – Spotless as established by the Spotless Board.
6.7.1 Remuneration structure
The remuneration for the CEO – Spotless has a fixed component and a component that varies with performance.
Fixed remuneration is the sum of salary and the direct cost of providing employee benefits, including superannuation and other non-cash benefits.
Remuneration is benchmarked against a peer group of competitors. While market levels of remuneration are monitored on a regular basis, there is no contractual requirement or expectation that any adjustments will be made.
The variable component ensures that a proportion of pay varies with performance. Performance is assessed annually for performance periods covering one year and three years. Payment for performance assessed over one year is an STI. Payment for performance assessed over three years is an LTI.
In 2018, the Spotless Board determined that it was inappropriate to grant performance rights under the LTI, which was based on EPS and TSR performance hurdles, due to the low level of free float shares in Spotless and lack of trading liquidity following the takeover by Downer. Accordingly, for 2019 the Spotless Board determined it was appropriate that P Tompkins – Chief Executive Officer – Spotless, participate in the Downer Group Long Term Incentive Plan.
For
per
sona
l use
onl
y

Annual Report 2019 39
6.7.2 STI tabular summary
The following table outlines the major features of the Spotless 2019 STI plan.
Minimum performance “gateway” before any payments can be made
Achievement of a gateway based on budgeted NPATA must be met before any STI payment can be made. A further Zero Harm gateway must be met for an award for safety performance to be made.
Maximum STI that can be earned 75% of fixed remuneration.
Percentage of STI that can be earned on achieving target expectations
56.25% of the maximum. For an executive to receive more, performance in excess of target expectations will be required.
Discretion to vary payments The Board, in its discretion, may vary STI payments by up to + or – 50% from the payment applicable to the level of performance achieved, up to the maximum for that executive.
Performance period 1 July 2018 to 30 June 2019.
Performance assessed August 2019, following audit of accounts.
Additional service period after performance period for payment to be made
50% of the award is deferred with the first tranche of 25% vesting one year following award and the second tranche of 25% vesting two years following award.
Payment timing September 2019 for the first payment of 50% of the award. The deferred components of the STI payments will be paid one and two years following the award, in equal tranches of 25% of the award.
Form of payment Payments are made in cash.
Performance requirements The Spotless performance scorecard is comprised of the following measures:
Measure Weighting
Group NPAT 7.5%
Divisional EBIT 22.5%
Group FFO 7.5%
Divisional FFO 22.5%
Zero Harm – Recordable Injury Frequency Rate 30%
People – talent and succession planning, regrettable turnover 10%
Board discretion The Board may exercise discretion to reduce partly or fully the value of the deferred components that are due to vest in certain circumstances, including where an executive has acted inappropriately or where the Board considers that the financial results against which the STI performance measures were tested were incorrect in a material respect or have been reversed or restated.
Terminating executives There is no STI entitlement where employment terminates prior to the end of the financial year. Where employment terminates prior to the vesting date, the unvested deferred components will be forfeited other than where the Spotless Board judges the executive to be an eligible leaver.
Further information on Spotless’ remuneration practices is contained in its Remuneration Report which can be found on the Spotless website www.spotless.com.F
or p
erso
nal u
se o
nly

40 Downer EDI Limited
Directors’ Report – continuedfor the year ended 30 June 2019
7. Details of executive remuneration
7.1 Remuneration received in relation to the 2019 financial year
Executives receive a mix of remuneration during the year, comprising fixed remuneration, an STI paid in cash and an LTI in the form of performance rights that vest four years later, subject to meeting performance and continued employment conditions.
The table below lists the remuneration actually received in relation to the 2019 financial year, comprising fixed remuneration, cash STIs relating to 2019, deferred STIs payable in 2019 in respect of prior years and the value of LTI grants that vested during the 2019 financial year. This information differs to that provided in the statutory remuneration table at section 7.2 which shows the accounting expense of LTIs and deferred STIs for 2019 determined in accordance with accounting standards rather than the value of LTI grants that vested during the year.
Fixed Remuneration1
$
Cash Bonus paid or payable in
respect of current year2
$
Deferred Bonus paid
or payable in respect of
prior years4 $
Total payments
$
Equity that vested
during 20193 $
Total remuneration
received $
G A Fenn 2,077,247 746,800 902,200 3,726,247 2,548,347 6,274,594
S Cinerari 1,134,090 481,580 494,065 2,109,735 802,731 2,912,466
M J Ferguson 937,500 280,050 269,499 1,487,049 – 1,487,049
S L Killeen 850,134 303,371 134,795 1,288,300 – 1,288,300
D Nelson 323,155 – – 323,155 – 323,155
B C Petersen 1,101,453 371,374 299,529 1,772,356 – 1,772,356
P J Tompkins 710,136 109,874 178,526 998,536 – 998,536
7,133,715 2,293,049 2,278,614 11,705,378 3,351,078 15,056,456
1 Fixed remuneration comprises salary and fees, payment of leave entitlements, non-monetary benefits and superannuation payments.2 Cash Bonus paid or payable in respect of current year represents cash payments in relation to the 2019 financial year. These comprise the 50% cash component of the
award. The remaining 50% of the total award is deferred as described in section 6.3.3 Represents the value of restricted shares granted in previous years that vested during the year, calculated as the number of restricted shares that vested multiplied by the
closing market prices of Downer shares on the vesting date.4 Deferred Bonus represents the deferred cash bonus amount to be paid in September 2019, being the second deferred component of the 2017 award and the first deferred
component of the 2018 award, being 25% of each award.
For
per
sona
l use
onl
y

Annual Report 2019 41
7.2 Remuneration of executive key management personnel required under the Corporations Act 2001 (Cth)
2019Short-term employee
benefitsPost-employment
benefits
Salaryand fees
$
Cash Bonus
paid or payable in
respect of current
year2
$
Deferred Bonus
paid or payable4
$
Non-monetary
$
Super-annuation
$
Other benefits
$
Term- ination
Benefits$
Subtotal$
Share-based
paymenttransac-
tions3
$Total
$
G A Fenn 1,774,469 746,800 821,975 282,247 20,531 – – 3,646,022 1,081,156 4,727,178
S Cinerari 1,079,469 481,580 488,492 25,030 29,591 – – 2,104,162 421,669 2,525,831
M J Ferguson 904,567 280,050 273,482 12,402 20,531 – – 1,491,032 295,400 1,786,432
S L Killeen 824,997 303,371 222,585 387 24,750 – – 1,376,090 163,390 1,539,480
D Nelson1 312,889 – – – 10,266 – 1,040,233 1,363,388 – 1,363,388
B C Petersen 1,079,469 371,374 325,368 1,453 20,531 – – 1,798,195 294,266 2,092,461
P J Tompkins1 686,640 109,874 149,834 8,925 14,571 – – 969,844 160,108 1,129,952
6,662,500 2,293,049 2,281,736 330,444 140,771 – 1,040,233 12,748,733 2,415,989 15,164,722
1 Amounts represent the payments relating to the period during which the individuals were Key Management Personnel (KMP).2 Cash Bonus paid or payable in respect of current year represents cash payments in relation to the 2019 financial year. These comprise the 50% cash component of
the award.3 Represents the value of vested and unvested equity expensed during the period including reversal for forfeited equity incentives and the probability of the incentives
vesting, in accordance with AASB 2 Share-based Payment, related to grants made to the executive, as outlined in section 8.3. Vesting of the majority of securities remains subject to significant performance and service conditions as outlined in section 6.4.
4 Deferred Bonus represents the value of deferred components attributable to the 2019 financial year based on amortisation of deferred components over the period from the commencement of the relevant performance year to the end of financial year to which payment of the relevant deferred component relates.
2018Short-term employee
benefitsPost-employment
benefits
Salaryand fees
$
Cash Bonus paid or
payable in respect
of currentyear2
$
Deferred Bonus paid or payable4
$
Non-monetary
$
Super-annuation
$
Other benefits
$Subtotal
$
Share-basedpaymenttransac-
tions3
$Total
$
G A Fenn 1,766,618 840,300 859,283 273,656 20,049 – 3,759,906 1,373,275 5,133,181
S Cinerari 1,038,284 492,580 491,054 14,084 30,377 – 2,066,379 546,250 2,612,629
M J Ferguson 792,549 267,846 224,583 12,402 20,049 – 1,317,429 211,220 1,528,649
S L Killeen 750,268 200,476 109,854 7,130 71,787 – 1,139,515 86,100 1,225,615
M J Miller1 450,420 156,576 192,511 19,773 13,689 – 832,969 187,063 1,020,032
D Nelson1 931,394 506,237 210,932 2,300 15,037 – 1,665,900 – 1,665,900
D J Overall1 785,743 – 335,984 2,319 12,829 – 1,136,875 161,500 1,298,375
B C Petersen 821,267 283,146 260,140 11,324 20,049 – 1,395,926 276,351 1,672,277
7,336,543 2,747,161 2,684,341 342,988 203,866 – 13,314,899 2,841,759 16,156,658
1 Amounts represent the payments relating to the period during which the individuals were Key Management Personnel (KMP).2 Cash Bonus paid or payable in respect of current year represents cash payments in relation to the 2018 financial year. These comprise the 50% cash component of
the award.3 Represents the value of vested and unvested equity expensed during the period including reversal for forfeited equity incentives and the probability of the incentives
vesting, in accordance with AASB 2 Share-based Payment, related to grants made to the executive, as outlined in section 8.3. Vesting of the majority of securities remains subject to significant performance and service conditions as outlined in section 6.4.
4 Deferred Bonus represents the value of deferred components attributable to the 2018 financial year based on amortisation of deferred components over the period from the commencement of the relevant performance year to the end of the financial year to which payment of the relevant deferred component relates.
For
per
sona
l use
onl
y

42 Downer EDI Limited
Directors’ Report – continuedfor the year ended 30 June 2019
7.3 Performance related remuneration
7.3.1 Performance outcomes required under the Corporations Act 2001 (Cth)
The table below lists the proportions of remuneration paid during the year ended 30 June 2019 that are performance and non- performance related and the proportion of STIs that were earned during the year ended 30 June 2019 due to the achievement of the relevant performance targets.
Proportion of 2019 remuneration 2019 Short-term incentive
Performance Related
%
Non-performance
Related %
Paid %
Forfeited %
G A Fenn1 56% 44% 75% 25%
S Cinerari1 55% 45% 88% 12%
M J Ferguson 48% 52% 75% 25%
S L Killeen 45% 55% 86% 14%
B C Petersen1 47% 53% 90% 10%
P J Tompkins1 37% 63% 29% 71%
1 Performance related portion includes the reversal of expense for forfeited equity incentives described in section 6.4.
7.3.2 STI performance outcomes
Specific STI financial and commercial targets remain commercially sensitive and so have not been reported.
In order for an STI to be paid, a minimum of 90% of the budgeted profit target must be met. For corporate executives, the hurdle is 90% of the Group budgeted profit target. Profit for this purpose is defined as NPATA. For divisional executives, the hurdle is 90% of the division budgeted profit target. Profit for this purpose is defined as EBITA.
The following table summarises the average performance achieved by the KMP across each element of the scorecard.
Group NPATA
Divisional EBITA
Group FFO
Divisional FFO
Zero Harm People
Weighting of scorecard element Corporate 30.0 30.0 30.0 10.0
Division 7.5 22.5 7.5 22.5 30.0 10.0
Percentage of the element achieved Corporate 31.0 84.6 100.0 100.0
Division1 31.1 71.9 84.7 84.3 97.9 100.0
1 Performance includes the results for each Division for each element, even if the EBITA gateway was not achieved.
For
per
sona
l use
onl
y

Annual Report 2019 43
The following table sets out the performance achieved by each KMP across each element of the scorecard.
G A Fenn and M J Ferguson
Element Measure Threshold Target Maximum
Zero Harm Safety and Environmental
People Employee engagement
Financial Profit (NPATA)
FFO
S Cinerari
Element Measure Threshold Target Maximum
Zero Harm Safety and Environmental
People Employee engagement
Financial Profit (NPATA/EBITA)
FFO
S L Killeen
Element Measure Threshold Target Maximum
Zero Harm Safety and Environmental
People Employee engagement
Financial Profit (NPATA/EBITA)
FFO
P J Tompkins
Element Measure Threshold Target Maximum
Zero Harm Safety and Environmental
People Talent and succession
Financial Profit (NPAT/EBIT)
FFO
B C Petersen
Element Measure Threshold Target Maximum
Zero Harm Safety and Environmental
People Employee engagement
Financial Profit (NPATA/EBITA)
FFO
For 2019, the IPM applied to each member of the KMP ranged from 0.6 to 1.
For
per
sona
l use
onl
y

44 Downer EDI Limited
Directors’ Report – continuedfor the year ended 30 June 2019
7.3.3 LTI performance outcomes
The table below summarises LTI performance measures tested and the outcomes for each executive.
Relevant executives1
Relevant LTI measure
Performance outcome
% LTI tranche that vested
G A Fenn,S Cinerari,B Petersen,P Tompkins
2016 plan
TSR tranche – percentile ranking of Downer’s TSR relative to the constituents of the ASX 100 over a three-year period.
Actual performance ranked at the 78th percentile based on a TSR result of 81.9%.
100% became provisionally qualified.
EPS tranche – compound annual earnings per share growth against absolute targets over a three-year period.
Actual performance was –6.64%.
0% became provisionally qualified. 100% were forfeited.
Scorecard tranche – sustained NPAT and FFO performance against budget over a three-year period.
Actual performance was 96.4% for NPAT and 178.1% for FFO.
76.2% became provisionally qualified.23.8% were forfeited.
1 Relevant executive refers to members of the KMP who are participants in the plan tested.
7.4 Major transactions and significant items
7.4.1 Major transactions
In 2019 Downer continued to optimise its portfolio in keeping with its strategy of creating efficient market positions to deliver long-term shareholder value through restructuring, partnering and acquisitions.
Downer undertook eight transactions during 2019. These transactions were the acquisition of Boleh Consulting, The Roading Company, Envar Group, FH Lismore and Rock N Road, a 50% interest in Repurpose It, as well as the remaining interests in the MHPS Plant Services and Downer Mouchel joint ventures.
In accordance with its policy, the Board considered the impact of each transaction on incentive outcomes and determined that:
– The acquisition of Boleh Consulting was immaterial and accordingly no adjustment would be made to incentive outcomes;
– The acquisition of The Roading Company Limited was immaterial and accordingly no adjustment would be made to incentive outcomes;
– The acquisition of Envar Group was reflected in the budget and accordingly no adjustment would be made to incentive outcomes;
– The acquisition of FH Lismore was immaterial and accordingly no adjustment would be made to incentive outcomes;
– The acquisition of Rock N Road was a material, unbudgeted transaction for which it was appropriate to adjust incentive outcomes;
– The acquisition of the 50% interest in Repurpose It was reflected in the budget and accordingly no adjustment would be made to incentive outcomes;
– The acquisition of the remaining interest in MHPS Plant Services was reflected in the budget and accordingly no adjustment would be made to incentive outcomes; and
– The acquisition of the remaining interest in the Downer Mouchel joint venture was a material, unbudgeted transaction for which it was appropriate to adjust incentive outcomes.
For
per
sona
l use
onl
y

Annual Report 2019 45
7.4.2 Significant items
During the year, three items had a significant impact. The Board considers such items at the end of each performance period and whether it is appropriate to adjust for their impact on incentive outcomes. In forming its views, the Board noted the robust operational performance of the Company and strong returns to shareholders through TSR returns of 86.2% and 116.7% over one and three years respectively, share price growth and increase in the dividend rate.
The Board considered it was appropriate to adjust incentive outcomes for the following items:
Item Description
Mining capital expenditure During the year, the Mining business was successful in negotiating expanded services at the Blackwater mine and a new contract at the Cadia mine. These opportunities were identified in business planning processes however crystalised earlier than expected.
In order to secure these opportunities, it was necessary to invest capital expenditure, which was unbudgeted, to acquire the necessary mining plant and equipment in 2019 rather than in future years.
Securing these opportunities in 2019 was considered to be in the best interest of Downer.
Accordingly, it was determined that it was appropriate to adjust incentive outcomes for this item.
Gain on revaluation of the existing interest in the Downer Mouchel joint venture
In December 2018, Downer acquired the remaining 50% interest in the Downer Mouchel joint venture by purchasing 100% of the shares in partner, KHSA Limited.
On acquisition, Downer’s existing 50% interest was re-measured to fair value in accordance with Australian Accounting Standards and compared to the existing carrying value. This resulted in a fair value gain on re-measurement of $17.0 million.
The Board determined that it was appropriate to adjust incentive outcomes for this item.
Murra Warra Wind Farm loss In December 2017, Downer and its partner Senvion GmbH, a leading global manufacturer of wind turbines based in Germany, entered into a contract for Stage One of the Murra Warra Wind Farm near Horsham in Western Victoria.
On 28 May 2019, Downer announced that Senvion GmbH had filed for self-administration proceedings in Germany.
On 1 August 2019, Downer announced that losses in relation to its obligation to complete Senvion GmbH’s scope were expected to be $45 million before tax ($31.5 million after tax).
No adjustment was made to incentive outcomes for this item.
For
per
sona
l use
onl
y

46 Downer EDI Limited
Directors’ Report – continuedfor the year ended 30 June 2019
7.4.3 Adjustments made to incentive calculations for major transactions and significant items
The Board determined that the following adjustments be made to KPI calculations for the impact of major transactions and significant items. The adjustments mean that executives are ‘no better or worse off’ as a result of the transactions and significant items so that performance is measured against delivery of the Company’s budget and business plan.
Measure Adjustment Impact on STI Impact on LTI
NPATA (STI) NPAT (LTI)
Net decrease of $18.0 million NPAT ($23.3 million NPATA) comprised of:
– Exclusion of fair value gain on revaluation of existing interest in Downer Mouchel Joint Venture of $17.0 million;
– Exclusion of operating earnings of Downer Mouchel (net of transaction costs and net interest expense) attributable to the additional interest of ($0.9) million NPAT ($4.4 million NPATA);
– Exclusion of operating earnings of Rock N Road (net of transaction costs and net interest expense) of $1.3 million; and
– Exclusion of operating earnings related to the unbudgeted capital expenditure in Mining of $0.6 million.
For Corporate scorecard participants, a decrease from 62.3% to 31.0% of the NPATA measure was achieved.
For Mining, Energy and Industrial scorecard participants, a decrease from 85.3% to 83.7% of the measure was achieved.
For Transport and Infrastructure scorecard participants, a decrease from 78.7% to 72.8% of the measure was achieved.
A decrease from 52.3% to 45.1% of rights in the NPAT tranche met the performance condition. This equates to 1.2% of the total number of rights in the grant.
FFO Net increase of $65.2 million comprised of:
– Exclusion of the cash flow impact on Downer Mouchel acquisition (transaction costs, net interest expense, operating cash and payment for business acquisition) of $20.3 million;
– Exclusion of the cash flow impact on Rock N Road acquisition (transaction costs, net interest expense, operating cash and payment for business acquisition) of $11.1 million; and
– Exclusion of the cash flow impact on Mining unbudgeted capex spent on Cadia and Blackwater (net interest expense, operating cash and payment for capex) of $33.8 million.
For Corporate scorecard participants:
– The gateway was met; and
– 84.6% of the FFO measure was achieved.
No change for Divisional participants.
No change.
Zero Harm The Zero Harm performance of acquired businesses has been excluded.
Not applicable as acquired businesses historical performance has been measured on a different basis.
Not applicable.
EPS The use of NPAT adjusted as set out above. Not applicable. No change.
TSR No adjustments were made. Not applicable. No change.
7.4.4 Future periods
For major transactions completed in 2019, the impact on operational performance is included in the 2020 budget and accordingly no adjustments are expected in respect of FY20 operational performance.
7.5 Variance from policy
There were no variances from policy during the year.For
per
sona
l use
onl
y

Annual Report 2019 47
8. Executive equity ownership
8.1 Ordinary shares
KMP equity holdings in fully paid ordinary shares and performance rights issued by Downer EDI Limited are as follows:
Ordinary shares Performance rights
Balance at1 July 2018
Net Change
Balance at 30 June 2019
Balance at 1 July 2018
Net Change
Balance at 30 June 2019
No. No. No. No. No. No.
G A Fenn 826,226 337,977 1,164,203 1,885,380 (329,888) 1,555,492
S Cinerari 10,407 96,056 106,463 699,195 (103,429) 595,766
M J Ferguson – 7,086 7,086 164,995 71,675 236,670
S L Killeen 1,000 1,663 2,663 66,240 65,805 132,045
B C Petersen 2,510 12,703 15,213 240,600 56,988 297,588
P J Tompkins 38,413 56,398 94,811 279,099 24,050 303,149
8.2 Preference shares
KMP equity holdings in fully paid preference shares issued by Works Finance (NZ) Limited, a wholly owned subsidiary of Downer EDI Limited, are as follows:
Preference shares
Balance at 1 July 2018
Net change
Balance at 30 June 2019
No. No. No.
S L Killeen 3,000 – 3,000
For
per
sona
l use
onl
y

48 Downer EDI Limited
Directors’ Report – continuedfor the year ended 30 June 2019
8.3 Options and rights
No performance options were granted by Downer EDI Limited or exercised during the 2019 financial year.
As outlined in section 6.4.1, the LTI plan for the 2019 financial year is in the form of performance rights. Relief from certain regulatory requirements was applied for and has been received from the Australian Securities and Investments Commission. During the year, grants of performance rights were made to KMP in respect of the 2019 financial year.
The following table shows the number of performance rights granted by Downer EDI Limited and percentage of performance rights that vested or were forfeited during the year for each grant that affects compensation in this or future reporting periods.
2015 Plan 2016 Plan
Number of performance
rights1Vested
%Forfeited
%
Number of performance
rights2Vested
%Forfeited
%
G A Fenn 541,920 62.4 – 711,717 – 41.3
S Cinerari 170,705 62.4 – 266,894 – 41.3
M J Ferguson – – – – – –
S L Killeen – – – – – –
B C Petersen – – – 63,017 – 41.3
P J Tompkins3 67,740 62.4 – 124,551 – 41.3
1 Grant date 2 June 2015. Expiry date is 1 July 2018. The fair value of shares granted was $4.23 per share for the EPS and Scorecard tranches and $1.70 per share for the TSR tranche.
2 Grant date 30 June 2016. Expiry date is 1 July 2019. The fair value of shares granted was $3.24 per share for the EPS and Scorecard tranches and $0.97 per share for the TSR tranche.
3 Vesting of rights under the 2015 Plan occurred prior to commencement of role as CEO of Spotless.
2017 Plan 2018 Plan 2019 Plan
Number of performance
rights1Vested
%Forfeited
%
Number of performance
rights2Vested
%Forfeited
%
Number of performance
rights3Vested
%Forfeited
%
G A Fenn 503,526 – – 332,160 – – 301,791 – –
S Cinerari 188,822 – – 137,016 – – 113,172 – –
M J Ferguson 94,411 – – 70,584 – – 71,675 – –
S L Killeen – – – 66,240 – – 65,805 – –
B C Petersen 106,999 – – 70,584 – – 82,993 – –
P J Tompkins 88,116 – – 66,432 – – 75,448 – –
1 Grant date 21 June 2017. Expiry date is 1 July 2020. The fair value of shares granted was $5.29 per share for the EPS and Scorecard tranches and $4.61 per share for the TSR tranche.
2 Grant date 21 June 2018. Expiry date is 1 July 2021. The fair value of shares granted was $6.12 per share for the EPS and Scorecard tranches and $3.38 per share for the TSR tranche.
3 Grant date 3 June 2019. Expiry date is 1 July 2022. The fair value of shares granted was $5.93 per share for the EPS and Scorecard tranches and $2.22 per share for the TSR tranche.
For
per
sona
l use
onl
y

Annual Report 2019 49
The maximum number of performance options and rights that may vest in future years that will be recognised as share-based payments in future years is set out in the table below:
Maximum number of shares for the vesting year
2020 2021 2022 2023
G A Fenn 418,015 503,526 332,160 301,791
S Cinerari 156,756 188,822 137,016 113,172
M J Ferguson – 94,411 70,584 71,675
S L Killeen – – 66,240 65,805
B C Petersen 37,012 106,999 70,584 82,993
P J Tompkins 73,153 88,116 66,432 75,448
The maximum expense for performance options and rights that may vest in future years that will be recognised as share-based payments in future years is set out in the table below. The amount reported is the value of share-based payments calculated in accordance with AASB 2 Share-based Payment over the vesting period.
2020 2021 2022
G A Fenn 1,424,492 787,301 354,348
S Cinerari 550,420 311,474 132,881
M J Ferguson 295,633 176,160 84,158
S L Killeen 163,605 163,605 77,265
B C Petersen 324,850 189,447 97,445
P J Tompkins 286,684 175,177 88,586
8.4 Remuneration consultants
Guerdon Associates Pty Ltd was engaged by the Board Remuneration Committee to provide remuneration advice in relation to KMP, but did not provide the Board Remuneration Committee with remuneration recommendations as defined under Division 1, Part 1.2, 9B (1) of the Corporations Act 2001 (Cth).
The Board was satisfied that advice received was free from any undue influence by Key Management Personnel to whom the advice may relate, because strict protocols were observed and complied with regarding any interaction between Guerdon Associates Pty Ltd and management, and because all remuneration advice was provided to the Board Remuneration Committee chair.
9. Key terms of employment contracts
9.1 Notice and termination payments
Executives are on contracts with no fixed end date.
The following table captures the notice periods applicable to termination of the employment of executives.
Termination notice period by Downer
Termination notice period by employee
Termination payments payable under contract
Managing Director 12 months 6 months 12 months
Other Executives 12 months 6 months 12 months
Termination payments are calculated based upon total fixed remuneration at the date of termination. No payment is made for termination due to gross misconduct.F
or p
erso
nal u
se o
nly

50 Downer EDI Limited
Directors’ Report – continuedfor the year ended 30 June 2019
9.2 Managing Director and Chief Executive Officer of Downer’s employment agreement
Mr Fenn was appointed as the Managing Director of Downer commencing on 30 July 2010. The following table sets out the key terms of the Managing Director’s employment agreement.
Term Until terminated by either party.
Fixed remuneration $2.0 million per annum. This has remained unchanged since July 2012.
Fixed remuneration includes superannuation and non-cash benefits but excludes entitlements to reimbursement for Mr Fenn’s home telephone rental and call costs, home internet costs and medical, life and salary continuance insurance. Mr Fenn may also be accompanied by his wife when travelling on business, at the Chairman’s discretion. There was no such travel during the year.
STI opportunity Mr Fenn is eligible to receive an annual STI and the maximum STI opportunity is 100% of fixed remuneration.
Any entitlement to an STI is at the discretion of the Board, having regard to performance measures and targets developed in consultation with Mr Fenn including Downer’s financial performance, safety, people, environmental and sustainability targets and adherence to risk management policies and practices. The Board also retains the right to vary the STI by + or – 100% (up to the 100% maximum) based on its assessment of performance. The STI deferral arrangements in place for KMP apply to Mr Fenn.
There is no STI entitlement where the Managing Director’s employment terminates prior to the end of the financial year, other than in the event of a change in control or by mutual agreement.
LTI opportunity Mr Fenn is eligible to participate in the annual LTI plan and the value of the award is 100% of fixed remuneration calculated using the volume weighted average price after each year’s half yearly results announcement.
Mr Fenn’s performance requirements have been described in section 6.4.
In the event of a change of control, providing at least 12 months of a grant’s performance period have elapsed, unvested shares and performance rights pro rated with the elapsed service period are tested for vesting with performance against the relevant hurdles for that period and vest, as appropriate. Shares that have already been tested, have met performance requirements and are subject to the completion of the service condition, fully vest.
Termination Mr Fenn can resign:
a) By providing six months’ written notice; or
b) Immediately in circumstances where there is a fundamental change in his role or responsibilities. In these circumstances, Mr Fenn is entitled to a payment in lieu of 12 months’ notice.
Downer can terminate Mr Fenn’s employment:
a) Immediately for misconduct or other circumstances justifying summary dismissal; or
b) By providing 12 months’ written notice.
When notice is required, Downer can make a payment in lieu of notice of all or part of any notice period (calculated based on Mr Fenn’s fixed annual remuneration).
If Mr Fenn resigns because ill health prevents him from continuing his duties, he will receive a payment in recognition of his past services equivalent to 12 months’ fixed remuneration. At the discretion of the Board, his shares under the LTI plan may also vest.
If Downer terminates Mr Fenn’s employment on account of redundancy, in addition to the notice (or payment in lieu of notice) required to be given by Downer, Mr Fenn will receive a payment in recognition of his past services equivalent to 12 months’ fixed remuneration.
If Mr Fenn resigns he will be subject to a six-month post-employment restraint in certain areas where the Downer Group operates, where he is restricted from working for competitive businesses.
Other The agreement contains provisions regarding leave entitlements, duties, confidentiality, intellectual property, moral rights and other facilitative and ancillary clauses. It also contains provisions regarding corporate governance and a provision dealing with the Corporations Act 2001 (Cth) limits on termination benefits to be made to Mr Fenn.
For
per
sona
l use
onl
y

Annual Report 2019 51
10. Related party information
10.1 Transactions with other related parties
Transactions entered into during the year with Directors of Downer EDI Limited and the Group are within normal employee, customer or supplier relationships on terms and conditions no more favourable than dealings in the same circumstances on an arm’s length basis and included:
– The receipt of dividends from Downer EDI Limited;
– Participation in the Long Term Incentive Plan;
– Terms and conditions of employment; and
– Reimbursement of expenses.
A number of Directors of the Company hold directorships in other entities. Several of these entities transacted with the Group on terms and conditions no more favourable than those available on an arm’s length basis.
11. Description of Non-executive Director remuneration
11.1 Non-executive Director remuneration policy
Downer’s Non-executive Director remuneration policy is to provide fair remuneration that is sufficient to attract and retain Directors with the experience, knowledge, skills and judgment to steward the Company.
There has been no change to the level of Non-executive Director fees since the prior reporting period and there will be no changes in the 2019 financial year.
Fees for Non-executive Directors are fixed and are not linked to the financial performance of the Company. The Board believes this is necessary for Non-executive Directors to maintain their independence.
Shareholders approved an annual aggregate cap of $2.0 million for Non-executive Director fees at the 2008 AGM. The allocation of fees to Non-executive Directors within this cap has been determined after consideration of a number of factors, including the time commitment of Directors, the size and scale of the Company’s operations, the skill sets of Board members, the quantum of fees paid to Non-executive Directors of comparable companies and participation in Board Committee work.
The basis of fees and the fee pool are reviewed when new Directors are appointed to the Board, when the structure of the Board changes, or at least every three years. Reference is made to individual Non-executive Director fee levels and workload (i.e. number of meetings and the number of Directors) at comparably sized companies from all industries other than the financial services sector, and the fee pools at these companies. In addition, an assessment is made on the extent of flexibility provided by the fee pool to recruit any additional Directors for planned succession after allocation of fees to existing Directors.
The Chairman receives a base fee of $375,000 per annum (inclusive of all Committee fees) plus superannuation. The other Non-executive Directors each receive a base fee of $150,000 per annum plus superannuation. Additional fees are paid for Committee duties: $35,000 for the chair of the Audit and Risk Committee; and $15,000 for the chair of each of the Zero Harm Committee, Remuneration Committee, Rail Projects Committee and Tender Risk Evaluation Committee.
Non-executive Directors are not entitled to retirement benefits. All Non-executive Directors are entitled to payment of statutory superannuation entitlements in addition to Directors’ fees.
For
per
sona
l use
onl
y

52 Downer EDI Limited
Directors’ Report – continuedfor the year ended 30 June 2019
11.2 Non-executive Directors’ remuneration
The table below sets out the remuneration paid to Non-executive Directors for the 2019 and 2018 financial years.
Short-term benefits Post-employment benefits
YearBoard fee
$Chair fee
$Total fees
$
Super- annuation
$
Termination benefits
$Total
$
R M Harding 2019 375,000 – 375,000 35,625 – 410,625
2018 375,000 – 375,000 35,625 – 410,625
S A Chaplain1 2019 150,000 21,146 171,146 16,259 – 187,405
2018 150,000 35,000 185,000 17,575 – 202,575
P S Garling 2019 150,000 15,000 165,000 15,675 – 180,675
2018 150,000 15,000 165,000 15,675 – 180,675
T G Handicott 2019 150,000 15,000 165,000 15,675 – 180,675
2018 150,000 15,000 165,000 15,675 – 180,675
N M Hollows1 2019 150,000 13,854 163,854 15,566 – 179,420
2018 5,000 – 5,000 475 – 5,475
C G Thorne 2019 150,000 30,000 180,000 17,100 – 197,100
2018 150,000 30,000 180,000 17,100 – 197,100
P L Watson 2019 16,965 – 16,965 1,612 – 18,577
1 N M Hollows succeeded S A Chaplain as Chair of the Audit and Risk Committee on 8 February 2019.
11.3 Equity held by Non-executive Directors
The table below sets out the equity in Downer held by Non-executive Directors for the 2019 and 2018 financial years.
2019 2018
Balance at 1 July 2018
Net change
Balance at 30 June 2019
Balance at 1 July 2017
Net change
Balance at 30 June 2018
R M Harding 14,210 14,646 28,856 14,210 – 14,210
S A Chaplain 103,799 – 103,799 103,799 – 103,799
P S Garling 16,940 3,022 19,962 16,940 – 16,940
T G Handicott 14,000 – 14,000 14,000 – 14,000
N M Hollows – 3,000 3,000 – – –
C G Thorne 82,922 – 82,922 82,922 – 82,922
P L Watson – – – – – –
Signed in accordance with a resolution of the Directors made pursuant to section 298(2) of the Corporations Act 2001 (Cth).
On behalf of the Directors
R M Harding Chairman
Sydney, 22 August 2019
For
per
sona
l use
onl
y

Annual Report 2019 53
Auditor’s Independence Declaration
KPMG, an Australian partnership and a member firm of the KPMG network of independent member firms affiliated with KPMG International Cooperative (“KPMG International”), a Swiss entity.
Liability limited by a scheme approved under Professional Standards Legislation.
Lead Auditor’s Independence Declaration under Section 307C of the Corporations Act 2001
To the Directors of Downer EDI Limited
I declare that, to the best of my knowledge and belief, in relation to the audit of Downer EDI Limited for the financial year ended 30 June 2019 there have been:
i. no contraventions of the auditor independence requirements as set out in the Corporations Act 2001 inrelation to the audit; and
ii. no contraventions of any applicable code of professional conduct in relation to the audit.
KPMG
K KNI_01 PAR_SIG_01Jpp PAR_NAM_0
1 PAR_POS_01 PAR_DAT_01 PAR_CIT_01
K Cameron Slapp Partner
Sydney 22 August 2019
For
per
sona
l use
onl
y

54 Downer EDI Limited
Independent Auditor’s Reportfor the year ended 30 June 2019
KPMG, an Australian partnership and a member firm of the KPMG network of independent member firms affiliated with KPMG International Cooperative (“KPMG International”), a Swiss entity.
Liability limited by a scheme approved under Professional Standards Legislation.
Independent Auditor’s Report
To the shareholders of Downer EDI Limited
Report on the audit of the Financial Report
Opinion
We have audited the Financial Report of Downer EDI Limited (the Company).
In our opinion, the accompanying Financial Report of the Company is in accordance with the Corporations Act 2001, including:
• giving a true and fair view of the Group’sfinancial position as at 30 June 2019 and of itsfinancial performance for the year ended on thatdate; and
• complying with Australian Accounting Standardsand the Corporations Regulations 2001.
The Financial Report comprises:
• Consolidated statement of financial position as at30 June 2019
• Consolidated statement of profit or loss and othercomprehensive income, Consolidated statement ofchanges in equity, and Consolidated statement ofcash flows for the year then ended
• Notes including a summary of significantaccounting policies
• Directors’ Declaration.
The Group consists of the Company and the entities it controlled at the year-end or from time to time during the financial year.
Basis for opinion
We conducted our audit in accordance with Australian Auditing Standards. We believe that the audit evidence we have obtained is sufficient and appropriate to provide a basis for our opinion.
Our responsibilities under those standards are further described in the Auditor’s responsibilities for the audit of the Financial Report section of our report.
We are independent of the Group in accordance with the Corporations Act 2001 and the ethical requirements of the Accounting Professional and Ethical Standards Board’s APES 110 Code of Ethics for Professional Accountants (the Code) that are relevant to our audit of the Financial Report in Australia. We have fulfilled our other ethical responsibilities in accordance with the Code.
For
per
sona
l use
onl
y

Annual Report 2019 55
Key Audit Matters
The Key Audit Matters we identified are:
• Recognition of revenue
• Value of goodwill
Key Audit Matters are those matters that, in our professional judgement, were of most significance in our audit of the Financial Report of the current period.
These matters were addressed in the context of our audit of the Financial Report as a whole, and in forming our opinion thereon, and we do not provide a separate opinion on these matters.
Recognition of revenue
Refer to Note B2 ‘Revenue’ ($12,789.4m)
The key audit matter How the matter was addressed in our audit
Recognition of revenue is a key audit matter due to the:
• Significance of revenue to the financialstatements;
• Large number of contracts with numerousestimation events that may occur over thecourse of the contract’s life. This results incomplex and judgemental revenue recognitionfrom rendering of services and constructioncontracts and therefore significant audit effortis required to gather sufficient appropriateaudit evidence for revenue recognition; and
• Transition adjustment arising from theadoption of AASB 15 Revenue from Contractswith Customers resulting in additional auditfocus. This effort is due to the complex natureof the changes to the accounting standard andthe financial impact on rendering of servicesand construction contract revenue, requiringsenior team involvement.
We focused on the Group’s assessment of the following elements of revenue recognition for rendering of services and construction contracts, as applicable:
• Estimating total expected costs to complete atinitiation of the contract, including costcontingencies for contracting risks, which havea high level of estimation uncertainty;
• Revisions to total expected costs for certainevents or conditions that occur during theperformance of the contract, or are expectedto occur to complete the contract, which isdifficult to estimate;
• The Group’s determination of contractualentitlement and assessment of the probabilityof customer approval of changes in scope
Our procedures included:
• We obtained an understanding of the Group’sprocess of accounting for rendering of services andconstruction contract revenues. We tested keycontrols such as:
‒ management’s review and approval of bid information including estimated project milestones, projected Earnings Before Interest and Tax (EBIT), Net Present Value (NPV), Return On Funds Employed (ROFE), and potential legal risks identified by the Group risk and legal team, as prescribed in the Group’s risk management process; and
‒ management’s detailed project reviews for key contracts, including cost to complete reviews, comparing to budget and original bid documentation.
• We undertook a sample of site visits (to bothcontract sites and commercial offices) across theGroup’s major divisions and geographies to obtain adetailed understanding of the Group’s contractprocesses, their consistent application, and tounderstand the variety of risk elements of thecontracts;
• We used data analytic routines to select a sample ofcontracts for testing based on a number ofquantitative and qualitative factors. These factorsincluded contracts with significant deterioration in margin, significant variations and claims, contractmodifications or variable consideration, and factorswhich indicated to us a greater level of judgementwas required by the Group when assessing therevenue recognition based on the estimatesdeveloped for current and forecast contractperformance. For the samples selected, where relevant:
For
per
sona
l use
onl
y

56 Downer EDI Limited
and/or price. The Group’s consideration of the enforceability or approval of the modification of the terms of a contract may include evidence that is written, oral or implied by customary business practice and therefore requires a degree of judgement. The Group’s determination of modifications can drive different accounting treatments, increasing the risk of inappropriately recognising revenue; and
• The Group’s policy for the determination of theamount of revenue recognised from variableconsideration being highly probable of notreversing. Variable consideration is contingenton the Group’s performance and includes keyperformance payments, liquidated damagesand abatements that offset revenue under thecontract. The Group's determination of anamount that is highly probable requires adegree of estimation and judgement. Thisincreased the audit effort we applied to gathersufficient appropriate audit evidence that thevariable consideration is highly probable.
‒ we read the selected contract terms and conditions to evaluate the individual characteristics of each contract reflected in the Group’s estimate;
‒ we assessed the estimation of total expected costs, including cost contingencies for contracting risks, by challenging the Group’s project and finance managers on their estimations. We also checked key forecast cost assumptions to underlying documentation such as Enterprise Bargaining Agreements for wage rates, historical costs for maintenance events and agreements with subcontractors;
‒ we assessed the Group’s ability to forecast margins on contracts by analysing the accuracy of previous margin forecasts to actual outcomes;
‒ we evaluated the Group’s assessment of when a modification to the contract scope and/or price for variations and claims is approved and enforceable. This included assessing the underlying records, legal documents, customer correspondence and contracts. We recalculated the amount of revenue using the modified features of the contract. We compared the recalculated amounts against the amounts recorded by the Group;
‒ we assessed the Group’s estimation of a highly probable amount for variations and claims by comparing underlying evidence such as timesheets, correspondence with customers, and reports from objective time and cost claim experts (where applicable) for consistency with contract terms;
‒ we evaluated the Group’s legal and external experts’ reports received on contentious matters to identify conditions indicating the inappropriate recognition of variations and claims. We checked the consistency of this to the inclusion or not of an amount in the estimates used for revenue recognition;
‒ we assessed the scope, competency and objectivity of the legal and external experts engaged by the Group; and
‒ we evaluated the appropriateness of the method applied by the Group to estimate the highly probable amount of the key performance payments, liquidated damages and abatements against the specific contract terms. This included gathering underlying evidence in relation to the Group’s performance against the terms of the contract. We then recalculated the amount of variable consideration. We compared the recalculated amounts to the
Independent Auditor’s Report – continuedfor the year ended 30 June 2019
For
per
sona
l use
onl
y

Annual Report 2019 57
amounts recorded by the Group as offsets to revenue.
• For contracts with customers where revenuerecognition is at a point in time rather than over time, we selected a statistical sample of revenuerecognised and checked to customer approval of theservice being performed or cash received;
• For a sample of contracts assessed by the Group forthe transitional adjustment of AASB 15 we evaluatedthe conclusions reached by the Group using ourunderstanding of the contracts obtained in theprocedures noted above, in the context of therequirements of AASB 15;
• We assessed the new disclosures relating to the initial adoption of AASB 15 against the requirementsof the accounting standard.
Value of goodwill
Refer to Note C6 ‘Intangible assets’ ($2,454.5m)
The key audit matter How the matter was addressed in our audit
The value of goodwill is a key audit matter due to the size of the balance (being 30.7% of total assets) and the significant audit effort arising from:
• The Group having 8 groups of Cash GeneratingUnits (CGUs) for which the impairment ofgoodwill is assessed;
• The risk that a reasonably possibleunfavourable change in certain keyassumptions for the Spotless CGU in theabsence of any mitigating factors, may result innil headroom for that CGU; and
• The Group reorganising its segments during theyear, necessitating our consideration of thecomposition of the Group’s CGUs and the levelat which goodwill was assessed.
We focused on the following key forward looking assumptions in the Group’s value in use models:
• Projected cash flows: Budgeted Earnings Before Interest, Tax, Depreciation and Amortisation (EBITDA) – including the outcome of tenders for the Spotless CGU;
• Discount rates – these are complicated innature and vary according to the conditionsand environment the specific CGU is subject tofrom time to time; and
• Long-term growth rates – certain valuations forCGUs of the Group are highly sensitive to
Our procedures included:
• We obtained an understanding of the Group’sgoodwill impairment assessment process and testedkey controls such as the review and approval ofbudgets and forecasts by management and theBoard;
• We considered the appropriateness of the value inuse method applied by the Group to perform theannual test of goodwill for impairment against therequirements of the accounting standards.
• We considered the Group’s determination of theirCGUs based on our understanding of the operationsof the Group and how independent cash inflowswere generated, against the requirements of theaccounting standards;
• We analysed the Group’s reorganised segments andthe Group’s internal reporting to assess the Group’smonitoring and management of activities, and theallocation of goodwill to CGUs;
• We obtained the Group’s value in use models andchecked amounts to the Board approved FY20budget and the FY21-FY22 business plan. Wechallenged the Group’s projected cash flows bycomparing the budget and business plan to ourunderstanding of the business and comparing theactual performance in FY19 to the budget for FY20;
• We challenged the key market based assumption,being the long term growth rate, against external
For
per
sona
l use
onl
y

58 Downer EDI Limited
changes in this assumption.
The significant judgement involved in key assumptions required the involvement of valuation specialists to supplement our senior audit team members in assessing this key audit matter.
.
analyst reports and published industry growth rates;
• For the Spotless CGU with a higher risk ofimpairment, for projected cash flows we assessedthe inclusion of key ongoing revenue contracts bycomparing the renewal rates in the value in usemodels to historical renewal rates. For currenttenders we assessed the probability weighting andmargins based on our understanding of thebusinesses historical win rates;
• We assessed the accuracy of previous Groupforecasting to inform our evaluation of forecastsincluded in the value in use models. We applied increased scepticism to current period forecasts inareas where previous forecasts were not achievedand/or where future uncertainty is greater orvolatility is expected;
• Working with our valuation specialists weindependently developed a discount rate range using publicly available market data for comparable entities, adjusted by risk factors specific to theGroup and the industry it operates in;
• We performed sensitivity analysis on CGUs in twomain areas, being the discount rate and long-termgrowth rate assumptions. For the Spotless CGU witha higher risk of impairment we performed a range ofsensitivity analyses to identify those assumptions athigher risk of bias or inconsistency in application.This included the discount rate, long-term growthrate and projected cash flows. We considered the sensitivity of the models by varying key assumptionswithin a reasonably possible range;
• We assessed the Group’s disclosures of thequantitative and qualitative considerations in relation to the valuation of goodwill, by comparingthese disclosures to our understanding and therequirements of the accounting standards.
Independent Auditor’s Report – continuedfor the year ended 30 June 2019
For
per
sona
l use
onl
y

Annual Report 2019 59
Other Information
Other Information is financial and non-financial information in Downer EDI Limited’s annual reporting which is provided in addition to the Financial Report and the Auditor's Report. The Directors are responsible for the Other Information.
Our opinion on the Financial Report does not cover the Other Information and, accordingly, we do not express an audit opinion or any form of assurance conclusion thereon, with the exception of the Remuneration Report and our related assurance opinion.
In connection with our audit of the Financial Report, our responsibility is to read the Other Information. In doing so, we consider whether the Other Information is materially inconsistent with the Financial Report or our knowledge obtained in the audit, or otherwise appears to be materially misstated.
We are required to report if we conclude that there is a material misstatement of this Other Information, and based on the work we have performed on the Other Information that we obtained prior to the date of this Auditor’s Report we have nothing to report.
Responsibilities of the Directors for the Financial Report
The Directors are responsible for:
• preparing the Financial Report that gives a true and fair view in accordance with Australian AccountingStandards and the Corporations Act 2001
• implementing necessary internal control to enable the preparation of a Financial Report that gives a trueand fair view and is free from material misstatement, whether due to fraud or error
• assessing the Group’s ability to continue as a going concern and whether the use of the going concern basisof accounting is appropriate. This includes disclosing, as applicable, matters related to going concern and using the going concern basis of accounting unless they either intend to liquidate the Group or to ceaseoperations, or have no realistic alternative but to do so.
Auditor’s responsibilities for the audit of the Financial Report
Our objective is:
• to obtain reasonable assurance about whether the Financial Report as a whole is free from materialmisstatement, whether due to fraud or error; and
• to issue an Auditor’s Report that includes our opinion.
Reasonable assurance is a high level of assurance, but is not a guarantee that an audit conducted in accordance with Australian Auditing Standards will always detect a material misstatement when it exists.
Misstatements can arise from fraud or error. They are considered material if, individually or in the aggregate, they could reasonably be expected to influence the economic decisions of users taken on the basis of the Financial Report.
A further description of our responsibilities for the audit of the Financial Report is located at the Auditing and Assurance Standards Board website at: http://www.auasb.gov.au/auditors_responsibilities/ar1.pdf. This description forms part of our Auditor’s Report.
For
per
sona
l use
onl
y

60 Downer EDI Limited
Report on the Remuneration Report
Opinion
In our opinion, the Remuneration Report of Downer EDI Limited for the year ended 30 June 2019, complies with Section 300A of the Corporations Act 2001.
Directors’ responsibilities
The Directors of the Company are responsible for the preparation and presentation of the Remuneration Report in accordance with Section 300A of the Corporations Act 2001.
Our responsibilities
We have audited the Remuneration Report included in pages 22 to 50 of the Directors’ report for the year ended 30 June 2019.
Our responsibility is to express an opinion on the Remuneration Report, based on our audit conducted in accordance with Australian Auditing Standards.
KPMG
Cameron Slapp Partner Sydney 22 August 2019
Independent Auditor’s Report – continuedfor the year ended 30 June 2019
For
per
sona
l use
onl
y

Annual Report 2019 61
Financial Statements
Page 62 Consolidated Statement of Profit or Loss and Other Comprehensive IncomePage 63 Consolidated Statement of Financial PositionPage 64 Consolidated Statement of Changes in EquityPage 65 Consolidated Statement of Cash Flows
Notes to the consolidated financial statements
AAbout this report
Page 66-67
BBusiness performance
Page 68-79
COperating assets and liabilities
Page 80-90
DEmployee benefits
Page 91
ECapital structure and financing
Page 92-99
FGroup structure
Page 100-110
GOther
Page 111-124
B1Segment information
C1Reconciliation of cash and cash equivalents
D1Employee benefits
E1Borrowings
F1Joint arrangements and associate entities
G1New accounting standards
B2Revenue
C2Trade receivables and contract assets
D2Key management personnel compensation
E2Financing facilities
F2Acquisition of businesses
G2Capital and financial risk management
B3Earnings per share
C3Inventories
D3Employee discount share plan
E3Commitments
F3Disposal of business
G3Other financial assets and liabilities
B4Taxation
C4Trade payables and contract liabilities
E4Issued capital
F4Controlled entities
B5Remuneration of auditors
C5Property, plant and equipment
E5Non-controlling interest (NCI)
F5Related party information
B6Subsequent events
C6Intangible assets
E6Reserves
F6Parent entity disclosures
C7Finance lease receivables
E7Dividends
C8Provisions
C9Contingent liabilities
Page 125 Directors’ Declaration
Other information
Page 126 Sustainability Performance Summary 2019Page 131 Corporate GovernancePage 142 Information for InvestorsF
or p
erso
nal u
se o
nly

62 Downer EDI Limited
Consolidated Statement of Profit or Loss and Other Comprehensive Incomefor the year ended 30 June 2019
Note2019
$’m 2018
$’m
Revenue B2 12,789.4 12,016.6
Other income B2 23.3 14.3
Total revenue and other income 12,812.7 12,030.9
Employee benefits expense D1 (4,340.4) (4,034.2)
Subcontractor costs (4,193.7) (3,781.3)
Raw materials and consumables used (2,114.4) (2,199.9)
Plant and equipment costs (689.8) (677.1)
Depreciation and amortisation C5, C6 (360.0) (370.2)
Other expenses from ordinary activities (682.6) (788.5)
Total expenses (12,380.9) (11,851.2)
Share of net profit of joint ventures and associates F1(a) 30.4 25.1
Earnings before interest and tax 462.2 204.8
Finance income 8.8 7.1
Finance costs (91.2) (88.2)
Net finance costs (82.4) (81.1)
Profit before income tax 379.8 123.7
Income tax expense B4(a) (103.5) (52.6)
Profit after income tax 276.3 71.1
Profit for the year is attributable to: – Non-controlling interest 14.5 (0.3)
– Members of the parent entity 261.8 71.4
Profit for the year 276.3 71.1
Other comprehensive income
Items that may be reclassified subsequently to profit or loss – Exchange differences arising on translation of foreign operations 9.6 (8.3)
– Net (loss) / gain on foreign currency forward contracts taken to equity (2.0) 4.8
– Net loss on cross currency and interest rate swaps taken to equity (13.7) (14.0)
– Change in fair value of available-for-sale assets – (1.3)
– Available-for-sale reserve transferred to profit or loss – (0.5)
– Income tax relating to components of other comprehensive income 4.3 2.6
Other comprehensive loss for the year (net of tax) (1.8) (16.7)
Other comprehensive loss for the year is attributable to: – Non-controlling interest (0.9) 0.7
– Members of the parent entity (0.9) (17.4)
Other comprehensive loss for the year (1.8) (16.7)
Total comprehensive income for the year 274.5 54.4
Earnings per share (cents) – Basic earnings per share B3 42.9 10.7
– Diluted earnings per share(i) B3 42.3 10.7
(i) At 30 June 2018, the ROADS are deemed anti-dilutive and consequently, diluted EPS remained at 10.7 cents per share.
The consolidated statement of profit or loss and other comprehensive income should be read in conjunction with the accompanying notes on pages 66 to 124.
For
per
sona
l use
onl
y

Annual Report 2019 63
Consolidated Statement of Financial Positionas at 30 June 2019
Note
30 June2019
$’m
30 June2018
$’m
ASSETSCurrent assetsCash and cash equivalents C1(c) 710.7 606.2 Trade receivables and contract assets C2 1,991.5 2,117.9 Other financial assets G3 35.0 18.6 Inventories C3 304.6 268.8 Finance lease receivables C7 12.4 4.0 Current tax assets 57.7 69.3 Prepayments and other assets 52.8 48.8 Total current assets 3,164.7 3,133.6
Non-current assetsTrade receivables and contract assets C2 74.4 113.2 Interest in joint ventures and associates F1(a) 108.8 96.0 Property, plant and equipment C5 1,373.3 1,280.4 Intangible assets C6 3,130.7 3,050.7 Other financial assets G3 5.2 15.5 Finance lease receivables C7 38.7 4.5 Deferred tax assets B4(b) 93.5 75.5 Prepayments and other assets 18.7 18.8 Total non-current assets 4,843.3 4,654.6 Total assets 8,008.0 7,788.2
LIABILITIESCurrent liabilitiesTrade payables and contract liabilities C4 2,405.5 2,281.6 Borrowings E1 14.6 153.7 Other financial liabilities G3 47.4 43.2 Employee benefits provision D1 340.5 336.7 Provisions C8 107.0 50.7 Current tax liabilities 15.4 15.7 Total current liabilities 2,930.4 2,881.6
Non-current liabilitiesTrade payables and contract liabilities C4 51.3 26.5 Borrowings E1 1,688.9 1,367.5 Other financial liabilities G3 20.0 34.2 Employee benefits provision D1 45.1 38.0 Provisions C8 84.5 65.1 Deferred tax liabilities B4(b) 137.6 170.2 Total non-current liabilities 2,027.4 1,701.5 Total liabilities 4,957.8 4,583.1 Net assets 3,050.2 3,205.1
EQUITYIssued capital E4 2,425.1 2,421.9 Reserves E6 (27.5) (26.9)Retained earnings 496.7 655.1 Parent interests 2,894.3 3,050.1 Non-controlling interest E5 155.9 155.0 Total equity 3,050.2 3,205.1
The consolidated statement of financial position should be read in conjunction with the accompanying notes on pages 66 to 124.
For
per
sona
l use
onl
y

64 Downer EDI Limited
2019 $’m
Issued capital Reserves
Retained earnings
Total attributable to owners of
the parent
Non- controlling
interest Total
Balance at 30 June 2018 2,421.9 (26.9) 655.1 3,050.1 155.0 3,205.1Opening balance adjustment on application of AASB 15(i) (net of tax) – – (245.3) (245.3) (12.7) (258.0)Balance at 1 July 2018 2,421.9 (26.9) 409.8 2,804.8 142.3 2,947.1
Profit after income tax – – 261.8 261.8 14.5 276.3 Other comprehensive loss for the year (net of tax) – (0.9) – (0.9) (0.9) (1.8)
Total comprehensive income for the year – (0.9) 261.8 260.9 13.6 274.5
Vested executive incentive share transactions 3.2 (3.2) – – – –
Share-based employee benefits expense – 4.0 – 4.0 – 4.0 Income tax relating to share-based transactions during the year – (0.5) – (0.5) – (0.5)
Payment of dividends(ii) – – (174.9) (174.9) – (174.9)
Balance at 30 June 2019 2,425.1 (27.5) 496.7 2,894.3 155.9 3,050.2
(i) Refer to Note G1 for details on opening balance adjustments made on application of new accounting standards.(ii) Payment of dividend relates to the 2018 final dividend, 2019 interim dividend and $8.3 million ROADS dividends paid during the financial year..
2018 $’m
Issued capital Reserves
Retained earnings
Total attributable to owners of
the parent
Non- controlling
interest Total
Balance at 1 July 2017 2,421.8 (10.9) 740.4 3,151.3 435.2 3,586.5
Profit after income tax – – 71.4 71.4 (0.3) 71.1 Other comprehensive income for the year (net of tax) – (17.4) – (17.4) 0.7 (16.7)
Total comprehensive income for the year – (17.4) 71.4 54.0 0.4 54.4
Capital raising (net of transaction costs and tax) (0.1) – – (0.1) – (0.1)
Vested executive incentive share transactions 0.2 (0.2) – – – –
Share-based employee benefits expense – 2.8 – 2.8 – 2.8 Income tax relating to share-based transactions during the year – (1.2) – (1.2) – (1.2)
Payment of dividends(i) – – (156.7) (156.7) – (156.7)
Acquisition of non-controlling interest – – – – (280.6) (280.6)
Balance at 30 June 2018 2,421.9 (26.9) 655.1 3,050.1 155.0 3,205.1
(i) Payment of dividend relates to the 2017 final dividend, 2018 interim dividend and $8.0 million ROADS dividends paid during the financial year.
The consolidated statement of changes in equity should be read in conjunction with the accompanying notes on pages 66 to 124.
Consolidated Statement of Changes in Equityfor the year ended 30 June 2019
For
per
sona
l use
onl
y

Annual Report 2019 65
Note2019
$’m 2018
$’m
Cash flows from operating activities
Receipts from customers 14,177.4 12,856.9
Distributions from equity accounted investees F1(a) 22.4 16.9
Payments to suppliers and employees (13,442.8) (12,164.3)
Interest received 5.2 7.4
Interest and other costs of finance paid (76.1) (77.6)
Income tax paid (55.9) (56.0)
Net cash generated by operating activities C1(a) 630.2 583.3
Cash flows from investing activities
Proceeds from sale of property, plant and equipment 16.1 22.7
Payments for property, plant and equipment (346.2) (356.8)
Payments for intangible assets (44.8) (47.0)
Payments for acquisition of Spotless – (391.8)
Payments for acquisition of businesses, net of cash acquired F2 (63.0) (84.1)
Investment in Joint Venture entities F1(a) (8.5) –
Divestment of Freight Rail F3 (6.9) 129.6
Receipts from investments – 0.4
Advances to joint ventures (5.5) (7.1)
Payments for leased assets (52.6) –
Proceeds from sale of assets – 4.5
Recovery on acquisition of business 1.7 –
Net cash used in investing activities (509.7) (729.6)
Cash flows from financing activities
Issue of shares (net of costs) – (0.2)
Proceeds from borrowings 3,859.3 2,043.9
Repayments of borrowings (3,704.2) (1,974.7)
Dividends paid (174.9) (156.7)
Net cash used in financing activities (19.8) (87.7)
Net increase / (decrease) in cash and cash equivalents 100.7 (234.0)
Cash and cash equivalents at the beginning of the year 606.2 844.6
Effect of exchange rate changes 3.8 (4.4)
Cash and cash equivalents at the end of the year C1(c) 710.7 606.2
The consolidated statement of cash flows should be read in conjunction with the accompanying notes on pages 66 to 124.
Consolidated Statement of Cash Flowsfor the year ended 30 June 2019
For
per
sona
l use
onl
y

66 Downer EDI Limited
Notes to the consolidated financial statementsfor the year ended 30 June 2019
AAbout this report
Statement of compliance
These financial statements represent the consolidated results of Downer EDI Limited (ABN 97 003 872 848). The consolidated Financial Report (Financial Report) is a general purpose financial report which has been prepared in accordance with Australian Accounting Standards (AASBs) adopted by the Australian Accounting Standards Board (AASB) and the Corporations Act 2001 (Cth). The Financial Report complies with International Financial Reporting Standards (IFRS) adopted by the International Accounting Standards Board (IASB).
The Financial Report was authorised for issue by the Board of Directors on 22 August 2019.
Rounding of amounts
Downer is a company of the kind referred to in ASIC Corporations (Rounding in Financial/Directors’ reports) Instrument 2016/191, relating to the “rounding off” of amounts in the Directors’ Report and consolidated financial statements. Unless otherwise expressly stated, amounts have been rounded off to the nearest whole number of millions of dollars and one place of decimals representing hundreds of thousands of dollars in accordance with that Instrument. Amounts shown as $- represent amounts less than $50,000 which have been rounded down.
Basis of preparation
The Financial Report has been prepared on a historical cost basis, except for the revaluation of certain financial instruments. Cost is based on the fair values of the consideration given in exchange for assets. All amounts are presented in Australian dollars, unless otherwise noted.
The accounting policies and methods of computation in the preparation of the Financial Report are consistent with those adopted and disclosed in Downer’s Annual Report for the financial year ended 30 June 2018, except in relation to the relevant new and amended accounting standards adopted by the Group and their effects on the current period or prior periods as described in Note G1.
Certain comparative balances have been reclassified to ensure consistency with current year classifications.
Accounting estimates and judgements
Preparation of the Financial Report requires management to make judgements, estimates and assumptions about future events. Information on material estimates and judgements considered when applying the accounting policies can be found in the following notes:
Accounting estimates and judgements Note Page
Revenue recognition B2 75
Recovery of deferred tax assets B4 78
Income taxes B4 78
Useful lives and residual values C5 85
Impairment of assets C6 87
Provisions C8 89
Annual leave and long service leave D1 91
Accounting for acquisition of businesses F2 106
Significant accounting policies
Accounting policies are selected and applied in a manner that ensures that the resulting financial information satisfies the concepts of relevance and reliability, thereby ensuring that the substance of the underlying transactions or other events is reported. Other significant accounting policies are contained in the notes to the Financial Report to which they relate.
(i) Principles of consolidation
The Financial Report incorporates the financial statements of the Company and entities controlled by the Group and its subsidiaries. The Group controls an entity when it is exposed to, or has rights to, variable returns from its involvement with the entity and has the ability to affect those returns from its involvement with the entity and has the ability to affect those returns through its power over the entity.
The Financial Report includes the information and results of each subsidiary from the date on which the Company obtains control and until such time as the Company ceases to control such entity.
In preparing the Financial Report, all intercompany balances and transactions, and unrealised profits arising within the consolidated entity, are eliminated in full.
For
per
sona
l use
onl
y

Annual Report 2019 67
A. About this report – continued
(ii) Foreign currency
Transactions, assets and liabilities denominated in foreign currencies are translated into Australian dollars at reporting date using the following applicable exchange rates:
Foreign currency amount Applicable exchange rate
Transactions Date of transaction
Monetary assets and liabilities Reporting date
Non-monetary assets and liabilities carried at fair value Date fair value is determined
Foreign exchange gains and losses resulting from translation are recognised in the statement of profit or loss, except for qualifying cash flow hedges which are deferred to equity.
On consolidation the assets, liabilities, income and expenses of foreign operations are translated into Australian dollars using the following applicable exchange rates:
Foreign currency amount Applicable exchange rate
Income and expenses Average exchange rate
Assets and liabilities Reporting date
Equity Historical date
Foreign exchange differences resulting from translation are initially recognised in the foreign currency translation reserve and subsequently transferred to the profit or loss on disposal of the foreign operation.
(iii) Finance and borrowing costs
Finance costs comprise interest expense on borrowings, unwind of discount of provisions, costs to establish financing facilities (which are expensed over the term of the facility), losses on ineffective hedging instruments that are recognised in profit or loss and finance lease charges.
For
per
sona
l use
onl
y

68 Downer EDI Limited
Notes to the consolidated financial statements – continuedfor the year ended 30 June 2019
BBusiness performance
This section provides the information that is most relevant to understanding the financial performance of the Group during the financial year and, where relevant, the accounting policies applied and the critical judgements and estimates made.
B1. Segment information
B2. Revenue
B3. Earnings per share
B4. Taxation
B5. Remuneration of auditors
B6. Subsequent events
B1. Segment information
Identification of reportable segments
An operating segment is a component of an entity that engages in business activities from which it may earn revenue and incur expenses, whose operating results are regularly reviewed by the Group’s chief operating decision maker in order to effectively allocate Group resources and assess performance.
The Group has identified its operating segments based on the internal reports that are reviewed and used by the Group CEO in assessing performance and in determining the allocation of resources. The operating segments are identified by the Group based on the nature of the services provided. Discrete financial information about each of these operating businesses is reported to the Group CEO on a recurring basis.
The reportable segments are based on a combination of operating segments determined by the similarity of the services provided, and the sources of the Group’s major risks that could therefore have the greatest effect on the rates of return. Downer has determined that reportable segments are best represented as service lines.
During the year, the composition of business units within operating segments was realigned to better reflect how the Group’s chief operating decision maker assesses performance and allocates Group resources. As a result, the Infrastructure Projects NZ, Building Projects NZ and Defence business units (previously reported as part of the EC&M segment), were reallocated to the Transport, Facilities and Utilities segments respectively; the UASG business unit (previously reported as part of the Facilities segment) has been reallocated to the Utilities segment; and the Rail Services business unit (previously the Rail segment) has been included as part of the Transport segment. The new structure better aligns the segment reporting with Downer’s end-markets and management reporting structure.
Accordingly, the Group has restated the previously reported segment information for the year ended 30 June 2018.
For
per
sona
l use
onl
y

Annual Report 2019 69
B1. Segment information – continued
The reportable segments identified within the Group are outlined as follows:
Service line Segment description
Transport Comprises the Group’s road services, transport infrastructure and rail businesses. Downer’s road and transport infrastructure services include: road network management; routine road maintenance; asset management systems; spray sealing; asphalt laying; manufacture and supply of bitumen based products and asphalt products; the use of recycled products and environmentally sustainable methods to produce asphalt; landfill diversion solutions; intelligent transport systems; design and construction of light rail and heavy rail networks; signalling; track and station works; rail safety technology; and bridges. The Rail business spans all light rail and heavy rail sectors, from rollingstock to infrastructure; from design and manufacture to through-life-support including fleet maintenance, operations and comprehensive overhaul of assets.
Utilities Comprises the Group’s power, gas, water, renewable energy and telecommunications businesses. This includes: planning, designing, constructing, operating, maintaining, managing and decommissioning power and gas network assets; providing complete water lifecycle solutions for municipal and industrial water users including water and wastewater treatment, network construction and rehabilitation; design, construction and maintenance services for a range of renewable assets in the wind, solar and power system storage sectors; and end-to-end technology and communications solutions including design, civil construction, network construction, operations and maintenance across fibre, copper and radio networks.
Facilities Facilities operates in Australia and New Zealand and provides outsourced facility services to customers across a diverse range of industry sectors including: defence; education; government; healthcare; resources; leisure and hospitality. Facilities provides catering and laundry services; technical and engineering services; maintenance and asset management services and refrigeration solutions to various industries; as well as building and construction solutions across a variety of sectors in New Zealand.
Engineering, Construction and Maintenance (EC&M)
Provides design, engineering, construction, shutdowns, turnaround and outage delivery, operations maintenance and ongoing management of strategic assets across a range of sectors and in all stages of the project lifecycle including: feasibility studies; engineering design; procurement and construction; structural, mechanical and piping; electrical and instrumentation; commissioning and decommissioning services; and design and manufacture of mineral process equipment.
Mining Provides services across all stages of the mining lifecycle including: resource definition; exploration drilling and mine feasibility studies; open cut and underground mining services; drilling, explosives manufacture and supply; blasting and crushing; asset management; tyre management; mine closure and rehabilitation.
For
per
sona
l use
onl
y

70 Downer EDI Limited
Notes to the consolidated financial statements – continuedfor the year ended 30 June 2019
B1. Segment information – continued
2019 $’m Transport Utilities Facilities EC&M Mining
Un-allocated Total
Segment revenue and other income 3,775.7 2,506.7 3,384.7 1,704.6 1,423.5 17.5 12,812.7
Share of sales revenue from joint ventures and associates(i) 572.6 – 8.0 – 55.0 – 635.6 Total revenue including joint ventures and other income(i) 4,348.3 2,506.7 3,392.7 1,704.6 1,478.5 17.5 13,448.3
Share of net profit from joint ventures and associates 26.6 – 0.5 – 3.3 – 30.4
Depreciation and amortisation 67.2 18.0 90.1 9.4 114.2 61.1 360.0 EBIT before amortisation of acquired intangibles (EBITA) 242.4 136.1 170.5 33.3 76.7 (126.4) 532.6
Amortisation of acquired intangibles (8.3) (3.2) (11.9) – – (47.0) (70.4)
Total reported segment results (EBIT) 234.1 132.9 158.6 33.3 76.7 (173.4) 462.2
Net finance costs (82.4)
Total profit before income tax 379.8
Acquisition of segment assets 228.0 24.0 101.5 14.7 184.1 39.4 591.7
Segment assets 2,126.0 1,268.9 2,780.3 570.4 839.1 423.3 8,008.0
Segment liabilities 925.0 566.5 1,566.9 327.6 294.0 1,277.8 4,957.8
Carrying value of equity accounted investees 99.1 – 1.6 – 8.1 – 108.8
2018 $’m Transport Utilities Facilities EC&M Mining
Un-allocated Total
Segment revenue and other income 3,960.3 2,004.9 3,413.1 1,356.5 1,309.4 (13.3) 12,030.9
Share of sales revenue from joint ventures and associates(i) 511.0 – 8.1 21.2 49.0 – 589.3
Total revenue including joint ventures and other income(i) 4,471.3 2,004.9 3,421.2 1,377.7 1,358.4 (13.3) 12,620.2
Share of net profit from joint ventures and associates 23.4 – 0.4 (1.3) 2.6 – 25.1
Depreciation and amortisation 58.2 21.1 93.6 10.6 131.1 55.6 370.2
EBIT before amortisation of acquired intangibles (EBITA) 197.9 114.3 166.7 36.3 50.4 (294.1) 271.5
Amortisation of acquired intangibles (0.4) (3.0) (15.1) – – (48.2) (66.7)
Total reported segment results (EBIT) 197.5 111.3 151.6 36.3 50.4 (342.3) 204.8
Net finance costs (81.1)
Total profit before income tax 123.7
Acquisition of segment assets 175.9 107.2 142.5 5.7 134.3 20.7 586.3
Segment assets 2,032.7 1,046.7 2,769.6 542.4 804.8 592.0 7,788.2
Segment liabilities 1,030.2 485.8 1,465.1 327.2 271.7 1,003.1 4,583.1
Carrying value of equity accounted investees 83.1 – 1.5 4.0 7.4 – 96.0
(i) This is a non-statutory disclosure as it relates to Downer’s share of revenue from equity accounted joint ventures and associates.
For
per
sona
l use
onl
y

Annual Report 2019 71
B1. Segment information – continued
Reconciliation of segment EBIT to net profit after tax:
Note
Segment results
2019$’m
2018$’m
Segment EBIT 635.6 547.1
Unallocated:
Mining goodwill impairment – (76.4)
Divestment of Freight Rail – (50.2)
Auburn Rail claim – (25.0)
Divisional merger costs – (28.5)
Spotless transaction related costs – (28.0)
Murra Warra wind farm loss1 (45.0) –
Amortisation of Spotless and Tenix acquired intangible assets (47.0) (48.2)
Fair value gain on revaluation of existing interest in Downer Mouchel Joint Venture F2 17.0 –
Corporate costs (98.4) (86.0)
Total unallocated (173.4) (342.3)
Earnings before interest and tax 462.2 204.8
Net finance costs (82.4) (81.1)
Profit before income tax 379.8 123.7
Income tax expense B4(a) (103.5) (52.6)
Profit after income tax 276.3 71.1
1 Relates to Downer’s obligation to complete the Murra Warra wind farm following Senvion’s insolvency as announced to the market on 1 August 2019. The onerous contract provision recognised is not related to contract performance, rather to the credit risk assumed by Downer to complete the contract as Downer and Senvion share liability under the project jointly and severally. This individually significant item is classified to the unallocated segment and is disclosed as part of “other expenses from ordinary activities” in the statement of profit or loss at 30 June 2019.
Segment assets by geographical location:
Segment assetsNon-current
Acquisition of segment assets
Non-current
2019$’m
2018$’m
2019$’m
2018$’m
Geographic location(i)
Australia 4,456.3 4,287.2 545.0 538.0
New Zealand and Pacific 378.3 355.4 46.4 47.1
Rest of the world 8.7 12.0 0.3 1.2
Total 4,843.3 4,654.6 591.7 586.3
(i) Assets are allocated based on the geographical location of the legal entity.
For
per
sona
l use
onl
y

72 Downer EDI Limited
Notes to the consolidated financial statements – continuedfor the year ended 30 June 2019
B2. Revenue
Revenue and other income2019 $’m Transport Utilities Facilities EC&M Mining
Un-allocated Total
Service revenue 2,628.4 1,441.7 2,525.6 914.6 1,363.5 (1.4) 8,872.4
Construction contracts 936.9 1,061.5 821.6 767.0 – – 3,587.0
Sale of goods 204.4 1.2 36.6 14.9 57.0 – 314.1 Total revenue from contracts with customers 3,769.7 2,504.4 3,383.8 1,696.5 1,420.5 (1.4) 12,773.5
Other revenue 5.2 1.4 – 6.9 0.9 1.5 15.9 Total revenue from ordinary activities 3,774.9 2,505.8 3,383.8 1,703.4 1,421.4 0.1 12,789.4
Other income 0.8 0.9 0.9 1.2 2.1 17.4 23.3 Total revenue and other income 3,775.7 2,506.7 3,384.7 1,704.6 1,423.5 17.5 12,812.7
Share of sales revenue from joint ventures and associates(i) 572.6 – 8.0 – 55.0 – 635.6 Total revenue including joint ventures and other income(i) 4,348.3 2,506.7 3,392.7 1,704.6 1,478.5 17.5 13,448.3
2018$’m Transport Utilities Facilities EC&M Mining
Un-allocated Total
Service revenue 2,601.7 1,257.1 2,599.0 611.6 1,297.6 (34.8) 8,332.2
Construction contracts 1,140.2 744.6 745.0 723.2 – – 3,353.0
Sale of goods 205.7 1.1 61.5 19.7 3.2 – 291.2
Total revenue from contracts with customers 3,947.6 2,002.8 3,405.5 1,354.5 1,300.8 (34.8) 11,976.4
Other revenue 11.3 1.7 – 1.4 4.3 21.5 40.2
Total revenue from ordinary activities 3,958.9 2,004.5 3,405.5 1,355.9 1,305.1 (13.3) 12,016.6
Other income 1.4 0.4 7.6 0.6 4.3 – 14.3
Total revenue and other income 3,960.3 2,004.9 3,413.1 1,356.5 1,309.4 (13.3) 12,030.9
Share of sales revenue from joint ventures and associates(i) 511.0 – 8.1 21.2 49.0 – 589.3
Total revenue including joint ventures and other income(i) 4,471.3 2,004.9 3,421.2 1,377.7 1,358.4 (13.3) 12,620.2
(i) This is a non-statutory disclosure as it relates to Downer’s share of revenue from equity accounted joint ventures and associates.
For
per
sona
l use
onl
y

Annual Report 2019 73
B2. Revenue – continued
Revenue from contracts with customers by geographical location:
2019 $’m Transport Utilities Facilities EC&M Mining
Un-allocated Total
Geographic location(i)
Australia 2,610.2 2,007.8 2,481.6 1,676.5 1,364.0 (1.4) 10,138.7
New Zealand and Pacific 1,159.5 496.6 902.2 0.2 – – 2,558.5
Rest of the world – – – 19.8 56.5 – 76.3
Total revenue from contracts with customers 3,769.7 2,504.4 3,383.8 1,696.5 1,420.5 (1.4) 12,773.5
2018 $’m Transport Utilities Facilities EC&M Mining
Un-allocated Total
Geographic location(i)
Australia 2,807.3 1,575.9 2,521.8 1,336.1 1,248.2 (34.8) 9,454.5
New Zealand and Pacific 1,140.3 426.9 883.7 2.2 – – 2,453.1
Rest of the world – – – 16.2 52.6 – 68.8
Total revenue from contracts with customers 3,947.6 2,002.8 3,405.5 1,354.5 1,300.8 (34.8) 11,976.4
(i) Revenue is allocated based on the geographical location of the legal entity.
Recognition and measurement
Revenue
The Group has adopted AASB 15 Revenue from Contracts with Customers from 1 July 2018. Under AASB 15, revenue is recognised when a customer obtains control of the goods or services. Revenue is measured at the fair value of the consideration received or receivable. Determining the timing of the transfer of control – at a point in time or over time – requires judgement. Revenue is recognised if it meets the criteria below.
(i) Rendering of services
The Group primarily generates service revenue from the following activities:
– Maintenance and management of transport infrastructure;
– Utilities infrastructure maintenance services (gas, power and water);
– Maintenance and installation of infrastructure in the telecommunications sector;
– Industrial plant maintenance;
– Contract mining services, mining assets maintenance services, tyre management and blasting;
– Rolling stock maintenance and rail asset management services;
– Engineering and consultancy services; and
– Facilities management.
Typically, under the performance obligations of service contracts, the customer consumes and receives the benefit of the service as it is provided. As such, service revenue is recognised over time as the services are provided.
(ii) Construction contracts
The contractual terms and the way in which the Group operates its construction contracts is predominantly derived from projects containing one performance obligation. Under these performance obligations, customers either simultaneously receive and consume the benefits as the Group performs them or performance creates or enhances an asset that the customer controls as the asset is created or enhanced. Therefore contracted revenue is recognised over time based on stage of completion of the contract.
(iii) Sale of goods
Revenue is recognised at a point in time when the customer obtains control of goods and services. In the prior year revenue was recognised when the significant risks and rewards of ownership of the goods passed to the buyer.
(iv) Other revenue
Other revenue primarily includes rental income received by the Group.
For
per
sona
l use
onl
y

74 Downer EDI Limited
Notes to the consolidated financial statements – continuedfor the year ended 30 June 2019
Revenue recognition after 1 July 2018 Revenue recognition before 1 July 2018
Contract claims and variations – now referred to as contract modifications
For services and construction contracts the new standard provides a higher threshold for recognition of variations, claims and incentives which only allows revenue from variations and claims to be recognised to the extent they are approved or enforceable under the contract. The amount of revenue is then recognised to the extent it is highly probable that a significant reversal of revenue will not occur.
In making this assessment, the Group considers a number of factors including nature of the claim, formal or informal acceptance by the customer of the validity of the claim, stage of negotiations, or the historical outcome of similar claims to determine whether the enforceable and “highly probable” threshold has been met.
Revenue in relation to modifications, such as a change in the scope of the contract, will only be included in the transaction price, when it is approved by the parties to the contract or the modification is enforceable and the amount becomes highly probable. Modifications will be recognised when client instruction has been received in line with customary business practice for the customer.
Estimates of revenue include:
– claims from customers where negotiations have reached an advanced stage and it is probable that the customer will accept the claim and the amount can be measured reliably; and
– variations when it is probable that the customer will approve the variation and the amount can be measured reliably.
Contract costs (tender costs)
Costs incurred during the tender / bid process are expensed, unless they are incremental to obtaining the contract and the Group expects to recover those costs or where they are explicitly chargeable to the customer regardless of whether the contract is obtained.
Costs incurred during the tender / bid process are capitalised within amounts due from customers under contracts when it is probable that the contract will be awarded. If the contracts are not subsequently awarded the amounts capitalised are expensed to profit or loss.
Performance obligations and contract duration
Revenue is allocated to each performance obligation and recognised as the performance obligation is satisfied which may be at a point in time or over time.
AASB 15 requires a granular approach to identify the different revenue streams (i.e. performance obligations) in a contract by identifying the different activities that are being undertaken and then aggregating only those where the different activities are significantly integrated or highly interdependent. Revenue will continue to be recognised, on certain contracts over time, as a single performance obligation when the services are part of a series of distinct goods and services that are substantially integrated with the same pattern of transfer.
AASB 15 provides guidance in respect of the term over which revenue may be recognised and is limited to the period for which the parties have enforceable rights and obligations. When the customer can terminate a contract for convenience (without a substantive penalty), the contract term and related revenue is limited to the termination period.
The Group has elected to apply the practical expedient to not adjust the total consideration over the contract term for the effect of a financing component if the period between the transfer of services to the customer and the customer’s payment for these services is expected to be one year or less.
Under AASB 111 Construction Contracts revenue is recognised over the stated term of the contract.
B2. Revenue – continuedRecognition and measurement – continued
The following table provides information about the Group’s revenue recognition policies for both services and construction contracts under the current and previous accounting standards:
For
per
sona
l use
onl
y

Annual Report 2019 75
Revenue recognition after 1 July 2018 Revenue recognition before 1 July 2018
Measure of progress
The Group recognises revenue using the measure of progress that best reflects the Group’s performance in satisfying the performance obligation within the contracts over time. The different methods of measuring progress include an input method (e.g. costs incurred) or an output method (e.g. milestones reached). The same method of measuring progress will be consistently applied to similar performance obligations.
Contract revenue and contract costs are recognised as revenue and expenses by reference to the stage of completion of the contract at the end of the reporting period.
Variable consideration
Variable consideration that is contingent on the Group’s performance, including key performance payments, liquidated damages and abatements that offset revenue under the contract, is recognised only when it is highly probable that a reversal of that revenue will not occur.
In addition, where the identified revenue stream is determined to be a series of distinct goods or services that are substantially the same and that have the same pattern of transfer to the customer (for example maintenance services), variable consideration is recognised in the period/(s) in which the series of distinct goods or services subject to the variable consideration are completed.
Estimates of revenue include incentive payments such as payments for meeting certain performance criteria when it is probable that the criteria will be met and can be measured reliably. Liquidated damages or abatements that are probable and can be measured reliably are included in contract costs.
Loss making contracts
Loss-making contracts are recognised under AASB 137 Provisions, Contingent Liabilities and Contingent Assets as onerous contracts.
For contracts under the percentage of completion method the expected loss on a contract is recognised immediately when it is probable that total contract costs will exceed total contract revenue.
Key estimates and judgements: Revenue recognition
Stage of completion
Determining the stage of completion requires an estimate of expenses incurred to date as a percentage of total estimated costs.
Modifications
When a contract modification exists and the Group has an approved enforceable right to payment, revenue in relation to claims and variations is only included in the transaction price when the amount claimable becomes highly probable. Management uses judgement in determining whether an approved enforceable right exists and the amount that meets the “highly probable” thereshold.
Variable consideration
Determining the amount of variable consideration requires an estimate based on either “the expected value” or “the most likely amount”. The estimate of variable consideration can only be recognised to the extent it is highly probable that a significant revenue reversal will not occur in future.
Changes in these estimation methods could have a material impact on the financial statements of the Group.
B2. Revenue – continuedRecognition and measurement – continued
For
per
sona
l use
onl
y

76 Downer EDI Limited
Notes to the consolidated financial statements – continuedfor the year ended 30 June 2019
B3. Earnings per share
Basic earnings per share
The calculation of basic earnings per share (EPS) is based on the profit attributable to ordinary shareholders and the weighted average number of ordinary shares outstanding.
2019 2018
Profit attributable to members of the parent entity ($’m) 261.8 71.4
Adjustment to reflect ROADS dividends paid ($’m) (8.3) (8.0)
Profit attributable to members of the parent entity used in calculating EPS ($’m) 253.5 63.4
Weighted average number of ordinary shares (WANOS) on issue (m’s)(i) 591.2 590.5
Basic earnings per share (cents per share) 42.9 10.7
Diluted earnings per share
The calculation of diluted EPS is based on the profit attributable to ordinary shareholders and the weighted average number of ordinary shares outstanding after adjustments for the effects of all dilutive potential ordinary shares.
2019 2018
Profit attributable to members of the parent entity ($’m) 261.8 71.4
Weighted average number of ordinary shares
– Weighted average number of ordinary shares (WANOS) on issue (m’s)(i) (ii) 592.2 590.5
– WANOS adjustment to reflect potential dilution for ROADS (m’s)(iii) 26.9 27.8
WANOS used in the calculation of diluted EPS (m’s) 619.1 618.3
Diluted earnings per share (cents per share)(iv) 42.3 10.7
(i) The WANOS on issue has been adjusted by the weighted average effect of the unvested executive incentive shares.(ii) For diluted earnings per share, the WANOS has been further adjusted by the potential vesting of executive incentive shares. (iii) The WANOS adjustment is the value of ROADS that could potentially be converted into ordinary shares at the reporting date. It is calculated based on the issued value of
ROADS in New Zealand dollars converted to Australian dollars at the spot rate prevailing at the reporting date, which was $191.2 million (2018: $183.4 million), divided by the average market price of the Company’s ordinary shares for the period 1 July 2018 to 30 June 2019 discounted by 2.5% according to the ROADS contract terms, which was $7.10 (2018: $6.60).
(iv) At 30 June 2018, the ROADS are deemed anti-dilutive and consequently, diluted EPS remained at 10.7 cents per share.
For
per
sona
l use
onl
y

Annual Report 2019 77
B4. Taxation
a) Reconciliation of income tax expense
The prima facie income tax expense on profit before income tax reconciles to the income tax expense in the financial statements as follows:
2019$’m
2018$’m
Profit before income tax 379.8 123.7
Tax using the Company’s statutory tax rate 113.9 37.1
Effect of tax rates in foreign jurisdictions (1.7) (1.3)
Non-deductible expenses 0.8 1.0
Profits and franked distributions from joint ventures and associates (6.8) (5.6)
Non-taxable government grant – (2.6)
Impairment of goodwill – 22.9
Non-taxable gains (5.1) (1.8)
Other items 0.1 1.2
Under / (over) provision of income tax in previous year 2.3 1.7
Total income tax expense 103.5 52.6
Current tax expense 63.4 49.2
Deferred tax expense 40.1 3.4
The tax rate used in the above reconciliation is the corporate tax rate of 30% payable by Australian corporate entities on taxable profits under Australian tax law. There has been no change in the corporate tax rate when compared with the previous year.
Recognition and measurement
Current tax
Current tax assets and liabilities are measured at the amount of income taxes payable or recoverable in respect of the taxable profit or tax loss for the period; it is calculated using tax rates and tax laws that have been enacted or substantively enacted by the reporting date.
Deferred tax
Deferred tax is accounted for in respect of temporary differences arising from differences between the carrying amount of assets and liabilities and the corresponding tax base.
Deferred tax liabilities are recognised for all taxable temporary differences. Deferred tax assets are recognised for all deductible temporary differences, unused tax losses and tax offsets, to the extent that it is probable that sufficient taxable profits will be available to utilise them.
However, deferred tax assets and liabilities are not recognised for:
– Temporary differences that arise from the initial recognition of assets or liabilities in a transaction that is not a business combination which affects neither taxable income nor accounting profit;
– Temporary differences relating to investments in subsidiaries, associates and joint ventures to the extent that the Group is able to control the timing of the reversal of the temporary differences and it is probable that they will not reverse in the foreseeable future; and
– Temporary differences arising from goodwill.
Deferred tax assets and liabilities are measured at the tax rates and tax laws that are expected to apply in the year when the asset is utilised or liability is settled, based on tax rates and tax laws that have been enacted or substantively enacted at the reporting date.
Income taxes relating to items recognised directly in equity are recognised in equity and not in the income statement.
Offsetting deferred tax balances
Deferred tax assets and liabilities are offset when they relate to income taxes levied by the same taxation authority and the Company/consolidated entity intends to settle its current tax assets and liabilities on a net basis.
Tax consolidation
Downer EDI Limited and its wholly owned Australian entities are part of a tax-consolidated group under Australian taxation law. Downer EDI Limited is the head entity in the tax-consolidated group. Entities within the tax-consolidated group have entered into a tax funding agreement and a tax sharing agreement with the head entity. Under the terms of the tax funding agreement, Downer EDI Limited and each of the entities in the tax-consolidated group have agreed to pay (or receive) a tax equivalent payment to (or from) the head entity, based on the current tax liability or current tax asset of the entity.
For
per
sona
l use
onl
y

78 Downer EDI Limited
Notes to the consolidated financial statements – continuedfor the year ended 30 June 2019
B4. Taxation – continued
a) Reconciliation of income tax expense – continued
Key estimate and judgement: Recovery of deferred tax assets
Deferred tax assets are recognised for deductible temporary differences, unused tax losses and tax offsets, to the extent it is probable that sufficient future taxable profits will be available to utilise them. Judgement is required to determine the amount of deferred tax assets that can be recognised, based upon the likely timing and the level of future taxable profits.
Key estimate and judgement: Income taxes
The Group is subject to income taxes in Australia and jurisdictions where it has foreign operations. Judgement is required to determine the worldwide provision for income taxes and to assess whether deferred tax balances are recognised on the statement of financial position. Changes in circumstances will alter expectations, which may impact the amount of provision for income taxes and deferred tax balances recognised.
b) Movement in deferred tax balances
2019$’m
Net balance
at 30 June
2018
Opening balance adjust-
ment on application of AASB 15
Net balanceat 1 July
2018
Charged to income statement
Charged to comprehen-sive income and equity
Net foreign currency
exchange differences
Acquis- ition and disposal
Net balance
at 30 June
2019
Deferred tax
assets
Deferred tax
liabilities
Trade receivables and contract assets (100.5) 83.2 (17.3) (36.6) – (0.3) (9.2) (63.4) – (63.4)
Joint ventures and associates (0.9) – (0.9) 0.9 – – – – – –
Property, plant and equipment (32.2) – (32.2) (8.0) – (0.1) (0.6) (40.9) – (40.9)
Intangible assets (164.1) – (164.1) 19.7 – (0.2) (9.1) (153.7) – (153.7)
Income tax losses 32.5 – 32.5 (4.2) – – – 28.3 28.3 – Trade payables and contract liabilities 34.5 – 34.5 (9.5) – (0.2) 3.1 27.9 27.9 – Provisions, including employee benefits 129.4 25.6 155.0 (1.7) – (0.4) (6.3) 146.6 146.6 –
Other 6.6 – 6.6 (0.7) 3.8 1.0 0.4 11.1 11.1 –
Tax assets/(liabilities) before set-off (94.7) 108.8 14.1 (40.1) 3.8 (0.2) (21.7) (44.1) 213.9 (258.0)
Set-off of DTA against DTL – – – (120.4) 120.4
Net tax assets/(liabilities) (94.7) 14.1 (44.1) 93.5 (137.6)
2018 $’m
Net balance at 1 July
2017
Charged to income statement
Charged tocomprehen-sive income and equity
Net foreign currency
exchange differences
Acquisition and
disposal
Net balance at 30 June
2018
Deferred tax
assets
Deferred tax
liabilities
Trade receivables and contract assets (103.0) 1.6 – 0.8 0.1 (100.5) – (100.5)Inventories (9.8) 9.8 – – – – – –Joint ventures and associates (1.1) 0.2 – – – (0.9) – (0.9)Property, plant and equipment (12.9) (19.3) – – – (32.2) – (32.2)Intangible assets (166.6) 19.0 – – (16.5) (164.1) – (164.1)Income tax losses 25.1 7.4 – – – 32.5 32.5 –Trade payables and contract liabilities 20.8 12.9 – 0.3 0.5 34.5 34.5 –Provisions, including employee benefits 156.5 (33.2) – (0.2) 6.3 129.4 129.4 –Other 5.0 (1.8) 1.6 0.1 1.7 6.6 6.6 –Tax assets/(liabilities) before set-off (86.0) (3.4) 1.6 1.0 (7.9) (94.7) 203.0 (297.7)Set-off of DTA against DTL – – (127.5) 127.5Net tax assets/(liabilities) (86.0) (94.7) 75.5 (170.2)
For
per
sona
l use
onl
y

Annual Report 2019 79
B5. Remuneration of auditors
2019$
2018$
Audit or review of financial reports:
Audit or review – Australia 4,376,000 4,165,000
Audit or review – Overseas 1,026,736 721,000
Sustainability and other assurance services 452,044 278,634
5,854,780 5,164,634
Non-audit services
Tax services 338,957 556,106
Advisory and due diligence services 275,000 950,457
613,957 1,506,563
The auditor of the Group is KPMG.
B6. Subsequent events
In September 2017 Spotless commenced a Facilities Management Sub-Contract (Subcontract) at the New Royal Adelaide Hospital (nRAH). Spotless’ subcontract is with Celsus, which has a head contract with the South Australian Government as part of a Public Private Partnership model.
On 21 August 2019, Spotless reached in-principle agreement with the South Australian Government and Celsus in relation to the delivery of services under the Subcontract. The agreement includes;
– settlement of historical abatement claims previously disclosed as a contingent liability by Downer and Spotless;
– a revised KPI and abatement regime designed to better reflect the services provided by Spotless; and
– an increase to Spotless’ monthly service fee.
The settlement agreement, which is expected to be signed in the first half of the 2020 financial year, will take financial effect from 1 July 2019.
Other than this in-principle agreement, at the date of this report, there have been no other matters or circumstances that have arisen since the end of the financial year, that have significantly affected, or may significantly affect, the operations of the Group, the results of those operations, or the state of affairs of the Group in subsequent financial years.
For
per
sona
l use
onl
y

80 Downer EDI Limited
Notes to the consolidated financial statements – continuedfor the year ended 30 June 2019
COperating assets and liabilities
This section provides information relating to the operating assets and liabilities of the Group. Downer has a strong focus on maintaining a strong balance sheet through continued focus on cash conversion. The Group’s strategy also considers expenditure, growth and acquisition requirements.
C1. Reconciliation of cash and cash equivalents
C2. Trade receivables and contract assets
C3. Inventories
C4. Trade payables and contract liabilities
C5. Property, plant and equipment
C6. Intangible assets
C7. Finance lease receivables
C8. Provisions
C9. Contingent liabilities
C1. Reconciliation of cash and cash equivalents
(a) Reconciliation of cash flows from operating activities
Note2019
$’m2018
$’m
Profit after tax for the year 276.3 71.1Adjustments for:
Share of joint ventures and associates’ profits net of distributions F1(a) (8.0) (8.2)Depreciation and amortisation of non-current assets C5, C6 360.0 370.2Amortisation of deferred costs 4.2 5.7Net gain on sale of property, plant and equipment (4.8) (14.2)Fair value gain on revaluation of existing interest in Downer Mouchel Joint Venture F2 (17.0) – Loss on disposal of business F3 – 40.6 Impairment of intangibles B1 – 76.4Research and development incentives – (8.7)Foreign exchange gains (1.5) (0.1)Movement in current tax balances 6.9 (7.5)Movement in deferred tax balances 40.5 13.7Share-based employee benefits expense D1 4.0 2.8Other 2.3 0.7
386.6 471.4
Changes in net assets and liabilities, net of effects from acquisition and disposal of businesses:(Increase) / decrease in assets:
Current trade receivables and contract assets (67.1) (479.1)
Current inventories (29.3) (17.2)
Other current assets (1.5) 6.3
Non-current trade receivables and contract assets (10.2) (53.8)
Other non-current assets 0.4 12.1Increase / (decrease) in liabilities:
Current trade payables and contract liabilities 65.9 607.7
Current financial liabilities (3.7) 21.2
Current provisions 16.1 (41.8)
Non-current trade payables and contract liabilities 24.2 (13.9)
Non-current financial liabilities (3.1) 10.2
Non-current provisions (24.4) (10.9)
(32.7) 40.8
Net cash generated by operating activities 630.2 583.3
For
per
sona
l use
onl
y

Annual Report 2019 81
C1. Reconciliation of cash and cash equivalents – continued
(b) Reconciliation of liabilities arising from financing activities
$’m1 July2018
Net cashflows
Amortisation and foreign
exchange movement
30 June2019
Interest bearing loans 1,504.7 160.6 28.0 1,693.3
Finance lease and hire purchase liabilities 16.5 (5.5) (0.8) 10.2
Total liabilities from financing activities 1,521.2 155.1 27.2 1,703.5
(c) Cash and cash equivalents
For the purpose of the statement of cash flows, cash and cash equivalents comprises:2019
$’m2018
$’m
Cash 663.2 321.4
Short-term deposits 47.5 284.8
710.7 606.2
C2. Trade receivables and contract assets
2019$’m
2018$’m
Trade receivables 888.0 842.0
Loss allowance (17.5) (15.3)
870.5 826.7 Contract assets 1,084.4 1,228.5
Other receivables 111.0 175.9
Total trade receivables and contract assets 2,065.9 2,231.1
Included in the financial statements as:
Current 1,991.5 2,117.9
Non-current 74.4 113.2
Contract asset balances
2019$’m
2018$’m
Contract assets 1,050.3 1,162.0
Contract costs (Tender costs) – 34.0
Retentions 34.1 32.5
Total contract assets 1,084.4 1,228.5
A summary of the Group’s exposure to credit risk for trade receivables and contract assets is as follows:
Ageing profile of trade receivables and contract assets2019
$’m2018
$’m
Neither past due nor impaired 1,771.7 1,749.8
Past due but not impaired 183.2 305.4
Impaired 17.5 15.3
1,972.4 2,070.5
An impairment loss of $1.3 million on trade receivables and contract assets arising from contracts with customers was recognised during the year in “Other expenses” in the consolidated statement of profit or loss.
For
per
sona
l use
onl
y

82 Downer EDI Limited
Notes to the consolidated financial statements – continuedfor the year ended 30 June 2019
C2. Trade receivables and contract assets – continued
Remaining performance obligations
As of 30 June 2019, the aggregate amount of the transaction price allocated to the remaining performance obligations is $14,514.3 million. The Group will recognise this revenue when the performance obligations are satisfied. Approximately 28% of remaining performance obligations are expected to occur within the next five years; with the remaining 72% of performance obligations, being related to long-term service / maintenance contracts, ranging up to 43 years.
When a customer can terminate for convenience without a substantive penalty, the contract term and related revenue are limited by the termination clause. This would include, for example, framework contracts for which a firm order or instruction has not been received from the customer. Nonetheless, based on historical experience, these contracts are not expected to be cancelled and therefore future revenue and profits are expected to be recognised in line with the contract term. The Group has also applied the practical expedient available under the accounting standards to exclude those contracts with an original expected duration of less than 12 months from the above disclosure.
As permitted under the transitional provisions in AASB 15, the transaction price allocated to remaining performance obligations as of 30 June 2018 is not disclosed.
Recognition and measurement
Trade receivables
Trade receivables and other receivables are initially recognised at fair value and subsequently at amortised cost using the effective interest rate method, less an allowance for impairment.
Contract assets
Contract assets primarily relate to the Group’s rights to consideration for work performed but not billed at the reporting date. The contract assets are transferred to trade receivables when the rights have become unconditional. This usually occurs when the Group issues an invoice in accordance with contractual terms to the customer.
Payments from customers are received based on a billing schedule / milestone basis, as established in our contracts.
Costs to fulfil contracts
Costs incremental to obtaining a contract and that are expected to be recovered or are explicitly chargeable to the customer regardless of whether the contract is obtained are capitalised.
Financial assets and liabilities
AASB 9 Financial Instruments contains a new classification and measurement approach for financial assets that reflects the business model in which assets are managed and their cash flow characteristics.
AASB 9 contains three principal classification categories for financial assets: measured at amortised cost, fair value through other comprehensive income (FVOCI) and fair value through profit or loss (FVTPL). The standard eliminates the existing AASB 139 categories of held to maturity, loans and receivables and available for sale. The existing requirements for the classification of financial liabilities in AASB 139 is retained, resulting in no change in classification or measurement of financial liabilities on adoption of AASB 9. The adoption of AASB 9 has not had a significant effect on the Group’s accounting policies related to financial assets.
Fair value
Due to the short-term nature of these financial rights, their carrying amounts are estimated to represent their fair values.
Impairment
AASB 9 replaced the “incurred loss” model in AASB 139 with a forward looking “expected credit loss” (ECL) model. The Group exercises considerable judgement about how changes in economic factors affect ECL, which is determined on a probability-weighted basis. There is consideration around the probability of default upon initial recognition and subsequent assessment as to whether there has been a significant increase in credit risk at each reporting period.
This impairment model applies to financial assets measured at amortised cost or FVOCI (except for investments in equity instruments).
Under AASB 9, loss allowances are measured on either of the following bases:
– 12-month ECLs: where there are ECLs that result from possible default events within 12 months from the reporting date; and
– Lifetime ECLs: these are ECLs that result from all possible default events over the expected life of a financial instrument.
The Group has applied the simplified approach to recognise lifetime expected credit losses for trade receivables, contract assets and finance lease receivables as permitted by AASB 9.
In the prior year, the allowance for doubtful debts was made for the estimated irrecoverable trade receivable amounts arising from services provided, determined in reference to past default experience.
For
per
sona
l use
onl
y

Annual Report 2019 83
C3. Inventories
2019$’m
2018$’m
Current
Raw materials 127.0 123.2
Work in progress 7.3 0.2
Finished goods 56.2 47.6
Components and spare parts 114.1 97.8
304.6 268.8
Recognition and measurement
Inventories are valued at the lower of cost and net realisable value. Net realisable value represents the estimated selling price less all estimated costs of completion and costs to be incurred in marketing, selling and distribution.
C4. Trade payables and contract liabilities
2019 $’m
2018 $’m
Trade payables 810.6 674.2
Contract liabilities 501.5 429.1
Accruals 1,007.2 1,088.9
Other 137.5 115.9
2,456.8 2,308.1
Included in the financial statements as:
Current 2,405.5 2,281.6
Non-current 51.3 26.5
Recognition and measurement
Trade payables, accruals and other payables
Trade payables, accruals and other accounts payable are recognised when the Group becomes obliged to make future payments resulting from the purchase of goods and services.
Contract liabilities
Contract liabilities primarily relate to the Group’s obligation to transfer goods or services to a customer for which the Group has received consideration (or an amount of consideration is due) from the customer. Contract liabilities are recognised as revenue when work is performed under the contract.
If the net amount of the Group’s rights to consideration for work performed after deduction of progress payments received is negative, the difference is recognised as a liability and included as part of contract liabilities.
The amount of $230.9 million recognised in contract liabilities at the beginning of the year has been recognised as revenue for the year ended 30 June 2019.
Fair value
Due to the short-term nature of these financial obligations, their carrying amounts are estimated to represent their fair values.
For
per
sona
l use
onl
y

84 Downer EDI Limited
Notes to the consolidated financial statements – continuedfor the year ended 30 June 2019
C5. Property, plant and equipment
2019$’m
Freehold land and
buildings
Plant, equipment
and leasehold improvements
Equipment under
finance lease
Laundries rental stock Total
Carrying amount as at 1 July 2018 118.8 1,106.3 14.1 41.2 1,280.4 Additions 10.5 305.3 2.3 35.2 353.3 Disposals at net book value (3.0) (8.5) (2.3) – (13.8)
Acquisition of businesses(i) 0.1 12.0 – – 12.1 Depreciation expense (2.9) (219.8) (4.8) (32.5) (260.0)Reclassifications at net book value – 0.4 (0.4) – – Reclassified as intangible assets(ii) – (0.8) – – (0.8)Net foreign currency exchange differences at net book value 0.5 1.3 0.1 0.2 2.1 Closing net book value as at 30 June 2019 124.0 1,196.2 9.0 44.1 1,373.3 Cost 152.8 2,722.1 24.5 105.9 3,005.3 Accumulated depreciation (28.8) (1,525.9) (15.5) (61.8) (1,632.0)
2018Carrying amount as at 1 July 2017 (restated)(iii) 129.4 1,061.2 52.3 37.5 1,280.4Additions 0.5 322.9 7.9 36.2 367.5Disposals at net book value (5.6) (14.9) (14.4) – (34.9)Acquisition of businesses – 3.2 7.6 1.5 12.3Disposal of business at net book value – (60.0) – – (60.0)Depreciation expense (5.1) (229.5) (10.3) (33.4) (278.3)Reclassifications at net book value – 26.5 (29.1) 2.6 –Reclassified as intangible assets(ii) – (0.3) – – (0.3)Net foreign currency exchange differences at net book value (0.4) (2.8) 0.1 (3.2) (6.3)
Closing net book value as at 30 June 2018 118.8 1,106.3 14.1 41.2 1,280.4Cost 155.1 2,488.7 34.1 74.0 2,751.9Accumulated depreciation (36.3) (1,382.4) (20.0) (32.8) (1,471.5)
(i) The values recognised are based on the fair value of assets acquired from the business acquisitions made during the year ended 30 June 2019, for which the accounting on certain transactions remains provisional. Refer to Note F2.
(ii) Refers to the reclassification of software from Capital work in progress to Intangible assets.(iii) June 2017 balances were restated to reflect the impact of acquisition accounting adjustments made during the previous period on opening balances.
Recognition and measurement
The value of property, plant and equipment is measured as the cost of the asset less accumulated depreciation and impairment.
The expected useful life and depreciation methods used are listed below:
Item Useful life Depreciation method
Freehold land n/a No depreciationBuildings 20-50 years Straight-lineLeasehold improvements Life of lease Straight-linePlant and equipment – mining, power and gas Working hours Based on hours of usePlant and equipment – other 3-25 years Straight-lineEquipment under finance lease 5-15 years Straight-line – lease termLaundries rental stock 18 months-5 years Straight-line
For
per
sona
l use
onl
y

Annual Report 2019 85
C5. Property, plant and equipment – continued
Key estimate and judgement: Useful lives and residual values
The estimation of the useful lives and residual values of assets has been based on historical experience as well as manufacturers’ warranties (for plant and equipment), lease terms (for leased equipment and leasehold improvements) and turnover policies. In addition, the condition of the assets is assessed at least once per year and considered against the remaining useful life. Adjustments to useful lives and residual values are made when considered necessary.
C6. Intangible assets
2019$’m Goodwill
Customer contracts
and relationships
Brand names on
acquisition
Intellectual property on acquisition
Software and system
development Total
Carrying amount as at 1 July 2018 2,351.5 381.1 74.7 2.2 241.2 3,050.7
Additions – – – – 45.3 45.3
Disposals at net book value – – – – (0.3) (0.3)
Acquisition of businesses(i) 98.2 30.2 – – – 128.4
Reclassifications at net book value(ii) – – – – 0.8 0.8
Amortisation expense – (66.3) (3.9) (0.2) (29.6) (100.0)Net foreign currency exchange differences at net book value 4.8 – 0.5 – 0.5 5.8
Closing net book value as at 30 June 2019 2,454.5 345.0 71.3 2.0 257.9 3,130.7
Cost 2,606.9 494.1 79.4 2.4 419.3 3,602.1
Accumulated amortisation and impairment (152.4) (149.1) (8.1) (0.4) (161.4) (471.4)
2018Carrying amount as at 1 July 2017 (restated)(iii) 2,341.1 409.1 56.9 3.5 220.6 3,031.2
Additions – – – – 46.4 46.4
Disposals at net book value – – – – (0.2) (0.2)
Acquisition of businesses 105.0 34.5 21.7 (1.1) – 160.1
Disposal of business at net book value (14.2) – – – – (14.2)
Reclassifications at net book value(ii) – – – – 0.3 0.3
Amortisation expense – (62.6) (3.9) (0.2) (25.2) (91.9)
Impairment of goodwill (76.4) – – – – (76.4)
Net foreign currency exchange differences at net book value (4.0) 0.1 – – (0.7) (4.6)
Closing net book value as at 30 June 2018 2,351.5 381.1 74.7 2.2 241.2 3,050.7Cost 2,503.9 463.8 78.7 2.4 394.9 3,443.7
Accumulated amortisation and impairment (152.4) (82.7) (4.0) (0.2) (153.7) (393.0)
(i) The values recognised are based on the fair value of assets acquired from the business acquisitions made during the year ended 30 June 2019, for which the accounting on certain transactions remains provisional. Refer to Note F2.
(ii) Refers to the reclassification of software from Capital work in progress to Intangible assets.(iii) June 2017 balances were restated to reflect the impact of acquisition accounting adjustments made during the previous period on opening balances.
For
per
sona
l use
onl
y

86 Downer EDI Limited
Notes to the consolidated financial statements – continuedfor the year ended 30 June 2019
C6. Intangible assets – continued
Recognition and measurement
Goodwill
Goodwill acquired in a business combination is measured at cost and subsequently measured at cost less any impairment losses. The cost represents the excess of the cost of a business combination over the fair value of the identifiable assets, liabilities and contingent liabilities acquired.
Brand names on acquisition
Brand names acquired as part of a business combination are recognised separately from goodwill and are carried at fair value at date of acquisition less accumulated amortisation and any accumulated impairment losses.
Customer contracts and relationships on acquisition
Customer contracts and relationships acquired as part of a business combination are recognised separately from goodwill and are carried at fair value at date of acquisition less accumulated amortisation and any accumulated impairment losses.
Intellectual property on acquisition
Intellectual property acquired as part of a business combination is recognised separately from goodwill and is carried at fair value at date of acquisition less accumulated amortisation and any accumulated impairment losses.
Intellectual property, software and system development
Intangible assets acquired by the Group, including intellectual property (purchased patents, trademarks and licences) and software are initially recognised at cost, and subsequently measured at cost less accumulated amortisation and any impairment losses. Internally developed systems are capitalised once the project is assessed to be feasible. The costs capitalised include consulting, licensing and direct labour costs. Costs incurred in determining project feasibility are expensed as incurred.
Amortisation
Intangible assets with finite useful lives are amortised on a straight-line basis over their useful lives. The estimated useful lives are generally:
Item Useful Life
Software and system development 5-15 years
Brand names 20 years
Customer contracts and relationships 1-20 years
Intellectual property acquired 15-20 years
Other intangible assets (other than indefinite useful life intangible assets) 20 years
The estimated useful life and amortisation method are reviewed at the end of each annual reporting period.
Impairment of assets
Goodwill and intangible assets that have an indefinite useful life are tested annually for impairment, or more frequently if events or changes in circumstances indicate that they might be impaired. Other assets are reviewed for impairment whenever events or changes in circumstances indicate that the carrying amount may not be recoverable.
An impairment loss is recognised for the amount by which the asset’s carrying amount exceeds its recoverable amount. For the purpose of assessing impairment, assets are grouped at the lowest levels for which there are separately identifiable cash inflows that are largely independent of the cash inflows from other assets or groups of assets (cash-generating units or CGUs). Non-financial assets other than goodwill that suffered impairment are reviewed for possible reversal of the impairment at each reporting date.
Allocation of goodwill to cash-generating units
Goodwill has been allocated for impairment testing purposes to CGUs (groups of units) that are significant individually or in aggregate, taking into consideration the nature of service, resource allocation, how operations are monitored and where independent cash flows are identifiable.
Following Divisional and Operational restructures and changes to operating segments there has been a change in the level at which performance and goodwill is monitored. This has resulted in a change to the manner in which impairment testing of goodwill has been performed with a consequential reallocation of goodwill across a revised group of CGUs.
Consequently, eight independent CGUs have been identified across the Group against which goodwill has been allocated and for which impairment testing has been undertaken. A goodwill impairment assessment was also performed on the previous CGUs, with no impairment identified.
Goodwill has been reallocated to the new CGUs based on the relative fair value of each CGU. Comparatives have been restated. The goodwill allocation to the new CGUs is presented below:
Carrying value of consolidated goodwill
2019$’m
2018Restated
$’m
Transport Australia(i) 283.6 212.0
Utilities Australia 335.0 335.0
Rail 55.3 55.3
Defence 53.7 53.7
Downer NZ Services(i) 70.5 68.0
Building Projects NZ 63.7 61.0
Spotless(i) 1,438.3 1,412.1
EC&M Australia 154.4 154.4
2,454.5 2,351.5
(i) Included in this amount is the goodwill for certain acquisitions made during the year ended 30 June 2019, for which the accounting remains provisional.
For
per
sona
l use
onl
y

Annual Report 2019 87
C6. Intangible assets – continued
Key estimate and judgement: Impairment of assets
Determination of potential impairment requires an estimation of the recoverable amount of the CGUs to which the goodwill and intangible assets with indefinite useful lives are allocated. Key assumptions requiring judgement include projected cash flows, discount rates, capital expenditure, working capital, budgeted EBITDA growth rate and long-term growth rate.
Recoverable amount testing – key assumptions
The recoverable amount of the identified CGUs has been completed using the higher of “value in use” and “fair value less costs of disposal” (“FVLCOD”). For each CGU, this has resulted in a “value in use” methodology being used.
The table below shows the key assumptions utilised in the “value in use” calculations.
Budgeted EBITDA(i)
Long-term growth rate
Discount rate
Transport Australia 6.7% 2.5% 8.9%
Utilities Australia 1.9% 2.5% 9.2%
Rail (8.2%) 2.5% 9.8%
Defence 15.8% 2.5% 9.3%
Downer NZ Services 5.1% 2.5% 9.2%
Building Projects NZ 4.1% 2.5% 8.8%
Spotless 5.1% 2.5% 8.1%
EC&M Australia 9.6% 2.5% 8.7%
(i) Budgeted EBITDA used for impairment testing is expressed as the compound annual growth rates from FY19 to terminal year based on the CGUs business plan.
(i) Projected cash flows including budgeted EBITDA
Value in use calculation
The Group determines the recoverable amount, using three-year cash flow projections based on the FY20 budget for the year ending 30 June 2020 and the business plan for the subsequent financial years ending 30 June 2021 and 2022 (as discussed with the Board). For FY23 onwards, the Group assumes a long-term growth rate to allow for organic growth on the existing asset base.
Cash flow projections are determined utilising the budgeted Earnings Before Interest, Tax, Depreciation and Amortisation (EBITDA) less tax, capital maintenance spending and working capital changes, adjusted to exclude any uncommitted restructuring costs and future benefits to provide a “free cash flow” estimate. This calculated “free cash flow” is then discounted to its present value using a post-tax discount rate that reflects current market assessments of the time value of money and the risks specific to the asset for which the estimates of future cash flows have not been adjusted.
Budgeted EBITDA has been based on past experience and the Group’s assessment of economic and regulatory factors affecting the industry within which the Downer businesses operate:
– Transport Australia is expected to benefit from an increase in activity in the transport infrastructure sector due to population growth, increasing user expectation and higher government spend;
– Utilities Australia is expected to benefit from an increase in activity from existing customers in the electricity and water sectors and from new customers in the wireless, commercial solar and Biosolids sectors; partially offset by the reduction in revenue from its existing significant telecommunications contracts;
– Rail is expected to contract as the two major projects (High Capacity Metro Trains and Sydney Growth Trains) transition from train construction to the Through Life Support (TLS) phase;
– Defence is expected to benefit from an increase in activity in the defence consulting sector and revenue growth through the integration of activities from building an end-to-end service offering and expanding its offering and services to key customers;
– Downer New Zealand Services is expected to benefit from increased activities on Alliance contract models and increased maintenance contracts in transport and utilities sectors;
– Building Projects New Zealand is expected to benefit from a changing competitive landscape and business development in the South Island;
– Spotless is expected to benefit from increased activities in the Government, Defence and Infrastructure and Construction (I&C) sectors including contributions from recent acquisitions; and
– EC&M Australia’s revenue and EBITDA include assumptions that take into account the cyclical nature of the resources industry and growth opportunities on Asset Maintenance Services and in long-term service agreements in the LNG and CSG sectors.
The FY20 budget and the business plan for FY21 and FY22 have included consideration of the impact of climate risk. The impact of climate risk is not a key assumption in the “value in use” calculation.
(ii) Long-term growth rates
The future annual growth rates for FY23 onwards to perpetuity are based on the historical nominal GDP rates for the country of operation.F
or p
erso
nal u
se o
nly

88 Downer EDI Limited
Notes to the consolidated financial statements – continuedfor the year ended 30 June 2019
C6. Intangible assets – continued
Recoverable amount testing – key assumptions – continued
(iii) Discount rates
Post-tax discount rates of between 8.1% and 9.8% reflect the Group’s estimate of the time value of money and risks specific to each CGU. In determining the appropriate discount rate for each CGU, consideration has been given to the estimated weighted average cost of capital (WACC) for the Group adjusted for country and business risks specific to that CGU, including benchmarking against relevant peer group companies. The post-tax discount rate is applied to post-tax cash flows that include an allowance for tax based on the respective jurisdiction’s tax rate. This method is used to approximate the requirement of the accounting standards to apply a pre-tax discount rate to pre-tax cash flows.
(iv) Budgeted capital expenditure
The cash flows for capital expenditure are based on past experience and the amounts included in the terminal year calculation are for maintenance capital used for existing plant and replacement of plant as it is retired from service. The resulting expenditure has been compared against the annual depreciation charge to ensure that it is reasonable.
(v) Budgeted working capital
Working capital has been maintained at a level required to support the business activities of each CGU, taking into account changes in the business cycle. It has been assumed to be in line with historic trends given the level of operating activity.
Sensitivities
Other than as disclosed below, the Group believes that for all CGUs, any reasonably possible change in the key assumptions would not cause the carrying value of the CGUs to exceed their recoverable amounts.
The valuation of the Spotless CGU assumes growth in the Government, I&C and Defence sectors driven by increased projects works in facilities management and critical infrastructure. The recoverable amount of the Spotless CGU currently exceeds its carrying value by $338.2 million. A number of scenarios, including the impact of macro-economic risks and the timing of the cash flows arising from these growth opportunities have been analysed. Based on the modelling and analysis performed utilising a “value in use” model, the recoverable amount of the Spotless CGU is expected to be greater than its carrying value.
Management has identified that a reasonably possible unfavourable change in the four-year compound annual EBITDA growth rate, long-term growth rate and discount rate assumptions in isolation, and in the absence of any mitigating factors or unchanged circumstances, would result in the carrying value of the Spotless CGU becoming equal to the recoverable amount.
The following table shows the approximate individual change in key assumptions under a downside sensitivity scenario for the estimated recoverable amount of the Spotless CGU to be equal to the carrying amount.
Individual changes in key assumptions that would result in nil headroom
– Decrease in four-year compound annual EBITDA growth rate (3.3%)
– Decrease in long-term growth rate (1.0%)
– Increase in the post-tax discount rate 0.9%
C7. Finance lease receivables
2019$’m
2018$’m
Less than one year 14.2 4.2
Between one and five years 40.7 4.7
Greater than five years 0.2 -
Future minimum lease receivables 55.1 8.9
Less: unearned finance income (4.0) (0.4)
Present value of minimum lease receivables 51.1 8.5
Included in the financial statements as:
Current 12.4 4.0
Non-current 38.7 4.5
There were no guaranteed residual values of assets leased under finance leases at reporting date (2018: nil).
Recognition and measurement
Some of the Group’s mining services contracts include arrangements whereby the customer will retain ownership of the assets at the end of the contract. The asset component of those contracts is recognised as finance lease receivables.
A finance lease arrangement transfers substantially all the risks and rewards of ownership of the asset to the lessee. The Group’s net investment in the lease equals the net present value of the future minimum lease payments. Finance lease income is recognised to reflect a constant periodic rate of return on the Consolidated Group’s remaining net investment in respect of the lease.F
or p
erso
nal u
se o
nly

Annual Report 2019 89
C8. Provisions
2019$’m Note
Decomm-issioning and
restoration
Warranties and contract
claims
Onerous contracts and other Total
Balance at 30 June 2018 33.1 19.8 62.9 115.8
Opening balance adjustment on application of AASB 15 G1 – – 85.2 85.2
Balance at 1 July 2018 33.1 19.8 148.1 201.0
Additional provisions recognised 2.0 14.2 58.4 74.6
Unused provisions reversed (4.3) (3.5) (18.0) (25.8)
Utilisation of provisions (2.6) (8.4) (48.8) (59.8)
Acquisition of businesses – 1.5 – 1.5
Net foreign currency exchange differences (0.1) 0.1 – –
Balance at 30 June 2019 28.1 23.7 139.7 191.5
Current 6.6 23.3 77.1 107.0
Non-current 21.5 0.4 62.6 84.5
Recognition and measurement
Provisions
Provisions are recognised when:
– The Group has a present obligation as a result of a past event;
– It is probable that resources will be expended to settle the obligation; and
– The amount of the provision can be measured reliably.
(i) Decommissioning and restoration
Provisions for decommissioning and restoration are made for close down, restoration and environmental rehabilitation costs, including the cost of dismantling and demolition of infrastructure, removal of residual materials and remediation of disturbed areas.
Future rectification costs are reviewed annually and any changes are reflected in the present value of the rectification provision at the end of the reporting period.
The provision is discounted using a pre-tax rate that reflects current market assessments of the time value of money and the risks specific to the liability.
(ii) Warranties and contract claims
Provisions for warranties and contract claims are made for the estimated liability on all products still under warranty at balance sheet date and known claims arising under service and construction contracts.
(iii) Onerous contracts and other
Provisions primarily include amounts recognised in relation to onerous customer contracts, supply contracts, surplus lease contracts and return conditions provisions for leased assets. The Group has leases that require the leased asset to be returned to the lessor in a certain condition.
The onerous contract provision is discounted using a pre-tax rate that reflects current market assessments of the time value of money and the risks specific to the liability.
Additional onerous contract provision recognised includes $45.0 million in relation to Murra Warra wind farm as detailed in Note B1.
Key estimate and judgement: Provisions
(i) Decommissioning and restoration
Judgement is required in determining the expected expenditure required to settle rectification obligations at the reporting date, based on current legal requirements and technology.
(ii) Warranties and contract claims
The provision is estimated having regard to previous claims experience.
(iii) Onerous contracts and other
These provisions have been calculated based on management’s best estimate of discounted net cash outflows required to fulfil the contracts. The status of these contracts and the adequacy of provisions are assessed at each reporting date. The return condition provision is estimated based on the costs associated with returning leased assets to the lessor in a certain condition.
For
per
sona
l use
onl
y

90 Downer EDI Limited
Notes to the consolidated financial statements – continuedfor the year ended 30 June 2019
C9. Contingent liabilities
Bonding Note2019
$’m2018
$’m
The Group has bid bonds and performance bonds issued in respect of contract performance in the normal course of business for controlled entities E2 1,323.2 1,341.6
The Group is called upon to give guarantees and indemnities to counterparties, relating to the performance of contractual and financial obligations (including for controlled entities and related parties). Other than as noted above, these guarantees and indemnities are indeterminable in amount.
Other contingent liabilities
i) The Group is subject to design liability in relation to completed design and construction projects. The Directors are of the opinion that there is adequate insurance to cover this area and accordingly, no amounts are recognised in the financial statements.
ii) The Group is subject to product liability claims. Provision is made for the potential costs of carrying out rectification works based on known claims and previous claims history. However, as the ultimate outcome of these claims cannot be reliably determined at the date of this report, contingent liability may exist for any amounts that ultimately become payable in excess of current provisioning levels.
iii) Controlled entities have entered into various joint arrangements under which the controlled entity is jointly and severally liable for the obligations of the relevant joint arrangements.
iv) The Group carries the normal contractors and consultants liability in relation to services, supply and construction contracts (for example, liability relating to professional advice, design, completion, workmanship, and damage), as well as liability for personal injury / property damage during the course of a project. Potential liability may arise from claims, disputes and / or litigation / arbitration by or against Group companies and / or joint venture arrangements in which the Group has an interest. The Group is currently managing a number of claims, arbitration and litigation processes in relation to services, supply and construction contracts as well as in relation to personal injury and property damage claims arising from project delivery.
v) Several New Zealand entities in the Group have been named as co-defendants in “leaky building” claims. The leaky building claims where Group entities are co-defendants generally relate to water damage arising from historical design and construction methodologies (and certification) for residential and other buildings in New Zealand during the early-mid 2000s. The Directors are of the opinion that disclosure of any further information relating to the leaky building claims would be prejudicial to the interests of the Group.
vi) On 16 September 2015, the Group announced that it had terminated a contract with Tecnicas Reunidas S.A. (“TR”) following TR’s failure to remedy a substantial breach of the contract and that the Group is pursuing a claim against TR in the order of $65 million. Downer has since demobilised from the site and has commenced a claim that will be determined via an arbitration process, with a hearing date currently expected to occur in April 2020. TR has initiated a counter-claim, which is being defended by Downer. The Directors are of the opinion that disclosure of any further information relating to this matter would be prejudicial to the interests of the Group.
vii) On 25 May 2017, Alison Court, as applicant, filed a representative proceeding in the Federal Court of Australia on behalf of shareholders who acquired Spotless shares from 25 August 2015 to 1 December 2015. The applicant under this proceeding alleges that Spotless engaged in misleading or deceptive conduct and/or breached its continuous disclosure obligations in relation to Spotless’ financial results for the financial year ended 30 June 2015 and in its conduct following the release of those financial results until Spotless issued its trading update of 2 December 2015. The applicant seeks damages, declarations, interest and costs. Spotless is vigorously defending the proceeding.
For
per
sona
l use
onl
y
Annual Report 2019 91
DEmployee benefits
This section provides a breakdown of the various programs Downer uses to reward and recognise employees and key executives, including Key Management Personnel (KMP). Downer believes that these programs reinforce the value of ownership and incentives and drive performance both individually and collectively to deliver better returns to shareholders.
D1. Employee benefits
D2. Key management personnel compensation
D3. Employee discount share plan
D1. Employee benefits
2019$’m
2018$’m
Employee benefits provision:
– Current 340.5 336.7
– Non-current 45.1 38.0
Total 385.6 374.7
Recognition and measurement
The employee benefits liability represents accrued wages and salaries, leave entitlements and other incentives recognised in respect of employees’ services up to the end of the reporting period. These liabilities are measured at the amounts expected to be paid when they are settled and include related on-costs, such as workers compensation insurance, superannuation and payroll tax.
Key estimate and judgement: Annual leave and long service leave
Long-term employee benefits are measured at the present value of estimated future payments for the services provided by employees up to the end of the reporting period. This calculation requires judgement in determining the following key assumptions:
– Future increase in wages and salary rates;
– Future on-cost rates; and
– Expected settlement dates based on staff turnover history.
The liability is discounted using the Australian corporate bond rates which most closely match the terms to maturity of the entitlement.
For New Zealand employees the liability is discounted using long-term government bond rates given there is no deep corporate bond market.
2019$’m
2018$’m
Employee benefits expense:
– Defined contribution plans 258.2 219.2
– Shared-based employee benefits expense 4.0 2.8
– Employee benefits 4,078.2 3,812.2
Total 4,340.4 4,034.2
D2. Key management personnel compensation
2019$
2018$
Short-term employee benefits 12,804,694 14,236,432
Post-employment benefits 1,298,516 310,779
Share-based payments 2,415,989 2,841,759
Total 16,519,199 17,388,970
Recognition and measurement
Equity-settled transactions
Equity-settled share-based transactions are measured at fair value at the date of grant. The cost of these transactions is recognised in profit or loss and credited to equity over the vesting period. At each balance sheet date, the Group revises its estimates of the number of rights that are expected to vest for service and non-market performance conditions. The expense recognised each year takes into account the most recent estimate.
The fair value at grant date is independently determined using an option pricing model and takes into account any market related performance conditions. Non-market vesting conditions are not considered when determining value; however they are included in assumptions about the number of rights that are expected to vest.
Cash-settled transactions
The amount payable to employees in respect of cash-settled share-based payments is recognised as an expense, with a corresponding increase in liabilities, over the period during which the employees become unconditionally entitled to the payment. The liability is remeasured at each reporting date and at settlement date based on the fair value, with any changes in the liability being recognised in profit or loss.
D3. Employee discount share plan
No shares were issued under the Employee Discount Share Plan during the years ended 30 June 2019 and 30 June 2018.
For
per
sona
l use
onl
y
92 Downer EDI Limited
Notes to the consolidated financial statements – continuedfor the year ended 30 June 2019
ECapital structure and financing
This section provides information relating to the Group’s capital structure and its exposure to financial risks, how they affect the Group’s financial position and performance and how the risks are managed.
The capital structure of the Group consists of debt and equity. The Directors determine the appropriate capital structure of Downer, specifically how much is raised from shareholders (equity) and how much is borrowed from financial institutions (debt) in order to finance the current and future activities of the Group. The Directors review the Group’s capital structure and dividend policy regularly and do so in the context of the Group’s ability to continue as a going concern, to invest in opportunities that grow the business and enhance shareholder value.
E1. Borrowings
E2. Financing facilities
E3. Commitments
E4. Issued capital
E5. Non-controlling interest (NCI)
E6. Reserves
E7. Dividends
E1. Borrowings
Note2019
$’m2018
$’m
CurrentSecured:
– Finance lease liabilities E3(d) 2.8 5.1 – Hire purchase liabilities E3(e) – 0.2
2.8 5.3Unsecured:
– Bank loans 6.1 2.1 – USD private placement notes 10.0 – – AUD medium term notes – 150.0 – Deferred finance charges (4.3) (3.7)
11.8 148.4Total current borrowings 14.6 153.7
Non-currentSecured:
– Finance lease liabilities E3(d) 7.4 11.2 – Hire purchase liabilities E3(e) – –
7.4 11.2Unsecured:
– Bank loans 833.4 817.7 – USD private placement notes 142.6 144.7 – AUD private placement notes 30.0 30.0 – AUD medium term notes 550.0 250.0 – JPY medium term notes 132.4 122.2 – Deferred finance charges (6.9) (8.3)
1,681.5 1,356.3Total non-current borrowings 1,688.9 1,367.5Total borrowings 1,703.5 1,521.2
Fair value of total borrowings(i) 1,798.4 1,561.8
(i) Excludes finance lease and hire purchase liabilities.
For
per
sona
l use
onl
y

Annual Report 2019 93
E1. Borrowings – continued
Recognition and measurement
Borrowings
Borrowings are initially recognised at fair value, net of transaction costs. They are subsequently measured at amortised cost using the effective interest rate method.
Fair value
The cash flows under the Group’s debt instruments are discounted using current market base interest rates and adjusted for current market credit default swap spreads for industrial companies with a BBB credit rating.
E2. Financing facilities
At reporting date, the Group had the following facilities that were unutilised:
2019$’m
2018$’m
Syndicated loan facilities 770.0 780.0
Bilateral loan facilities 297.0 145.0
Total unutilised facilities 1,067.0 925.0
Syndicated bank guarantee facilities 314.9 67.1
Bilateral bank guarantees and insurance bonding facilities 505.0 507.2
Total unutilised facilities 819.9 574.3
Summary of borrowing arrangements
Bank loan facilities
Bilateral loan facilities:
– A total of $397.0 million in bilateral loan facilities are committed unsecured facilities with maturities in calendar years 2019, 2020 and 2021.
Syndicated loan facilities:
The syndicated loan facilities are unsecured, committed facilities and comprised of Australian Dollar and New Zealand Dollar tranches as follows:
– $480 million and NZ$75 million revolving tranches maturing in April and May 2021;
– NZ$75 million term tranche maturing May 2021;
– $480 million revolving tranches maturing May 2022;
– $200 million term tranche maturing May 2022; and
– $200 million revolving tranche maturing May 2023.
USD private placement notes
USD unsecured private placement notes are on issue for a total amount of US$107.0 million. US$7.0 million notes mature in September 2019 and US$100.0 million mature in July 2025. The USD denominated principal and interest amounts have been fully hedged against the Australian dollar through cross-currency interest rate swaps.
AUD private placement notes
AUD unsecured private placement notes are on issue for a total amount of $30.0 million with a maturity date of July 2025.
Medium Term Notes (MTNs)
The Group has the following unsecured MTNs on issue:
– $250.0 million maturing March 2022;
– $300.0 million maturing April 2026; and
– JPY10.0 billion maturing May 2033.
The JPY denominated principal and interest amounts have been fully hedged against the Australian dollar through a cross-currency interest rate swap.
The above loan facilities and note issuances are supported by certain Group guarantees.
For
per
sona
l use
onl
y

94 Downer EDI Limited
Notes to the consolidated financial statements – continuedfor the year ended 30 June 2019
E2. Financing facilities – continued
Finance lease/Hire purchase facilities
The Group has certain secured facilities of these types which are for an aggregate amount of $10.2 million and which amortise over different periods of up to four years.
Covenants on financing facilities
Downer Group’s financing facilities contain undertakings to comply with financial covenants and ensure that Group guarantors of these facilities collectively meet certain minimum threshold amounts of Group EBIT and Group Total Tangible Assets (for Downer) and Group EBITDA and Group Total Assets (for Spotless).
The main financial covenants which the Group is subject to are Net Worth, Interest Service Coverage and Leverage.
Financial covenants testing is undertaken and reported to the Downer and Spotless Boards monthly. Reporting of financial covenants to financiers occurs semi-annually for the rolling 12-month periods to 30 June and 31 December. Both Downer Group and Spotless were in compliance with all their financial covenants as at 30 June 2019.
Bank guarantees and insurance bonds
The Group has $2,143.1 million of bank guarantee and insurance bond facilities to support its contracting activities. $1,210.4 million of these facilities are provided to the Group on a committed basis and $932.7 million on an uncommitted basis.
The Group’s facilities are provided by a number of banks and insurance companies on an unsecured and revolving basis. These facilities are supported by Group guarantees representing certain minimum threshold amounts of Group EBIT and Group Total Tangible Assets (for Downer) and Group EBITDA and Group Total Assets (for Spotless). $1,323.2 million (refer to Note C9) of these facilities were utilised as at 30 June 2019 with $819.9 million unutilised. These facilities have varying maturity dates between calendar years 2019 and 2021.
The underlying risk being assumed by the relevant financier under all bank guarantees and insurance bonds is corporate credit risk rather than project specific risk.
The Group has the flexibility in respect of certain committed facility amounts (shown as part of the unutilised bilateral loan facilities) which can at the election of the Group be utilised to provide additional bank guarantees capacity.
Refinancing requirements
Where existing facilities approach maturity, the Group will negotiate with existing and, where required, with new financiers to extend the maturity date or refinance these facilities. The Group’s financial metrics and credit rating as well as conditions in financial markets and other factors may influence the outcome of these negotiations.
Credit ratings
The Group has an Investment Grade credit rating of BBB (Outlook Stable) from Fitch Ratings. Where the credit rating is lowered or placed on negative watch, customers and suppliers may be less willing to contract with the Group. Furthermore, banks and other lending institutions may demand more stringent terms (including increased pricing, reduced tenors and lower facility limits) on all financing facilities, to reflect the weaker credit risk profile.
For
per
sona
l use
onl
y

Annual Report 2019 95
E3. Commitments
Note2019
$’m2018
$’m
a) Capital expenditure commitmentsPlant and equipment and otherWithin one year 103.5 60.3 Between one and five years 24.3 14.4 Greater than five years 1.3 –
129.1 74.7
b) Operating lease commitments Non-cancellable operating leases relate to premises with lease terms of between one to 20 years. Within one year 80.3 79.3 Between one and five years 261.5 225.4 Greater than five years 256.4 148.8
598.2 453.5 Non-cancellable operating leases relate to plant and equipment with lease terms of between one to ten years. Within one year 77.1 65.2 Between one and five years 111.8 84.8 Greater than five years 8.5 7.2
197.4 157.2
c) Catering rightsCatering rights relates to exclusive secured catering rights arrangements with customers.Within one year 27.8 26.9 Between one and five years 55.5 81.8 Greater than five years 5.9 12.0
89.2 120.7
d) Finance lease commitmentsFinance leases relate to plant and equipment with lease terms of between one to five years. Within one year 3.2 6.1 Between one and five years 7.4 11.6 Minimum finance lease payments 10.6 17.7 Future finance charges (0.4) (1.4)Finance lease liabilities 10.2 16.3 Included in the financial statements as:Current borrowings E1 2.8 5.1 Non-current borrowings E1 7.4 11.2
10.2 16.3
e) Hire purchase liabilitiesWithin one year – 0.2 Between one and five years – – Minimum hire purchase payments – 0.2 Hire purchase liabilities – 0.2 Included in the financial statements as:Current borrowings E1 – 0.2 Non-current borrowings E1 – –
– 0.2
f) Operating lease expensesOperating lease expenses relating to land and buildings 89.8 81.8Operating lease expenses relating to plant and equipment 113.8 121.1Total operating lease expenses 203.6 202.9
For
per
sona
l use
onl
y

96 Downer EDI Limited
Notes to the consolidated financial statements – continuedfor the year ended 30 June 2019
E3. Commitments – continued
Recognition and measurement
Leases
When the terms of a lease transfer substantially all the risks and rewards of ownership to the Group, the lease is classified as a finance lease. All other leases are classified as operating leases.
(i) Operating leases
Operating lease payments are recognised as an expense on a straight-line basis over the term of the lease, except where another systematic basis is more representative of the time pattern in which economic benefits from the leased assets are consumed.
(ii) Finance leases
Assets held under finance leases are initially recognised at an amount equal to the lower of their fair value or the present value of the minimum lease payments. Subsequently the assets are depreciated on a straight-line basis over the lesser of the estimated useful life or the lease term.
Finance lease payments are apportioned between the finance expense and the reduction of outstanding liability. The finance expense is allocated to each period during the lease term so as to achieve a constant rate of interest on the remaining balance of the liability.
E4. Issued capital
2019$’m
2018$’m
Ordinary shares
594,702,512 ordinary shares (2018: 594,702,512) 2,263.1 2,263.1
Unvested executive incentive shares
3,385,446 ordinary shares (2018: 4,207,358) (16.6) (19.8)
200,000,000 Redeemable Optionally Adjustable
Distributing Securities (ROADS) (2018: 200,000,000) 178.6 178.6
2,425.1 2,421.9
a) Fully paid ordinary share capital
Fully paid ordinary shares carry one vote per share and carry the right to dividends.
2019 2018
m’s $’m m’s $’m
Fully paid ordinary share capital
Balance at the beginning of the financial year 594.7 2,263.1 594.7 2,263.2
Capital raising costs net of tax – – – (0.1)
Balance at the end of the financial year 594.7 2,263.1 594.7 2,263.1
b) Unvested executive incentive shares
Balance at the beginning of the financial year 4.2 (19.8) 4.3 (20.0)
Vested executive incentive share transactions(i) (0.8) 3.2 (0.1) 0.2
Balance at the end of the financial year 3.4 (16.6) 4.2 (19.8)
(i) June 2019 figures are referable to the 2015 LTI plan, second deferred component of the 2016 STI award and first deferred component of the 2017 STI award totalling 821,912 vested shares for a value of $3,166,042.
June 2018 figures are referable to the second deferred component of the 2015 STI award and the first deferred component of the 2016 STI award totalling 50,015 vested shares for a value of $192,660.
Unvested executive incentive shares are stock market purchases and are held by the Executive Employee Share Plan Trust under the Long Term Incentive (LTI) plan. From the 2011 LTI plan onwards, no dividends will be distributed on shares held in trust during the performance measurement and service periods. Accumulated dividends will be paid out to executives after all vesting conditions have been met. Otherwise, excess net dividends are retained in the trust to be used by the Company to acquire additional shares on the market for employee equity plans.
For
per
sona
l use
onl
y

Annual Report 2019 97
E4. Issued capital – continued
2019 2018
m’s $’m m’s $’m
c) Redeemable Optionally Adjustable Distributing Securities (ROADS)
Balance at the beginning and at the end of the financial year 200.0 178.6 200.0 178.6
ROADS are perpetual, redeemable, exchangeable preference shares. In accordance with the terms of the ROADS preference shares, the dividend rate for the one year commencing 15 June 2019 is 5.49% per annum (2018: 6.15% per annum) which is equivalent to the one year swap rate on 17 June 2019 of 1.44% per annum plus the Step-up margin of 4.05% per annum.
Share options and performance rights
During the financial year 1,044,363 performance rights (2018: 1,078,912) in relation to unissued shares were granted to senior executives of the Group under the LTI plan. Further details of the Key Management Personnel (KMP) LTI plan are contained in the Remuneration Report.
Recognition and measurement
Ordinary shares
Incremental costs directly attributed to the issue of ordinary shares are accounted for as a deduction from equity, net of any tax effects.
Executive incentive shares
When executive incentive shares subsequently vest to employees under the Downer employee share plans, the carrying value of the vested shares is transferred from issued capital to the employee benefits reserve.
E5. Non-controlling interest (NCI)
The following table summarises the NCI in relation to the Group’s subsidiaries:
2019 2018
Spotless$’m
Other$’m
Total$’m
Spotless$’m
Current assets 566.6 22.3 588.9 529.1
Non-current assets 2,283.3 1.2 2,284.5 2,272.8
Current liabilities (602.5) (7.0) (609.5) (521.1)
Non-current liabilities (1,004.5) (0.1) (1,004.6) (1,009.9)
Net assets 1,242.9 16.4 1,259.3 1,270.9
NCI percentage 12.198% 26.0% 12.380% 12.198%
Net assets attributable to NCI 151.6 4.3 155.9 155.0
For
per
sona
l use
onl
y

98 Downer EDI Limited
Notes to the consolidated financial statements – continuedfor the year ended 30 June 2019
E6. Reserves
2019 $’m
Hedge reserve
Foreign currency
translation reserve
Employee benefits reserve
Fair value through OCI
reserve(i)
Total attributable
to the members of
the Parent
Balance at 1 July 2018 (13.0) (26.8) 15.5 (2.6) (26.9)
Foreign currency translation difference – 10.1 – – 10.1
Change in fair value of cash flow hedges (net of tax) (11.0) – – – (11.0)
Total comprehensive income for the year (11.0) 10.1 – – (0.9)
Vested executive incentive share transactions – – (3.2) – (3.2)
Share-based employee benefits expense – – 4.0 – 4.0 Income tax relating to share-based transactions during the year – – (0.5) – (0.5)
Balance at 30 June 2019 (24.0) (16.7) 15.8 (2.6) (27.5)
(i) Before 1 July 2018, these reserves were classified in the available-for-sale revaluation reserve in accordance with AASB 139. From 1 July 2018, these are classified as Fair Value through Other Comprehensive Income (FVOCI) in accordance with AASB 9.
2018 $’m
Hedge reserve
Foreign currency
translation reserve
Employee benefits reserve
Available-for-sale
revaluation reserve
Total attributable
to the members of
the Parent
Balance at 1 July 2017 (6.2) (18.0) 14.1 (0.8) (10.9)
Foreign currency translation difference – (8.8) – – (8.8)
Change in fair value of cash flow hedges (net of tax) (6.8) – – – (6.8)
Change in fair value of available-for-sale assets – – – (1.3) (1.3)
Available-for-sale reserve transferred to profit or loss – – – (0.5) (0.5)
Total comprehensive income for the year (6.8) (8.8) – (1.8) (17.4)
Vested executive incentive share transactions – – (0.2) – (0.2)
Share-based employee benefits expense – – 2.8 – 2.8
Income tax relating to share-based transactions during the year – – (1.2) – (1.2)
Balance at 30 June 2018 (13.0) (26.8) 15.5 (2.6) (26.9)
Hedge reserve
The hedge reserve comprises the effective portion of the cumulative net change in the fair value of cash flow hedging instruments relating to future transactions.
Foreign currency translation reserve
The foreign currency translation reserve comprises foreign exchange differences arising from the translation of the financial statements of operations where their functional currency is different to the presentation currency of the Group.
Employee benefit reserve
The employee benefit reserve is used to recognise the fair value of share-based payments issued to employees over the vesting period, and to recognise the value attributable to the share-based payments during the reporting period.
Fair value through OCI reserve
The fair value through OCI reserve comprises the cumulative net change in the fair value of equity investments designated as FVOCI (2018: available-for-sale financial assets) until the assets are derecognised or reclassified. This amount is reduced by the amount of loss allowance.
For
per
sona
l use
onl
y
Annual Report 2019 99
E6. Reserves – continued
Available-for-sale revaluation reserve
The available-for-sale reserve includes the cumulative net movement above cost of the fair value of available-for-sale investment until the asset is realised or impaired or control of an acquiree is obtained at which time the cumulative gain or loss previously recognised in the available-for-sale revaluation reserve is included in the profit or loss.
E7. Dividends
a) Ordinary shares2019 Final
2019 Interim
2018 Final
2018Interim
Dividend per share (in Australian cents) 14.0 14.0 14.0 13.0Franking percentage 50% 50% 50% 50%Cost (in $’m) 83.3 83.3 83.3 77.3
Dividend record date 4/9/19 21/2/19 30/8/18 7/3/18
Payment date 2/10/19 21/3/19 27/9/18 4/4/18
Recognition and measurement
Provision is made for the amount of any dividend declared, being appropriately authorised and no longer at the discretion of the entity, before or at the end of the financial year but not distributed at balance date.
The final 2019 dividend has not been declared at the reporting date and therefore is not reflected in the consolidated financial statements.
b) Redeemable Optionally Adjustable Distributing Securities (ROADS)2019 Quarter 1 Quarter 2 Quarter 3 Quarter 4 Total
Dividend per ROADS (in Australian cents) 1.01 1.05 1.06 1.06 4.18
New Zealand imputation credit percentage 100% 100% 100% 100% 100%
Cost (in A$’m) 2.0 2.1 2.1 2.1 8.3
Payment date 17/9/18 17/12/18 15/3/19 17/6/19
2018 Quarter 1 Quarter 2 Quarter 3 Quarter 4 Total
Dividend per ROADS (in Australian cents) 1.00 0.99 1.02 1.00 4.01New Zealand imputation credit percentage 100% 100% 100% 100% 100%Cost (in A$’m) 2.0 2.0 2.0 2.0 8.0Payment date 15/9/17 15/12/17 15/3/18 15/6/18
c) Franking credits
The franking account balance as at 30 June 2019 is nil (2018: nil).
For
per
sona
l use
onl
y

100 Downer EDI Limited
Notes to the consolidated financial statements – continuedfor the year ended 30 June 2019
FGroup structure
This section explains significant aspects of Downer’s Group structure, including joint arrangements where the Group has interest in its controlled entities and how changes have affected the Group structure. It also provides information on business acquisitions and disposals made during the financial year as well as information relating to Downer’s related parties, the extent of related party transactions and the impact they had on the Group’s financial performance and position.
F1. Joint arrangements and associate entities
F2. Acquisition of businesses
F3. Disposal of business
F4. Controlled entities
F5. Related party information
F6. Parent entity disclosures
F1. Joint arrangements and associate entities
a) Interest in joint ventures and associates2019
$’m2018
$’m
Interest in joint ventures at the beginning of the financial year 21.2 19.0
Share of net profit 17.1 15.9
Share of distributions (15.6) (13.5)
Interest in Joint Venture acquired 8.5 –
Foreign currency exchange differences 0.3 (0.2)
Interest in joint ventures at the end of the financial year 31.5 21.2
Interest in associates at the beginning of the financial year 74.8 69.0
Share of net profit 13.3 9.2
Share of distributions (6.8) (3.4)
Acquisition of MHPS Plant Services Pty Ltd (4.0) –
Interest in associates at the end of the financial year 77.3 74.8
Interest in joint ventures and associates 108.8 96.0
For
per
sona
l use
onl
y

Annual Report 2019 101
F1. Joint arrangements and associate entities – continued
a) Interest in joint ventures and associates – continued
The Group has interests in the following joint ventures and associates which are equity accounted:
Name of arrangement Principal activityCountry ofoperation
Ownership interest
2019%
2018%
Joint venturesAllied Asphalt Limited Asphalt plant New Zealand 50 50
Bitumen Importers Australia Joint Venture Construction of bitumen storage facility Australia 50 50
Bitumen Importers Australia Pty Ltd Bitumen importer Australia 50 50
Eden Park Catering Limited Catering for functions at Eden Park New Zealand 50 50
EDI Rail-Bombardier Transportation Pty Ltd Sale and maintenance of railway rolling stock Australia 50 50
Emulco Limited Emulsion plant New Zealand 50 50
Isaac Asphalt Limited Manufacture and supply of asphalt New Zealand 50 50
Repurpose It Holdings Pty Ltd(ii) Waste recycling Australia 50 –
RTL Mining and Earthworks Pty Ltd Contract mining; civil works and plant hire Australia 44 44
Waanyi Downer JV Pty Ltd Contract mining services Australia 50 50
ZFS Functions (Pty) Ltd Catering for functions at Federation Square Australia 50 50
AssociatesMHPS Plant Services Pty Ltd Refurbishment, construction and
maintenance of boilers Australia (i) 27
Keolis Downer Pty Ltd Operation and maintenance of Gold Coast light rail, Melbourne tram network and bus operation Australia 49 49
(i) Downer acquired the remaining 73.33% of MHPS Plant Services Pty Ltd on 30 August 2018. Refer to Note F2. The entity name has been subsequently changed to DMH Plant Services Pty Ltd during the year ended 30 June 2019.
(ii) JV acquired during the financial year ended 30 June 2019.
There are no material commitments held by joint ventures or associates. All joint ventures and associates have a statutory reporting date of 30 June.
Recognition and measurement
Equity accounting
(i) Investments in joint ventures
Investments in joint ventures are accounted for using the equity method of accounting.
(ii) Investments in associates
Investments in entities over which the Group has the ability to exercise significant influence, but not control, are accounted for using the equity method of accounting. The investment in associates is carried at cost plus post-acquisition changes in the Group’s share of the associates’ net assets, less any impairment in value.
Proportionate consolidation
Joint operations
Joint operations give the Group the right to the underlying assets and obligations for liabilities and are accounted for by recognising the share of those assets and liabilities.F
or p
erso
nal u
se o
nly

102 Downer EDI Limited
Notes to the consolidated financial statements – continuedfor the year ended 30 June 2019
F1. Joint arrangements and associate entities – continued
b) Interest in joint operations
The Group has interests in the following joint operations which are proportionately consolidated:
Name of joint operation Principal activityCountry of operation
Ownership interest
2019%
2018%
Ausenco Downer Joint Venture Enabling works for Carrapateena Project Australia 50 50
BPL Downer Joint Venture(iv) Building construction Singapore – 50
CDJV Construction Pty Ltd(iv) Employment of labour force deployed in Clough Downer
Australia – 50
China Hawkins Construction JV Building construction New Zealand 50 50
City Rail JV Enabling works for Auckland City Rail Link New Zealand 50 50
Clough Downer Joint Venture(iv) Gas compression facilities and pipelines Australia – 50
Concrete Paving Recycling Pty Ltd Road maintenance Australia 49 49
CRL Construction Joint Venture(vii) Construction of the City Rail Link Alliance Project New Zealand 30 –
Dampier Highway Joint Venture Highway construction and design Australia 50 50
DM Roads Services Pty Ltd(ii) Employment of labour force deployed in DM in New South Wales
Australia (ii) 50
Downer-Carey Mining JV(viii) Management of run of mine and ore rehandling services
Australia 46 46
Downer Daracon Joint Venture(iv) Construction Australia – 50
Downer EDI Works Pty Ltd & CPB Contractors Pty Limited(vi)
Parramatta Light Rail construction Australia 50 50
Downer Electrical GHD JV(i) Traffic control infrastructure Australia 90 90
Downer FKG JV Major civil and roadworks Australia 50 50
Downer HEB Joint Venture (Memorial Park Alliance)
Design and build of the New Zealand National War Memorial Park
New Zealand 50 50
Downer HEB Joint Venture (Mt Messenger Project)
Design and build of the Mt Messenger Project New Zealand 50 50
Downer MCD Wynyard Edge JV (Americas Cup Project)
Design and build on Americas Cup Project New Zealand 50 50
Downer KHSA JV(ii) Road maintenance Australia (ii) 60
Downer Seymour Whyte JV Construct of an urban operations training facility Australia 50 50
Downer York Joint Venture Tramline extension Australia 50 50
Downtown Infrastructure Development Project JV(vii)
Downtown infrastructure development program New Zealand 33 –
Gumala Downer Joint Venture(vii) Contract mining services Australia 50 –
Hatch Downer JV Design and construction of solvent extraction plant Australia 50 50
HCMT Supplier JV Rail build supplier Australia 50 50
John Holland EDI Joint Venture(iv) Research reactor Australia – 40
John Holland Pty Ltd & Downer Utilities Australia Pty Ltd Partnership
Operation of water recycling plant at Mackay Australia 50 50
Karlayura ReGen Joint Venture(viii) Road construction Australia 50 50
Landloch Project JV(iv) Rehabilitation works, earthworks and plant monitoring and maintenance
Australia – (iii)
Leighton Works Joint Venture(iv) Road construction New Zealand – 50
Macdow Downer Joint Venture (Connectus) Rail construction New Zealand 50 50
Macdow Downer Joint Venture (CSM2) Road construction New Zealand 50 50
Macdow Downer Joint Venture (Russley Road)
Road construction New Zealand 50 50
For
per
sona
l use
onl
y

Annual Report 2019 103
Name of joint operation Principal activityCountry of operation
Ownership interest
2019%
2018%
North Canterbury Transport Infrastructure Economic Recovery Alliance “NCTIER” JV
Kaikoura earthquake works New Zealand 25 25
Organic Water Joint Venture(iv) Design, construction and operation of water recycling plant
Australia – 50
RPQ JV (v) (v)
Safety Focused Performance JV(vii) Water and sewerage capital works Australia 45 –
Thiess VEC Joint Venture Highway construction Australia 50 50
Utilita Water JV Plant maintenance Australia 50 50
VEC Shaw Joint Venture Road construction Australia 50 50
Waanyi ReGen JV Rehab contract services Australia 50 50
WDJV Unit Trust Contract mining services Australia 50 50
Wiri Train Depot Joint Venture Construction of the Wiri train depot New Zealand 50 50
(i) Contractual arrangement prevents control despite ownership of more than 50% of these joint ventures.(ii) Following the acquisition of KHSA Limited which holds the remaining interest in the Downer KHSA JV (formerly known as Downer Mouchel JV) and DM Roads Services Pty Ltd,
these joint ventures are now 100% controlled by the Group. Refer to Note F2.(iii) Joint control is through unanimous vote by joint venture partners to direct the joint arrangement’s relevant activities; however, the Group’s interest may vary based on
discrete phases of works performed.(iv) Joint venture ceased / terminated / de-registered during the year ended 30 June 2019.(v) Following the acquisition of RPQ Group, the joint venture is 100% controlled by the Group.(vi) Joint Venture name has been changed to CPB Contractors Pty Limited from Leighton Contractors Pty Ltd during the year ended 30 June 2019.(vii) Joint operation entered into during the year ended 30 June 2019.(viii) Joint Venture commenced liquidation / de-registration as at 30 June 2019.
F2. Acquisition of businesses
2019
Cash outflow on acquisitions
The total net cash outflow as a result of the acquisitions made during the year ended 30 June 2019 is as follows:
2019$’m
2018$’m
Gross purchase consideration 100.7 119.3
Deferred consideration paid(i) 15.6 1.3
Less: Net cash acquired (35.9) (1.3)
Less: Deferred and contingent consideration (17.4) (35.2)
Total cash consideration 63.0 84.1
(i) Represents purchase and deferred consideration paid during the year for Envista, AGIS and RPQ.
MHPS Plant Services
On 30 August 2018, the Group acquired the remaining 73.33% of MHPS Plant Services Pty Ltd (“MHPS”) for consideration of $5.6 million.
The acquisition accounting for MHPS remains provisionally accounted for as at 30 June 2019.
Rock N Road
On 3 October 2018, the Group acquired 100% of the shares of Rock N Road Bitumen Pty Ltd (“RNR”) for total consideration of $17.9 million. RNR is a road surfacing business based in Mackay and operates in the central and northern regions of Queensland.
The acquisition accounting for RNR remains provisionally accounted for as at 30 June 2019.
F1. Joint arrangements and associate entities – continued
b) Interest in joint operations – continued
For
per
sona
l use
onl
y

104 Downer EDI Limited
Notes to the consolidated financial statements – continuedfor the year ended 30 June 2019
F2. Acquisition of businesses – continued
Cash outflow on acquisitions – continued
KHSA Limited
On 21 December 2018, the Group executed a Share Sale Deed to acquire 100% of the shares in the Downer Mouchel Joint Venture partner KHSA Limited (“KHSA”) for consideration of $43.7 million, including cash of $19.5 million.
As KHSA Limited has a 50% interest in the Downer Mouchel Joint Venture (alongside Downer’s existing 50% interest), Downer Mouchel Joint Venture is now 100% controlled. On acquisition of the remaining 50% interest, the initial investment was re-measured to fair value in accordance with Australian Accounting Standards and compared to the existing carrying value. As a result, $17.0 million fair value gain on re-measurement has been reported as other income in the statement of profit or loss.
The acquisition accounting for KHSA remains provisionally accounted for as at 30 June 2019.
Boleh Consulting
On 7 December 2018, the Group acquired the net assets of Boleh Consulting (“Boleh”) for total consideration of $1.4 million. The business provides a range of engineering services to the railway industry that include design of train control and signalling systems, systems engineering, systems assurance and project management.
The acquisition accounting for Boleh remains provisionally accounted for as at 30 June 2019.
Envar Group
On 28 February 2019, The Group acquired 100% of the shares of Envar Group (“Envar”) through Spotless for a total consideration of $24.9 million. The primary purpose of this acquisition is to continue to build a market leading integrated mechanical and electrical business.
The acquisition accounting for Envar remains provisionally accounted for as at 30 June 2019.
The Roading Company Limited
On 1 May 2019, the Group acquired the net assets of The Roading Company Limited for a total consideration of $5.4 million. The Roading Company is a roading and civil construction business based in New Zealand.
The acquisition accounting for The Roading Company remains provisionally accounted for as at 30 June 2019.
FH Lismore
On 22 March 2019, the Group acquired the net assets of Fulton Hogan’s surfacing business in Lismore, New South Wales for a total consideration of $1.8 million. The assets provide Downer access to the surfacing market in and around Lismore to enhance the road maintenance capabilities in the area.
The acquisition accounting for FH Lismore remains provisionally accounted for as at 30 June 2019.
For
per
sona
l use
onl
y

Annual Report 2019 105
F2. Acquisition of businesses – continued
Note2019
$’m2018
$’m
Cash 87.3 84.1
Deferred and contingent consideration 17.4 35.2
104.7 119.3
Fair value gain on revaluation of existing interest in Downer Mouchel Joint Venture 17.0 -
Less: Net identifiable assets acquired (23.5) (14.3)
Provisional goodwill arising from acquisitions C6 98.2 105.0
2018 Acquisitions
UrbanGrid
On 1 July 2017, Downer acquired the net assets of UrbanGrid Australia (“UrbanGrid”). UrbanGrid provides a wide range of specialist services to develop, operate and maintain Western Australia’s essential water, energy and communications networks as well as civil projects.
The Group has concluded the acquisition accounting process for this acquisition and there was no material change arising from finalisation.
Cabrini
On 1 July 2017, Spotless Facility Services Pty Ltd acquired the customer contracts and associated assets and liabilities of Cabrini Linen Service (“Cabrini”) from Cabrini Health Limited. The primary purpose of this acquisition is to strengthen Spotless’ linen capabilities, enhance customer service offerings and maintain Spotless’ market-leading position in the Victorian health sector.
The Group has concluded the acquisition accounting process for this acquisition and there was no material change arising from finalisation.
Integrated Services
On 31 January 2018, the Group acquired the net assets of Integrated Services. The business provides traffic infrastructure electrics related works and complements the existing Transport business capabilities.
The Group has concluded the acquisition accounting process for this acquisition and there was no material change arising from finalisation.
Envista
On 2 March 2018, the Group acquired 100% of Envista Pty Ltd and Smarter Contracting Pty Ltd (“Envista”). Envista provides strategy, architecture and delivery services in complex and sensitive environments. The acquisition enhances Downer’s services to customers in the Defence and National Security sectors.
The Group has concluded the acquisition accounting process for this acquisition and there was no material change arising from finalisation.
For
per
sona
l use
onl
y

106 Downer EDI Limited
Notes to the consolidated financial statements – continuedfor the year ended 30 June 2019
F2. Acquisition of businesses – continued
Measurement of fair values
The valuation techniques used for measuring the fair value of material assets acquired were as follows:
Asset acquired Valuation technique
Trade receivables and contract assets Cost technique – considers the expected economic benefits receivable when due.
Property, plant and equipment Market comparison technique and cost technique – the valuation model considers quoted market prices for similar items when available and depreciated replacement cost when appropriate.
Intangible assets Multi-period excess earnings method – considers the present value of net cash flows expected to be generated by the customer contracts and relationships, intellectual property and brand names, excluding any cash flows related to contributory assets. For the valuation of certain brand names, discounted cash flow under the relief from royalty valuation methodology has been utilised.
Trade payables and contract liabilities Cost technique – considers the expected economic outflow of resources when due.
Borrowings Cost technique – considers the expected economic outflow of resources when due.
Provisions Cost technique – considers the probable economic outflow of resources when the obligation arises.
Goodwill from acquisitions
The goodwill resulting from the above acquisitions represents future market development, expected revenue growth opportunities, technical talent and expertise, and the benefits of expected synergies. These benefits are not recognised separately from goodwill because they do not meet the recognition criteria for identifiable intangible assets. None of the goodwill arising from these acquisitions is expected to be deductible for tax purposes.
Recognition and measurement
Business combinations
The Group accounts for business combinations using the acquisition method when control is transferred to the Group. The consideration transferred in the acquisition is measured at fair value. Acquisition-related costs are expensed as incurred in profit or loss.
(i) Acquisition achieved in stages
Where a business combination is achieved in stages, the Group’s previously held equity interest in the acquiree is remeasured to fair value at the acquisition date (i.e. the date when the Group attains control) and the resulting gain or loss, if any, is recognised in profit or loss. Amounts arising from interests in the acquiree prior to the acquisition date that have previously been recognised in other comprehensive income are reclassified to profit or loss where such treatment would be appropriate if that interest were disposed of or control of the acquiree obtained.
(ii) Contingent consideration
The subsequent accounting for changes in the fair value of contingent consideration that do not qualify as measurement period adjustments depends on how the contingent consideration is classified.
Contingent consideration that is classified as equity is not remeasured at subsequent reporting dates and its subsequent settlement is accounted for within equity.
Contingent consideration that is classified as an asset or liability is remeasured at subsequent reporting dates with the corresponding gain or loss being recognised in profit or loss.
(iii) Non-controlling interest
The Group can elect, on an acquisition by acquisition basis, to recognise non-controlling interests in an acquired entity either at fair value or at the non-controlling interest’s share of the acquired entity’s net identifiable assets / (liabilities).
Key estimate and judgement: Accounting for acquisition of businesses
Accounting for acquisition of businesses requires judgement and estimates in determining the fair value of acquired assets and liabilities. The relevant accounting standard allows the fair value of assets acquired to be refined in a window of a year after the acquisition date and judgement is required to ensure that the adjustments made reflect new information obtained about facts and circumstances that existed as of the acquisition date. The adjustments made to the fair value of assets are retrospective in nature and have an impact on goodwill recognised on acquisition.F
or p
erso
nal u
se o
nly

Annual Report 2019 107
F3. Disposal of business
2019
The Group did not dispose any business during the year ended 30 June 2019.
2018
On 21 November 2017, Downer entered an agreement to sell its Freight Rail business to Progress Rail for $109 million ($122.7 million after adjusting for working capital movements). This sale was completed on 2 January 2018 with the final settlement payment of $6.9 million in relation to working capital adjustments made during 2019. The following disposal entries were recorded in the 2018 financial year:
Note2018
$’m
Proceeds on disposal 129.6
Less: working capital adjustments (6.9)
Disposal costs incurred (4.3)
Proceeds net of disposal costs 118.4
Trade receivables and contract assets 30.0
Amounts due from customers under contracts 33.5
Inventory 49.4
Other assets 0.1
Intangibles (goodwill) C6 14.2
Property, plant and equipment C5 60.0
Assets disposed 187.2
Trade payables and contract liabilities (3.7)
Amounts due to customers under contracts (1.9)
Employee benefits provisions (8.6)
Provisions (4.4)
Liabilities disposed (18.6)
Net assets disposed 168.6
Loss on disposal pre-tax (50.2)
Income tax benefit 9.6
Total loss on disposal after tax (40.6)For
per
sona
l use
onl
y

108 Downer EDI Limited
Notes to the consolidated financial statements – continuedfor the year ended 30 June 2019
F4. Controlled entities
The controlled entities of the Group listed below were wholly owned during the current and prior year, unless otherwise stated:
Australia
AGIS Group Pty LtdASPIC Infrastructure Pty LtdDean Adams Consulting Pty Ltd(vii)
DMH Plant Services Pty Ltd(iii) DMH Maintenance and Technology Services Pty Ltd(iii) DMH Electrical Services Pty Ltd(iii) Downer Australia Pty Ltd Downer EDI Associated Investments Pty LtdDowner EDI Engineering Company Pty LimitedDowner EDI Engineering CWH Pty LimitedDowner EDI Engineering Electrical Pty LtdDowner EDI Engineering Group Pty LimitedDowner EDI Engineering Holdings Pty LtdDowner EDI Engineering Power Pty LtdDowner EDI Engineering Pty LimitedDowner EDI Limited Tax Deferred Employee Share PlanDowner EDI Mining Pty LtdDowner EDI Mining Blasting Services Pty LtdDowner EDI Mining Minerals Exploration Pty LtdDowner EDI Rail Pty Ltd Downer EDI Services Pty LtdDowner EDI Works Pty Ltd Downer Energy Systems Pty LimitedDowner Group Finance Pty Limited Downer Holdings Pty LimitedDowner Investments Holdings Pty LtdDowner Mining Regional NSW Pty LtdDowner PipeTech Pty LimitedDowner PPP Investments Pty LtdDowner Utilities Australia Pty LtdDowner Utilities Holdings Australia Pty LtdDowner Utilities Networks Pty Ltd(vii)
Downer Utilities New Zealand Pty LimitedDowner Utilities Projects Pty Ltd(vii)
Downer Utilities SDR Australia Pty Ltd(vii)
Downer Utilities SDR Pty Ltd Downer Victoria PPP Maintenance Pty LtdEDI Rail PPP Maintenance Pty LtdEDICO Pty Ltd Emoleum PartnershipEmoleum Road Services Pty Ltd Emoleum Roads Group Pty LtdEmoleum Services Pty Limited(vii)
Envista Pty LimitedEvans Deakin Industries Pty Ltd LNK Group Pty LtdLowan (Management) Pty. Ltd.Maclab Services Pty LtdMineral Technologies (Holdings) Pty LtdMineral Technologies Pty LtdNew South Wales Spray Seal Pty LtdOtraco International Pty LtdOtracom Pty LtdPrimary Producers Improvers Pty Ltd
QCC Resources Pty LtdRail Services Victoria Pty LtdREJV Services Pty LtdRoche Bros. Superannuation Pty. Ltd.Roche Services Pty LtdRock N Road Bitumen Pty Ltd(iii)
RPC Roads Pty LtdRPQ Asphalt Pty LtdRPQ North Coast Pty LtdRPQ Pty LtdRPQ Services Pty LtdRPQ Spray Seal Pty LtdSACH Infrastructure Pty Ltd(vii)
Smarter Contracting Pty LtdSnowden Holdings Pty LtdSnowden Mining Industry Consultants Pty LtdSnowden Technologies Pty Ltd Southern Asphalters Pty LtdTrico Asphalt Pty LtdVEC Civil Engineering Pty LtdVEC Plant & Equipment Pty Ltd
New Zealand and Pacific
AF Downer Memorial Scholarship TrustDGL Investments LimitedDowner Construction (Fiji) Limited Downer Construction (New Zealand) LimitedDowner EDI Engineering Power LimitedDowner EDI Engineering PNG LimitedDowner EDI Works Vanuatu LimitedDowner New Zealand LimitedDowner New Zealand Projects 1 LtdDowner New Zealand Projects 2 LtdDowner Utilities Alliance New Zealand LimitedDowner Utilities New Zealand LimitedDowner Utilities PNG Limited(vii)
Green Vision Recycling LimitedHawkins 2017 LimitedHawkins Project 1 LimitedITS Pipetech Pacific (Fiji) LimitedRichter Drilling (PNG) LimitedTechtel Training & Development LimitedThe Roading Company Limited(viii)
Underground Locators LimitedWaste Solutions Limited Works Finance (NZ) Limited
For
per
sona
l use
onl
y

Annual Report 2019 109
F4. Controlled entities – continued
Africa
Downer EDI Mining Ghana LtdDowner Mining South Africa Proprietary LimitedMD Mineral Technologies SA (Pty) Ltd.MD Mining and Mineral Services (Pty) Ltd(i)
Otraco Botswana (Proprietary) LimitedOtraco Southern Africa (Pty) Ltd(ii) Otraco Tyre Management Namibia (Proprietary) LimitedSnowden Mining Industry Consultants (Proprietary) Ltd
Asia
Chang Chun Ao Da Technical Consulting Co Ltd(iv)
Chang Chun Ao Hua Technical Consulting Co LtdDowner EDI Engineering (S) Pte Ltd Downer EDI Engineering Holdings (Thailand) Limited Downer EDI Engineering Thailand Ltd Downer EDI Group Insurance Pte Ltd Downer EDI Rail (Hong Kong) LimitedDowner EDI Works (Hong Kong) LimitedDowner Pte LtdDowner Singapore Pte LtdMD Mineral Technologies Private LimitedPT Duffill Watts IndonesiaPT Otraco Indonesia
Americas
DBS Chile SpA Mineral Technologies Comercio de Equipamentos para Processamento de Minerais LTDMineral Technologies, Inc.Otraco Brasil Gerenciamento de Pneus Ltda Otraco Chile SA Snowden Consultoria do Brasil LimitadaSnowden Mining Industry Consultants Inc.(iv)
United Kingdom
KHSA Limited(iii) Sillars (B. & C.E.) LimitedSillars (TMWD) LimitedSillars Holdings LimitedSillars Road Construction LimitedWorks Infrastructure (Holdings) Limited Works Infrastructure Limited
Spotless(v)
AE Smith & Son (NQ) Pty LtdAE Smith & Son (SEQ) Pty LtdAE Smith & Son Proprietary LtdAE Smith Building Technologies Pty LtdAE Smith Service (SEQ) Pty LtdAE Smith Service Holdings Pty LtdAE Smith Service Pty LtdAirparts Holdings Pty Ltd(iii)
Airparts Fabrication Pty Ltd(iii)
Aladdin Group Services Pty Limited(vi)
Aladdins Holdings Pty Limited(vi) Aladdin Laundry Pty Limited(vi) Aladdin Linen Supply Pty Limited(vi) Asset Services (Aust) Pty Ltd(vi) Berkeley Challenge (Management) Pty Limited(vi)
Berkeley Challenge Pty Limited(vi) Berkeley Railcar Services Pty Ltd(vi) Berkeleys Franchise Services Pty Ltd(vi) Bonnyrigg Management Pty Limited(vi)
Cleandomain Proprietary Limited(vi) Cleanevent Australia Pty Ltd(vi) Cleanevent Holdings Pty Limited(vi) Cleanevent International Pty Limited(vi) Cleanevent Technology Pty Ltd(vi) Emerald ESP Pty LtdEnvar Installation Pty Ltd(iii)
Envar Service Pty Ltd(iii)
Envar Holdings Pty Ltd(iii)
Envar Engineers & Contractors Pty Ltd(iii)
Ensign Services (Aust) Pty Ltd(vi) Errolon Pty Ltd(vi) Fieldforce Services Pty Ltd(vi) Infrastructure Constructions Pty Ltd(vi) International Linen Service Pty Ltd(vi) Monteon Pty Ltd(vi) National Community Enterprises(vii) Nationwide Venue Management Pty Ltd(vi) NG-Serv Pty Ltd(vi)
Nuvogroup (Australia) Pty Ltd(vi)
Pacific Industrial Services BidCo Pty Limited(vi) Pacific Industrial Services FinCo Pty Limited(vi) Riley Shelley Services Pty Ltd(vi) Skilltech Consulting Services Pty Ltd(vi) Skilltech Metering Solutions Pty Ltd(vi) Sports Venue Services Pty Ltd(vi) Spotless Defence Services Pty Ltd(vi) Spotless Facility Services (NZ) LimitedSpotless Facility Services Pty Ltd(vi) Spotless Financing Pty Limited(vi) Spotless Group Limited(vi) Spotless Group Holdings Limited(vi) Spotless Holdings (NZ) Limited
For
per
sona
l use
onl
y

110 Downer EDI Limited
Notes to the consolidated financial statements – continuedfor the year ended 30 June 2019
F4. Controlled entities – continued
Spotless(v) – continued
Spotless Investment Holdings Pty Ltd(vi) Spotless Management Services Pty Ltd(vi)
Spotless Property Cleaning Services Pty Ltd(vi)
Spotless Securities Plan Pty Ltd(vi)
Spotless Services Australia Limited(vi) Spotless Services International Pty Ltd(vi) Spotless Services Limited(vi) Spotless Treasury Pty Limited(vi)
SSL Asset Services (Management) Pty Ltd(vi) SSL Facilities Management Real Estate Services Pty Ltd(vi) SSL Security Services Pty Ltd(vi) Taylors Two Seven Pty Ltd(vi) Trenchless Group Pty Ltd(vi) UAM Pty Ltd(vi) Utility Services Group Holdings Pty Ltd(vi) Utility Services Group Limited(vi)
(i) 70% ownership interest.(ii) 74% ownership interest.(iii) Entity acquired during the financial year ended 30 June 2019.(iv) Entity dissolved / de-registered / liquidated during the financial year ended
30 June 2019.(v) The ownership interest in Spotless is 87.8% as at 30 June 2019.(vi) These Spotless controlled entities all form part of the tax-consolidated group
of which Spotless Group Holdings Limited is the head entity.(vii) Entity is currently undergoing liquidation / dissolution.(viii) Downer New Zealand Projects 3 Limited changed its name to The Roading
Company Limited during the financial year ended 30 June 2019.
F5. Related party information
a) Transactions with controlled entities
Aggregate amounts receivable from and payable to controlled entities are included within total assets and liabilities balances as disclosed in Note F6. Amounts contributed to the defined contribution plan are disclosed in Note D1.
Other transactions which occurred during the financial year between the parent entity and controlled entities, as well as between entities in the Group, were on normal arm’s length commercial terms.
b) Equity interests in related parties
Equity interests in subsidiaries
Details of the percentage of ordinary shares held in controlled entities are disclosed in Note F4.
Equity interests in joint arrangements and associate entities
Details of interests in joint arrangements and associate entities are disclosed in Note F1. The business activities of a number of these entities are conducted under joint venture arrangements. Associated entities conduct business transactions with various controlled entities. Such transactions include purchases and sales, dividends and interest. All such transactions are conducted on the basis of normal arm’s length commercial terms.
c) Controlling entity
The parent entity of the Group is Downer EDI Limited.
F6. Parent entity disclosures
a) Financial position
Company
2019$’m
2018$’m
Assets
Current assets 58.3 130.1
Non-current assets 2,427.8 2,340.6
Total assets 2,486.1 2,470.7
Liabilities
Current liabilities 40.2 39.4
Non-current liabilities 61.2 15.3
Total liabilities 101.4 54.7
Net assets 2,384.7 2,416.0
Equity
Issued capital 2,246.5 2,243.3
Retained earnings 122.4 157.2
Reserves
Employee benefits reserve 15.8 15.5
Total equity 2,384.7 2,416.0
b) Financial performance
Profit for the year 131.8 185.5
Total comprehensive income 131.8 185.5
c) Guarantees entered into by the parent entity in relation to debts of its subsidiaries
The parent entity has, in the normal course of business, entered into guarantees in relation to the debts of its subsidiaries during the financial year.
d) Contingent liabilities of the parent entity
The parent entity has no contingent liabilities as at 30 June 2019 (2018: nil) other than those disclosed in Note C9.
The parent entity does not have any commitments for acquisition of property, plant and equipment as at 30 June 2019 (2018: nil).
For
per
sona
l use
onl
y

Annual Report 2019 111
GOther
This section provides details on other required disclosures relating to the Group to comply with the accounting standards and other pronouncements including the Group’s capital and financial risk management disclosure. This disclosure provides information around the Group’s risk management policies and how Downer uses derivatives to hedge the underlying exposure to changes in interest rates and to foreign exchange rate fluctuations.
G1. New accounting standards
G2. Capital and financial risk management
G3. Other financial assets and liabilities
G1. New accounting standards
a) New and amended accounting standards adopted by the Group
Changes in significant accounting policies
Except as described below, the accounting policies applied in the financial report are the same as those applied in the Group’s consolidated Annual Report for the year ended 30 June 2018.
AASB 9: Financial Instruments
AASB 9 Financial Instruments replaces AASB 139 Financial Instruments: Recognition and Measurement for annual periods beginning on or after 1 January 2018, bringing together all three aspects of the accounting for financial instruments: classification and measurement; impairment; and hedge accounting. The Group has adopted AASB 9 from 1 July 2018 and has applied the exemption in relation to full retrospective application of AASB 9 and as a result, the Group comparative information has not been restated to reflect the requirements of the new standard.
AASB 9 contains a new classification and measurement approach for financial assets that reflects the business model in which assets are managed and their cash flow characteristics. AASB 9 contains three principal classification categories for financial assets: measured at amortised cost, fair value through other comprehensive income (FVOCI) and fair value through profit or loss (FVTPL). The standard eliminates the previous AASB 139 categories of held to maturity, loans and receivables and available for sale; while the requirements for the classification of financial liabilities as per AASB 139 was retained, resulting in no change in classification or measurement of financial liabilities on adoption of AASB 9.
As available for sale classification is no longer permitted under AASB 9, on transition, the Group has designated the unquoted equity investment (previously classified as an available-for-sale investment carried at fair value under AASB 139) as an investment measured at Fair Value through Other Comprehensive Income (FVOCI) with no material impact on
the carrying amount. Following this reclassification, all fair value gains and losses will be reported in the OCI with no impairment losses nor gains or losses (when the investment is derecognised) to be recognised in the statement of profit or loss.
As the loans and receivables classification is no longer permitted, trade and other receivables and cash and cash equivalents have been reclassified to the category of measured at amortised cost. There has been no material impact on the carrying amount of these balances resulting from either this change in classification or the new expected credit loss impairment model for financial assets carried at amortised cost and contract assets.
There were no further changes to the classification or measurement of financial assets or financial liabilities.
The classification and measurement requirements of AASB 9 did not have a material impact on the opening retained earnings position of the Group and therefore, no adjustment to opening retained earnings at 1 July 2018 is required.
AASB 15: Revenue from Contracts with Customers
The Group has adopted AASB 15 Revenue from Contracts with Customers from 1 July 2018. Details of the new requirements of AASB 15 as well as their impact on the Group’s consolidated financial report are described below.
AASB 15 establishes a comprehensive framework for determining whether, how much and when revenue is recognised. It has replaced AASB 118 Revenue, AASB 111 Construction Contracts and related interpretations. The core principle of AASB 15 is that an entity shall recognise revenue to depict the transfer of promised goods and services to customers in an amount that reflects the consideration to which the entity expects to be entitled in exchange for those goods or services. This means that revenue will be recognised when control of goods or services is transferred rather than on transfer of risks and rewards.
For
per
sona
l use
onl
y

112 Downer EDI Limited
Notes to the consolidated financial statements – continuedfor the year ended 30 June 2019
G1. New accounting standards – continued
a) New and amended accounting standards adopted by the Group – continued
AASB 15: Revenue from Contracts with Customers – continued
Impact on Application
The Group has adopted AASB 15 using the cumulative effect method, with the effect of initially applying this standard recognised at the date of initial application (i.e. 1 July 2018). Accordingly, the information presented for the year ended 30 June 2018 has not been restated and it is presented, as previously reported, under AASB 118, AASB 111 and related interpretations. Additionally, the disclosure requirements in AASB 15 have not generally been applied to comparative information.
The following table summarises the Group impact (net of tax) of transition to AASB 15 recognised on retained earnings and Non-controlling interest (NCI) on 1 July 2018. The table below only shows the balance sheet items impacted by the adoption of AASB 15.
Impact on the opening balance of the consolidated statement of financial position
As reported30 June 2018
$’m
AASB 15 Transition
Adjustments$’m
Opening Balance
1 July 2018$’m
Trade receivables and contract assets 2,117.9 (232.2) 1,885.7
Total current assets 3,133.6 (232.2) 2,901.4
Trade receivables and contract assets 113.2 (49.4) 63.8
Deferred tax assets 75.5 25.6 101.1
Total non-current assets 4,654.6 (23.8) 4,630.8
Total assets 7,788.2 (256.0) 7,532.2
Provisions (50.7) (34.8) (85.5)
Total current liabilities (2,881.6) (34.8) (2,916.4)
Provisions (65.1) (50.4) (115.5)
Deferred tax liabilities (170.2) 83.2 (87.0)
Total non-current liabilities (1,701.5) 32.8 (1,668.7)
Total liabilities (4,583.1) (2.0) (4,585.1)
Net assets 3,205.1 (258.0) 2,947.1
Retained earnings 655.1 (245.3) 409.8
Parent interests 3,050.1 (245.3) 2,804.8Non-controlling interest 155.0 (12.7) 142.3
Total equity 3,205.1 (258.0) 2,947.1
Below is a summary of the impact on transition to AASB 15 on the Group’s retained earnings and NCI:
Impact on transition
(net of tax)$’m
Contract claims and variations – now referred to as contract modifications 204.8 Contract costs (Tender Costs) 23.9 Performance Obligations and contract duration 26.8 Measure of Progress 2.5 Total 258.0
For
per
sona
l use
onl
y

Annual Report 2019 113
G1. New accounting standards – continued
a) New and amended accounting standards adopted by the Group – continued
AASB 15: Revenue from Contracts with Customers – continued
On adoption, the key impacts on transition were as a result of the following changes:
Contract modifications
Revenue was previously recognised when it was probable that work performed will result in revenue whereas under AASB 15, revenue is recognised when contract modifications are enforceable and to the extent that it is “highly probable” that a significant reversal of revenue will not occur.
In making this assessment, the Group considers a number of factors including nature of the claim, formal or informal acceptance by the customer of the validity of the claim, stage of negotiations, legal opinion on the enforceability of the claim under the contract, or the historical outcome of similar claims, to determine whether the enforceable and “highly probable” threshold has been met.
As a result of the change to a higher threshold of approval for claims or variations and the “highly probable” threshold for the estimation of the amount to be recognised as revenue, a $204.8 million after tax impact on transition was recognised in retained earnings as at 1 July 2018.
Contract costs
Under AASB 111 Construction Contracts, costs incurred during the tender process were capitalised within contract debtors when it was deemed probable the contract will be won. Under the new standard, costs incurred during the tender/bid process will be expensed, unless they are incremental to obtaining the contract and the Group expects to recover them or they are explicitly chargeable to the customer, regardless of whether
the contract is obtained. As a result a $23.9 million after tax impact on transition was recognised in retained earnings as at 1 July 2018.
Performance obligations and contract duration
AASB 15 requires a more granular approach to identify the different revenue streams (i.e. performance obligations) in a contract by identifying the different activities that are being undertaken and then aggregating only those where the different activities are significantly integrated or highly interdependent. As a result of the change, additional performance obligations were identified for some contracts with later revenue recognition which resulted in an adjustment of $26.8 million after tax to retained earnings as at 1 July 2018.
Measure of progress
The Group recognises revenue using the measure of progress that best reflects the Group’s performance in satisfying the performance obligation within the contracts over time. The different methods of measuring progress include an input method (e.g. costs incurred) or an output method (e.g. milestones reached).
On adoption of AASB 15, it was identified that for Rail maintenance contracts, the input method would better reflect the measure of progress rather than the billing method previously used. As a result, a $2.5 million after tax impact on transition was recognised in retained earnings as at 1 July 2018.
Tax
Adjustments under the new standards are subject to tax effect accounting and therefore the net deferred tax position has been impacted.
For
per
sona
l use
onl
y

114 Downer EDI Limited
Notes to the consolidated financial statements – continuedfor the year ended 30 June 2019
G1. New accounting standards – continued
a) New and amended accounting standards adopted by the Group – continued
AASB 15: Revenue from Contracts with Customers – continued
Impact on the consolidated statement of profit or loss
The following tables summarise the impact of adoption of AASB 15 on the Group’s Consolidated Statement of Financial Position and Consolidated Statement of Profit or Loss and Other Comprehensive Income for the current period in comparison to the results that would have been reported if AASB 15 had not been applied.
30 June 2019As reported
$’mAdjustments
$’m
Amounts without
adoption of AASB 15
$’m
Trade receivables and contract assets 1,991.5 225.2 2,216.7
Total current assets 3,164.7 225.2 3,389.9
Trade receivables and contract assets 74.4 89.6 164.0 Deferred tax assets 93.5 (13.5) 80.0
Total non-current assets 4,843.3 76.1 4,919.4
Total assets 8,008.0 301.3 8,309.3
Provisions (107.0) 16.7 (90.3)
Total current liabilities (2,930.4) 16.7 (2,913.7)
Provisions (84.5) 28.3 (56.2)Deferred tax liabilities (137.6) (93.5) (231.1)
Total non-current liabilities (2,027.4) (65.2) (2,092.6)
Total liabilities (4,957.8) (48.5) (5,006.3)
Net assets 3,050.2 252.8 3,303.0
Retained earnings 496.7 240.1 736.8
Parent interests 2,894.3 240.1 3,134.4
Non-controlling interest 155.9 12.7 168.6
Total equity 3,050.2 252.8 3,303.0
For the year ended 30 June 2019As reported
$’mAdjustments
$’m
Amounts without
adoption of AASB 15
$’m
Earnings before interest and tax 462.2 (7.0) 455.2
Net finance costs (82.4) – (82.4)
Profit before income tax 379.8 (7.0) 372.8
Income tax expense (103.5) 1.8 (101.7)
Profit after income tax 276.3 (5.2) 271.1
Profit for the year that is attributable to:
Non-controlling interest 14.5 – 14.5
Members of the parent entity 261.8 (5.2) 256.6
Profit for the year 276.3 (5.2) 271.1
There has been no material impact on other comprehensive income and consolidated statement of cash flow on transition to AASB 15.
For
per
sona
l use
onl
y
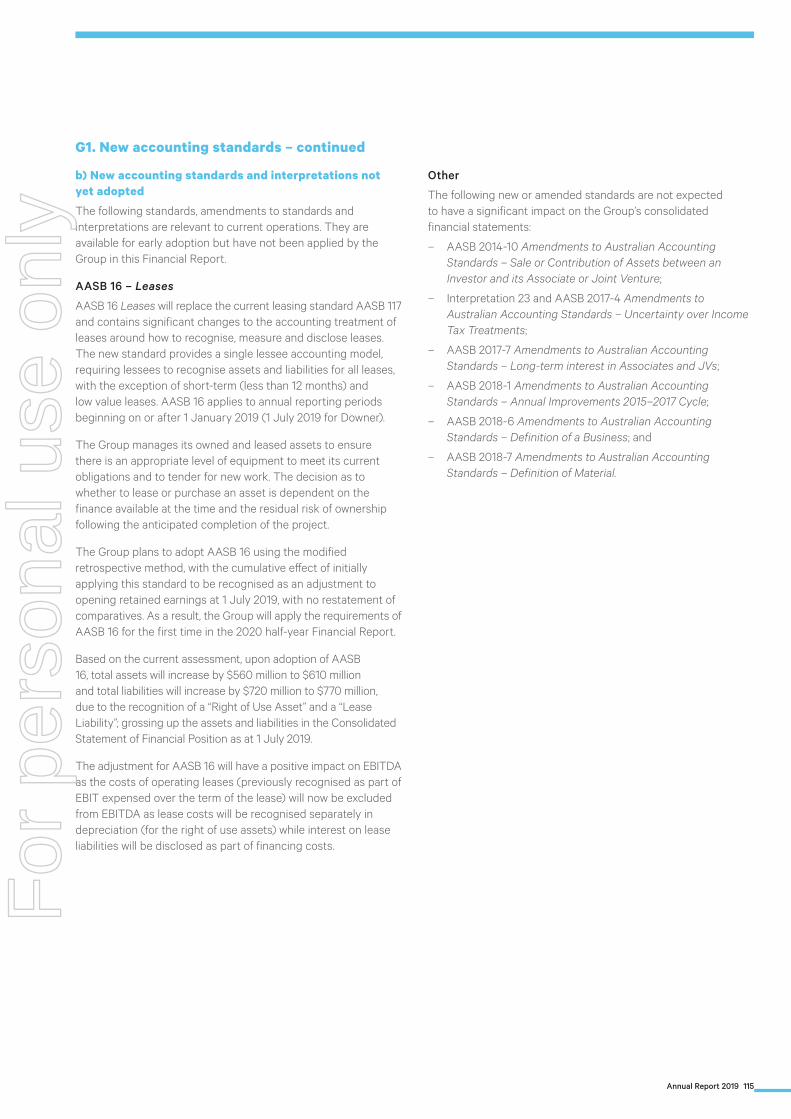
Annual Report 2019 115
G1. New accounting standards – continued
b) New accounting standards and interpretations not yet adopted
The following standards, amendments to standards and interpretations are relevant to current operations. They are available for early adoption but have not been applied by the Group in this Financial Report.
AASB 16 – Leases
AASB 16 Leases will replace the current leasing standard AASB 117 and contains significant changes to the accounting treatment of leases around how to recognise, measure and disclose leases. The new standard provides a single lessee accounting model, requiring lessees to recognise assets and liabilities for all leases, with the exception of short-term (less than 12 months) and low value leases. AASB 16 applies to annual reporting periods beginning on or after 1 January 2019 (1 July 2019 for Downer).
The Group manages its owned and leased assets to ensure there is an appropriate level of equipment to meet its current obligations and to tender for new work. The decision as to whether to lease or purchase an asset is dependent on the finance available at the time and the residual risk of ownership following the anticipated completion of the project.
The Group plans to adopt AASB 16 using the modified retrospective method, with the cumulative effect of initially applying this standard to be recognised as an adjustment to opening retained earnings at 1 July 2019, with no restatement of comparatives. As a result, the Group will apply the requirements of AASB 16 for the first time in the 2020 half-year Financial Report.
Based on the current assessment, upon adoption of AASB 16, total assets will increase by $560 million to $610 million and total liabilities will increase by $720 million to $770 million, due to the recognition of a “Right of Use Asset” and a “Lease Liability”; grossing up the assets and liabilities in the Consolidated Statement of Financial Position as at 1 July 2019.
The adjustment for AASB 16 will have a positive impact on EBITDA as the costs of operating leases (previously recognised as part of EBIT expensed over the term of the lease) will now be excluded from EBITDA as lease costs will be recognised separately in depreciation (for the right of use assets) while interest on lease liabilities will be disclosed as part of financing costs.
Other
The following new or amended standards are not expected to have a significant impact on the Group’s consolidated financial statements:
– AASB 2014-10 Amendments to Australian Accounting Standards – Sale or Contribution of Assets between an Investor and its Associate or Joint Venture;
– Interpretation 23 and AASB 2017-4 Amendments to Australian Accounting Standards – Uncertainty over Income Tax Treatments;
– AASB 2017-7 Amendments to Australian Accounting Standards – Long-term interest in Associates and JVs;
– AASB 2018-1 Amendments to Australian Accounting Standards – Annual Improvements 2015–2017 Cycle;
– AASB 2018-6 Amendments to Australian Accounting Standards – Definition of a Business; and
– AASB 2018-7 Amendments to Australian Accounting Standards – Definition of Material.
For
per
sona
l use
onl
y

116 Downer EDI Limited
Notes to the consolidated financial statements – continuedfor the year ended 30 June 2019
G2. Capital and financial risk management
a) Capital risk management
The capital structure of the Group consists of debt and equity. The Group may vary its capital structure by adjusting the amount of dividends, returning capital to shareholders, issuing new shares or increasing or reducing debt.
The Group’s objectives when managing capital are to safeguard its ability to operate as a going concern so that it can meet all its financial obligations when they fall due, provide adequate returns to shareholders, maintain an appropriate capital structure to optimise its cost of capital and maintain an Investment Grade credit rating to ensure ongoing access to funding.
b) Financial risk management objectives
The Group’s Treasury function manages the funding, liquidity and financial risks of the Group. These risks include foreign exchange, interest rate, commodity and financial counterparty credit risk.
The Group enters into a variety of derivative financial instruments to manage its exposures including:
i) Forward foreign exchange contracts to hedge the exchange rate risk arising from cross-border trade flows, foreign income and debt service obligations;
ii) Cross-currency interest rate swaps to manage the interest rate and currency risk associated with foreign currency denominated borrowings; and
iii) Interest rate swaps to manage interest rate risk.
The Group does not enter into or trade derivative financial instruments for speculative purposes.
Financial assets and liabilities are offset and the net amount reported in the Consolidated Statement of Financial Position, when there is a legally enforceable right to offset the recognised amounts and there is an intention to settle on a net basis or realise the asset and settle the liability simultaneously. No material amounts with a right to offset were identified in the Consolidated Statement of Financial Position.
c) Foreign currency risk management
The Group undertakes certain transactions denominated in foreign currencies. As a result, exposures to exchange rate fluctuations arise. Exchange rate exposures are managed within approved policy parameters, utilising forward foreign exchange contracts and cross-currency swaps.
The carrying amounts of the Group’s material unhedged foreign currency denominated financial assets and financial liabilities at the reporting date are as follows:
Financial assets(i) Financial liabilities(i)
2019$’m
2018$’m
2019$’m
2018$’m
US dollar (USD) 10.1 1.4 5.5 6.3
(i) The above table shows foreign currency financial assets and liabilities in Australian dollar equivalent.
For
per
sona
l use
onl
y

Annual Report 2019 117
G2. Capital and financial risk management – continued
c) Foreign currency risk management – continued
Foreign currency forward contracts
The following table summarises, by currency, the Australian dollar value (unless otherwise stated) of forward exchange contracts outstanding as at the reporting date:
Outstanding contracts
Weighted average exchange rate Foreign currency Contract value Fair value
2019 20182019FC’m
2018FC’m
2019$’m
2018$’m
2019$’m
2018$’m
Buy USD/Sell AUDLess than 3 months 0.6955 0.7540 5.2 20.0 7.5 26.6 (0.1) 0.8 3 to 6 months 0.7142 – 1.3 – 1.8 – – – Later than 6 months 0.7101 0.7534 0.9 66.9 1.3 88.8 – 1.5
7.4 86.9 10.6 115.4 (0.1) 2.3
Buy AUD/Sell USDLess than 3 months 0.6985 0.7617 12.1 5.8 17.3 7.6 0.1 (0.2)3 to 6 months 0.7073 – 0.8 – 1.1 – – – Later than 6 months 0.7194 0.7613 37.1 7.0 51.6 9.2 (0.9) (0.3)
50.0 12.8 70.0 16.8 (0.8) (0.5)
Buy EUR/Sell AUDLess than 3 months 0.6210 0.6366 0.3 8.6 0.5 13.5 – 0.1 3 to 6 months 0.6147 – 3.0 – 4.9 – – – Later than 6 months 0.6188 0.6167 3.4 5.4 5.5 8.8 0.1 (0.1)
6.7 14.0 10.9 22.3 0.1 -
Buy JPY/Sell AUDLess than 3 months 77.68 80.86 1,648.3 2,190.6 21.2 27.1 0.6 – 3 to 6 months 77.88 81.68 255.9 567.6 3.3 6.9 0.1 0.1 Later than 6 months 76.95 82.75 215.2 25.9 2.8 0.3 0.1 –
2,119.4 2,784.1 27.3 34.3 0.8 0.1
Sell JPY/Buy AUDLess than 3 months 76.40 81.67 289.5 205.7 3.8 2.5 – –
Buy NZD/sell AUDLess than 3 months 1.0493 – 18.0 – 17.2 – 0.1 –
Buy GBP/Sell AUDLess than 3 months 0.5532 0.5700 1.2 0.1 2.2 0.2 – –
Buy CNY/Sell AUDLess than 3 months 4.9383 5.3302 6.0 3.0 1.2 0.6 – – 3 to 6 months – 5.3535 – 3.0 – 0.6 – 0.1
6.0 6.0 1.2 1.2 – 0.1
Buy AUD/Sell NZDLess than 3 months – 1.0812 – 5.3 – 4.9 – 0.1 3 to 6 months – 1.0814 – 11.8 – 10.9 – 0.1 Later than 6 months – 1.0819 – 26.9 – 24.9 – 0.3
– 44.0 – 40.7 – 0.5
Buy CAD/Sell AUDLess than 3 months – 1.0181 – 24.2 – 24.6 – 0.3
Sell CAD/Buy AUDLess than 3 months – 1.0053 – 25.3 – 25.4 – (0.6)
Total 0.1 2.2
For
per
sona
l use
onl
y

118 Downer EDI Limited
Notes to the consolidated financial statements – continuedfor the year ended 30 June 2019
G2. Capital and financial risk management – continued
c) Foreign currency risk management – continued
Cross-currency interest rate swaps
Under cross-currency interest rate swaps, the Group is committed to exchange certain foreign currency loan principal and interest amounts at agreed future dates at fixed foreign exchange and interest rates. Such contracts enable the Group to eliminate the risk of adverse movements in foreign exchange and interest rates related to foreign currency denominated borrowings.
The following table details the Australian dollar equivalent of cross-currency interest rate swaps outstanding as at the reporting date:
Outstanding contracts
Weighted average AUD equivalent
interest rate (including credit
margin)Weighted average
exchange rate Contract value Fair value
2019%
2018% 2019 2018
2019$’m
2018$’m
2019$’m
2018$’m
Buy USD/Sell AUD
Less than 1 year 7.8 – 0.7168 – 9.8 – 0.2 –
1 to 5 years – 7.8 – 0.7168 – 9.8 – (0.5)
5 years or more 5.9 5.9 0.7739 0.7739 129.2 129.2 2.5 (5.4)
139.0 139.0 2.7 (5.9)
Buy JPY/Sell AUD
5 years or more 5.2 5.2 83.12 83.12 120.3 120.3 (6.3) (6.9)
The above cross-currency interest rate swaps are designated as effective cash flow hedges.
Foreign currency sensitivity analysis
The Group is mainly exposed to the United States dollar (USD), Euro (EUR), Japanese Yen (JPY) and New Zealand dollar (NZD).
The following table details the Group’s sensitivity to movements in the Australian dollar against relevant foreign currencies. The percentages disclosed below represent the Group’s assessment of the possible changes in spot foreign exchange rates (i.e. forward exchange points and discount factors have been kept constant). The sensitivity analysis includes only outstanding foreign currency denominated monetary items and adjusts their translation at the period end for a given percentage change in foreign exchange rates.
A positive number indicates a before-tax increase in profit and equity and a negative number indicates a before-tax decrease in profit and equity.
Profit / (loss)(i) Equity(ii)
2019$’m
2018$’m
2019$’m
2018$’m
USD impact– 15% rate change 0.8 (0.9) (10.4) 16.7 + 15% rate change (0.6) 0.6 7.7 (12.4)
EUR impact
– 15% rate change – – (1.6) (3.3)+ 15% rate change – – 1.6 3.3
JPY impact– 15% rate change – – 4.3 5.7 + 15% rate change – – (3.2) (4.2)
NZD impact– 15% rate change – (7.6) 3.0 – + 15% rate change – 5.6 (2.2) –
(i) This is mainly as a result of the changes in the value of forward foreign exchange contracts not designated in a hedge relationship, receivables and payables.(ii) This is as a result of the changes in the value of forward foreign exchange contracts designated as cash flow hedges.
For
per
sona
l use
onl
y

Annual Report 2019 119
G2. Capital and financial risk management – continued
d) Interest rate risk management
The Group is exposed to interest rate risk as entities borrow funds at floating interest rates. Management of this risk is governed by a Board approved Treasury Policy and is managed by maintaining an appropriate mix between fixed and floating rate borrowings and hedging is undertaken through interest rate swap contracts and the issue of long-term fixed rate debt securities.
The Group’s exposure to interest rates on financial assets and financial liabilities is detailed in the table below:
Weighted average AUD equivalent interest rate
(including credit margin) Liability / (asset)
2019%
2018%
2019$’m
2018$’m
Floating interest rates – cash flow exposureBank loans 2.8 3.4 288.0 202.1 Cash and cash equivalents 1.1 1.5 (710.7) (606.2)Total cash flow exposure (422.7) (404.1)
Fixed interest rates – fair value exposureBank loans(i) 3.6 3.6 556.4 617.7 USD private placement notes(i) 6.0 6.0 149.9 150.6 AUD private placement notes 5.8 5.8 30.0 30.0 Medium term notes(i) 4.3 5.0 688.7 529.1 Finance lease and hire purchase 5.5 4.1 10.2 16.5 Total fair value exposure 1,435.2 1,343.9
(i) The values of the interest rate and cross-currency swaps have been included in the debt amounts.
All interest rates in the above table reflect rates in the currency of the relevant loan other than USD private placement notes and JPY medium term notes, where the AUD rates under the relevant cross-currency swaps are used.
The table above relates to amounts that are drawn. The Group has a number of undrawn facilities, which if utilised would be on a floating rate basis.
Interest rate swap contracts
The Group uses interest rate swap contracts to manage interest rate exposures. Under these contracts, the Group commits to exchange the difference between fixed and floating rate interest amounts calculated on notional principal amounts. The fair value of interest rate swaps are based on market values of equivalent instruments at the reporting date.
The following table details the interest rate swap contracts and related notional principal amounts as at the reporting date:
Outstanding floating to fixed swap contracts
Weighted average interest rate Notional principal amount Fair value
2019%
2018%
2019$’m
2018$’m
2019$’m
2018$’m
AUD interest rate swapsLess than 1 year 2.1 – 450.0 – (2.4) – 1 to 2 years 1.2 2.1 150.0 450.0 (0.2) (0.2)2 to 3 years 1.2 – 270.0 – (0.9) – 3 years or more 1.3 – 135.0 – (0.7) –
1,005.0 450.0 (4.2) (0.2)
NZD interest rate swapsLess than 1 year 2.2 – 100.0 – (0.3) – 2 to 3 years 1.5 2.2 100.0 100.0 (0.3) (0.2)
200.0 100.0 (0.6) (0.2)
For
per
sona
l use
onl
y

120 Downer EDI Limited
Notes to the consolidated financial statements – continuedfor the year ended 30 June 2019
G2. Capital and financial risk management – continued
d) Interest rate risk management – continued
Interest rate sensitivity analysis
The sensitivity analysis has been determined based on the exposure to interest rates at the reporting date and assuming that the rate change occurs at the beginning of the financial year and is then held constant throughout the reporting period.
Sensitivities have been based on a movement in interest rates of 100 basis points across the yield curve of the relevant currencies. The selected basis point increase or decrease represents the Group’s assessment of the possible change in interest rates on variable rate instruments, cross-currency interest rate swaps and interest rate swaps. An increase in interest rates of 100 basis points on the unhedged position (mostly cash and cash equivalents) will generate a profit of $4.6 million (2018: $2.3 million loss) to the profit or loss; a similar decrease in interest rates will generate a $4.6 million (2018: $2.5 million profit) loss to the profit or loss.
For hedged positions designated as cash flow hedges, an increase and decrease in interest rates of 100 basis points will generate an increase and decrease in equity of $10.7 million (2018: $4.8 million) and $10.4 million (2018: $3.7 million) respectively.
e) Credit risk management
Credit risk refers to the risk that a financial counterparty will default on its contractual obligations, resulting in a loss to the Group. The Group’s exposure and the credit ratings of these counterparties are regularly monitored and transactions are diversified among approved counterparties.
Trade receivables and contract assets arise from a large number of customers, spread across diverse industries and geographical areas. Ongoing credit evaluation is performed on the financial condition of counterparties. Refer to Note C2 for details on credit risk arising from trade receivables and contract assets.
The preferred credit risk on derivative financial instruments is to counterparties that have minimum long-term credit ratings from Standard & Poor’s of no less than A- (or equivalent from other rating agencies).
Credit risk arising from cash balances held with banks is managed by Group Treasury. Investments of surplus funds are generally only made with counterparties that have a minimum A- credit rating. In limited circumstances, amounts of surplus funds are held in foreign jurisdictions where there are no financial institutions that meet the above minimum rating threshold.
Financial counterparty credit limits and the related credit acceptability of counterparties are set by a Board approved Treasury Policy that is reviewed by the Board from time to time. The limits are set to minimise the concentration of risks and therefore mitigate financial loss through potential counterparty default. No material exposure is considered to exist by virtue of the non-performance of any financial counterparty.
The carrying amount of financial assets recorded in the financial statements, net of any allowances for losses, represents the Group’s maximum exposure to credit risk.
f) Liquidity risk management
Liquidity risk arises from the possibility that the Group is unable to settle a financial transaction on the due date. Liquidity risk management is ultimately a Board responsibility and is managed within an appropriate risk management framework under the Group’s Treasury policy.
The Group manages liquidity risk by maintaining adequate cash reserves and committed undrawn debt facilities, monitoring forecast and actual cash flows and matching the maturity profiles of financial assets and liabilities. Included in Note E2 is a summary of committed undrawn bank loan facilities.
For
per
sona
l use
onl
y

Annual Report 2019 121
G2. Capital and financial risk management – continued
f) Liquidity risk management – continued
Liquidity risk tables
The following tables detail the contractual maturity of the Group’s financial liabilities. The tables are based on the undiscounted cash flows of financial liabilities and include both interest and principal cash flows.
2019$’m
Less than1 year
1 to 2years
2 to 3years
3 to 4years
4 to 5years
Morethan 5years
Trade payables 810.6 – – – – –
Finance lease and hire purchase liabilities 3.2 6.9 0.4 0.1 – –
Bank loans 18.4 540.1 315.4 – – –
USD notes 16.8 6.5 6.5 6.5 6.5 152.3
AUD notes 1.7 1.7 1.7 1.7 1.7 32.6
Medium term notes 23.8 23.8 273.8 12.6 12.6 467.6
Total borrowings including interest 60.7 572.1 597.4 20.8 20.8 652.5
Cross-currency interest rate swaps 5.7 5.9 5.9 5.9 5.9 19.4
Interest rate swaps 3.5 1.4 0.4 – – –
Foreign currency forward contracts (0.6) 0.5 – – – –
Total derivative instruments(i) 8.6 7.8 6.3 5.9 5.9 19.4
Total 883.1 586.8 604.1 26.8 26.7 671.9
2018Trade payables 674.2 – – – – –
Finance lease and hire purchase liabilities 6.1 3.9 2.2 5.5 – –
Bank loans 27.0 75.7 494.5 312.6 – –
USD notes 8.5 17.7 7.9 7.9 7.9 185.1
AUD notes 1.7 1.7 1.7 1.7 1.7 34.4
Medium term notes 166.9 12.6 12.6 262.6 1.4 135.5
Total borrowings including interest 204.1 107.7 516.7 584.8 11.0 355.0
Cross currency interest rate swaps 6.5 6.7 6.4 6.3 6.3 44.8
Interest rate swaps 0.3 0.1 – – – –
Foreign currency forward contracts 2.2 0.1 – – – –
Total derivative instruments(i) 9.0 6.9 6.4 6.3 6.3 44.8
Total 893.4 118.5 525.3 596.6 17.3 399.8
(i) Includes assets and liabilities.For
per
sona
l use
onl
y
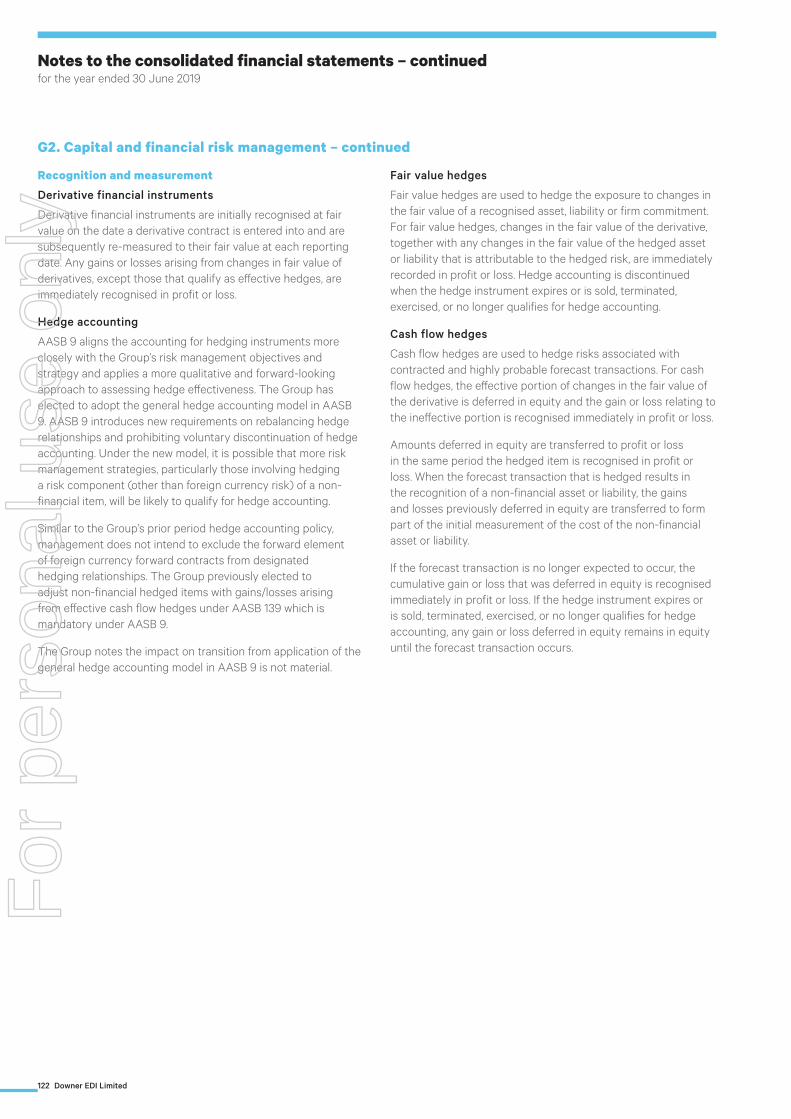
122 Downer EDI Limited
Notes to the consolidated financial statements – continuedfor the year ended 30 June 2019
G2. Capital and financial risk management – continued
Recognition and measurement
Derivative financial instruments
Derivative financial instruments are initially recognised at fair value on the date a derivative contract is entered into and are subsequently re-measured to their fair value at each reporting date. Any gains or losses arising from changes in fair value of derivatives, except those that qualify as effective hedges, are immediately recognised in profit or loss.
Hedge accounting
AASB 9 aligns the accounting for hedging instruments more closely with the Group’s risk management objectives and strategy and applies a more qualitative and forward-looking approach to assessing hedge effectiveness. The Group has elected to adopt the general hedge accounting model in AASB 9. AASB 9 introduces new requirements on rebalancing hedge relationships and prohibiting voluntary discontinuation of hedge accounting. Under the new model, it is possible that more risk management strategies, particularly those involving hedging a risk component (other than foreign currency risk) of a non-financial item, will be likely to qualify for hedge accounting.
Similar to the Group’s prior period hedge accounting policy, management does not intend to exclude the forward element of foreign currency forward contracts from designated hedging relationships. The Group previously elected to adjust non-financial hedged items with gains/losses arising from effective cash flow hedges under AASB 139 which is mandatory under AASB 9.
The Group notes the impact on transition from application of the general hedge accounting model in AASB 9 is not material.
Fair value hedges
Fair value hedges are used to hedge the exposure to changes in the fair value of a recognised asset, liability or firm commitment. For fair value hedges, changes in the fair value of the derivative, together with any changes in the fair value of the hedged asset or liability that is attributable to the hedged risk, are immediately recorded in profit or loss. Hedge accounting is discontinued when the hedge instrument expires or is sold, terminated, exercised, or no longer qualifies for hedge accounting.
Cash flow hedges
Cash flow hedges are used to hedge risks associated with contracted and highly probable forecast transactions. For cash flow hedges, the effective portion of changes in the fair value of the derivative is deferred in equity and the gain or loss relating to the ineffective portion is recognised immediately in profit or loss.
Amounts deferred in equity are transferred to profit or loss in the same period the hedged item is recognised in profit or loss. When the forecast transaction that is hedged results in the recognition of a non-financial asset or liability, the gains and losses previously deferred in equity are transferred to form part of the initial measurement of the cost of the non-financial asset or liability.
If the forecast transaction is no longer expected to occur, the cumulative gain or loss that was deferred in equity is recognised immediately in profit or loss. If the hedge instrument expires or is sold, terminated, exercised, or no longer qualifies for hedge accounting, any gain or loss deferred in equity remains in equity until the forecast transaction occurs.
For
per
sona
l use
onl
y

Annual Report 2019 123
G3. Other financial assets and liabilities
2019$’m
Financial assets Financial liabilities
Current Non-current Current Non-current
At amortised cost:
Other financial assets 23.7 – – –
Advances to / from joint ventures and associates 9.8 – 13.1 –
Deferred consideration – – 22.1 15.3
33.5 – 35.2 15.3
At fair value:Level 2
Foreign currency forward contracts – Cash flow hedge 1.3 – 1.0 0.2
Cross-currency and interest rate swaps – Cash flow hedge 0.2 3.2 8.0 3.8
1.5 3.2 9.0 4.0
Level 3
Unquoted equity investments – Fair value through OCI – 2.0 – –
Contingent consideration – – 3.2 0.7
– 2.0 3.2 0.7
Total 35.0 5.2 47.4 20.0
2018$’m
Financial assets Financial liabilities
Current Non-current Current Non-current
At amortised cost:Other financial assets 10.0 13.5 – –
Advances to / from joint ventures and associates 5.1 – 11.3 –
Deferred consideration – – 8.0 13.3
15.1 13.5 19.3 13.3
At fair value:Level 2Foreign currency forward contracts – Cash flow hedge 3.0 – 1.2 –
Foreign currency forward contracts – Fair value through profit or loss 0.5 – 0.1 –
Cross-currency and interest rate swaps – Cash flow hedge – – 6.1 7.1
3.5 – 7.4 7.1
Level 3Unquoted equity investments – Available-for-sale – 2.0 – –
Contingent consideration – – 16.5 13.8
– 2.0 16.5 13.8
Total 18.6 15.5 43.2 34.2
Reconciliation of Level 3 fair value measurements of financial assets
Level 3 investments remained unchanged from prior year (2018: $1.7 million decrease mostly due to revaluation and return on investment).
For
per
sona
l use
onl
y

124 Downer EDI Limited
Notes to the consolidated financial statements – continuedfor the year ended 30 June 2019
G3. Other financial assets and liabilities – continued
Recognition and measurement
Fair value measurement
When a derivative is designated as the cash flow hedging instrument, the effective portion of changes in the fair value of the derivative is recognised in Other Comprehensive Income and accumulated in the hedging reserve. Any ineffective portion of changes in the fair value of the derivative is recognised immediately in profit or loss.
Valuation of financial instruments
For financial instruments measured and carried at fair value, the Group uses the following to categorise the methods used:
– Level 1: fair value is calculated using quoted prices in active markets for identical assets or liabilities;
– Level 2: fair value is estimated using inputs other than quoted prices included within Level 1 that are observable for the asset or liability, either directly (as prices) or indirectly (derived from prices); and
– Level 3: fair value is estimated using inputs for the asset or liability that are not based on observable market data.
During the year there were no transfers between Level 1, Level 2 and Level 3 fair value hierarchies.
The following table shows the valuation technique used in measuring Level 2 and 3 fair values, as well as significant unobservable inputs used:
Type Valuation technique Significant unobservable input
Cross-currency and interest rate swaps Calculated using the present value of the estimated future cash flows based on observable yield curves.
Not applicable.
Foreign currency forward contracts Calculated using forward exchange rates prevailing at the balance sheet date.
Not applicable.
Unquoted equity investments Calculated based on the Group’s interest in the net assets of the unquoted entities.
Assumptions are made with regard to future expected revenues and discount rates.
Changing the inputs to the valuations to reasonably possible alternative assumptions would not significantly change the amounts recognised in profit or loss, total assets or total liabilities, or total equity.
Contingent consideration Calculated on the amounts expected to be paid based on the probability of contingent events and targets being achieved, determined by reference to forecasts of future performance of the acquired businesses discounted using the market rates prevailing at financial year end.
Assumptions are made with regard to future expected earnings and discount rates on certain of the contingent arrangements.
For
per
sona
l use
onl
y

Annual Report 2019 125
Directors’ Declarationfor the year ended 30 June 2019
In the opinion of the Directors of Downer EDI Limited:
(a) The financial statements and notes set out on pages 62 to 124 are in accordance with the Australian Corporations Act 2001 (Cth), including:
(i) Complying with Accounting Standards, the Corporations Regulations 2001 and other mandatory professional reporting requirements; and
(ii) The financial statements and notes thereto give a true and fair view of the financial position and performance of the Company and the consolidated entity;
(b) There are reasonable grounds to believe that Downer EDI Limited will be able to pay its debts as and when they become due and payable;
(c) The Directors have been given the declarations required by Section 295A of the Corporations Act 2001 (Cth); and
(d) The attached financial statements are in compliance with International Financial Reporting Standards, as noted in Note A to the financial statements.
Signed in accordance with a resolution of the Directors made pursuant to Section 295(5) of the Corporations Act 2001 (Cth).
On behalf of the Directors
R M Harding Chairman
Sydney, 22 August 2019
For
per
sona
l use
onl
y

126 Downer EDI Limited
Downer’s sustainability approach
To Downer, sustainability is delivering financial growth and value to its customers through its supply chain, looking after the wellbeing of its people, having a diverse and inclusive workforce, minimising its impact on the environment and enhancing the liveability of the communities in which it has influence. Downer recognises that sustainability is vital for securing long-term environmental, economic and social viability and understands its role in contributing to a sustainable future for communities to prosper.
Sustainability is intrinsically linked to Downer’s business strategy because the sustainability of Downer’s activities is fundamental to the Company’s future success. Downer’s sustainability strategy is shaped by its four Pillars: Safety; Delivery; Relationships and Thought Leadership. Downer’s commitment to sustainability is outlined on the Downer website and within the sustainability report located on www.downergroup.com/sustainability.
Downer makes a positive contribution in industry sectors such as utilities, renewables, public transport, infrastructure, facility management and carbon-intensive industries sectors, for example, mining and production of road pavement products. Downer’s strategy focuses on improving efficiencies in existing operations, investing in growth, and adapting as industry and customer needs and preferences change. Downer’s business diversity allows it to leverage emerging opportunities such as increasing and ageing populations, infrastructure renewal requirements and the increased need for inter-connected smart cities and regional city hubs.
As an integrated service provider, Downer’s contribution to sustainability is achieved by providing its customers with industry leading solutions that drive and provide efficiency and reduce their impact on the environment.
Downer works closely with the local communities in which it operates to achieve better social inclusion outcomes, implementing a range of strategies focusing on social responsibility, local and Indigenous employment, cultural heritage management and stakeholder engagement.
Downer’s success is a direct result of the experience, capability and engagement of Downer’s people. Downer aims to employ the best people and bring thought leadership to support its customers to plan, create and sustain. Downer achieves this by embracing diversity and inclusiveness in the workplace. Downer continues to strengthen its focus on recruiting strategically to increase workforce participation across a range of demographics.
Downer’s ESG reporting approach
Downer has prepared its Sustainability Report in accordance with the Global Reporting Initiative’s (GRI) Standards to provide investors with comparable information relating to environmental, social and governance (ESG) performance. Specifically, Downer’s approach takes into consideration the GRI’s principles for informing report content: materiality, completeness, and sustainability context and stakeholder inclusiveness. A key focus is to demonstrate how Downer delivers sustainable returns while managing risk and being responsible in how it operates.
Downer seeks to identify the issues that have the greatest potential to impact its future success and returns to shareholders. This year Downer revisited its materiality assessment in accordance with the GRI Standards via a rigorous process to formally engage internal and external stakeholders to understand what they believe are the material sustainability issues for Downer and inform the identification of its economic, social, environmental and governance risks and opportunities.
The materiality assessment provided key sustainability insights for Downer’s strategy and frames the content for this year’s Sustainability Report. The results were positive with strong alignment between internal and external stakeholder views. This provided a list of the top 11 issues which Downer deems to be its material issues ranked in order of priority consisted of:
1. Health and safety
2. Governance and ethics
3. Contractor management
4. Operational performance
5. Financial performance
6. Attraction and retention
7. Partnerships and stakeholder engagement
8. Customer expectations
9. Business resilience
10. Climate change
11. Diverse and inclusive workforce
Further information including the process undertaken is available in the 2019 Sustainability Report.
Governance and Risk Management
The Downer Board, through its oversight functions has ensured Downer appropriately considers ESG risks including those related to climate change. In fulfilling this function, the Downer Board also receives oversight from Downer’s Audit and Risk Committee, Zero Harm Committee, Zero Harm Board Committee, Tender Risk Evaluation Committee and Disclosure Committee. ESG-related risks and opportunities are incorporated into Downer’s broader corporate strategy, planning and risk management.
Sustainability Performance Summary 2019F
or p
erso
nal u
se o
nly

Annual Report 2019 127
The Downer Board recognises that an integrated approach to managing ESG risks and opportunities is essential. This has been reflected in the strengthening of Downer’s governance structure and increased focus on this risk in both Board and executive forums throughout the financial year ended 2019. This has included:
– Formal updates to the Board on a regular basis and Audit and Risk and Zero Harm Committees on a bi-monthly basis;
– Regular updates and stakeholder engagement with the Executive Committee;
– Amendments to the Audit and Risk Committee Charter to include explicit reference to climate-related risks and opportunities;
– Inclusion of ESG risks and opportunities in the annual Board strategy agenda; and
– Incorporating ESG risk and opportunity discussions in Divisional Executive Meetings, including climate-related workshops with senior leadership teams of each Division.
ESG risks and opportunities are governed as part of Downer’s Group Risk and Opportunity Management Framework and Project Risk Management Framework. Downer identifies, manages and discloses material climate-related risks as part of standard business practices, and, in accordance with the Group and Divisional strategies, which apply to everyone at Downer.
Downer’s Zero Harm Management System Framework sets the Company’s Zero Harm and sustainability governance requirements. Downer has been certified (as a minimum) to the following standards: AS/NZS 4801 or OHSAS 18001 (for occupational health and safety management systems); ISO 14001 environmental management systems; and IS0 9001 quality management systems.
The Board’s Zero Harm Committee oversees the development and implementation of Downer’s Zero Harm management systems, and the process of Downer’s Zero Harm performance. The effectiveness of these systems is monitored through extensive internal and third-party audit programs, with oversight by both the Board Zero Harm and Board Audit and Risk Committees. Other aspects of Downer’s approach to sustainability are overseen by the Group Diversity Committee and other relevant corporate governance forums.
The method for measuring the Company’s performance is clearly set out in its governance framework, short-term remuneration incentives are offered to senior managers in relation to the Company’s performance against environmental sustainability targets. These targets include the management of critical environmental risks and GHG emissions reduction.
Downer’s Zero Harm performance during 2019 is summarised below. More comprehensive information is provided in Downer’s 2019 Sustainability Report which will be available on the Downer website at www.downergroup.com.
Health and safety
Downer’s business is founded on its deeply held value of Zero Harm. Health and safety is Downer’s highest priority and is the first of the Company’s strategic pillars. Zero Harm is embedded in Downer’s culture and is fundamental to its future success. Downer works relentlessly to make sure this does not become rhetoric and that its people actively live these words vigilantly every day, watching out for their own health and safety as well as that of others in and around its workplaces.
Downer’s approach to health and safety is built on leading and inspiring, managing risk, rethinking processes, applying lessons learnt, and adopting and adapting practices that aim to achieve zero work-related injuries. Downer’s approach is a market differentiator as it enables its people to work in industry sectors that may be inherently hazardous. In everything Downer does, the health and safety of Downer’s people and communities that it works within is always the Company’s top priority.
Downer’s commitment is enhanced by strong leadership from senior leaders within the business, who actively engage, enable and empower its people to work safely, and maintain safe working environments for themselves and the community. As Downer’s health and safety performance demonstrates, Downer has a mature safety culture, it is proud of its people’s support and commitment to its Zero Harm principles and practices.
Downer’s strategic program for Health and Safety has focused on:
– Critical risk management including the evaluation and assurance of critical controls by multiple layers of management and frontline leaders. The goal is to eliminate all preventable significant harm and establish Downer as a leader in critical risk management.
– Streamlining and harmonising management systems and continuing to further frontline leadership capability. The goal is to have an aligned approach to managing Zero Harm.
– Technology and innovation. The goal is to collect better data to better anticipate future risks and opportunities, and innovate via use of technology.
– Business resilience, including mental health. The goal is to proactively respond to emerging strategic Zero Harm issues that impact the sectors it operates in and reinforce the positioning of Downer as a thought leader.
Lost
Tim
e In
juri
es p
er 1,
000,
000
hour
s
Tota
l Rec
orda
ble
Inju
ries
per
1,00
0,00
0 ho
urs
0
0.50
1.00
1.50
2.00
2.50
3.00
3.50
4.00
4.50
5.00
0
0.20
0.40
0.60
0.80
1.00
1.20
1.40
1.60
1.80
2.00
TRIFRLTIFR
201920182017201620152014
1.08
0.87
0.660.55
0.78
0.57
For
per
sona
l use
onl
y

128 Downer EDI Limited
Sustainability Performance Summary 2019 – continued
Environmental Sustainability
Downer’s environmental sustainability performance is measured against the key areas of risk management, compliance, minimising environmental impact and maximising resource efficiency opportunities in its own and its customers’ businesses. Downer’s key focus areas during the year were:
– Continuing to focus on the resilience and assurance of environmental risk controls;
– Incorporating sustainability rating tools and initiatives into major projects;
– Improving environmental workforce capability;
– Engaging with customers regarding Downer’s environmental capability; and
– Preparing the business as markets transition to a low carbon economy.
Downer achieved its Group-wide target of zero Level 51 or Level 62 environmental incidents. There were no significant environmental incidents3 (≥ Level 4) during financial year 2019.
Disappointingly, Downer incurred nine penalty infringement notices totalling NZD $4,950 in its New Zealand Division. At the time of writing this report, one infringement notice (NZD $750) is being contested due to evidence suggesting the discharge did not originate from the Downer facility. Downer also incurred two penalty infringement notices totalling AUD $19,055 in its Transport and Infrastructure Division associated with the operation of wastewater treatment facilities resulting in an exceedance of ammonia released into the nearby watercourse. The other related to a breach of the Planning approval whereby the construction certificate was not obtained for the Beryl Solar Farm (further information is available in the 2019 Sustainability Report).
1 A Level 5 environmental incident is defined as any incident that causes significant impact or serious harm on the environment, where material harm has occurred and if costs in aggregate exceed $50,000.
2 A Level 6 environmental incident is defined as an incident that results in catastrophic widespread impact on the environment, resulting in irreversible damage.3 A significant environmental incident or significant environmental spill (≥Level 4) is any environmental incident or spill where there is significant impact on or material harm
to the environment; or a notifiable incident where there is a spill that results in significant impact or material harm; or there is long-term community irritation leading to disruptive actions and requiring continual management attention.
Significant achievements for FY19 include:
– Recognised by the Australasian Reporting Awards with a Bronze Award for Downer’s 2018 Sustainability Report.
– Downer was awarded a “Leading” Infrastructure Sustainability (IS) Design rating by the Infrastructure Sustainability Council of Australia (ISCA) for the Auckland’s City Rail Link project, the highest possible achievement in the IS scheme.
– Downer achieved the first Infrastructure Sustainability (IS) Design rating for a Light Rail Project in New South Wales for the successful delivery of the Newcastle Light Rail project, which achieved an ‘Excellent Design’ rating by ISCA.
– Downer New Zealand became a signatory to the New Zealand Climate Leaders Coalition and established an internal sustainability governance working group.
– Expansion of its circular economy capability through acquiring 50% of Repurpose It, a waste resource company in Victoria.
– Secured $2.5 million in grant funding through the Queensland Resource Recovery Industry Development program to build another gully pit recycling system in Queensland like the one opened last year in Rosehill.
– Produced an Environmental Product Declaration (EPD) in accordance with ISO14025 for the Sydney Growth Train (also known as ‘Waratah Series 2’) suburban train sets – the first EPD produced in Australia for vehicle and transport equipment.
Downer’s response to climate change
Climate change impacts present a challenge to sustaining our modern environment, enhancing livability, the natural environment and our business. While Downer’s business portfolio is diverse, it has limited exposure to the effects of climate change impacts on its business through fixed, long-lived capital assets. Downer’s diverse portfolio allows it to be flexible and agile to redeploy assets to high growth areas as markets change. This diversity of portfolio strongly positions Downer to mitigate and manage its exposure to climate risks and to maximise the business opportunities it presents.
Downer accepts the latest Intergovernmental Panel on Climate Change (IPCC) assessment of the science related to climate change. Downer considers climate change to be one if its material issues – refer to the materiality assessment.
For
per
sona
l use
onl
y

Annual Report 2019 129
Downer continues to make significant progress in assessing the financial implications of climate change and in 2019 Downer has implemented the recommendations of the Taskforce on Climate-related Financial Disclosures (TCFD) and focused on scenario analysis and developing a science-based target as detailed below. In addition, in 2019 Downer published a set of climate change frequently asked questions (FAQs) on its website www.downergroup.com/environment to provide a consistent response to FAQs Downer receives on climate change from its stakeholders. For more detailed information on Downer’s Climate Change disclosures, refer to the Sustainability Report.
TCFD Scenario analysis
In 2019, Downer completed a scenario analysis to test the resilience of its strategy, and the assumptions underpinning strategic focus areas in relation to relevant climate futures both physical and transitional. Acknowledging the significant degree of uncertainty associated with the manifestation of these futures, the analysis explores four different, yet inter-related potential futures with varying climate change severity and alternate socioeconomic and political landscapes.
In deciding on the three key issues upon which to frame the scenario analysis, Downer undertook a process to identify the future risks and opportunities arising from the transition to a low carbon economy and physical changes and overlaid Downer’s strategic priorities, current risks and future changes which resulted in the three key issues and their respective areas of the business.
Key issue Area of business focus
Physical impacts of climate change (weather) Transport & Infrastructure and New Zealand
Energy Transition (i.e. Thermal coal transition) Mining (part of Mining, Energy and Industrials)
Changing carbon/energy policy Group
These informed the selection of four divergent, internally consistent and plausible scenarios, based upon the best available literature and modelling. Two of the four scenarios explore the minimum plausible global-warming trajectory (approximately 2 degrees of global warming), and two explore the upper limit (approximately 4 degrees of global warming), with the pairs separated based on the degree to which adaptation is available and practicable in the given future.
The degrees warming is informed by the Representative Concentration Pathways “RCPs” (RCP 2.6 for under 2 degrees and RCP 8.5 for 4 degrees). Whilst the transition pathways, including broader energy and socio-economic conditions are informed by the Shared Socio-economic Pathways “SSPs”.
Scenarios
Sustainability ~2 degrees global warming (SSP 1- RCP 2.6)
Follower ~2 degrees global warming (SSP 4- RCP 2.6)
Fossil fuel development ~4 degrees global warming (SSP 5- RCP 8.5)
Global decline ~4 degrees global warming (SSP 3- RCP 8.5)
Each of these scenarios provide numeric and qualitative outcomes to explore risks and opportunities. The development of these scenarios was tailored to Downer’s business strategy, by identifying the key risks and opportunities that arose in each of the three selected priority areas. Once these were understood, a key driving climate or transition variable was mapped, enabling consistent exploration of the potential impact or outcome for Downer in each of the four futures.
Key findings include:
– Downer’s strategy was found to be resilient and well positioned in all scenarios used due to diversification of services across multiple sectors, existing market presence and capabilities.
– A <2°C world provides considerable opportunities which outweigh identified risks and will assist with lower cost of capital and increased margins.
– Aligning to a <2°C world will require decarbonisation by the second half of the century 2050> with a substantial decrease by 2030.
The scenario analysis work will be used as signposts to inform Downer’s strategy and help Downer to manage some of the uncertainty and complexities associated with these futures. Monitoring government policy (e.g. carbon price), consumer sentiments on climate change, the levelised cost of energy across major energy sources and the global emission trajectory will provide key insights to best inform Downer’s business strategies.
Downer continues to focus on a decarbonisation strategy with an emphasis on long-term contracts, technology, energy transition, GHG reductions and efficiencies, and opportunities to offset emissions.
For
per
sona
l use
onl
y

130 Downer EDI Limited
Sustainability Performance Summary 2019 – continued
GHG Emission Reduction Target
A key consideration of the TCFD recommendations is the pathway to reduce emissions and the establishment of targets. Downer has set ambitious targets to align with the 2015 Paris agreement goals to “pursue efforts to limit the temperature increase to 1.5 °C” by the end of this century.
Downer acknowledges that climate change mitigation is a shared responsibility and to support the transition to a low-carbon economy in an equitable manner, organisations need to play their part by developing emissions reduction targets that align to the latest science. Therefore, Downer has leveraged the Science-based Target (SBT) initiative’s framework and guidance to set a GHG emission reduction target for the Downer Group.
Downer commits to the decarbonisation4 of its absolute Scope 1 and 2 GHG emissions5 by 45-50% by 2035 from a FY2018 base year and be net zero in the second half of this century6.
In addition, Downer will review its emission reduction approach in line with Intergovernmental Panel on Climate Change (IPCC) updated scientific reports and other developments in low-emissions technology, to ensure a practical and affordable transition towards this commitment.
Refer to Downer’s Sustainability Report for further disclosures on Downer’s response to climate change and how we have specifically addressed the recommendations outlined in the TCFD.
4 Decarbonisation may include the use of certified offsets.5 Scope 1 emissions are those produced directly by Downer Group activities, Scope 2 emissions are indirect emissions, such as electricity consumption, Scope 3 emissions are
those that occur from sources not owned or controlled by Downer.6 This is consistent with a 1.5 degree Celsius pathway using the latest International Panel on Climate Change (IPCC) scientific reports.
For
per
sona
l use
onl
y

Annual Report 2019 131
Overview
Downer’s corporate governance framework provides the platform from which:
– The Board is accountable to shareholders for the operations, performance and growth of the Company;
– Downer management is accountable to the Board;
– The risks to Downer’s business are identified and managed; and
– Downer effectively communicates with its shareholders and the investment community.
Downer continues to enhance its policies and processes to promote leading corporate governance practices.
The Board endorses the ASX Corporate Governance Council’s Corporate Governance Principles and Recommendations (ASX Principles).
Principle 1: Lay solid foundations for management and oversight
The Downer Board Charter sets out the functions and responsibilities of the Board and is available on the Downer website at www.downergroup.com.
The Board Charter states that the role of the Board is to provide strategic guidance and to effectively oversee management of the Company. Among other things, the Board is responsible for:
– Overseeing the Company, including its control and accountability systems;
– Appointing and removing the Group CEO and senior executives;
– Monitoring performance of the Group CEO and senior executives; and
– Reviewing, ratifying and monitoring systems of risk management and internal control, codes of conduct and legal compliance.
Before appointing a Director, the Board undertakes appropriate checks and provides shareholders with all material information which is relevant to the decision to elect or re-elect a Director.
Directors receive formal letters of engagement setting out the key terms, conditions and expectations of their engagement.
The Board Charter also describes the functions delegated to management, led by the Group CEO.
The primary goal set for management by the Board is to focus on enhancing shareholder value, which includes responsibility for Downer’s economic, environmental and social performance.
The Group CEO is responsible for the day-to-day management of Downer and his authority is delegated and authorised by the Board.
Downer has written employment agreements with each of its senior executives and the performance of those senior executives is regularly reviewed against appropriate measures, including performance targets linked to the business plan and overall corporate objectives. In 2019, Downer’s senior executives participated in periodic performance evaluations where they received feedback on progress against these targets.
The Company Secretary is responsible for supporting the effectiveness of the Board and is directly accountable to the Board, through the Chairman, on all matters to do with the proper functioning of the Board.
Details of Downer’s Directors and the Executive Leadership Team are available on the Downer website at www.downergroup.com.
Diversity at Downer
Downer is committed to ensuring that it has a diverse and inclusive workforce, which fulfils the expectations of its employees, customers and shareholders while building a sustainable future for its business. This is formalised through the Downer Diversity & Inclusiveness (D&I) Policy which outlines the Company’s commitment to developing a diverse and inclusive workforce.
In 2016, Downer launched a revised Diversity Framework. The purpose of this framework is to support the D&I Policy and implementation of Divisional D&I strategies.
The Diversity & Inclusiveness Policy is available on the Downer website at www.downergroup.com.
ASX diversity recommendations – diversity statement
This diversity statement outlines Downer’s performance throughout 2019 with respect to its broader diversity program, but with a particular focus on gender, and specifically includes:
– Details of Downer’s key gender representation metrics;
– An overview of the gender diversity initiatives undertaken by Downer throughout 2019; and
– An outline of Downer’s measurable gender diversity objectives for 2020.
Gender representation metrics
As at 30 June 2019, Downer’s female gender representation metrics were as follows:
– Board 37%
– Senior Executive1 21%
– Management2 22%
– Workforce 36%
1 For present purposes, “Senior Executive” refers to CEO, KMP and Other Executives/General Managers as defined in the Workplace Gender Equality Agency Reference guide to the workplace profile and reporting questionnaire (WGEA Reference Guide).
2 For present purposes, “Management” refers to CEO, KMP, Other Executives/General Managers, Senior Managers and Other Managers as defined in the WGEA Reference Guide.
Corporate Governance for the year ended 30 June 2019
For
per
sona
l use
onl
y

132 Downer EDI Limited
Corporate Governance – continuedfor the year ended 30 June 2019
Looking back: 2019 measurable objectives
Focus Area Objective Targets Outcome
Brand and Reputation
To enhance the brand and reputation of Downer Group through partnerships related to our diversity focus areas and to ensure Downer Group continues to be viewed as an organisation that is committed to D&I.
Establish two partnerships with reputable diversity agencies.
– Re-established partnership with the Diversity Council of Australia.
– Became a member of Work180, an Australian jobs network that operates at the forefront of recruitment and advocacy for women.
Employees have received stories of interest reinforcing a commitment to a diverse and inclusive culture through a range of communication and media, including Downer and Spotless intranet pages, Downer Connect, Downer and Spotless websites and LinkedIn. Highlights include:
– Celebrating events of significance for gender and Indigenous cultures, such as International Women’s Day, participation in Habitat for Humanity and National Reconciliation Week.
– Graduate series of stories featuring talent and success (focusing on female graduates).
– 60 Seconds series, being interviews with Senior Leaders.
– Indigenous participation stories around the Waanyi Downer JV, Cowboys House, the PCYC Blackwater and Mundine Means Business.
Gender Diversity
To improve opportunities for women to reach their potential through an inclusive work environment while positioning Downer Group as a preferred employer for women in its industries.
37% women in the workforce by 2020.
20% women in Management by 2020.
Parental Leave Policy is currently under review. Extensive research, benchmarking and internal consultation was undertaken to understand Downer and Spotless’ relative position on Parental Leave Policies in the market place and as a competitive positioning tool in the attraction and retention of talent.
Downer refreshed and relaunched the Downer Mentoring program in this period. 30 mentoring relationships were established with 15 high performing females participating.
– As part of Downer’s Talent Management and Succession Planning, all female employees at CEO-2 and high potential female employees have an active talent profile and development plan.
– Seven female executive leaders participated in the Downer Executive Development Program (ExeLD).
– Two executive leaders participated in the Chief Executive Women Development Program.
An information sheet that increases knowledge on how to mitigate unconscious bias in recruitment was made available to hiring managers in this period.
For
per
sona
l use
onl
y

Annual Report 2019 133
Focus Area Objective Targets Outcome
Cultural Diversity
To build on Downer Group’s commitment to closing the gap by increasing Indigenous workforce participation and developing strategic partnerships with Indigenous organisations and community groups.
3% Aboriginal and Torres Strait Islander employees by 2020.
– Downer launched its second Reconciliation Action Plan (RAP) ‘Innovate’, endorsed by Reconciliation Australia, which outlines our reconciliation vision, strategy and targeted initiatives.
– Spotless is closing out its second RAP ‘Innovate’, having implemented all initiatives.
– Spotless is consulting with Reconciliation Australia on its ‘Stretch’ RAP, which is anticipated to launch Q2 FY20.
– Partnerships developed with PCYC Blackwater and Aboriginal Employment Strategy (AES).
– Became a registered member of Supply Nation. Supply Nation is Australia’s largest national directory of verified Aboriginal and Torres Strait Islander businesses.
– Continued to work closely with government partners in NZ, including the Ministry of Social Development and Te Puni Kōkiri to provide employment opportunities for Māori people who may experience challenges to securing and/or maintaining ongoing employment.
– Evolved the Māori Leadership program, Te Ara Whanake, into a program specifically designed for non-Māori leaders.
– Worked in partnership with Te Puni Kōkiri to create Whakatipu Tētēkura a program to attract and recruit Māori school leavers.
– Launched a custom-built Indigenous Cultural Awareness Training e-learn program for Australian supervisors and above during this period.
Generational Diversity
To establish Downer Group as a sought-after employer for all age-groups and as an organisation that builds a talent pipeline of thought leaders and continues to value experience.
Build Downer’s LinkedIn ranking (as of 30 June 2018, the 12th most sought-after business to work for).
Maintain or increase the number of graduate employees’ year-on-year until 2021.
Downer did not improve its LinkedIn ranking, due to a change in focus to promote the diversity of our people (amongst other things) on Downer Connect, the internal social media platform that was launched in this period.
Downer continues to build its pipeline of talent by investing in youth through the:
– Downer Graduate Program – intake for 2018 was 28 and in 2019 increased to 40, a 40% increase year on year.
– LEaD: Emerging Leaders Program (Downer’s leadership program for emerging leaders), had 37 participants in FY19 – double the intake of the previous four years.
Downer commenced consultation and development of the governance structure and framework for the Apprentices and Trainees Program.
The Downer ‘Our Brand’ guidelines have been updated to include diverse and inclusive imagery and instruction to promote and support our commitment to D&I.
For
per
sona
l use
onl
y

134 Downer EDI Limited
Corporate Governance – continuedfor the year ended 30 June 2019
Looking ahead: 2020 measurable objectives
Focus Area Objective Targets Initiatives
Flexibility, Diversity and Inclusion
To continue developing Downer’s commitment to representing the businesses and communities in which it serves through a focus on D&I.
Report quarterly to EXCO on progress towards targets and objectives.
– Continue the governance structure through Divisional Diversity Steering Committees (DDSCs) with progress and initiatives reported quarterly to the Executive Committee (EXCO).
– Leverage our partnership with Work180 as an endorsed employer to utilise its job board for Downer targeted positions.
– Review and modify the Downer Mandatory Induction to ensure they promote the Company’s commitment to a diverse and inclusive workforce and working environment.
Gender Diversity
To improve opportunities for women to reach their potential through an inclusive work environment while positioning Downer Group as a preferred employer for women in its industries.
37% women in the workforce by 2020.
23% women in Management positions by 2020, a 3% increase on the disclosed measurable objective outlined in Downer’s FY18 Annual Report.
22% women in Senior Executive positions by 2020.
30% women on the Board – the Board’s composition currently meets this objective.
– Deliver on Downer’s Workplace Gender Equality Agency (WGEA) Pay Equity Ambassador commitments.
– Undertake a pilot program showcasing how to incorporate Downer’s Flexible Working Arrangements for an operational team and site. Share learnings broadly.
– Develop capability to effectively lead and manage a diverse workforce via a series of manager guides. Content to include: inclusive language, strategies for managing a culturally diverse workforce and everyday sexism in the workplace.
– Implement a second intake of the Downer Mentoring program where high performing women are paired with high performing leaders to support their development goals.
– Develop and launch a Female Network to highlight opportunities and networking.
– Develop and launch a ‘Manager Toolkit’ for supporting Primary Carers on Parental Leave before, during and as part of return to work.
– Build the anti-unconscious bias capability of hiring managers and recruitment specialists via access to an online learning module.
For
per
sona
l use
onl
y

Annual Report 2019 135
Focus Area Objective Targets Initiatives
Cultural Diversity
To build on Downer Group’s commitment to closing the gap by increasing Indigenous workforce participation and developing strategic partnerships with Indigenous organisations and community groups.
3% Aboriginal and Torres Strait Islander employees by 2020.
– Make progress on the commitments outlined in the ‘Innovate’ RAP (close out due 2021).
– Launch Spotless ‘Stretch’ RAP and commence delivery on the commitments.
– Develop five new partnerships with Indigenous businesses and/or communities.
– Remaining Australian supervisors and above to complete Downer’s Indigenous Cultural Awareness Training Program.
– Develop an Indigenous Cultural Awareness training module for non-Indigenous employees, available via e-learn and a ’toolbox’ training kit for site-based employees.
– Build on the NZ based Whatakipu Tētēkura program for Māori school leavers at risk of becoming NEETs (not in education, employed or training) consisting of a series of marae-based residential workshops, pastoral care and supporting career development pathways into permanent roles.
– Support and engage non-Māori leaders to participate in the Te Ara Maramatanga. (Building on Te Ara Whanake (the Māori Leadership Program) by participating in the 24-hour marae-based immersion program that allows employees to experience Māori culture. Continue to provide employment opportunities to migrant workers and further build manager capability by providing cultural awareness training. Conduct pre-employment programs quarterly.
Generational Diversity
To establish Downer Group as a sought-after employer for all age-groups and as an organisation that builds a talent pipeline of thought leaders and continues to value experience.
Maintain or increase the number of graduate employees’ year-on-year until 2021.
Continue to build a talent pipeline by investing in entry level programs that align to Downer’s diversity focus and priority areas, including:
– The Downer Graduate Development Program (continue to unify a ‘one Downer’ approach to graduate recruitment).
– Implementation of a governance structure and framework for the Downer Apprentice and Trainee Program that supports strategic attraction, selection and retention.
– Explore partnership opportunities with organisations that manage the transition of ex-Defence personnel into Downer employment opportunities.
For
per
sona
l use
onl
y

136 Downer EDI Limited
Corporate Governance – continuedfor the year ended 30 June 2019
Principle 2: Structure the Board to add value
Throughout the 2019 financial year, the Board was comprised of a majority of independent Directors.
The Board is currently comprised of the Chairman (Mike Harding, an independent, Non-executive Director), six other independent, Non-executive Directors and an Executive Director (the Group CEO, Grant Fenn). Details of the members of the Board, including their skills, experience, status and their term of office are set out in the Directors’ Report on pages 4 to 5 and are also available on the Downer website at www.downergroup.com.
The composition of the Board is reviewed and assessed by the Nominations and Corporate Governance Committee to ensure the Board is of a composition, size and commitment to effectively discharge its responsibilities and duties.
Directors are required to bring their independent judgement to bear on all Board decisions. To facilitate this, it is Downer’s policy to provide Directors with access to independent professional advice at the Company’s expense in appropriate circumstances.
Downer’s Non-executive Directors recognise the benefit of conferring regularly without management present, and they do so at various times throughout the year.
The Board considers that an independent Director is a Non- executive Director who is not a member of management and who is free of any business or other relationship that could (or could reasonably be perceived to) materially interfere with the independent exercise of their judgement. The Board regularly assesses the independence of each Director to ensure that each Director has the capacity to bring independent judgement to bear on issues before the Board and to act in the best interests of Downer as a whole.
Downer’s governance framework requires each Director to promptly disclose actual and possible conflicts of interest, any interests in contracts, other directorships or offices held, related party transactions and any dealing in the Company’s securities.
At least one Director must retire from office at each Annual General Meeting (AGM). No Non-executive Director can serve more than three years without offering themselves for re-election.
The Chairman of the Board is an independent, Non-executive Director. He is responsible for the leadership of the Board and for the efficient organisation and functioning of the Board. The Chairman is appointed by the Board to ensure that a high standard of values, governance and constructive interaction is maintained.
The Chairman facilitates the effective contribution of all Directors and promotes constructive and respectful relations between Directors and the Board and management. He also represents the views of the Board to Downer’s shareholders and conducts the AGM.
The roles of Chairman and Group CEO are not exercised by the same person and the division of responsibilities between the Chairman and the Group CEO have been agreed by the Board and are set out in the Board Charter and Downer’s Delegations Policy.
The Board has established a number of committees to assist the Board to effectively and efficiently execute its responsibilities. A list of the main Board Committees and their current membership is set out in the table below.
Board Committee Chairman Members
Audit and Risk N M Hollows S A ChaplainT G Handicott C G Thorne P L Watson
Zero Harm C G Thorne S A ChaplainG A FennP L Watson
Nominations and Corporate Governance R M Harding S A ChaplainT G Handicott
Remuneration T G Handicott P S GarlingR M Harding
Disclosure T G Handicott G A FennR M Harding
Rail Projects P S Garling G A FennT G HandicottR M Harding
Tender Risk Evaluation C G Thorne G A FennR M Harding P L Watson
For
per
sona
l use
onl
y

Annual Report 2019 137
The names of members of each committee, the number of meetings and the attendances by each of the members of the various committees to which they are appointed is set out in the Directors’ Report on page 20.
The Tender Risk Evaluation Committee’s primary purpose is to oversee tenders and contracts that exceed the delegation of the Group CEO. The Tender Risk Evaluation Committee, is chaired by an independent Director and comprises five members, including the Group CEO. Meetings of the Tender Risk Evaluation Committee are convened as required to review tender opportunities.
The Board has established the Nominations and Corporate Governance Committee to oversee the practices for selection and appointment of Directors of the Company.
The Nominations and Corporate Governance Committee’s primary purpose is to support and advise the Board on fulfilling its responsibilities to shareholders by ensuring that the Board is comprised of individuals who are best able to discharge the responsibilities of Directors having regard to the law and leading governance practice.
The Nominations and Corporate Governance Committee has a charter which sets out its roles and responsibilities, composition, structure, membership requirements and the procedures for inviting non-committee members to attend meetings. The Nominations and Corporate Governance Committee Charter gives the Nominations and Corporate Governance Committee access to internal and external resources, including advice from external consultants and specialists. The Nominations and Corporate Governance Committee Charter is available on the Downer website at www.downergroup.com.
The Nominations and Corporate Governance Committee, all members of which are independent Directors, is chaired by an independent Director and has a minimum of three members.
The Committee’s responsibilities include:
– Assessing the skills and competencies required on the Board;
– Assessing the extent to which the required skills are represented on the Board;
– Establishing processes for the review of the performance of individual Directors and the Board as a whole;
– Establishing processes for identifying suitable candidates for appointment to the Board (including undertaking a formal due diligence screening process); and
– Recommending the engagement of nominated persons as Directors.
When appointing Directors, the Nominations and Corporate Governance Committee aims to ensure that an appropriate balance of skills, experience, expertise and diversity is represented on the Board. This may result in a Non-executive Director with a longer tenure remaining in office to bring that experience and depth of understanding to matters brought before the Board.
Given the breadth of Downer’s service offerings across a range of markets, the Board seeks to ensure that it maintains an appropriate range of technical skills across engineering, geology, construction and scientific disciplines as well as professional services when considering the appointment of a new Director. The Board identified that the review of major tenders, successful delivery of major projects in an increasingly complex commercial environment and experience in services activities were required. It is for this reason that in undertaking the selection process for its most recently appointed Director, the Board selected a candidate with engineering qualifications and experience as a CEO of an ASX listed company.
For
per
sona
l use
onl
y

138 Downer EDI Limited
Corporate Governance – continuedfor the year ended 30 June 2019
The chart below illustrates the balance achieved with the current Board composition. The Company recognises the value of diversity which has been a component of the appointment process over the past few years.
Professional qualifications
Business, finance and economics
Humanities
1.0 2.0 3.0 4.0
Professional qualifications
0.0 5.0
Technical*
Legal
*Comprises construction, engineering, metallurgy and science.
Industry experience
1.0 2.0 3.0 4.00.0 5.0
Professional Services*
Transport and infrastructure
Resources
*Includes banking, finance and legal.
Tenure
9+
3–6
1.0 2.0 4.00.0 3.0
6–9
0–3
Gender diversityGender diversity
Male Female
3
5
From time to time, Downer engages external specialists to assist with the selection process as necessary, and the Chairman, Board and Group CEO meet with candidates as part of the appointment process.
Nominations for re-election of Directors are reviewed by the Nominations and Corporate Governance Committee and Directors are re-elected in accordance with the Downer Constitution and the ASX Listing Rules.
As part of its commitment to leading corporate governance practice, the Board undertakes improvement programs, including externally facilitated periodic reviews of its performance and that of its Committees and Directors. The last review was completed during FY16.
The Company has formal induction procedures for both Directors and senior executives. These induction procedures have been developed to enable new Directors and senior executives to gain an understanding of:
– Downer’s financial position, strategies, operations and risk management policies;
– The respective rights, duties and responsibilities and roles of the Board and senior executives; and
– Downer’s culture and values.
Directors are given an induction briefing by the Company Secretary and an induction pack containing information about Downer and its business, Board and Committee charters and Downer Group policies. New Directors also meet with key senior executives to gain an insight into the Company’s business operations and the Downer Group structure.
Directors are encouraged to continually build on their exposure to the Company’s business and a formal program of Director site visits has been in place since 2009. Directors are also encouraged to attend appropriate training and professional development courses to update and enhance their skills and knowledge and the Company Secretary regularly organises governance and other continuing education sessions for the Board.
The Board is provided with the information it needs to discharge its responsibilities effectively. The Directors also have access to the Company Secretary for all Board and governance- related issues and the appointment and removal of the Company Secretary is determined by the Board. The Company Secretary is accountable to the Board, through the Chair, on all governance matters.F
or p
erso
nal u
se o
nly

Annual Report 2019 139
Principle 3: Promote ethical and responsible decision-making
Downer’s Purpose is to create and sustain the modern environment by building trusted relationships with our customers. Its Promise is to work closely with our customers to help them succeed, using world-leading insights and solutions. Downer’s Purpose and Promise are founded on.the Pillars of Zero Harm, Delivery, Relationships and Thought Leadership and define the way it manages its business and are the foundations that support Downer’s culture. An overview of the Purpose, Promise and Pillars can be found on the Downer website at www.downergroup.com.
Downer strives to attain the highest standards of behaviour and business ethics when engaging in corporate activity. The Downer Standards of Business Conduct sets the ethical tone and standards of the Company and deals with matters such as:
– Compliance with the letter and the spirit of the law;
– Workplace behaviour;
– Prohibition against bribery and corruption;
– Protection of confidential information;
– Engaging with stakeholders;
– Workplace safety;
– Diversity and inclusiveness;
– Sustainability; and
– Conflicts of interest.
Downer has a formal whistleblower policy and procedures for reporting and investigating breaches of the Standards of Business Conduct. This includes the Our Voice service, an external and independent reporting service which enables employees to anonymously report potential breaches of the Standards of Business Conduct, including misconduct or other unethical behaviour. Reports received through Our Voice are investigated where appropriate, with the Company Secretary overseeing the completion of any remedial action. The Board is informed of material incidents reported under the whistleblower policy.
The Standards of Business Conduct applies to all officers and employees and is available on the Downer website at www.downergroup.com.
Downer endorses leading governance practices and has in place policies setting out the Company’s approach to various matters, including:
– Securities trading (stipulating ‘closed periods’ for designated employees and a formal process which employees must adhere to when dealing in securities);
– The Company’s disclosure obligations (including continuous disclosure);
– Communicating with shareholders and the general investment community; and
– Privacy.
Downer has an Anti-Bribery and Corruption Policy which expands upon the prohibition against bribery and corruption currently contained in the Standards of Business Conduct, and which addresses key issues such as working with government, political donations, human rights, conducting business internationally and gifts and benefits. The Board is informed of material breaches of the Anti-Bribery and Corruption Policy.
As Downer has operations in foreign jurisdictions, Downer employees are confronted by the challenges of doing business in environments where bribery and corruption are real risks. However, regardless of the country or culture within which its people work, Downer is committed to compliance with the law, as well as maintaining its reputation for ethical practice.
These policies are available on the Downer website at www.downergroup.com.
Principle 4: Safeguard integrity in financial reporting
The Company has in place a structure of review and authorisation which independently verifies and safeguards the integrity of its financial reporting.
The Audit and Risk Committee assists the Board to fulfil its responsibilities relating to:
– The quality and integrity of the accounting, auditing and reporting practices of the Company with a particular focus on the qualitative aspects of financial reporting to shareholders;
– The Company’s risk profile and risk policies; and
– The effectiveness of the Company’s system of internal control and framework for risk management.
The Audit and Risk Committee is structured so that it:
– Consists of only Non-executive Directors;
– Consists of a majority of independent Directors;
– Is chaired by an independent Chairman (who is not the Chairman of the Board); and
– Has at least three members.
The Audit and Risk Committee comprises only independent Directors, includes members who are financially literate and has at least one member who has relevant qualifications and experience.
The Audit and Risk Committee Charter sets out the Audit and Risk Committee’s role and responsibilities, composition, structure and membership requirements and the procedures for inviting non-committee members to attend meetings.
For
per
sona
l use
onl
y

140 Downer EDI Limited
Corporate Governance – continuedfor the year ended 30 June 2019
The Board receives assurances from the Group CEO and the Group CFO that the declarations provided to it in relation to the annual and half-year financial statements, in accordance with sections 295A and 303(4) of the Corporations Act 2001 (Cth) are founded on a sound system of risk management and internal control and that the system is operating effectively in all material respects in relation to financial reporting risks.
Downer’s external auditor attends the Company’s AGMs and is available to answer any questions which shareholders may have about the conduct of the external audit for the relevant financial year and the preparation and content of the Audit Report.
Information regarding the number of times the Audit and Risk Committee convened in FY19, together with the individual attendances of members at the meetings, is set out in the Directors’ Report on page 20.
The Audit and Risk Committee Charter is available on the Downer website at www.downergroup.com.
Principle 5: Make timely and balanced disclosure
The Company’s Disclosure Policy sets out processes which assist the Company to ensure that all investors have equal and timely access to material information about the Company and that Company announcements are factual and presented in a clear and balanced way. It includes that new and substantive investor or analyst presentations are released on the ASX Market Announcements Platform ahead of the presentation. A copy of the Disclosure Policy is available on the Downer website at www.downergroup.com.
The Disclosure Policy also sets out the procedures for identifying and disclosing material and market-sensitive information in accordance with the Corporations Act 2001 (Cth) and the ASX Listing Rules. The Board receives copies of all material market announcements promptly after they have been made.
Downer’s Disclosure Committee consists of two independent, Non-executive Directors (one of which is the Chairman of the Board) and the Group CEO. The Disclosure Committee oversees disclosure of information by the Company to the market and the general investment community.
Principle 6: Respect the rights of shareholders
Downer empowers its shareholders by:
– Communicating effectively, openly and honestly with shareholders;
– Giving shareholders ready access to balanced and understandable information about the Company and its governance;
– Making it easy for shareholders to participate in general meetings; and
– Giving shareholders the option to receive communications from, and send communications to, the Company and its security registry electronically.
The Downer Communication Policy sets out the Company’s approach to communicating with shareholders and is available on the Downer website at www.downergroup.com.
The Company publishes corporate information on its website (www.downergroup.com), including Annual and Half Year Reports, ASX announcements, investor updates and media releases.
Downer encourages shareholder participation at members meetings through its use of electronic communication, including by making notices of meetings available on its website and audio casting of general meetings and significant Group presentations. All substantive resolutions at meetings of shareholders are conducted by poll.
The Directors and key members of management attend the Company’s AGMs and are available to answer questions.
Principle 7: Recognise and manage risk
To mitigate the risks that arise through its activities, Downer has various risk management policies and procedures in place that cover (among other matters) interest rate management, foreign exchange risk management, credit risk management, tendering and contracting risk and project management.
Downer has controls at the Board, executive and business unit levels that are designed to safeguard Downer’s interests and ensure the integrity of reporting (including accounting, financial reporting, environment and workplace health and safety policies and procedures). These controls are designed to ensure that Downer complies with legal and regulatory requirements, as well as community standards.F
or p
erso
nal u
se o
nly

Annual Report 2019 141
Downer has a Risk Management Framework in place to enable business risks to be identified, evaluated and managed. The Board ratifies Downer’s approach to managing risk and oversees Downer’s Risk Management Framework, including the Group risk profile and the effectiveness of the systems being implemented to manage risk. The last comprehensive review of the Risk Management Framework was completed in 2016. However, the Board reviews the Group risk profile twice each year and considers other risk matters, such as business resilience, tender review processes, risk appetite, and specific risk areas, on a regular basis, as well as regular reports from senior management, the internal audit team, and the external auditor.
Downer’s annual Sustainability Report provides a detailed overview of Downer’s approach to managing its environmental and social risks. The Sustainability Report is available on the Downer website at www.downergroup.com.
The Company’s internal audit function objectively evaluates and reports on the existence, design and operating effectiveness of internal controls. Downer’s internal audit team is independent of the external auditor and reports to the Audit and Risk Committee.
Downer’s Audit and Risk Committee assists the Board in its oversight of Downer’s risk profile and risk policies, the effectiveness of the systems of internal control and Risk Management Framework and Downer’s compliance with applicable legal and regulatory obligations. The Audit and Risk Committee Charter is available on the Downer website at www.downergroup.com.
Management reports regularly to the Audit and Risk Committee on the effectiveness of Downer’s management of its material business risks and on the progress of mitigation treatments.
Principle 8: Remunerate fairly and responsibly
The Board has established a Remuneration Committee and has adopted the Remuneration Committee Charter which sets out its role and responsibilities, composition, structure and membership requirements and the procedures for inviting non-committee members to attend meetings.
The Remuneration Committee is responsible for reviewing and making recommendations to the Board about:
– Executive remuneration and incentive policies;
– The remuneration, recruitment, retention, performance measurement and termination policies and procedures for all senior executives reporting directly to the Group CEO;
– Executive and equity-based incentive plans; and
– Superannuation arrangements and retirement payments.
Remuneration of the Group CEO, Executive Directors and Non-Executive Directors forms part of the responsibilities of the Nominations and Corporate Governance Committee.
Downer’s remuneration policy is designed to motivate senior executives to pursue the long-term growth and success of the Company and prescribes a relationship between the performance and remuneration of senior executives.
The Remuneration Committee is structured so that it:
– Consists of a majority of independent Directors;
– Is chaired by an independent Director; and
– Has at least three members.
The Executive Director is not a member of the Remuneration Committee.
The maximum aggregate fee approved by shareholders that can be paid to Non-executive Directors is $2.0 million per annum. This cap was approved by shareholders on 30 October 2008. Further details about remuneration paid to Non-executive Directors are set out in the Remuneration Report at page 22.
Retirement benefits are not paid to Non-executive Directors.
Non-executive Directors do not participate in any equity incentive schemes.
The remuneration structure for Executive Directors and senior executives is designed to achieve a balance between fixed and variable remuneration taking into account the performance of the individual and the performance of the Company. Executive Directors receive payment of equity-based remuneration as short-term and long-term incentives.
Executive Directors and senior executives are prohibited from entering into transactions in associated products which limit the economic risk of participating in unvested entitlements under any of the Company’s equity-based remuneration schemes, as set out in the Securities Trading Policy. A copy of the Securities Trading Policy is available on the Downer website at www.downergroup.com.
Further details about the remuneration of Executive Directors and senior executives are set out in the Remuneration Report at page 22 and details of Downer shares beneficially owned by Directors are provided in the Directors’ Report at page 6.
For
per
sona
l use
onl
y
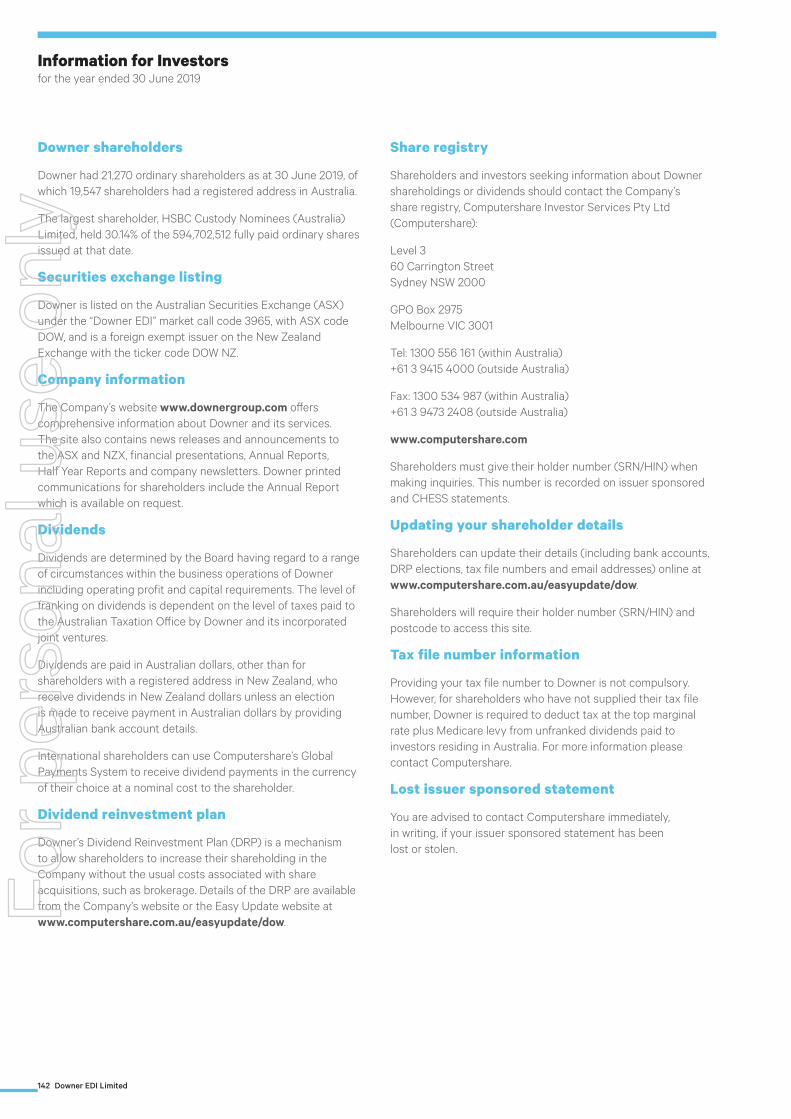
142 Downer EDI Limited
Downer shareholders
Downer had 21,270 ordinary shareholders as at 30 June 2019, of which 19,547 shareholders had a registered address in Australia.
The largest shareholder, HSBC Custody Nominees (Australia) Limited, held 30.14% of the 594,702,512 fully paid ordinary shares issued at that date.
Securities exchange listing
Downer is listed on the Australian Securities Exchange (ASX) under the “Downer EDI” market call code 3965, with ASX code DOW, and is a foreign exempt issuer on the New Zealand Exchange with the ticker code DOW NZ.
Company information
The Company’s website www.downergroup.com offers comprehensive information about Downer and its services. The site also contains news releases and announcements to the ASX and NZX, financial presentations, Annual Reports, Half Year Reports and company newsletters. Downer printed communications for shareholders include the Annual Report which is available on request.
Dividends
Dividends are determined by the Board having regard to a range of circumstances within the business operations of Downer including operating profit and capital requirements. The level of franking on dividends is dependent on the level of taxes paid to the Australian Taxation Office by Downer and its incorporated joint ventures.
Dividends are paid in Australian dollars, other than for shareholders with a registered address in New Zealand, who receive dividends in New Zealand dollars unless an election is made to receive payment in Australian dollars by providing Australian bank account details.
International shareholders can use Computershare’s Global Payments System to receive dividend payments in the currency of their choice at a nominal cost to the shareholder.
Dividend reinvestment plan
Downer’s Dividend Reinvestment Plan (DRP) is a mechanism to allow shareholders to increase their shareholding in the Company without the usual costs associated with share acquisitions, such as brokerage. Details of the DRP are available from the Company’s website or the Easy Update website at www.computershare.com.au/easyupdate/dow.
Share registry
Shareholders and investors seeking information about Downer shareholdings or dividends should contact the Company’s share registry, Computershare Investor Services Pty Ltd (Computershare):
Level 3 60 Carrington Street Sydney NSW 2000
GPO Box 2975 Melbourne VIC 3001
Tel: 1300 556 161 (within Australia) +61 3 9415 4000 (outside Australia)
Fax: 1300 534 987 (within Australia) +61 3 9473 2408 (outside Australia)
www.computershare.com
Shareholders must give their holder number (SRN/HIN) when making inquiries. This number is recorded on issuer sponsored and CHESS statements.
Updating your shareholder details
Shareholders can update their details (including bank accounts, DRP elections, tax file numbers and email addresses) online at www.computershare.com.au/easyupdate/dow.
Shareholders will require their holder number (SRN/HIN) and postcode to access this site.
Tax file number information
Providing your tax file number to Downer is not compulsory. However, for shareholders who have not supplied their tax file number, Downer is required to deduct tax at the top marginal rate plus Medicare levy from unfranked dividends paid to investors residing in Australia. For more information please contact Computershare.
Lost issuer sponsored statement
You are advised to contact Computershare immediately, in writing, if your issuer sponsored statement has been lost or stolen.
Information for Investors for the year ended 30 June 2019
For
per
sona
l use
onl
y

Annual Report 2019 143
Annual Report mailing list
Shareholders must elect to receive a Downer Annual Report by writing to Computershare Investor Services Pty Ltd at the address provided. Alternatively, shareholders may choose to receive this publication electronically.
Change of address
So that we can keep you informed, and protect your interests in Downer, it is important that you inform Computershare of any change of your registered address.
Registered office and principal administration office
Downer EDI Limited Level 2, Triniti III Triniti Business Campus 39 Delhi Road North Ryde NSW 2113
Tel: +61 2 9468 9700 Fax: +61 2 9813 8915
Auditor
KPMG International Towers Sydney 3 300 Barangaroo Avenue Sydney NSW 2000
Australian securities exchange information as at 30 June 2019
Number of holders of equity securities:
Ordinary share capital
594,702,512 fully paid listed ordinary shares were held by 21,270 shareholders. All issued ordinary shares carry one vote per share.
Substantial shareholders
The following shareholders have notified that they are substantial shareholders of Downer as at 30 June 2019.
ShareholdersOrdinary
shares held% of issued
shares
AustralianSuper Pty Ltd 48,746,466 8.20
Dimensional Fund Advisors 35,958,473 6.05
FIL Limited 30,859,896 5.19
Ausbil Investment Management Limited 29,840,376 5.02
Vinva Investment Management 29,742,478 5.00
Distribution of holders of quoted equity securities
Shareholder distribution of quoted equity securities as at 30 June 2019 is as follows.
Range of holdingsNumber of
shareholders Shareholders %Ordinary shares
heldShares
%
1 – 1,000 11,624 54.66 5,108,163 0.86
1,001 – 5,000 7,545 35.47 17,145,101 2.88
5,001 – 10,000 1,281 6.02 9,124,928 1.53
10,001 – 100,000 766 3.60 16,177,615 2.72
100,001 and over 54 0.25 547,146,705 92.01
Total 21,270 594,702,512 100.00
Holding less than a marketable parcel of shares 844For
per
sona
l use
onl
y

144 Downer EDI Limited
Twenty largest shareholders
Downer’s 20 largest shareholders of ordinary fully paid shares as at 30 June 2019 are as follows.
Shareholders Shares held % of issued shares
HSBC Custody Nominees (Australia) Limited 179,250,193 30.14
Chase Manhattan Nominees Limited 173,614,303 29.19
Citicorp Nominees Pty Limited 80,133,929 13.47
National Nominees Limited 52,378,195 8.81
BNP Paribas Nominees Pty Ltd <Agency Lending DRP A/C> 15,377,507 2.59
BNP Paribas Noms Pty Ltd <DRP> 12,414,703 2.09
HSBC Custody Nominees (Australia) Limited <NT- Commonwealth Super Corp A/C> 6,438,726 1.08
BNP Paribas Nominees Pty Ltd <Agency Lending Collateral> 3,822,000 0.64
CPU Share Plans Pty Limited 3,730,060 0.63
Citicorp Nominees Pty Limited <Colonial First State Inv A/C> 3,507,999 0.59
Argo Investments Ltd 2,659,538 0.45
AMP Life Ltd 2,113,627 0.36
Sandhurst Trustees Ltd <Harper Bernays Ltd A/C> 1,799,760 0.30
Mr Grant Fenn 961,478 0.16
Mr Barry Sydney Patterson + Mrs Glenice Margaret Patterson 891,642 0.15
Bainpro Nominees Pty Limited 639,969 0.11
National Nominees Limited <DB A/C> 454,273 0.08
Navigator Australia Ltd <MLC Investment Sett A/C> 417,043 0.07
BNP Paribus Noms (NZ) Ltd <DRP> 390,198 0.07
Navigator Australia Ltd <SMA JB Were Income A/C> 377,154 0.06
Total for top 20 shareholders 541,372,297 91.04
Information for Investors – continuedfor the year ended 30 June 2019
For
per
sona
l use
onl
y

Sovereign A2 Silk is proudly made FSC® certified by Hankuk paper who also carry the ISO 14001 EMS accreditation and it’s manufactured with elemental chlorine free pulps.
For
per
sona
l use
onl
y

www.downergroup.com
For
per
sona
l use
onl
y

Page 1 of 3
Media/ASX and NZX Release 22 August 2019
UNDERLYING NPATA UP 14.7% TO $340.1 MILLION
STATUTORY NPATA UP FROM $117.9 MILLION TO $325.6 MILLION Downer EDI Limited (Downer) today announced its financial results for the 12 months to 30 June 2019. The highlights are set out below.
Underlying NPATA (net profit after tax and before amortisation of acquired intangible assets) of $340.1 million, up 14.7% from underlying NPATA of $296.5 million in the prior corresponding period and $5.1 million higher than guidance of $335 million.
Statutory NPATA of $325.6 million, with a $17million fair value gain offset by the $31.5 million
after tax loss relating to the Murra Warra Wind Farm.
Underlying NPAT (net profit after tax) of $290.8 million, up 16.5%.
Total revenue of $13.45 billion, up 6.6%. Operating cash flow of $630.2 million, representing cash conversion of 89.0% of EBITDA
(earnings before interest, tax, depreciation and amortisation).
Group underlying EBITA margin of 4.2%, up 0.4%. Work-in-hand of $44.3 billion, up from $43.5 billion at 31 December 2018.
Final dividend 14 cents per share (50% franked); total dividends 28 cents per share, up 3.7%.
All the figures above include 100% contribution from Spotless, before minority interests. The Chief Executive Officer of Downer, Grant Fenn, said the Group’s operational and financial performance featured good revenue growth, a strong increase in earnings, and an improved Group EBITA margin. Downer’s cash performance remains strong, predictable and reliable with Group cash flow conversion of 89.0% of EBITDA. “Our Urban Services businesses – Transport, Utilities and Facilities – are continuing to grow and there is a strong pipeline of opportunities across all the markets in which we operate,” Mr Fenn said. “There has been a recovery in the mining and resources sector over the past 12 months and this drove revenue growth for our Mining, Energy and Industrials businesses.” Downer reports its financial results under five service lines and the performance of each service line, compared with the prior corresponding period, is summarised below.
Downer EDI Limited ABN 97 003 872 848
Triniti Business Campus 39 Delhi Road
North Ryde NSW 2113
1800 DOWNER www.downergroup.com
For
per
sona
l use
onl
y

Page 2 of 3
Urban Services Transport Utilities Total revenue of $4.3 billion, down 2.8% Total revenue of $2.5 billion, up 25.0% EBITA of $242.4 million, up 22.5% EBITA of $136.1 million, up 19.1% Work-in-hand of $17.7 billion Work-in-hand of $4.6 billion Facilities Total revenue of $3.4 billion, down 0.8% EBITA of $170.5 million, up 2.3% Work-in-hand of $16.6 billion Mining, Energy and Industrials Mining Engineering, Construction & Maintenance Total revenue of $1.5 billion, up 8.8% Total revenue of $1.7 billion, up 23.7% EBITA of $76.7 million, up 52.2% EBITA of $33.3 million, down 8.3% Work-in-hand of $2.9 billion Work-in-hand of $2.5 billion
New Royal Adelaide Hospital
Spotless has reached agreement with the South Australian Government and Celsus in relation to the delivery of services by Spotless at the new Royal Adelaide Hospital. The term sheet, which remains subject to various approvals, includes:
settlement of historic abatement claims; a revised KPI and abatement regime; an increase to Spotless’ monthly service fee; and initiatives to further reduce costs and improve patient care.
The settlement agreement, once formalised, will take financial effect from 1 July 2019. The additional service fee will be paid from 1 July 2019 up until June 2022 when there will be a re-pricing process in accordance with the subcontract terms.
Safety
Downer reported a Lost Time Injury Frequency Rate of 0.57 per million hours worked for the 2019 financial year and a Total Recordable Injury Frequency Rate of 2.70 per million hours worked.
Dividend
The Downer Board resolved to pay a final dividend of 14 cents per share, 50% franked, payable on 2 October 2019 to shareholders on the register at 4 September 2019. Total dividends were 28 cents per share, up from 27 cents per share in the prior year. The unfranked portion of the dividend (50%) will be paid out of Conduit Foreign Income. The company’s Dividend Reinvestment Plan (DRP) remains suspended and will not operate for this dividend.
For
per
sona
l use
onl
y

Page 3 of 3
Portfolio review
Downer’s shareholder value proposition focuses on driving growth in service-oriented businesses while serving high quality customers and maintaining disciplined cost and capital efficiency. To support this, Downer is undertaking a review to determine whether there are opportunities to enhance the alignment of its portfolio. An important area of focus for the review is Downer’s Mining business and the review will consider strategies that could unlock value for shareholders. Downer’s Mining business is a leader in Australia with a strong and proven track record. Its new management team has driven financial performance in the 2019 financial year, with additional benefits to be delivered in future years. Mining is well positioned to capitalise on its strong market position and pipeline of work to deliver significant earnings growth and improved returns. Downer will keep shareholders informed of the progress of the review.
Outlook
Downer is targeting NPATA of around $365 million before minority interests for the 2020 financial year.
For further information please contact:
Michael Sharp, Group Head of Corporate Affairs and Investor Relations +61 439 470 145 About Downer Downer is the leading provider of integrated services in Australia and New Zealand and customers are at the heart of everything it does. It exists to create and sustain the modern environment and its promise is to work closely with its customers to help them succeed, using world-leading insights and solutions to design, build and sustain assets, infrastructure and facilities. Downer employs more than 53,000 people across more than 300 sites, primarily in Australia and New Zealand, but also in the Asia-Pacific region, South America and Southern Africa. It also owns 88 per cent of Spotless Group Holdings Limited. For more information visit downergroup.com
For
per
sona
l use
onl
y

Downer GroupInvestor PresentationFull Year Results22 August 2019
For
per
sona
l use
onl
y

2
OutlookEarnings growth Cash conversion Margin growth
14.7% Underlying1
NPATA growth v FY18Operating cash flow of $630.2m
Cash conversion of 89.0%
Dividends 28cps, up from 27cps
Group underlying1
EBITA margin of 4.2%, up 0.4% v FY18
ROFE of 13.7%, up 2.2% v FY18
Total revenue2 $m Underlying1 NPATA $m Operating Cash Flow $m
1. Underlying EBITA and NPATA are non-IFRS measures that are used by Management to assess the performance of the business. They have been calculated from the statutory measures by adding back the Murra Warra wind farm loss of $45.0m ($31.5m after-tax) and deducting the fair value gain on revaluation of the existing interest in the Downer Mouchel JV ($17.0 million; $17.0m after-tax).
2. Total revenue is a non-statutory disclosure and includes revenue from joint ventures, other alliances and other income. Downer’s statutory results are reported under International Financial Reporting Standards (IFRS). NPATA is a non-IFRS measure. Downer’s amortisation of acquired intangibles has a material impact on reported earnings. Amortisation is a
non-cash charge and management believes that the exclusion of the amortisation of acquired intangibles from NPAT better reflects the underlying performance of Downer. • All figures above and throughout the presentation include 100% contribution from Spotless, before minority interests, unless stated otherwise.
2020 Outlook:$365 million NPATA, growth of 7.3%
340.1296.5
-50.0
100.0150.0200.0250.0300.0350.0400.0
FY19 FY18
630.2583.3
-
100
200
300
400
500
600
700
FY19 FY18
13,448.3 12,620.2
02,0004,0006,0008,000
10,00012,00014,000
FY19 FY18
+6.6% v FY18 +14.7% v FY18 +8.0% v FY18
Strong operational and financial performance
Underlying NPATA $340.1m (v. guidance of $335m)
Statutory NPATA $325.6m
EBITA margin
+0.4% v FY18
4.2%3.8%
0.00.51.01.52.02.53.03.54.04.5
FY19 FY18
For
per
sona
l use
onl
y

11.6%
5.1%
25.9%
20.6%
36.8%
Urban Services Mining, Energy and Industrial Services
Mining EBITA +52.2%
Facilities EBITA +2.3%
Utilities EBITA +19.1%
Transport EBITA +22.5%
Strong growth for Urban ServicesRebound in Mining Services
76% Revenue
83% EBITA1
24% Revenue
17% EBITA1
3.5% EBITA margin
5.4% EBITA margin
EC&M EBITA -8.3%
Transport
Mining
EC&M
Facilities
Utilities
1 Chart split based on FY19 EBITA (excludes unallocated corporate costs).3
242.4 197.9
0
50
100
150
200
250
300
FY19 FY18
170.5 166.7
0
50
100
150
200
FY19 FY18
76.7
50.4
0
20
40
60
80
100
FY19 FY18
33.3 36.3
0
10
20
30
40
FY19 FY18
For
per
sona
l use
onl
y

Continuing to increase work-in-hand: $44.3 billion
4
88% Urban Services 12% Mining, Energy & Industrials
6.5%5.5%
37.5%
10.5%
40.0%
Transport
MiningEC&M
Facilities
Utilities
44.343.5
42.0
Jun-19 Dec-18 Jun-18
Work-in-hand $bn
For
per
sona
l use
onl
y

5
New Royal Adelaide Hospital
Performance continues to improve
Agreement reached with South Australian Government and Celsus (SPV)
The term sheet, which remains subject to approvals, includes:o settlement of historical abatement claimso revised KPI and abatement regimeo increase in Spotless monthly service feeo initiatives to further reduce costs and improve patient care
The agreement, once formalised, will take effect from 1 July 2019 The additional service fee will be paid from 1 July 2019 up until June 2022 when there will be a
re-pricing process in accordance with the sub-contract terms
For
per
sona
l use
onl
y

6
Spotless
Multi-billion dollar pipeline of new opportunities driven by macro-economic trends of increasing urbanisation, growing population and government outsourcing
Leading positions in Health, Education, Justice, Defence, Critical Infrastructure, Hospitality Continuing to strengthen business:
o new management teamo restructure to better align with customers and marketso Centres of Excellence driving consistency of delivery, improved quality, innovation, and
future growtho more robust governance and risk management
Revenue and cost synergies with Downer Consistent cash flow, cash conversion, and stable earnings 7% reduction in net debt $16.4 billion of work-in-handF
or p
erso
nal u
se o
nly

Group financials
7
For
per
sona
l use
onl
y
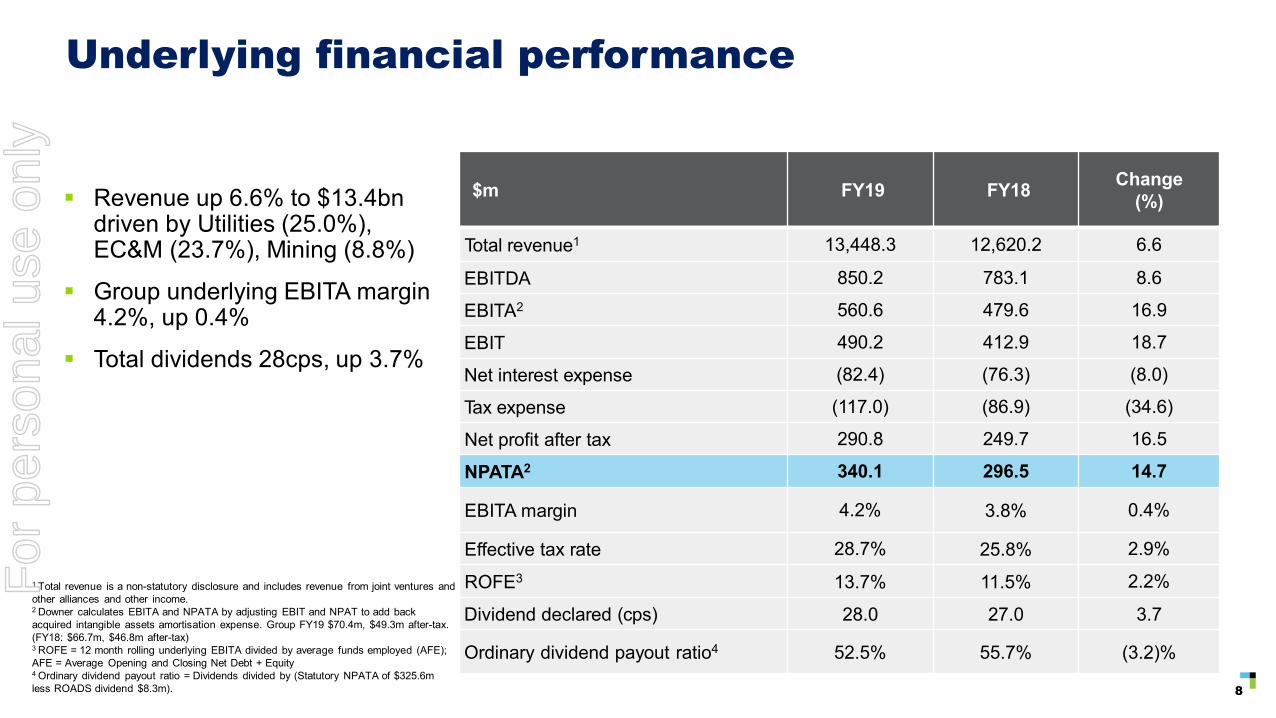
8
Underlying financial performance
$m FY19 FY18 Change(%)
Total revenue1 13,448.3 12,620.2 6.6
EBITDA 850.2 783.1 8.6
EBITA2 560.6 479.6 16.9
EBIT 490.2 412.9 18.7
Net interest expense (82.4) (76.3) (8.0)
Tax expense (117.0) (86.9) (34.6)
Net profit after tax 290.8 249.7 16.5
NPATA2 340.1 296.5 14.7
EBITA margin 4.2% 3.8% 0.4%
Effective tax rate 28.7% 25.8% 2.9%
ROFE3 13.7% 11.5% 2.2%
Dividend declared (cps) 28.0 27.0 3.7
Ordinary dividend payout ratio4 52.5% 55.7% (3.2)%
Revenue up 6.6% to $13.4bn driven by Utilities (25.0%), EC&M (23.7%), Mining (8.8%)
Group underlying EBITA margin 4.2%, up 0.4%
Total dividends 28cps, up 3.7%
1 Total revenue is a non-statutory disclosure and includes revenue from joint ventures and other alliances and other income. 2 Downer calculates EBITA and NPATA by adjusting EBIT and NPAT to add back acquired intangible assets amortisation expense. Group FY19 $70.4m, $49.3m after-tax. (FY18: $66.7m, $46.8m after-tax)3 ROFE = 12 month rolling underlying EBITA divided by average funds employed (AFE); AFE = Average Opening and Closing Net Debt + Equity4 Ordinary dividend payout ratio = Dividends divided by (Statutory NPATA of $325.6m less ROADS dividend $8.3m).
For
per
sona
l use
onl
y

9
Reconciliation of Underlying and Statutory NPATA to guidance
$m
Statutory NPATA guidance provided at half year results 352.0
Subtract fair value gain on revaluation of existing interest in Downer Mouchel JV (17.0)Underlying NPATA guidance from half year results 335.0
Reported underlying NPATA 340.1
Add back fair value gain on revaluation of existing interest in Downer Mouchel JV 17.0Subtract Murra Warra wind farm loss (after tax) (31.5)
Statutory NPATA 325.6
For
per
sona
l use
onl
y

Unallocated Costs (Corporate Costs)
10
$m FY19 FY18
Corporate costs (98.4) (86.0)
Amortisation of acquired intangible assets (47.0) (48.2)
Murra Warra wind farm loss (45.0) -
FV gain on revaluation of existing interests in Downer Mouchel JV1 17.0 -
Mining goodwill impairment - (76.4)
Divestment of Freight Rail - (50.2)
Auburn Rail claim - (25.0)
Divisional merger costs - (28.5)
Spotless transaction related costs - (28.0)
Total unallocated (173.4) (342.3)
1. Refer to Note F2 of the Full Year Financial Report for further information on FV gain on revaluation of existing interest in Downer Mouchel JV (DMJV).
For
per
sona
l use
onl
y

Operating cash flow
11
$m FY19 FY18 Change (%)
Underlying EBIT 490.2 412.9 18.7
Add: depreciation and amortisation
360.0 370.2 (2.8)
Underlying EBITDA 850.2 783.1 8.6
Operating cash flow 630.2 583.3 8.0
Add: Net interest paid1 70.9 70.2 1.0
Add: Tax paid 55.9 56.0 (0.2)
Adjusted operating cash flow 757.0 709.5 6.7
EBITDA conversion 89.0% 90.6% (1.6)
Eighth year of cash flow conversion in excess of 88% of EBITDA
Spotless conversion 84.2% of EBITDA (excluding nRAH)
Limited receivables factoring:
o to better match cash flows where customer payment terms >60 days
o only two customers with c.$90m in receivables factored at 30 June 2019
o lower cost than committed debt facilities
No reverse factoring of payables
1. Interest and other costs of finance paid minus interest received.
For
per
sona
l use
onl
y

Cash flow
12
$m FY19 FY18 Change (%)
Total operating 630.2 583.3 8.0
Net capital expenditure (395.1) (360.7) (9.5)
Spotless acquisition1 - (391.8) 100.0
Other acquisitions (71.5) (84.1) 15.0
IT systems upgrade (32.4) (20.4) (58.8)
Proceeds on sale of business - 134.1 (100.0)
Loans to JVs and other (10.7) (6.7) (59.7)
Total investing (509.7) (729.6) 30.1
Issue of shares (net of costs) - (0.2) 100.0
Net proceeds of borrowings 155.1 69.2 >100.0
Dividends paid (174.9) (156.7) (11.6)
Total financing (19.8) (87.7) 77.4
Net increase / (decrease) in cash 100.7 (234.0) >100.0
Cash at 30 June 710.7 606.2 17.2
Total liquidity 1,777.7 1,531.2 16.1%
Continued investment in growth and strategic bolt-on acquisitions
Continued strong liquidity to fund future growth
1 Gross consideration paid to achieve 87.8% interest in Spotless.
For
per
sona
l use
onl
y

Balance sheet and capital management
13
Strong Balance Sheet position Gearing remains in target range Reduction in net assets and
increase in gearing primarily a result of adoption of AASB15
Credit metrics remain strong and well within thresholds
$m Jun-19 Jun-18
Current assets 3,164.7 3,133.6
Non-current assets 4,843.3 4,654.6
- Goodwill 2,454.5 2,351.5
- Acquired intangible assets 418.3 458.0
- PP&E, Software and other 1,970.5 1,845.1
Total liabilities (4,957.8) (4,583.1)
Net Assets 3,050.2 3,205.1
Net Debt1 (1,012.6) (940.0)
Gearing: net debt / net debt plus equity 24.9% 22.7%
Net debt / EBITDA 1.2 1.2
Adjusted Net Debt / Adjusted EBITDAR2 2.17x 2.23x
1 Adjusted for the marked-to-market derivatives and deferred finance charges 2 Adjusted Net Debt includes Net Debt plus 6x operating lease expenses in the year. Adjusted EBITDAR equals underlying earnings before interest, tax, depreciation, amortisation and operating lease expense (on a rolling 12 month basis).
For
per
sona
l use
onl
y

Debt maturity profile (Downer and Spotless)
14
Weighted average debt duration of 3.6 years1 (4.0 years at 30 June 2018)
A$300m MTN issue in April 2019 Diversified funding sources Improvement in both key credit metrics
since Jun-18 Spotless net debt continues to reduce
Metric Jun-19 Jun-18
Interest cover 7.0x 6.3xAdjusted Net Debt / AdjustedEBITDAR2 2.17x 2.23x
1 Based on the weighted average life of debt facilities (by A$m limit).2 Adjusted Net Debt includes Net Debt plus 6x operating lease expenses in the year. Adjusted EBITDAR equals underlying earnings before interest, tax, depreciation, amortisation and operating lease expense (on a rolling 12 month basis).
Net debt ($m) Jun-19 Jun-18Downer 324.2 198.7Spotless 688.4 741.3
Group 1,012.6 940.0
0
100
200
300
400
500
600
700
800
900
1000
Jun-
20
Jun-
21
Jun-
22
Jun-
23
Jun-
24
Jun-
25
Jun-
26
Jun-
27
Jun-
28
Jun-
29
Jun-
30
Jun-
31
Jun-
32
Jun-
33
A$m
Syndicated bank facilities USPP JPY MTN A$ MTN Bilateral bank facilities Other
For
per
sona
l use
onl
y

AASB 16 – Leases
15
Effective from 1 July 2019, new disclosure from FY20 onwards Most significant changes are to bring the majority of operating leases on balance sheet and to recognise
the interest expense component of these leases FY20 outlook takes into account AASB 16:o Minimal FY20 NPATA impacto Significant increase in EBITDA o Significant increase in depreciation and interest expense
Estimated balance sheet impact on transition (1 July 2019, modified retrospective approach applied):o $720-770m increase in lease liability (lower than the 6x annual operating lease expense)o $560-610m increase in Right of Use Assets (net of onerous lease provision and lease incentives)
Downer is working collaboratively with its financiers and credit rating agency Outcome of initial analysis disclosed in Note G1 New accounting standards of the FY19 Annual ReportF
or p
erso
nal u
se o
nly

Outlook
HY19 Financial Results
16
For
per
sona
l use
onl
y

Shareholder value proposition
Aligned to growing markets and serving
quality customers
Strategic capital allocation, cost and
capital efficiency
Consistently growing EPS and DPS
Increasing EPS and maintaining a 50% -
60% payout ratio
Business growth
Efficient use of capital
Shareholder value
TSR growth through continued delivery
Maintaining a strong balance sheet and
credit rating
Continue strong operating cash flow
discipline
Increased exposure to low capital, service
oriented businessesStrategic acquisitions
Portfolio Review –Mining
Reduce debt, strengthen balance sheet
Improve operating margins and ROFE
Leveraged to buoyant economic and social infrastructure markets
Growing exposure to Urban Services
Selective acquisitions in Urban Services
Sustainable operations
Safety – Zero Harm is embedded in
Downer’s culture
Environmentally responsible operations
Supporting our communities
Continue to improve safety performance and employee wellbeing
Provide environmentally responsible and sustainable solutions for our customers
Actively support our people and the success of our communities
17
For
per
sona
l use
onl
y

Outlook
18
Downer is targeting NPATA of around $365 million before minority interests for the 2020 financial year.
For
per
sona
l use
onl
y

Supplementary information
Downer FY18 Results Investor Presentation
19
For
per
sona
l use
onl
y

20
Revenue $m EBITA $m EBITA margin ROFE
(2.8)% v FY18 +22.5% v FY18 +1.2% v FY18 +5.1% v FY18
5.6%
4.3% 4.4%
0%1%2%3%4%5%6%7%
FY19 HY19 FY18
26.4%
21.3%
0%
5%
10%
15%
20%
25%
30%
FY19 FY18
4,348.3 4,471.3
0
1,000
2,000
3,000
4,000
5,000
FY19 FY18
242.4 197.9
0
50
100
150
200
250
300
FY19 FY18
Transport
Revenue $m EBITA margin ROFE
+25.0% v FY18 +19.1% v FY18 (0.3%) v FY18 +1.2% v FY18
5.4% 5.3%5.7%
0%
1%
2%
3%
4%
5%
6%
FY19 HY19 FY18
29.4% 28.2%
0%5%
10%15%20%25%30%35%
FY19 FY18
2,506.7
2,004.9
0
500
1,000
1,500
2,000
2,500
3,000
FY19 FY18
136.1 114.3
0
50
100
150
FY19 FY18
EBITA $m
Utilities
For
per
sona
l use
onl
y

21
Facilities
Revenue $m EBITA $m EBITA margin ROFE
(0.8)% v FY18 2.3% v FY18 0.1% v FY18 +1.8% v FY18
5.0% 4.9% 4.9%
0%
1%
2%
3%
4%
5%
FY19 HY19 FY18
18.7%16.9%
0%
5%
10%
15%
20%
FY19 FY18
3,392.7 3,421.2
0
1,000
2,000
3,000
4,000
FY19 FY18
170.5 166.7
0
50
100
150
200
FY19 FY18
For
per
sona
l use
onl
y

22
Revenue $m EBITA $m EBITA margin ROFE
+8.8% v FY18 +52.2% v FY18 +1.5% v FY18 +5.9% v FY18
Mining
5.2% 5.2%
3.7%
0%
1%
2%
3%
4%
5%
6%
FY19 HY19 FY18
14.5%
8.6%
0%2%4%6%8%
10%12%14%16%
FY19 FY18
1,478.5 1,358.4
0
500
1000
1500
2000
FY19 FY18
76.7
50.4
0
20
40
60
80
100
FY19 FY18
EC&MRevenue $m EBITA $m EBITA margin ROFE
+23.7% v FY18 (8.3)% v FY18 (0.6)% v FY18 0.6% v FY18
2.0%2.4% 2.6%
0%
1%
2%
3%
4%
FY19 HY19 FY18
23.1% 22.5%
0%
5%
10%
15%
20%
25%
FY19 FY18
1,704.6
1,377.7
0
500
1,000
1,500
2,000
FY19 FY18
33.3 36.3
0
10
20
30
40
FY19 FY18
For
per
sona
l use
onl
y

23
Segment reportingFY19$m Transport Utilities Facilities EC&M Mining Unallocated Total
Segment revenue 3,775.7 2,506.7 3,384.7 1,704.6 1,423.5 17.5 12,812.7Share of sales from JVs and Associates 572.6 - 8.0 - 55.0 - 635.6
Total revenue1 4,348.3 2,506.7 3,392.7 1,704.6 1,478.5 17.5 13,448.3EBITDA 301.3 150.9 248.7 42.7 190.9 (84.3) 850.2EBITA2 242.4 136.1 170.5 33.3 76.7 (98.4) 560.6EBIT 234.1 132.9 158.6 33.3 76.7 (145.4) 490.2Fair value gain on DMJV - - - - - 17.0 17.0Murra Warra loss - - - - - (45.0) (45.0)Statutory EBIT 234.1 132.9 158.6 33.3 76.7 (173.4) 462.2EBITA margin 5.6% 5.4% 5.0% 2.0% 5.2% 4.2%Net interest expense (82.4)Tax expense (103.5)Statutory Net profit after tax 276.3NPATA2 325.6Underlying NPAT 290.8Underlying NPATA 340.1
1. Total revenue is a non-statutory disclosure and includes revenue from joint ventures, other alliances and other income.2. Downer calculates EBITA and NPATA by adjusting EBIT and NPAT to add back acquired intangible assets amortisation expense. Group FY19 $70.4m, $49.3m after-tax. (FY18: $66.7m, $46.8m after-tax).
For
per
sona
l use
onl
y

Reconciliation of Facilities to Spotless result
24
FY19 $m
Facilities segment
Less: Hawkins Building
Add: Spotless Utilities
Spotless
Total Revenue1 3,392.7 (525.7) 167.1 3,034.1
EBITA2 170.5 (9.2) 8.7 170.0
EBIT 158.6 (8.3) 8.7 159.0
EBITA margin 5.0% 1.7% 5.2% 5.6%
Net Interest Expense (39.2)
Tax Expense (35.8)
NPAT 84.0
NPATA2 91.7
1. Total revenue is a non-statutory disclosure and includes revenue from joint ventures and other alliances and other income. 2. Downer calculates EBITA and NPATA by adjusting EBIT and NPAT to add back acquired intangible assets amortisation expense. Spotless FY19 $11.0m, $7.7m after-tax.
For
per
sona
l use
onl
y

Debt and bonding facilities
25
Debt facilities $m DOW SPO Group
Total limit 1,722.0 1,068.3 2,790.3
Drawn (925.0) (798.3) (1,723.3)
Available 797.0 270.0 1,067.0Cash 600.8 109.9 710.7
Total liquidity 1,397.8 379.9 1,777.7Net debt 324.2 688.4 1,012.6
Bonding facilities $m DOW SPO Group
Total limit 1,933.1 210.0 2,143.1
Drawn (1,169.6) (153.6) (1,323.2)
Available 763.5 56.4 819.9
2.8x 2.8x2.6x
FY18 HY19 FY19
SPOTLESS DEBT COVENANTS
Net Leverage< 3.5x
7.5x 7.4x8.0x
FY18 HY19 FY19
> 3.0x
Interest Cover
25
For
per
sona
l use
onl
y

Focus on lifecycle asset services
26
2 years 5 years 10 years 15 years 20 years
Engineering
Procurement
Construction
Maintenance
Operating
Supply
RevenueMargin
Downer is focused on winning and delivering secure, long term contractual service revenue and leveraging its expertise to drive margin expansion over time
Long term, predictable revenue with opportunities for top-line growth Ability to improve margin through operational efficiencies and innovation over time Lower risk to margin compared to construction
Servicing
Selective participation Focus on O&M markets
For
per
sona
l use
onl
y

Downer GroupInvestor PresentationFull Year Results22 August 2019
For
per
sona
l use
onl
y

Appendix 4G Key to Disclosures Corporate Governance Council Principles and Recommendations
+ See chapter 19 for defined terms 2 November 2015 Page 1
Rules 4.7.3 and 4.10.31
Appendix 4G
Key to Disclosures Corporate Governance Council Principles and Recommendations
Introduced 01/07/14 Amended 02/11/15
Name of entity
Downer EDI Limited
ABN / ARBN Financial year ended:
97 003 872 848 30 June 2019
Our corporate governance statement2 for the above period above can be found at:3
☒ These pages of our annual report: Pages 127 to 135
☐ This URL on our website:
The Corporate Governance Statement is accurate and up to date as at [insert effective date of statement] and has been approved by the board.
The annexure includes a key to where our corporate governance disclosures can be located.
Date: 22 August 2019
Name of Director or Secretary authorising lodgement:
Robert John Regan
1 Under Listing Rule 4.7.3, an entity must lodge with ASX a completed Appendix 4G at the same time as it lodges its annual report with ASX.
Listing Rule 4.10.3 requires an entity that is included in the official list as an ASX Listing to include in its annual report either a corporate governance statement that meets the requirements of that rule or the URL of the page on its website where such a statement is located. The corporate governance statement must disclose the extent to which the entity has followed the recommendations set by the ASX Corporate Governance Council during the reporting period. If the entity has not followed a recommendation for any part of the reporting period, its corporate governance statement must separately identify that recommendation and the period during which it was not followed and state its reasons for not following the recommendation and what (if any) alternative governance practices it adopted in lieu of the recommendation during that period.
Under Listing Rule 4.7.4, if an entity chooses to include its corporate governance statement on its website rather than in its annual report, it must lodge a copy of the corporate governance statement with ASX at the same time as it lodges its annual report with ASX. The corporate governance statement must be current as at the effective date specified in that statement for the purposes of rule 4.10.3. 2 “Corporate governance statement” is defined in Listing Rule 19.12 to mean the statement referred to in Listing Rule 4.10.3 which discloses the extent to which an entity has followed the recommendations set by the ASX Corporate Governance Council during a particular reporting period.
3 Mark whichever option is correct and then complete the page number(s) of the annual report, or the URL of the web page, where the entity’s corporate governance statement can be found. You can, if you wish, delete the option which is not applicable.
Throughout this form, where you are given two or more options to select, you can, if you wish, delete any option which is not applicable and just retain the option that is applicable. If you select an option that includes “OR” at the end of the selection and you delete the other options, you can also, if you wish, delete the “OR” at the end of the selection.
For
per
sona
l use
onl
y

Appendix 4G Key to Disclosures Corporate Governance Council Principles and Recommendations
+ See chapter 19 for defined terms 2 November 2015 Page 2
ANNEXURE – KEY TO CORPORATE GOVERNANCE DISCLOSURES Corporate Governance Council recommendation We have followed the recommendation in full for the whole of the
period above. We have disclosed … We have NOT followed the recommendation in full for the whole of the period above. We have disclosed …4
PRINCIPLE 1 – LAY SOLID FOUNDATIONS FOR MANAGEMENT AND OVERSIGHT
1.1 A listed entity should disclose: (a) the respective roles and responsibilities of its board and
management; and (b) those matters expressly reserved to the board and those
delegated to management.
… the fact that we follow this recommendation: ☒ in our Corporate Governance Statement OR
☐ at [insert location] … and information about the respective roles and responsibilities of our board and management (including those matters expressly reserved to the board and those delegated to management):
☐ at https://www.downergroup.com/Content/cms/Documents/Board-Charter.pdf
☐ an explanation why that is so in our Corporate Governance Statement OR
☐ we are an externally managed entity and this recommendation is therefore not applicable
1.2 A listed entity should: (a) undertake appropriate checks before appointing a person, or
putting forward to security holders a candidate for election, as a director; and
(b) provide security holders with all material information in its possession relevant to a decision on whether or not to elect or re-elect a director.
… the fact that we follow this recommendation: ☒ in our Corporate Governance Statement OR
☐ at [insert location]
☐ an explanation why that is so in our Corporate Governance Statement OR
☐ we are an externally managed entity and this recommendation is therefore not applicable
1.3 A listed entity should have a written agreement with each director and senior executive setting out the terms of their appointment.
… the fact that we follow this recommendation: ☒ in our Corporate Governance Statement OR
☐ at [insert location]
☐ an explanation why that is so in our Corporate Governance Statement OR
☐ we are an externally managed entity and this recommendation is therefore not applicable
1.4 The company secretary of a listed entity should be accountable directly to the board, through the chair, on all matters to do with the proper functioning of the board.
… the fact that we follow this recommendation: ☒ in our Corporate Governance Statement OR
☐ at [insert location]
☐ an explanation why that is so in our Corporate Governance Statement OR
☐ we are an externally managed entity and this recommendation is therefore not applicable
4 If you have followed all of the Council’s recommendations in full for the whole of the period above, you can, if you wish, delete this column from the form and re-format it.
For
per
sona
l use
onl
y

Appendix 4G Key to Disclosures Corporate Governance Council Principles and Recommendations
+ See chapter 19 for defined terms 2 November 2015 Page 3
Corporate Governance Council recommendation We have followed the recommendation in full for the whole of the period above. We have disclosed …
We have NOT followed the recommendation in full for the whole of the period above. We have disclosed …4
1.5 A listed entity should: (a) have a diversity policy which includes requirements for the
board or a relevant committee of the board to set measurable objectives for achieving gender diversity and to assess annually both the objectives and the entity’s progress in achieving them;
(b) disclose that policy or a summary of it; and (c) disclose as at the end of each reporting period the
measurable objectives for achieving gender diversity set by the board or a relevant committee of the board in accordance with the entity’s diversity policy and its progress towards achieving them and either: (1) the respective proportions of men and women on the
board, in senior executive positions and across the whole organisation (including how the entity has defined “senior executive” for these purposes); or
(2) if the entity is a “relevant employer” under the Workplace Gender Equality Act, the entity’s most recent “Gender Equality Indicators”, as defined in and published under that Act.
… the fact that we have a diversity policy that complies with paragraph (a): ☒ in our Corporate Governance Statement OR
☐ at [insert location] … and a copy of our diversity policy or a summary of it: ☐ at
https://www.downergroup.com/Content/cms/Documents/Board_Policies/Group-Diversity-and-Inclusiveness-Policy.pdf
… and the measurable objectives for achieving gender diversity set by the board or a relevant committee of the board in accordance with our diversity policy and our progress towards achieving them: ☒ in our Corporate Governance Statement OR
☐ at [insert location] … and the information referred to in paragraphs (c)(1) or (2): ☒ in our Corporate Governance Statement OR
☐ at [insert location]
☐ an explanation why that is so in our Corporate Governance Statement OR
☐ we are an externally managed entity and this recommendation is therefore not applicable
1.6 A listed entity should: (a) have and disclose a process for periodically evaluating the
performance of the board, its committees and individual directors; and
(b) disclose, in relation to each reporting period, whether a performance evaluation was undertaken in the reporting period in accordance with that process.
… the evaluation process referred to in paragraph (a): ☒ in our Corporate Governance Statement OR
☐ at [insert location] … and the information referred to in paragraph (b): ☒ in our Corporate Governance Statement OR
☐ at [insert location]
☐ an explanation why that is so in our Corporate Governance Statement OR
☐ we are an externally managed entity and this recommendation is therefore not applicable
1.7 A listed entity should: (a) have and disclose a process for periodically evaluating the
performance of its senior executives; and (b) disclose, in relation to each reporting period, whether a
performance evaluation was undertaken in the reporting period in accordance with that process.
… the evaluation process referred to in paragraph (a): ☒ in our Corporate Governance Statement OR
☐ at [insert location] … and the information referred to in paragraph (b): ☒ in our Corporate Governance Statement OR
☐ at [insert location]
☐ an explanation why that is so in our Corporate Governance Statement OR
☐ we are an externally managed entity and this recommendation is therefore not applicable F
or p
erso
nal u
se o
nly

Appendix 4G Key to Disclosures Corporate Governance Council Principles and Recommendations
+ See chapter 19 for defined terms 2 November 2015 Page 4
Corporate Governance Council recommendation We have followed the recommendation in full for the whole of the period above. We have disclosed …
We have NOT followed the recommendation in full for the whole of the period above. We have disclosed …4
PRINCIPLE 2 - STRUCTURE THE BOARD TO ADD VALUE
2.1 The board of a listed entity should: (a) have a nomination committee which:
(1) has at least three members, a majority of whom are independent directors; and
(2) is chaired by an independent director, and disclose: (3) the charter of the committee; (4) the members of the committee; and (5) as at the end of each reporting period, the number of
times the committee met throughout the period and the individual attendances of the members at those meetings; or
(b) if it does not have a nomination committee, disclose that fact and the processes it employs to address board succession issues and to ensure that the board has the appropriate balance of skills, knowledge, experience, independence and diversity to enable it to discharge its duties and responsibilities effectively.
[If the entity complies with paragraph (a):] … the fact that we have a nomination committee that complies with paragraphs (1) and (2): ☒ in our Corporate Governance Statement OR
☐ at [insert location] … and a copy of the charter of the committee:
☐ at https://www.downergroup.com/Content/cms/pdf/Nomination-and-Corporate-Governance-Committee-Charter.pdf
… and the information referred to in paragraphs (4) and (5): ☒ in our Corporate Governance Statement OR
☐ at [insert location] [If the entity complies with paragraph (b):] … the fact that we do not have a nomination committee and the processes we employ to address board succession issues and to ensure that the board has the appropriate balance of skills, knowledge, experience, independence and diversity to enable it to discharge its duties and responsibilities effectively: ☐ in our Corporate Governance Statement OR
☐ at [insert location]
☐ an explanation why that is so in our Corporate Governance Statement OR
☐ we are an externally managed entity and this recommendation is therefore not applicable
2.2 A listed entity should have and disclose a board skills matrix setting out the mix of skills and diversity that the board currently has or is looking to achieve in its membership.
… our board skills matrix: ☒ in our Corporate Governance Statement OR
☐ at [insert location]
☐ an explanation why that is so in our Corporate Governance Statement OR
☐ we are an externally managed entity and this recommendation is therefore not applicable
For
per
sona
l use
onl
y

Appendix 4G Key to Disclosures Corporate Governance Council Principles and Recommendations
+ See chapter 19 for defined terms 2 November 2015 Page 5
Corporate Governance Council recommendation We have followed the recommendation in full for the whole of the period above. We have disclosed …
We have NOT followed the recommendation in full for the whole of the period above. We have disclosed …4
2.3 A listed entity should disclose: (a) the names of the directors considered by the board to be
independent directors; (b) if a director has an interest, position, association or
relationship of the type described in Box 2.3 but the board is of the opinion that it does not compromise the independence of the director, the nature of the interest, position, association or relationship in question and an explanation of why the board is of that opinion; and
(c) the length of service of each director.
… the names of the directors considered by the board to be independent directors: ☐ in our Corporate Governance Statement OR
☒ at 2019 Annual Report – Directors’ Report … and, where applicable, the information referred to in paragraph (b): ☐ in our Corporate Governance Statement OR
☒ at 2019 Annual Report – Directors’ Report … and the length of service of each director: ☐ in our Corporate Governance Statement OR
☒ at 2019 Annual Report – Directors’ Report
☐ an explanation why that is so in our Corporate Governance Statement
2.4 A majority of the board of a listed entity should be independent directors.
… the fact that we follow this recommendation: ☒ in our Corporate Governance Statement OR
☐ at [insert location]
☐ an explanation why that is so in our Corporate Governance Statement OR
☐ we are an externally managed entity and this recommendation is therefore not applicable
2.5 The chair of the board of a listed entity should be an independent director and, in particular, should not be the same person as the CEO of the entity.
… the fact that we follow this recommendation: ☒ in our Corporate Governance Statement OR
☐ at [insert location]
☐ an explanation why that is so in our Corporate Governance Statement OR
☐ we are an externally managed entity and this recommendation is therefore not applicable
2.6 A listed entity should have a program for inducting new directors and provide appropriate professional development opportunities for directors to develop and maintain the skills and knowledge needed to perform their role as directors effectively.
… the fact that we follow this recommendation: ☒ in our Corporate Governance Statement OR
☐ at [insert location]
☐ an explanation why that is so in our Corporate Governance Statement OR
☐ we are an externally managed entity and this recommendation is therefore not applicable
For
per
sona
l use
onl
y

Appendix 4G Key to Disclosures Corporate Governance Council Principles and Recommendations
+ See chapter 19 for defined terms 2 November 2015 Page 6
Corporate Governance Council recommendation We have followed the recommendation in full for the whole of the period above. We have disclosed …
We have NOT followed the recommendation in full for the whole of the period above. We have disclosed …4
PRINCIPLE 3 – ACT ETHICALLY AND RESPONSIBLY
3.1 A listed entity should: (a) have a code of conduct for its directors, senior executives
and employees; and (b) disclose that code or a summary of it.
… our code of conduct or a summary of it: ☐ in our Corporate Governance Statement OR
☒ at https://www.downergroup.com/Content/cms/Documents/Board_Poandards-of-Business-Conduct.pdf
☐ an explanation why that is so in our Corporate Governance Statement
For
per
sona
l use
onl
y

Appendix 4G Key to Disclosures Corporate Governance Council Principles and Recommendations
+ See chapter 19 for defined terms 2 November 2015 Page 7
Corporate Governance Council recommendation We have followed the recommendation in full for the whole of the period above. We have disclosed …
We have NOT followed the recommendation in full for the whole of the period above. We have disclosed …4
PRINCIPLE 4 – SAFEGUARD INTEGRITY IN CORPORATE REPORTING
4.1 The board of a listed entity should: (a) have an audit committee which:
(1) has at least three members, all of whom are non-executive directors and a majority of whom are independent directors; and
(2) is chaired by an independent director, who is not the chair of the board,
and disclose: (3) the charter of the committee; (4) the relevant qualifications and experience of the
members of the committee; and (5) in relation to each reporting period, the number of
times the committee met throughout the period and the individual attendances of the members at those meetings; or
(b) if it does not have an audit committee, disclose that fact and the processes it employs that independently verify and safeguard the integrity of its corporate reporting, including the processes for the appointment and removal of the external auditor and the rotation of the audit engagement partner.
[If the entity complies with paragraph (a):] … the fact that we have an audit committee that complies with paragraphs (1) and (2): ☒ in our Corporate Governance Statement OR
☐ at [insert location] … and a copy of the charter of the committee:
☐ at https://www.downergroup.com/Content/cms/media/2018/PDF/Board/2018_06_20_Audit_and_Risk_Committee_Charter_website_version.pdf
… and the information referred to in paragraphs (4) and (5):
☐ in our Corporate Governance Statement OR
☒ at 2019 Annual Report – Directors’ Report [If the entity complies with paragraph (b):] … the fact that we do not have an audit committee and the processes we employ that independently verify and safeguard the integrity of our corporate reporting, including the processes for the appointment and removal of the external auditor and the rotation of the audit engagement partner: ☐ in our Corporate Governance Statement OR
☐ at [insert location]
☐ an explanation why that is so in our Corporate Governance Statement
4.2 The board of a listed entity should, before it approves the entity’s financial statements for a financial period, receive from its CEO and CFO a declaration that, in their opinion, the financial records of the entity have been properly maintained and that the financial statements comply with the appropriate accounting standards and give a true and fair view of the financial position and performance of the entity and that the opinion has been formed on the basis of a sound system of risk management and internal control which is operating effectively.
… the fact that we follow this recommendation: ☒ in our Corporate Governance Statement OR
☐ at [insert location]
☐ an explanation why that is so in our Corporate Governance Statement
For
per
sona
l use
onl
y

Appendix 4G Key to Disclosures Corporate Governance Council Principles and Recommendations
+ See chapter 19 for defined terms 2 November 2015 Page 8
Corporate Governance Council recommendation We have followed the recommendation in full for the whole of the period above. We have disclosed …
We have NOT followed the recommendation in full for the whole of the period above. We have disclosed …4
4.3 A listed entity that has an AGM should ensure that its external auditor attends its AGM and is available to answer questions from security holders relevant to the audit.
… the fact that we follow this recommendation: ☒ in our Corporate Governance Statement OR
☐ at [insert location]
☐ an explanation why that is so in our Corporate Governance Statement OR
☐ we are an externally managed entity that does not hold an annual general meeting and this recommendation is therefore not applicable
PRINCIPLE 5 – MAKE TIMELY AND BALANCED DISCLOSURE
5.1 A listed entity should: (a) have a written policy for complying with its continuous
disclosure obligations under the Listing Rules; and (b) disclose that policy or a summary of it.
… our continuous disclosure compliance policy or a summary of it: ☐ in our Corporate Governance Statement OR
☒ at https://www.downergroup.com/Content/cms/Documents/Board_Policies/Disclosure-Policy.pdf
☐ an explanation why that is so in our Corporate Governance Statement
PRINCIPLE 6 – RESPECT THE RIGHTS OF SECURITY HOLDERS
6.1 A listed entity should provide information about itself and its governance to investors via its website.
… information about us and our governance on our website: ☒ at
https://www.downergroup.com/corporate-governance
☐ an explanation why that is so in our Corporate Governance Statement
6.2 A listed entity should design and implement an investor relations program to facilitate effective two-way communication with investors.
… the fact that we follow this recommendation: ☒ in our Corporate Governance Statement OR
☐ at https://www.downergroup.com/Content/cms/Documents/Board_
Policies/Communication-Policy.pdf
☐ an explanation why that is so in our Corporate Governance Statement
6.3 A listed entity should disclose the policies and processes it has in place to facilitate and encourage participation at meetings of security holders.
… our policies and processes for facilitating and encouraging participation at meetings of security holders: ☒ in our Corporate Governance Statement OR
☐ at [insert location]
☐ an explanation why that is so in our Corporate Governance Statement OR
☐ we are an externally managed entity that does not hold periodic meetings of security holders and this recommendation is therefore not applicable
For
per
sona
l use
onl
y

Appendix 4G Key to Disclosures Corporate Governance Council Principles and Recommendations
+ See chapter 19 for defined terms 2 November 2015 Page 9
Corporate Governance Council recommendation We have followed the recommendation in full for the whole of the period above. We have disclosed …
We have NOT followed the recommendation in full for the whole of the period above. We have disclosed …4
6.4 A listed entity should give security holders the option to receive communications from, and send communications to, the entity and its security registry electronically.
… the fact that we follow this recommendation: ☐ in our Corporate Governance Statement OR
☒ at 2019 Annual Report – Information for Investors
☐ an explanation why that is so in our Corporate Governance Statement
PRINCIPLE 7 – RECOGNISE AND MANAGE RISK
7.1 The board of a listed entity should: (a) have a committee or committees to oversee risk, each of
which: (1) has at least three members, a majority of whom are
independent directors; and (2) is chaired by an independent director, and disclose: (3) the charter of the committee; (4) the members of the committee; and (5) as at the end of each reporting period, the number of
times the committee met throughout the period and the individual attendances of the members at those meetings; or
(b) if it does not have a risk committee or committees that satisfy (a) above, disclose that fact and the processes it employs for overseeing the entity’s risk management framework.
[If the entity complies with paragraph (a):] … the fact that we have a committee or committees to oversee risk that comply with paragraphs (1) and (2): ☒ in our Corporate Governance Statement OR
☐ at [insert location] … and a copy of the charter of the committee:
☐ at https://www.downergroup.com/Content/cms/media/2018/PDF/B
oard/2018_06_20_Audit_and_Risk_Committee_Charter_website_version.pdf
… and the information referred to in paragraphs (4) and (5): ☐ in our Corporate Governance Statement OR
☒ at [insert location] Corporate Governance Statement 2019 Annual Report –Director’s Report
[If the entity complies with paragraph (b):] … the fact that we do not have a risk committee or committees that satisfy (a) and the processes we employ for overseeing our risk management framework:
☐ in our Corporate Governance Statement OR
☐ at [insert location]
☐ an explanation why that is so in our Corporate Governance Statement
For
per
sona
l use
onl
y

Appendix 4G Key to Disclosures Corporate Governance Council Principles and Recommendations
+ See chapter 19 for defined terms 2 November 2015 Page 10
Corporate Governance Council recommendation We have followed the recommendation in full for the whole of the period above. We have disclosed …
We have NOT followed the recommendation in full for the whole of the period above. We have disclosed …4
7.2 The board or a committee of the board should: (a) review the entity’s risk management framework at least
annually to satisfy itself that it continues to be sound; and (b) disclose, in relation to each reporting period, whether such
a review has taken place.
… the fact that board or a committee of the board reviews the entity’s risk management framework at least annually to satisfy itself that it continues to be sound: ☒ in our Corporate Governance Statement OR
☐ at [insert location] … and that such a review has taken place in the reporting period covered by this Appendix 4G: ☒ in our Corporate Governance Statement OR
☐ at [insert location]
☐ an explanation why that is so in our Corporate Governance Statement
7.3 A listed entity should disclose: (a) if it has an internal audit function, how the function is
structured and what role it performs; or (b) if it does not have an internal audit function, that fact and
the processes it employs for evaluating and continually improving the effectiveness of its risk management and internal control processes.
[If the entity complies with paragraph (a):] … how our internal audit function is structured and what role it performs: ☒ in our Corporate Governance Statement OR
☐ at [insert location] [If the entity complies with paragraph (b):] … the fact that we do not have an internal audit function and the processes we employ for evaluating and continually improving the effectiveness of our risk management and internal control processes: ☐ in our Corporate Governance Statement OR
☐ at [insert location]
☐ an explanation why that is so in our Corporate Governance Statement
7.4 A listed entity should disclose whether it has any material exposure to economic, environmental and social sustainability risks and, if it does, how it manages or intends to manage those risks.
… whether we have any material exposure to economic, environmental and social sustainability risks and, if we do, how we manage or intend to manage those risks: ☐ in our Corporate Governance Statement OR
☒ at 2019 Annual Report – Review of Operations; and 2018 Sustainability report at this location:
http://sustainability.downergroup.com/assets/pdf/Online-Sustainablility-Report_2018_DIGITAL.pdf
☐ an explanation why that is so in our Corporate Governance Statement
For
per
sona
l use
onl
y

Appendix 4G Key to Disclosures Corporate Governance Council Principles and Recommendations
+ See chapter 19 for defined terms 2 November 2015 Page 11
Corporate Governance Council recommendation We have followed the recommendation in full for the whole of the period above. We have disclosed …
We have NOT followed the recommendation in full for the whole of the period above. We have disclosed …4
PRINCIPLE 8 – REMUNERATE FAIRLY AND RESPONSIBLY
8.1 The board of a listed entity should: (a) have a remuneration committee which:
(1) has at least three members, a majority of whom are independent directors; and
(2) is chaired by an independent director, and disclose: (3) the charter of the committee; (4) the members of the committee; and (5) as at the end of each reporting period, the number of
times the committee met throughout the period and the individual attendances of the members at those meetings; or
(b) if it does not have a remuneration committee, disclose that fact and the processes it employs for setting the level and composition of remuneration for directors and senior executives and ensuring that such remuneration is appropriate and not excessive.
[If the entity complies with paragraph (a):] … the fact that we have a remuneration committee that complies with paragraphs (1) and (2): ☒ in our Corporate Governance Statement OR
☐ at [insert location] … and a copy of the charter of the committee:
☐ at https://www.downergroup.com/Content/cms/pdf/Remuneration-Committee-Charter.pdf
… and the information referred to in paragraphs (4) and (5):
☐ in our Corporate Governance Statement OR
☒ at Corporate Governance Statement 2019 Annual Report –Director’s Report
[If the entity complies with paragraph (b):] … the fact that we do not have a remuneration committee and the processes we employ for setting the level and composition of remuneration for directors and senior executives and ensuring that such remuneration is appropriate and not excessive:
☐ in our Corporate Governance Statement OR
☐ at [insert location]
☐ an explanation why that is so in our Corporate Governance Statement OR
☐ we are an externally managed entity and this recommendation is therefore not applicable
8.2 A listed entity should separately disclose its policies and practices regarding the remuneration of non-executive directors and the remuneration of executive directors and other senior executives.
… separately our remuneration policies and practices regarding the remuneration of non-executive directors and the remuneration of executive directors and other senior executives:
☐ in our Corporate Governance Statement OR
☒ at 2019 Annual Report – Remuneration Report
☐ an explanation why that is so in our Corporate Governance Statement OR
☐ we are an externally managed entity and this recommendation is therefore not applicable
For
per
sona
l use
onl
y

Appendix 4G Key to Disclosures Corporate Governance Council Principles and Recommendations
+ See chapter 19 for defined terms 2 November 2015 Page 12
Corporate Governance Council recommendation We have followed the recommendation in full for the whole of the period above. We have disclosed …
We have NOT followed the recommendation in full for the whole of the period above. We have disclosed …4
8.3 A listed entity which has an equity-based remuneration scheme should: (a) have a policy on whether participants are permitted to
enter into transactions (whether through the use of derivatives or otherwise) which limit the economic risk of participating in the scheme; and
(b) disclose that policy or a summary of it.
… our policy on this issue or a summary of it: ☐ in our Corporate Governance Statement OR
☒ at 2019 Annual Report – Remuneration Report
☐ an explanation why that is so in our Corporate Governance Statement OR
☐ we do not have an equity-based remuneration scheme and this recommendation is therefore not applicable OR
☐ we are an externally managed entity and this recommendation is therefore not applicable
ADDITIONAL DISCLOSURES APPLICABLE TO EXTERNALLY MANAGED LISTED ENTITIES
- Alternative to Recommendation 1.1 for externally managed listed entities: The responsible entity of an externally managed listed entity should disclose: (a) the arrangements between the responsible entity and the
listed entity for managing the affairs of the listed entity; (b) the role and responsibility of the board of the responsible
entity for overseeing those arrangements.
… the information referred to in paragraphs (a) and (b): ☐ in our Corporate Governance Statement OR
☐ at [insert location]
☐ an explanation why that is so in our Corporate Governance Statement
- Alternative to Recommendations 8.1, 8.2 and 8.3 for externally managed listed entities: An externally managed listed entity should clearly disclose the terms governing the remuneration of the manager.
… the terms governing our remuneration as manager of the entity: ☐ in our Corporate Governance Statement OR
☐ at [insert location]
☐ an explanation why that is so in our Corporate Governance Statement
For
per
sona
l use
onl
y