
ANALYST SITE VISIT1 February 2018
2
DISCLAIMER
This presentation is provided on a confidential basis.
The name 'Presenter' refers to Pan African Resources PLC and its advisors, subsidiaries or affiliated companies.
This presentation has not been filed, lodged, registered or approved in any jurisdiction and recipients of this document should keep themselves informed of and comply with and observe all
applicable legal and regulatory requirements.
Statements or assumptions in this presentation as to future matters may prove to be incorrect. The Presenter makes no representation or warranty as to the accuracy of such statements or
assumptions. Circumstances may change and the contents of this presentation may become outdated as a result, and the Presenter has no obligation to update the presentation or correct any
inaccuracies or omissions in this presentation.
Recipients should not treat this presentation as advice relating to legal, taxation or investment matters and are advised to consult their own professional advisers.
This presentation may not be reproduced in whole or in part, nor may any of its contents be divulged to any third party without the prior consent in writing of the Presenter.
The recipient acknowledges that neither it nor the Presenter intends that the Presenter act or be responsible as a fiduciary to the recipient, its management, stockholders, creditors or any other
person. Each of the recipient and the Presenter, by accepting and providing this presentation respectively, expressly disclaims any fiduciary relationship and agrees that the recipient is responsible
for making its own independent judgments with respect to any transaction and any other matters regarding this presentation.
Furthermore, the information contained in this presentation may also qualify as “inside information” as defined in the Securities Services Act, 36 of 2004 (“SSA”). In terms of the SSA,
it is a criminal offence for a person who knows that he or she has inside information to –
• deal directly or indirectly or through an agent for his or her own account, or for the account of another person, in listed securities to which the inside information relates;
• disclose the inside information to another other than in the proper course of a person’s employment, profession or duties; and
• encourage or cause another person to deal or discourage or stop another person from dealing in the listed securities to which the inside information relates.
The Presenter makes no representations as to the actual value which may be received in connection with a transaction nor the legal, tax or accounting effects of consummating a transaction.
Unless the expressly contemplated hereby, the information in this presentation does not take into account the effects of a possible transaction or transactions involving an actual or potential
change of control, which may have significant valuation and other effects. The Presenter shall not have any liability for any loss suffered due to reliance being placed on this presentation the
information contained herein or the oral presentations referred to.
Furthermore, the information contained in this presentation may also qualify as “inside information” as defined in the Market Abuse Regulation (“MAR”). It is a breach of MAR where a person
possesses inside information and:
• uses that information by acquiring or disposing of, for its own account or for the account of a third party, directly or indirectly, financial instruments to which that information relates; or
• discloses that information to any other person, except where the disclosure is made in the normal exercise of an employment, a profession or duties
This presentation is for information purposes only and does not constitute an offer or invitation to subscribe for or purchase any securities, and neither this presentation nor anything contained
therein nor the fact of its distribution shall form the basis or be relied on in connection with or act as any inducement to enter into any contract or commitment whatsoever.
The content of this presentation has not been approved by an authorised person within the meaning of the Financial Services and Markets Act 2000 (“FSMA”). Reliance on this presentation for the
purposes of engaging in investment activity may expose an individual to a significant risk of losing all of the property or other assets invested.
This presentation is only being distributed and made available to persons of the kind described in Article 19(5) (investment professionals) and Article 49(2) (high net worth companies,
unincorporated associations, etc.) of Part IV of the Financial Services and Markets Act 2000 (Financial Promotion) Order 2001 (“FPO”). Persons who do not have professional experience in
matters relating to investment or who are not persons to whom Article 49 of the FPO applies should not rely upon this presentation. Persons who do not fall within one of the categories of
persons described above should not rely on the presentation nor take any action upon the presentation, but should return the presentation immediately to the Company.

3
CONTENTS
› PAR Group Update (CL)
› Barberton Mines presentation (BvdB)
› Barberton Mines update
– History (CS/RlR)
– Production Update (CL)
– Safety Performance (BvdB)
– Projects (BvdB)
› Evander Gold Mine update
– Production Update (CL)
– Production Sustainability (BvdB)
– Other Initiatives (BvdB)
– Safety Performance (BvdB)
– Projects (BvdB)
PAR GROUP UPDATE
Cobus Loots, CEO

5
PAR GROUP – PRODUCTION UPDATE
6 months
ended 31
December
2012
6 months
ended 31
December
2013
6 months
ended 31
December
2014
6 months
ended 31
December
2015
6 months
ended 31
December
2016
6 months
ended 31
December
2017
Tailings (oz) - 11,603 11,710 21,810 30,665 20,389
Surface (oz) 783 4,223 7,908 129 - -
Underground (oz) 44,143 84,345 67,057 79,857 60,948 64,893
-
20,000
40,000
60,000
80,000
100,000
120,000
Ou
nces
6
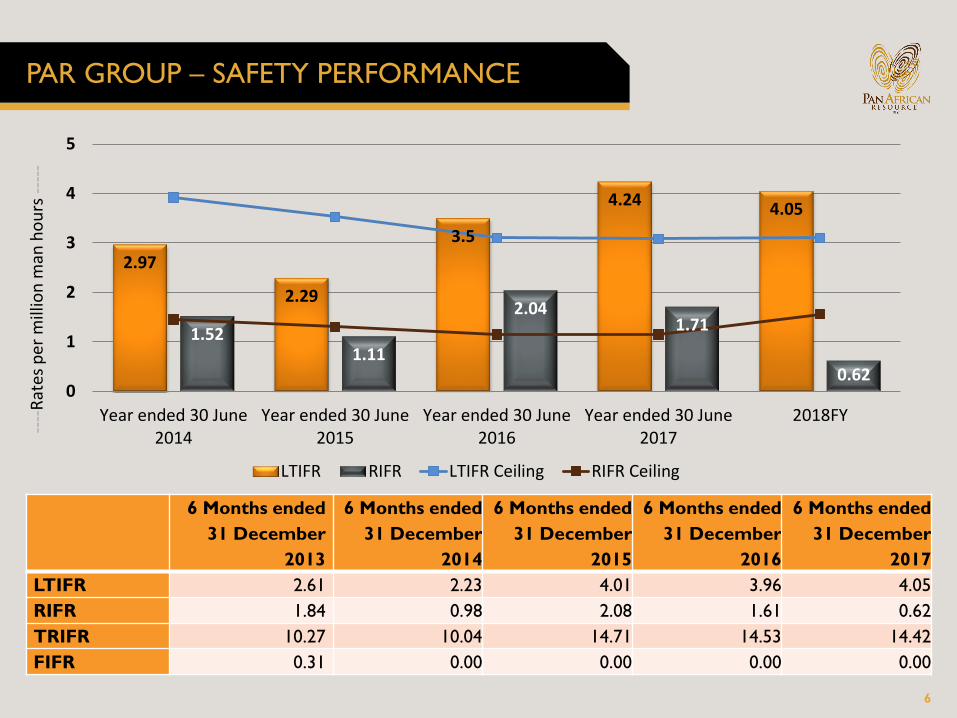
PAR GROUP – SAFETY PERFORMANCE
2.97
2.29
3.5
4.244.05
1.521.11
2.041.71
0.620
1
2
3
4
5
Year ended 30 June2014
Year ended 30 June2015
Year ended 30 June2016
Year ended 30 June2017
2018FY
LTIFR RIFR LTIFR Ceiling RIFR Ceiling
----
Rat
es p
er m
illio
n m
an h
ou
rs -
----
6 Months ended
31 December
2013
6 Months ended
31 December
2014
6 Months ended
31 December
2015
6 Months ended
31 December
2016
6 Months ended
31 December
2017
LTIFR 2.61 2.23 4.01 3.96 4.05
RIFR 1.84 0.98 2.08 1.61 0.62
TRIFR 10.27 10.04 14.71 14.53 14.42
FIFR 0.31 0.00 0.00 0.00 0.00

BML
PRESENTATION
Casper Strydom, General Manager
Roelf le Roux, Mineral Resource
Manager
8
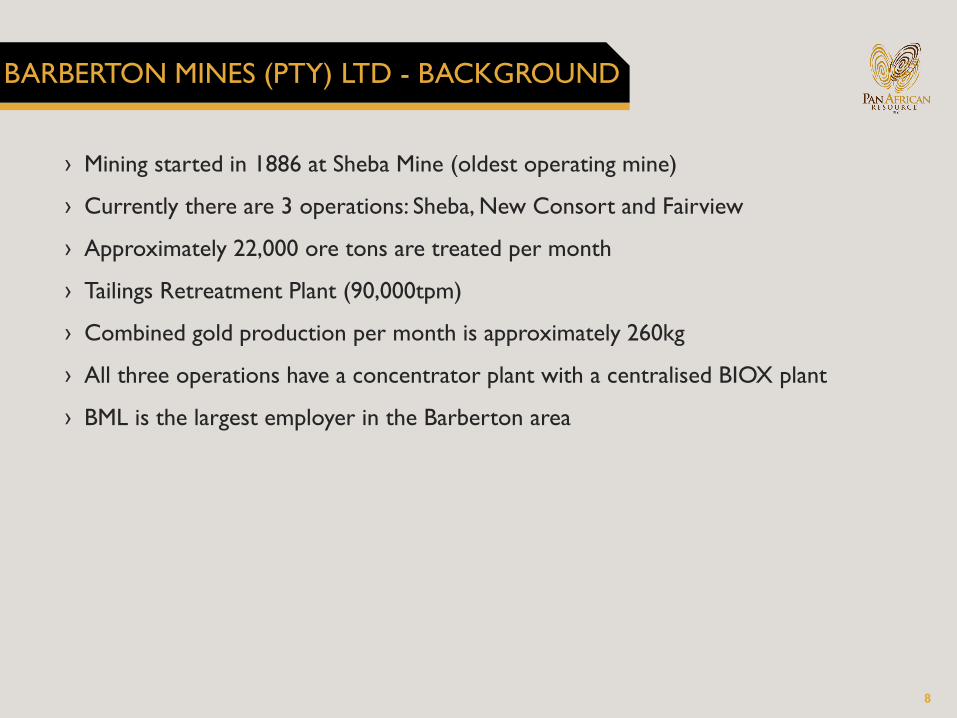
BARBERTON MINES (PTY) LTD - BACKGROUND
› Mining started in 1886 at Sheba Mine (oldest operating mine)
› Currently there are 3 operations: Sheba, New Consort and Fairview
› Approximately 22,000 ore tons are treated per month
› Tailings Retreatment Plant (90,000tpm)
› Combined gold production per month is approximately 260kg
› All three operations have a concentrator plant with a centralised BIOX plant
› BML is the largest employer in the Barberton area
9
BML – HISTORY
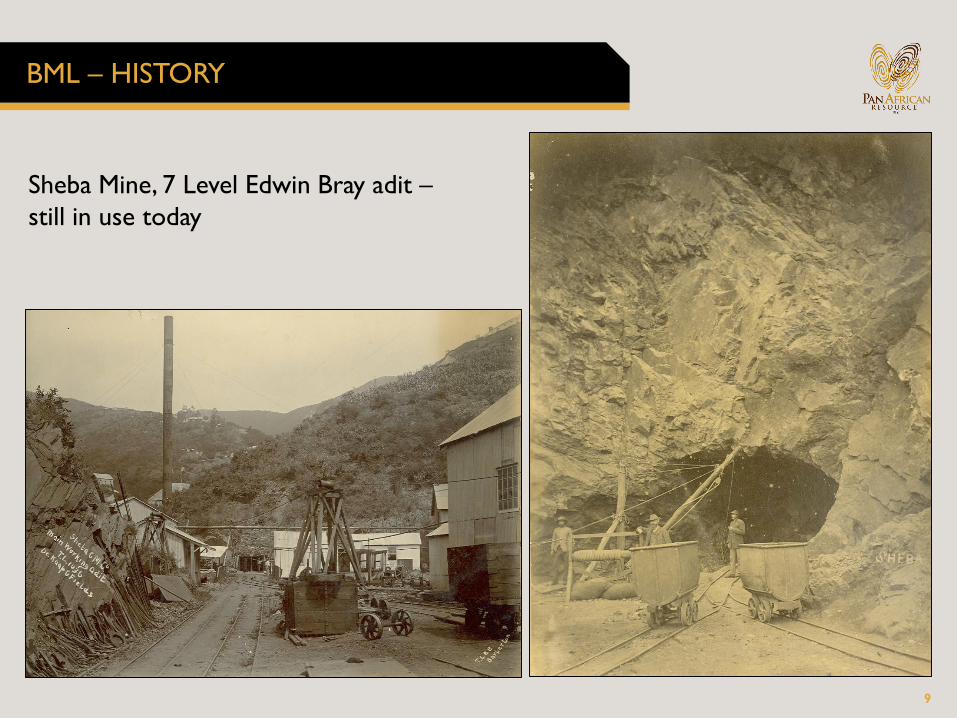
Sheba Mine, 7 Level Edwin Bray adit –
still in use today

10
BML – HISTORY
Sheba mine, with the Soper shaft in the foreground

11
BML – HISTORY
The central mill at Barberton, near Rimer’s
Creek. The small workings could bring there
ore here to be toll treated.
06-463-41 Sheba GMCo generating station
12
BML – HISTORY
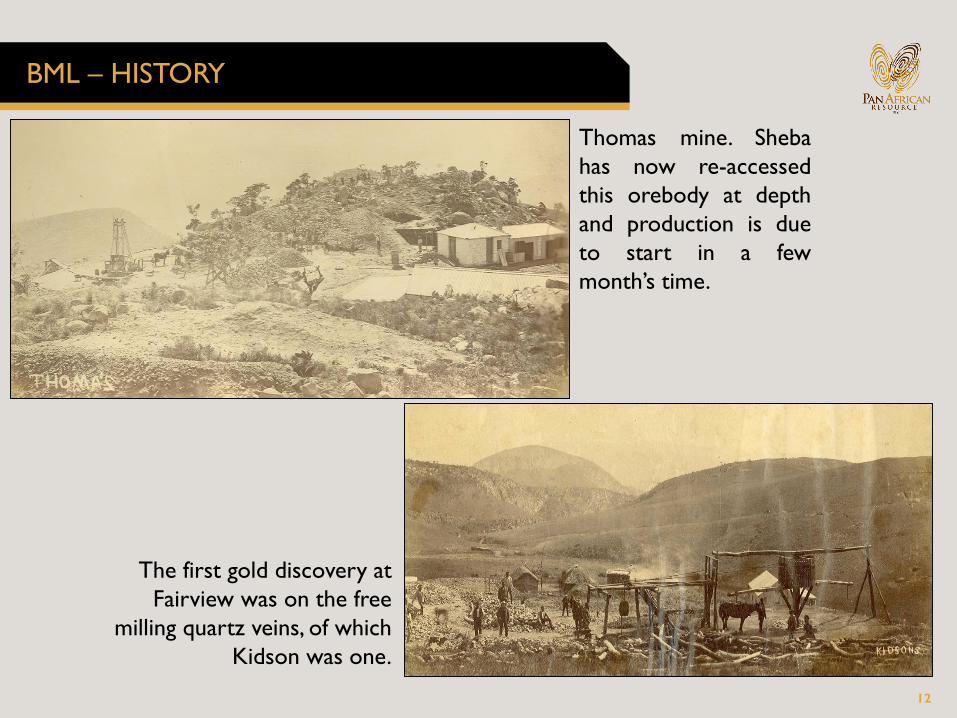
Thomas mine. Sheba
has now re-accessed
this orebody at depth
and production is due
to start in a few
month’s time.
The first gold discovery at
Fairview was on the free
milling quartz veins, of which
Kidson was one.
13
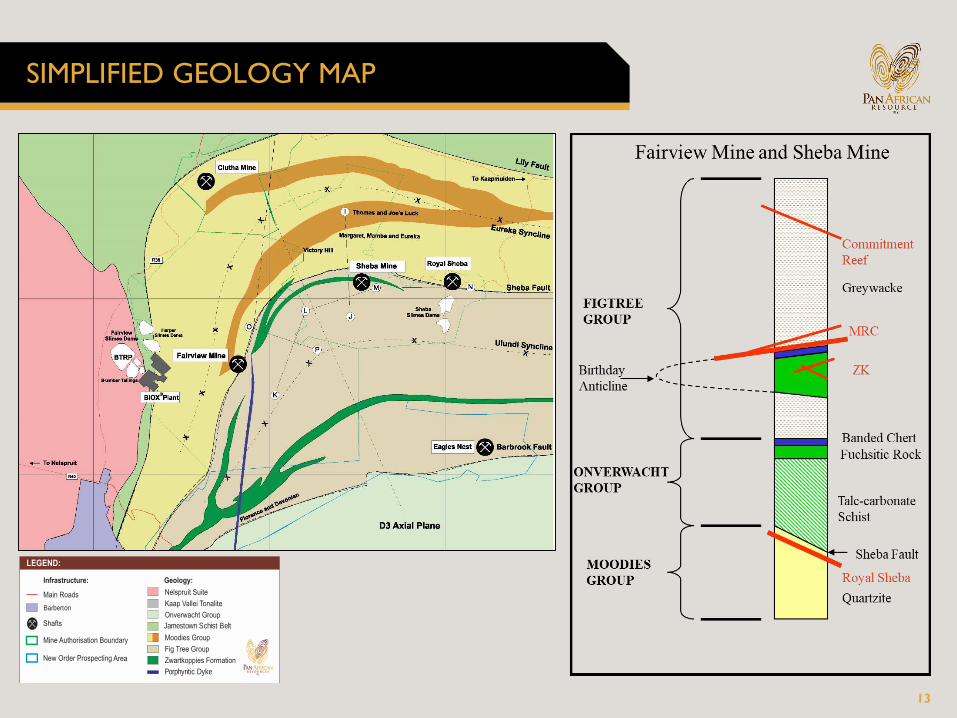
SIMPLIFIED GEOLOGY MAP
Barberton
Porphyritic Dyke
Jamestown Schist Belt
14
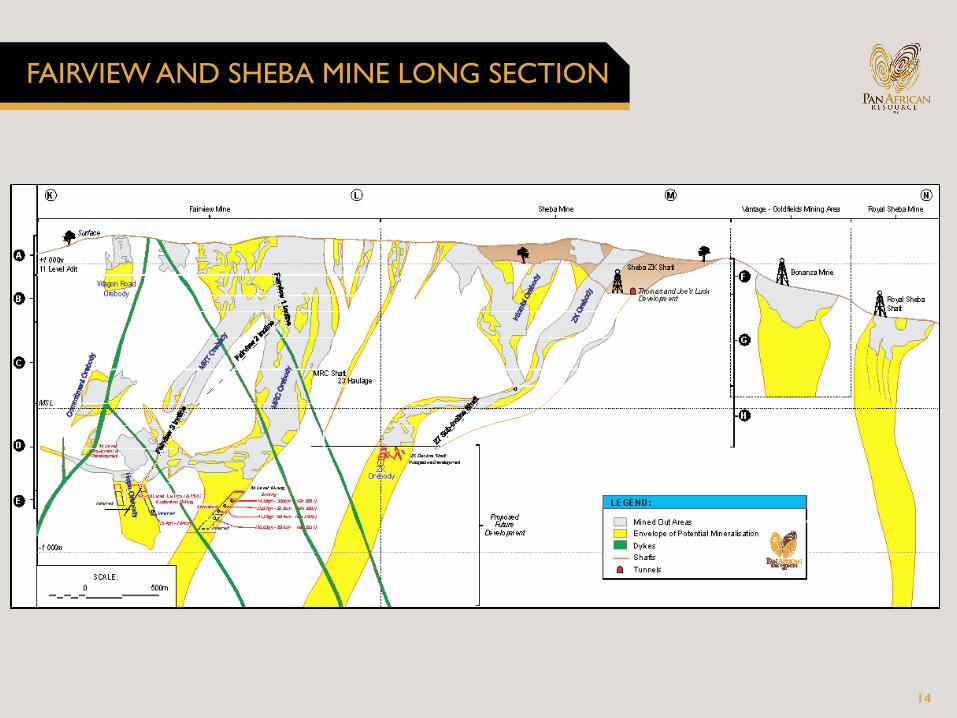
FAIRVIEW AND SHEBA MINE LONG SECTION
15
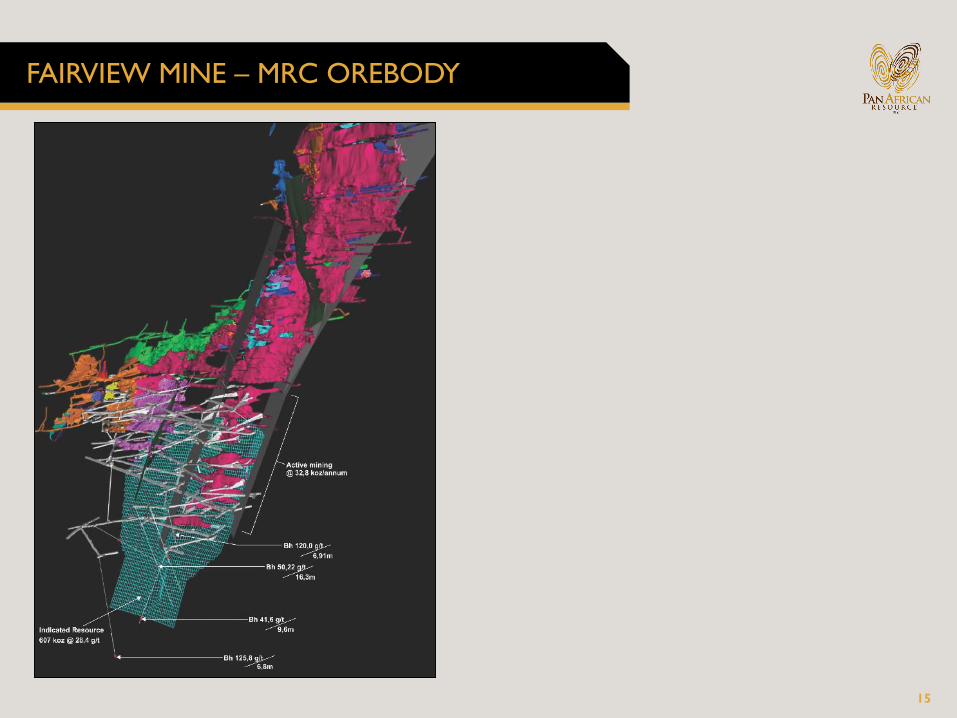
FAIRVIEW MINE – MRC OREBODY
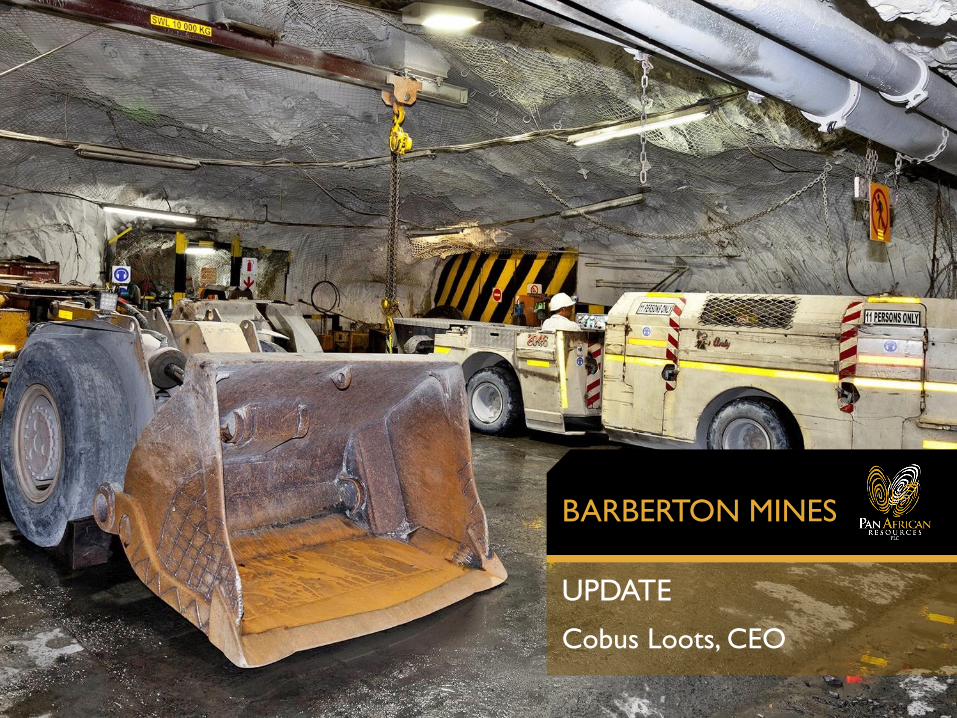
BARBERTON MINES
UPDATE
Cobus Loots, CEO

17
BML – PRODUCTION UPDATE
6 months ended 31
December 2013
6 months ended 31
December 2014
6 months ended 31
December 2015
6 months ended 31
December 2016
6 months ended 31
December 2017
BTRP 11,603 11,710 12,830 14,741 8,452
Surface 349 76 130 - -
Underground 45,056 41,155 43,486 34,471 32,159
-
10,000
20,000
30,000
40,000
50,000
60,000
70,000
oz

18
BML – UNDERGROUND PRODUCTION UPDATE
-
2.0
4.0
6.0
8.0
10.0
12.0
0
20,000
40,000
60,000
80,000
100,000
120,000
140,000
160,000
180,000
6 monthsended 31 Dec
2012
6 monthsended 31 Dec
2013
6 monthsended 31 Dec
2014
6 monthsended 31 Dec
2015
6 monthsended 31 Dec
2016
6 monthsended 31 Dec
2017
Head
Gra
de (
g/t)
Tonnes
Mill
ed (
t)
Fairview Sheba Consort Vamping Tons Head Grade

19
BML – SAFETY PERFORMANCE
1.85 1.87 1.862.05 1.96
0.46 0.62 0.62 0.58 00
1
2
3
4
Year ended 30 June2014
Year ended 30 June2015
Year ended 30 June2016
Year ended 30 June2017
2018FY
LTIFR RIFR LTIFR Ceiling RIFR Ceiling
----
-Rat
es p
er m
illio
n m
an h
ou
rs -
6 Months ended
31 December
2013
6 Months ended
31 December
2014
6 Months ended
31 December
2015
6 Months ended
31 December
2016
6 Months ended
31 December
2017
LTIFR 1.56 1.22 2.47 2.07 1.96
RIFR 0.94 0.00 0.62 0.59 0.00
TRIFR 15.59 12.93 14.81 12.40 13.19
FIFR 0.62 0.00 0.00 0.00 0.00
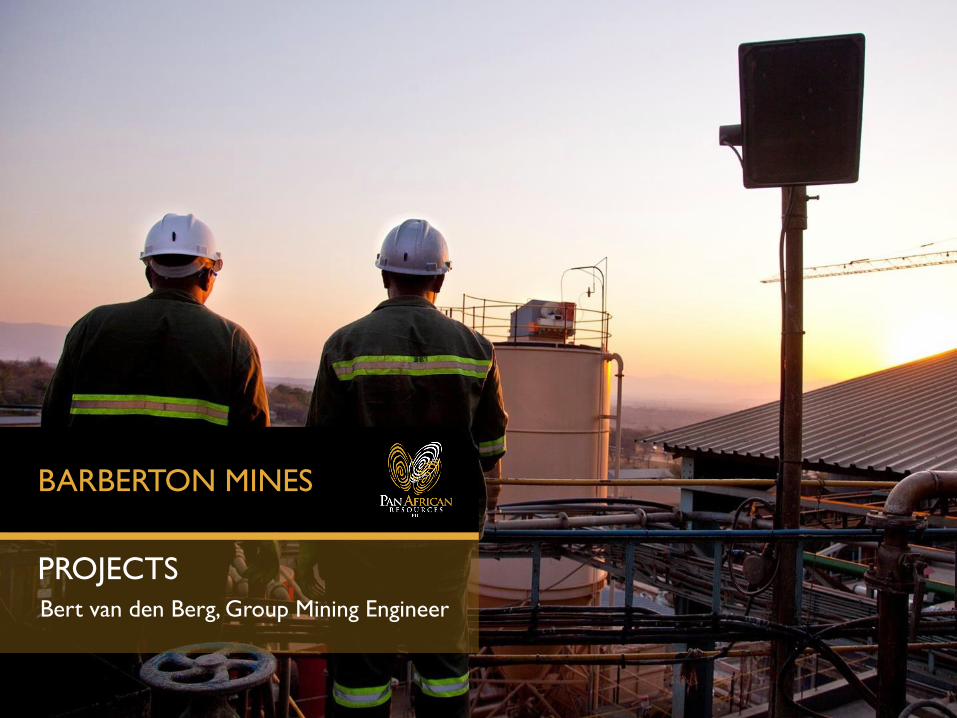
BARBERTON MINES
PROJECTS
Bert van den Berg, Group Mining Engineer

21
BML PROJECTS - FAIRVIEW SUB-VERTICAL SHAFT
Phase 2
Phase 1 has started and scheduled
for completion at end of Feb 2020
Sheba mine deepest level
100m
Planned access development
22
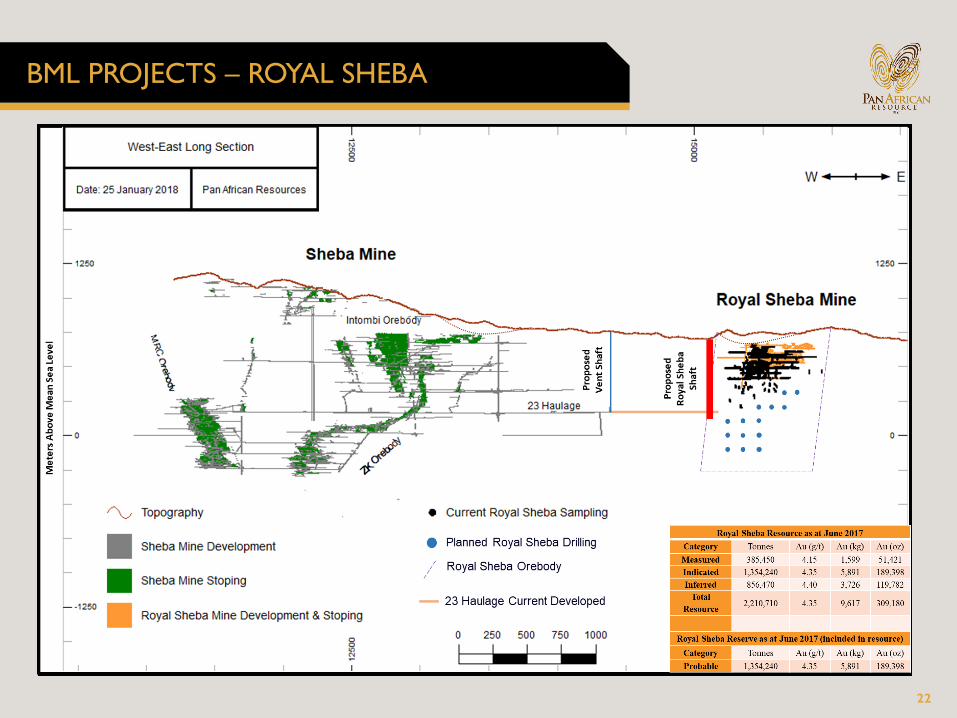
BML PROJECTS – ROYAL SHEBA
23
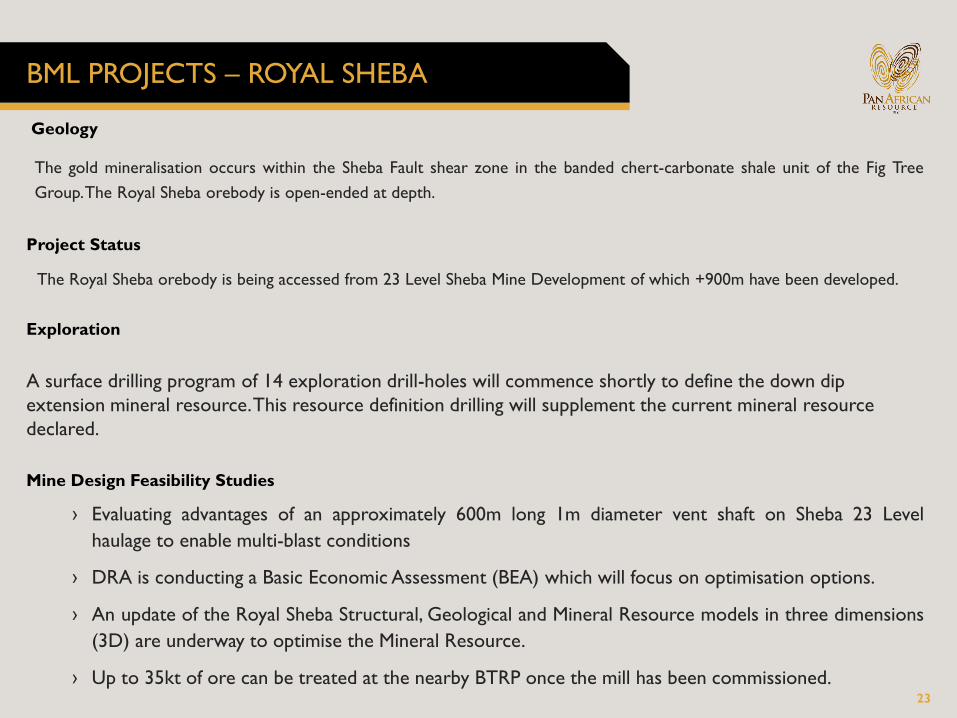
Geology
The gold mineralisation occurs within the Sheba Fault shear zone in the banded chert-carbonate shale unit of the Fig Tree
Group.The Royal Sheba orebody is open-ended at depth.
Project Status
The Royal Sheba orebody is being accessed from 23 Level Sheba Mine Development of which +900m have been developed.
Exploration
A surface drilling program of 14 exploration drill-holes will commence shortly to define the down dip
extension mineral resource. This resource definition drilling will supplement the current mineral resource
declared.
Mine Design Feasibility Studies
› Evaluating advantages of an approximately 600m long 1m diameter vent shaft on Sheba 23 Level
haulage to enable multi-blast conditions
› DRA is conducting a Basic Economic Assessment (BEA) which will focus on optimisation options.
› An update of the Royal Sheba Structural, Geological and Mineral Resource models in three dimensions
(3D) are underway to optimise the Mineral Resource.
› Up to 35kt of ore can be treated at the nearby BTRP once the mill has been commissioned.
BML PROJECTS – ROYAL SHEBA
24
BML PROJECTS – BARBERTON EXPLORATION
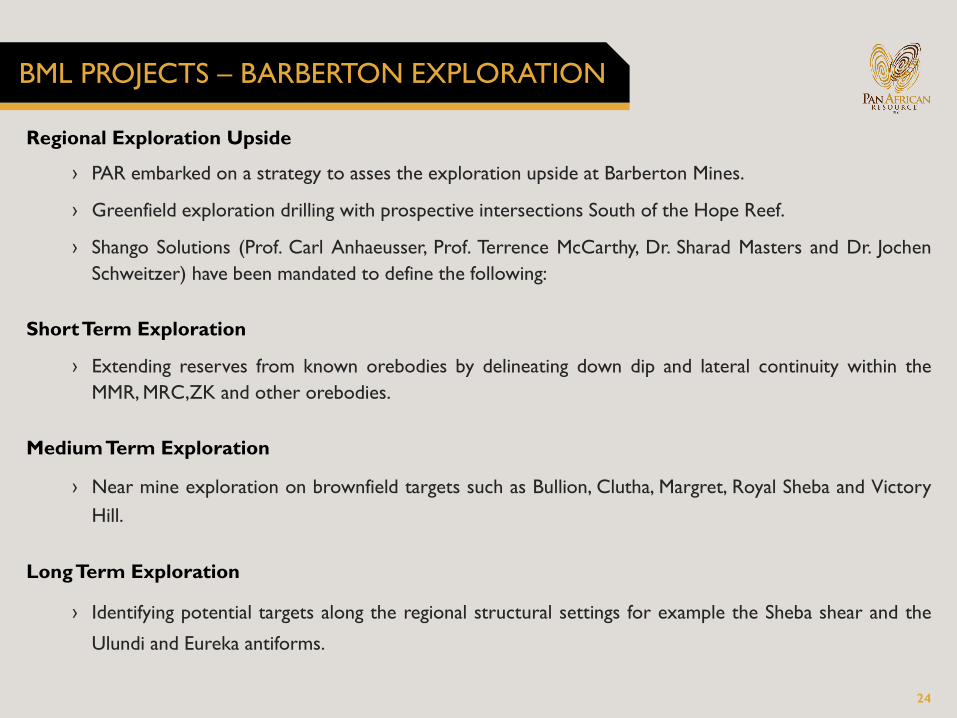
Regional Exploration Upside
› PAR embarked on a strategy to asses the exploration upside at Barberton Mines.
› Greenfield exploration drilling with prospective intersections South of the Hope Reef.
› Shango Solutions (Prof. Carl Anhaeusser, Prof. Terrence McCarthy, Dr. Sharad Masters and Dr. Jochen
Schweitzer) have been mandated to define the following:
Short Term Exploration
› Extending reserves from known orebodies by delineating down dip and lateral continuity within the
MMR, MRC,ZK and other orebodies.
Medium Term Exploration
› Near mine exploration on brownfield targets such as Bullion, Clutha, Margret, Royal Sheba and Victory
Hill.
Long Term Exploration
› Identifying potential targets along the regional structural settings for example the Sheba shear and the
Ulundi and Eureka antiforms.

25
BML PROJECTS – BTRP REGRIND MILL
› Installation of a 1.6 MW regrind mill to facilitate treatment of coarse material
› DRA appointed to install the mill
› Timing – completed by end April 2018
› Benefit – gold production improvement from current 35kg/month to 50kg/month
› Versatility of mill will allow conversion to ROM mill for Royal Sheba with limited capital outlay

EVANDER MINES
UPDATE
Cobus Loots, CEO
27
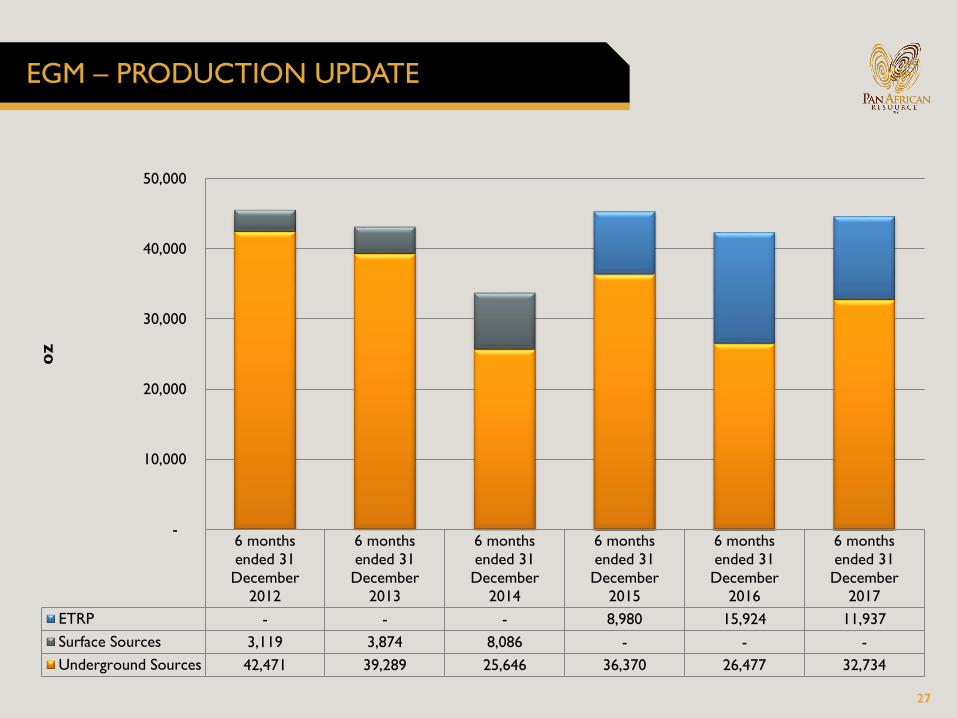
EGM – PRODUCTION UPDATE
6 months
ended 31
December
2012
6 months
ended 31
December
2013
6 months
ended 31
December
2014
6 months
ended 31
December
2015
6 months
ended 31
December
2016
6 months
ended 31
December
2017
ETRP - - - 8,980 15,924 11,937
Surface Sources 3,119 3,874 8,086 - - -
Underground Sources 42,471 39,289 25,646 36,370 26,477 32,734
-
10,000
20,000
30,000
40,000
50,000
oz

28
EGM – PRODUCTION – 8 SHAFT M2
3666
5596
5001
3177
4488
2525
3199
2439
0 0
6263
6914
6091 6273
5114
6312
5122
3491
0
1000
2000
3000
4000
5000
6000
7000
8000
8# Strat Plan m²
29
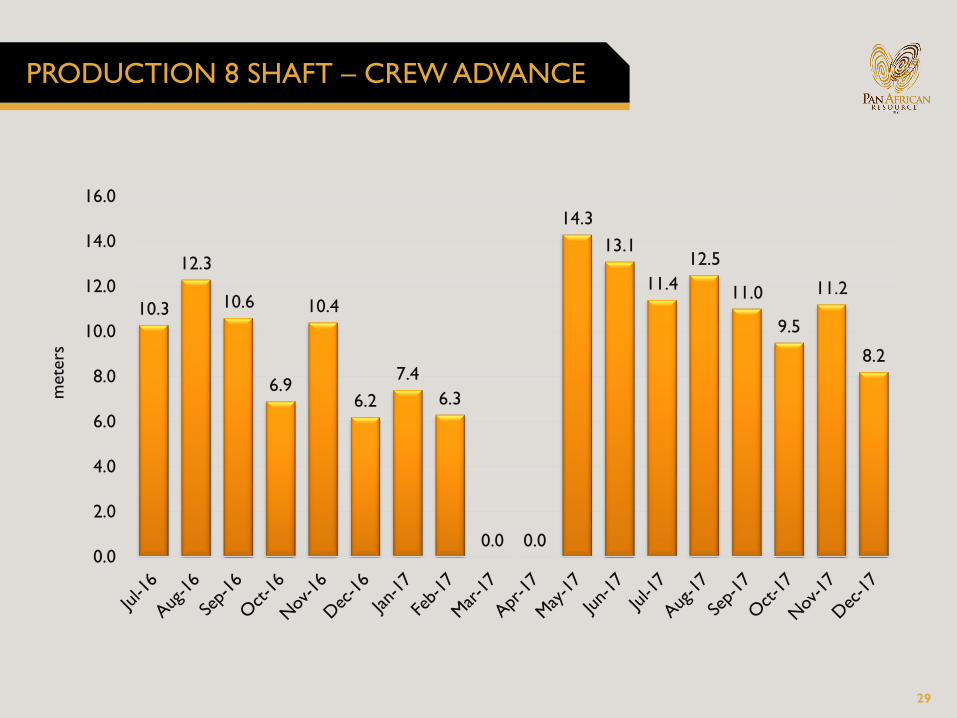
PRODUCTION 8 SHAFT – CREW ADVANCE
10.3
12.3
10.6
6.9
10.4
6.2
7.4
6.3
0.0 0.0
14.3
13.1
11.4
12.5
11.0
9.5
11.2
8.2
0.0
2.0
4.0
6.0
8.0
10.0
12.0
14.0
16.0
mete
rs
30
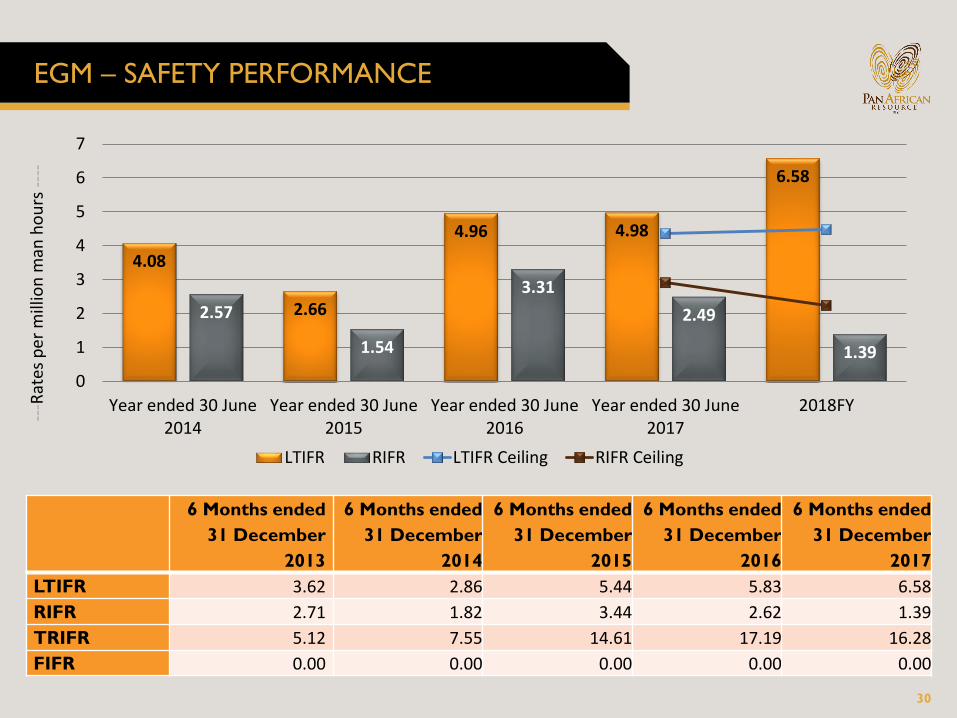
EGM – SAFETY PERFORMANCE
4.08
2.66
4.96 4.98
6.58
2.57
1.54
3.31
2.49
1.39
0
1
2
3
4
5
6
7
Year ended 30 June2014
Year ended 30 June2015
Year ended 30 June2016
Year ended 30 June2017
2018FY
LTIFR RIFR LTIFR Ceiling RIFR Ceiling
---R
ates
per
mill
ion
man
ho
urs
---
-
6 Months ended
31 December
2013
6 Months ended
31 December
2014
6 Months ended
31 December
2015
6 Months ended
31 December
2016
6 Months ended
31 December
2017
LTIFR 3.62 2.86 5.44 5.83 6.58
RIFR 2.71 1.82 3.44 2.62 1.39
TRIFR 5.12 7.55 14.61 17.19 16.28
FIFR 0.00 0.00 0.00 0.00 0.00
31
EGM – PRODUCTION SUSTAINABILITY
Mining and cost optimisation initiatives
› Appointed experienced mining professionals capable of executing clean mining
program
› MCF improvement
› Stope width reduction
› Old gold project
› Blast frequency improvement
Cost curtailment
› Right-sizing programme:
– Monthly payroll cost reduction of ZAR9.5 million
– Reduction of 628 employees, retrenchment cost totalled ZAR39.8 million
– Reduction of 147 contractors
› Power supply
– Electricity usage reduction initiatives investigated and implemented
– Eskom busy refurbishing the power network
32
UndergroundWaste Management
– Roll-out meeting held in January 2018
– Concept and action plan to be completed by 9 February 2018
– Project benefits:
» Reduce amount of waste to be hoisted and processed
» Increase shaft head grade by approximately 10%
» Improve ventilation efficiencies by sealing off all areas
Old Gold - Evander 8 Shaft
– Vacuuming of mud mechanically in to bags ( +/- 1ton weeping) with mud pumps
– Manual loading of mud into 50kg bags from remote areas and x/cuts
– Introduced 4 x vamping crews doing gullies and old areas that is accessible
– Apply “Extreme Recovery” in 9-15m directly behind operating crews
– Belt cleaning below belts to address fines – directly onto belts
– More concentration on the Mud Pumping directly to the plant
– Dozing of “Extreme Recovery” from surface into water supply system
– Dredging project on Hot Well dams on Surface – Sludged-up Cascade dams opportunity
– Concentration project for roll-out underground to catch liberated free gold in system
EGM PROJECTS - OTHER INITIATIVES
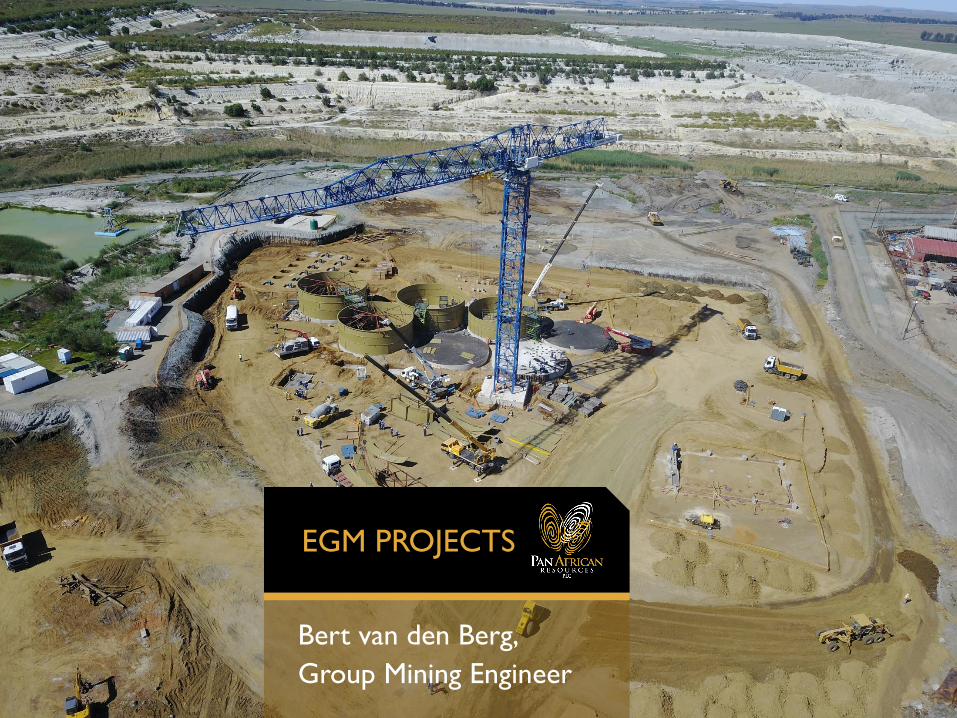
EGM PROJECTS
Bert van den Berg,
Group Mining Engineer
34
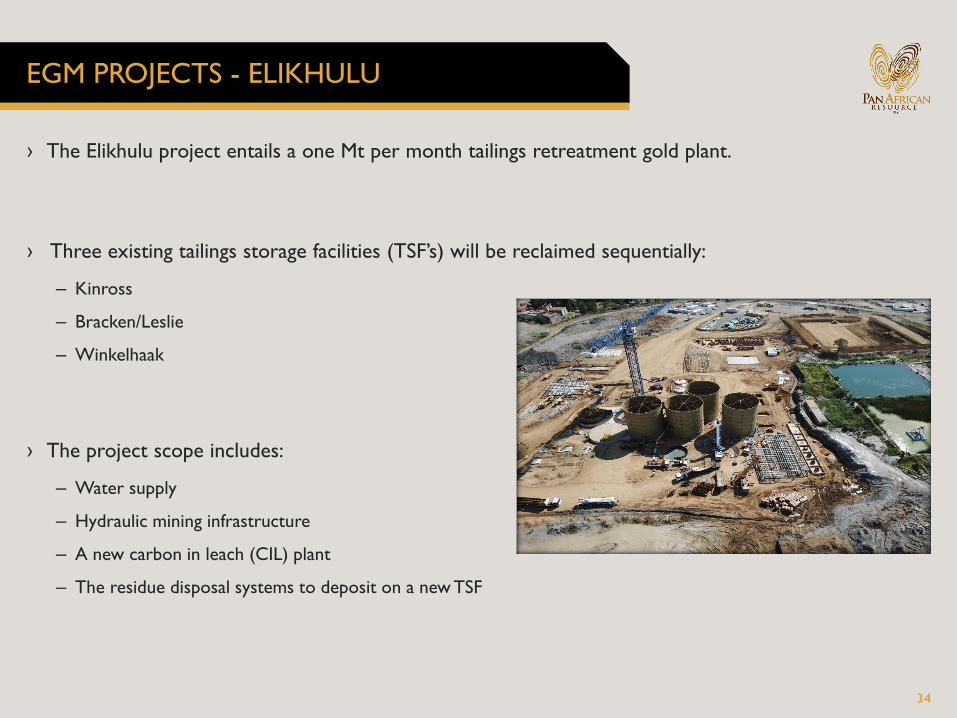
EGM PROJECTS - ELIKHULU
› The Elikhulu project entails a one Mt per month tailings retreatment gold plant.
› Three existing tailings storage facilities (TSF’s) will be reclaimed sequentially:
– Kinross
– Bracken/Leslie
– Winkelhaak
› The project scope includes:
– Water supply
– Hydraulic mining infrastructure
– A new carbon in leach (CIL) plant
– The residue disposal systems to deposit on a new TSF

35
EGM PROJECTS - ELIKHULU OVERVIEW
36
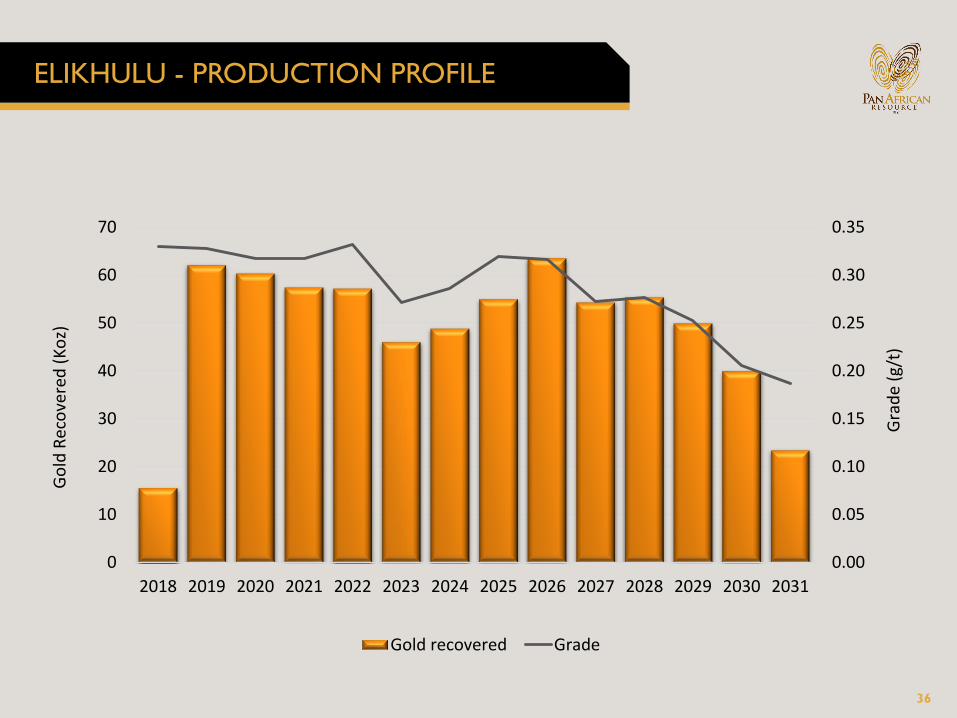
ELIKHULU - PRODUCTION PROFILE
0.00
0.05
0.10
0.15
0.20
0.25
0.30
0.35
0
10
20
30
40
50
60
70
2018 2019 2020 2021 2022 2023 2024 2025 2026 2027 2028 2029 2030 2031
Gold recovered Grade
Go
ld R
eco
vere
d (
Ko
z)
Gra
de
(g/t
)

37
ELIKHULU - FINANCIALS
INVESTMENT METRICSDescription
US$ 1,180/oz @
R 14.50:US$ 1
US$ 1,250/oz @
R 14.50:US$ 1Project NPV
7% R 1,409 million R 1,709 million
8% R 1,253 million R 1,535 million
9% R 1,111 million R 1,376 million
10% R 981 million R 1,231 million
Project RATIRR% 23.3% 26.5%
Payback (post commissioning) 39 months 36 months
Peak debt ratio 53% 53%
Shareholder RATIRR%(1) 24.8% 27.4%
FREE CASHFLOWR’million
31 Dec
17
31 Dec
18
31 Dec
19
31 Dec
20
31 Dec
21
31 Dec
22
Thereafter Total
Revenue - 265.91 1,061.92 1,032.06 981.95 978.40 7,461.45 11,781.70
Operating costs - (83.41) (332.55) (335.72) (339.37) (336.75) (2,966.24) (4,394.05)
Capital costs (704.04) (1,051.07) (64.38) (168.72) (273.07) (64.38) (670.96) (2,996.64)
Royalties & tax - 0.24 0.93 0.90 (44.07) (173.36) (1,123.11) (1,338.48)
TOTAL (704.04) (868.33) 665.92 528.52 325.44 403.91 2,701.13 3,052.54

38
EGM PROJECTS - ELIKHULU UPDATE
› Construction progressing well ahead of schedule.
› Current indication is completion date of 1 August 2018 is achievable which is full monthahead of schedule.
› Project team working on ways to earlier completion than 1 August 2018.
› Overall project completion is 61% against planned completion of 50%.
› Current project expenditure is R682 million and are forecasting an overall savings onapproved capital budget.
› The following remain risks to the scheduled completion of the project and are currentlywell managed by project team:
– Adverse weather conditions particularly higher than normal rain fall
» The team has accelerated the completion of drainage and storm water management systemsduring the dry period such that construction can safely proceed shortly after an abnormalrainstorm.
– Community unrest
» Project has concluded working agreements with key community stakeholders andcommenced with two community based project.

39
ELIKHULU – PROGRESS CURVE
0%
10%
20%
30%
40%
50%
60%
70%
80%
90%
100%
25-N
ov-
16
25-D
ec-
16
25-J
an-1
7
25-F
eb-1
7
25-M
ar-1
7
25-A
pr-
17
25-M
ay-1
7
25-J
un-1
7
25-J
ul-17
25-A
ug-
17
25-S
ep-1
7
25-O
ct-1
7
25-N
ov-
17
25-D
ec-
17
25-J
an-1
8
25-F
eb-1
8
25-M
ar-1
8
25-A
pr-
18
25-M
ay-1
8
25-J
un-1
8
25-J
ul-18
25-A
ug-
18
25-S
ep-1
8
25-O
ct-1
8
Early Curve Late Curve Actual
40
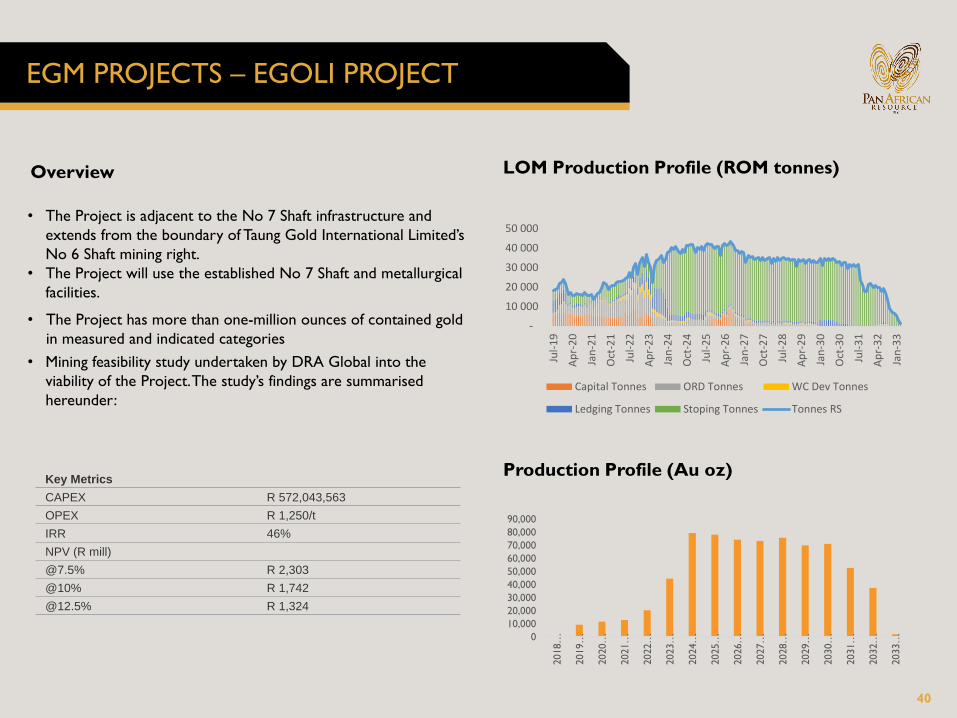
EGM PROJECTS – EGOLI PROJECT
• The Project is adjacent to the No 7 Shaft infrastructure and
extends from the boundary of Taung Gold International Limited’s
No 6 Shaft mining right.
• The Project will use the established No 7 Shaft and metallurgical
facilities.
• The Project has more than one-million ounces of contained gold
in measured and indicated categories
• Mining feasibility study undertaken by DRA Global into the
viability of the Project. The study’s findings are summarised
hereunder:
-
10 000
20 000
30 000
40 000
50 000
Jul-
19
Ap
r-2
0
Jan
-21
Oct
-21
Jul-
22
Ap
r-2
3
Jan
-24
Oct
-24
Jul-
25
Ap
r-2
6
Jan
-27
Oct
-27
Jul-
28
Ap
r-2
9
Jan
-30
Oct
-30
Jul-
31
Ap
r-3
2
Jan
-33
Capital Tonnes ORD Tonnes WC Dev Tonnes
Ledging Tonnes Stoping Tonnes Tonnes RS
0
10,000
20,000
30,000
40,000
50,000
60,000
70,000
80,000
90,000
2018…
2019…
2020…
2021…
2022…
2023…
2024…
2025…
2026…
2027…
2028…
2029…
2030…
2031…
2032…
2033…
Key Metrics
CAPEX R 572,043,563
OPEX R 1,250/t
IRR 46%
NPV (R mill)
@7.5% R 2,303
@10% R 1,742
@12.5% R 1,324
Overview LOM Production Profile (ROM tonnes)
Production Profile (Au oz)

41
EGM PROJECTS – EGOLI PROJECT
Resource
Category
Dip Area
(m2)
Volume
(m3)
Tonnes
(Mt)
Gold
(Kg)
Gold
(Koz)
Grade
(g/t)
Block
Width
(cm)
Grade
(cmg/t)
SG
(t/m3)
Measured 121,139 133,253 0.361 3,238 104 8.97 110 986 2.71
Indicated 980,069 1,078,076 2.922 28,828 927 9.87 110 1,085 2.71
Total M&I 1,101,208 1,211,329 3.283 32,066 1,031 9.77 110 1,074 2.71
Inferred 2,054,214 2,259,636 6.124 59,628 1,917 9.74 110 1,071 2.71
Grand Total 3,155,422 3,470,965 9.406 91,693 2,948 9.75 110 1,072 2.71
Notes:
Mineral Resources are reported in accordance with the SAMREC guidelines. Mineral Resources would be the same if they are reported according to the
guidelines of JORC. Cut-off values are reported applying a gold price of ZAR600,000/kg (US$1,370/oz and ZAR13.62/US$1). Mineral Resources are reported
inclusive of mineral reserves. All mineral resources exclude geological structures, regional pillars, middling pillars, safety pillars and shaft pillars. Mineral
Resources are reported as in-situ tonnes. Any discrepancies in totals are due to rounding.
The following tonnage discount factors have been applied:
- Geological loss of 2% for the Measured Category
- Geological loss of 2% for the Indicated Category
- Geological loss of 5% for the Inferred Category
Additional effects of mining and recovery losses have been considered in the cut-off grade calculations.

42
EGM PROJECTS – EGOLI PROJECT
Gold accumulation trends for Evander Gold Mines

43
EGM PROJECTS – EGOLI PROJECT

44
Stoping Area
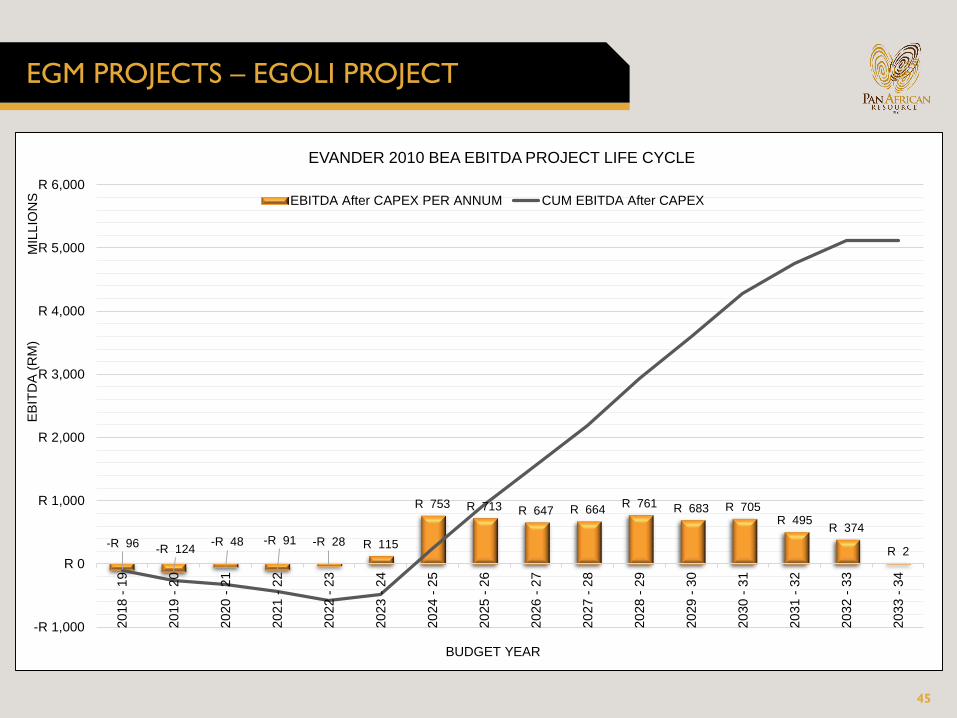
EGM PROJECTS – EGOLI PROJECT
45
-R 96-R 124
-R 48 -R 91 -R 28 R 115
R 753 R 713 R 647 R 664R 761 R 683 R 705
R 495R 374
R 2
-R 1,000
R 0
R 1,000
R 2,000
R 3,000
R 4,000
R 5,000
R 6,000
20
18 -
19
20
19 -
20
20
20 -
21
20
21 -
22
20
22 -
23
20
23 -
24
20
24 -
25
20
25 -
26
20
26 -
27
20
27 -
28
20
28 -
29
20
29 -
30
20
30 -
31
20
31 -
32
20
32 -
33
20
33 -
34
EB
ITD
A (
RM
)M
ILLIO
NS
BUDGET YEAR
EVANDER 2010 BEA EBITDA PROJECT LIFE CYCLE
EBITDA After CAPEX PER ANNUM CUM EBITDA After CAPEX
EGM PROJECTS – EGOLI PROJECT

THANK YOU


