Download - DMW Management Presentation

1
DMW
Management
Presentation
October 12, 2021

2
Disclaimer
The information in this document has been prepared by D.M. Wenceslao & Associates, Incorporated (“DMW”) and does not constitute a recommendation regarding the securities of DMW. The statements
contained in this document speak only as at the date as of which they are made, and DMW expressly disclaims any obligation or undertaking to supplement, amend or disseminate any updates or revisions
to any statements contained herein to reflect any change in events, conditions or circumstances on which any such statements are based. This presentation may not be all-inclusive and may not contain
all the information that you may consider material. By preparing this presentation, none of DMW, its management, its advisers or any of their respective affiliates, shareholders, directors, employees,
agents or advisers undertakes any obligation to provide the recipient with access to any additional information or to update this presentation or any additional information or to correct any inaccuracies in
any such information which may become apparent. None of DMW, any of its advisers or any of their respective affiliates, shareholders, directors, employees, agents or advisers makes any expressed or
implied representation or warranty as to the accuracy and completeness of the information contained herein and none of them shall accept any responsibility or liability (including any third party liability)
for any loss or damage, whether or not arising from any error or omission in compiling such information or as a result of any party’s reliance or use of such information. The information and opinions in this
presentation are subject to change without notice.
This presentation contains certain “forward-looking statements”. Forward-looking statements may include words or phrases such as DMW or any of its business components, or its management “believes”,
“expects”, “anticipates”, “intends”, “plans”, “foresees”, or other words or phrases of similar import. Similarly, statements that describe DMW's objectives, plans or goals both for itself and for any of its
business components also are forward-looking statements. All such forward-looking statements are subject to certain risks and uncertainties that could cause actual results to differ materially from those
contemplated by the relevant forward-looking statement. Such forward-looking statements are made based on management’s current expectations or beliefs as well as assumptions made by, and
information currently available to, management. Neither DMW nor any of its advisers assumes any responsibility to update forward-looking statements or to adapt them to future events or developments.
These forward-looking statements speak only as at the date of this presentation and nothing contained in this presentation is or should be relied upon as a promise or representation as to the future. There
is no obligation to update or revise any forward-looking statements, whether as a result of new information, future events or otherwise. You should not place undue reliance on these forward- looking
statements.
This presentation does not constitute a prospectus, offering circular or other offering memorandum in whole or in part. This presentation does not form part of and should not be construed as an offer to
sell or issue or the solicitation of an offer to buy or acquire securities of DMW or any of its subsidiaries or affiliates in any jurisdiction or as an inducement to enter into investment activity. No part of this
presentation, nor the fact of its distribution, should form the basis of, or be relied on in connection with, any contract or commitment or investment decision whatsoever. This document is not financial,
legal, tax or other product advice. There shall be no sale of any of DMW's securities in any state or jurisdiction in which such offer, solicitation or sale would be unlawful prior to qualification under
securities laws of such state or jurisdiction. This presentation must not be distributed to the press or any media organization.

3
Key Presenters
Delfin Angelo C. WenceslaoChief Executive Officer
Heherson M. AsiddaoChief Finance Officer
Julius GuevaraVP for Corporate Planning
Jeffrey LuceroInvestor Relations Officer

44
4 Company Background
8 Economic Backdrop and Property Market Overview
13 Key Investment Highlights
34 Business Strategies
42 Financial Highlights
50 COVID-19 Response

5
COMMERCIAL CONSTRUCTION
56 YEARS IN BUSINESS
71 HAS. LANDBANK
MARKET CAPITALIZATION*
Other Businesses
RESIDENTIAL
*as of September 2021
**Colliers’ valuation as of October 2020. Valuation of Assets in Aseana City ex-S&R
AAAA PCAB LICENSE
The Company at a Glance…
P23 B
EXTERNAL VALUATION**
P204 B
DISCOUNT TO EXTERNAL VALUATION
89%
57 HAS. INSIDE ASEANA
14 HAS. OUTSIDE ASEANA

6
Key Milestones – Demonstrating Execution Track Record
1965-1986
20122014 - 2015
2004 - 2008
2003Entered into first land lease
and commenced recognition of revenue from leasing of land to
S&R
1991
1991
Reclamation
works for Aseana
City began
2017
2017▪ Pixel Residences fully pre-sold
▪ Completion of construction of Aseana Square
▪ Additional lease agreements
with Ayala Land
▪ Aseana Three fully leased out
2016
▪ Pixel Residences starts
pre-selling activities
▪ Aseana Square commencesconstruction
2012
Completion of Aseana One
2014 - 2015
▪ Completion of Aseana Two
▪ Awarded the City of Dreams
development and construction
works (100th construction project)
▪ Commencement of Ayala Land
lease
▪ Aseana Three commences
construction
2018-2019
2018▪ Completion of Aseana Three
▪ DMW lists on the PSE
▪ 8912 Asean Ave. commences
construction
▪ MidPark starts pre- selling
2019▪ Groundbreaking of MidPark
Towers, Parqal and 58 Jupiter
▪ Turnover of Pixel Residences
1965 - 86
1965: Establishment of DMW
1965-1986: Undertook multiple
projects and infrastructure works with various government
institutions across the Philippines
20032004
Developed AseanaPower
Station
2008
All reclamation works in Aseana City completed
2016
2020
2020▪ Signed MOU with St. Luke’s Medical
Center for a 50-year land lease of 13,896sqms land in Aseana
▪ Acquired a property in Legazpi, Makati
planned for an upscale resdentialdevelopment.

7
Distinct Profile with Strong Embedded Upside Across Businesses
◼ Owns one of the largest and contiguous land holdings in NCR
◼ With land holdings of 569,359 sqms in AseanaCity
◼ 156,301 sqms of long-term land leases.
◼ 20,103 sqms allocated for future leases and7,798 sqms allocated for future sales
◼ Licensed AAAA contractor
◼ Holds a right to match the lowest bid or a right of first refusal to undertake certain construction works in Aseana City
◼ Ready-to-use, easily deployed capabilities, as well as in-house resources and personnel for Aseana's master plan
◼ More than 50-year track record in infrastructure construction and land reclamation
◼ Able to secure land at low-cost relative to current market prices through land reclamation services
◼ 8 existing developed properties and 1 acquired property for development with total leasable floor area of 90,712 sqm
◼ Over 300,000 sqms GLA in the pipeline, with over 140,000 sqms scheduled for completion in 2021 and 2022.
◼ Pixel Residences almost fully turned over
◼ MidPark is ongoing pre-selling with 75% of launched units sold.
◼ One Parq will add over 30,000sqms saleable area in our inventory
◼ Planned Project in Makati will rise in the property bought by DMW last year
CONSTRUCTION 54321
We are an an integrated property developer with expertise in land reclamation, construction and real estate development
90,712 sqms GLA &>300k sqm GLA pipeline
>140 construction
projects
>2.4mn sqms land
reclaimed
156,301 sqms
leased-out land
LAND RECLAMATION LAND SALES AND LEASING
PROPERTY DEVELOPMENT
COMMERCIAL BUILDING LEASING
4 Condo ProjectsIncluding 3 in the Pipeline

88
4 Company Background
8 Economic Backdrop and Property Market Overview
13 Key Investment Highlights
34 Business Strategies
42 Financial Highlights
50 COVID-19 Response

9
A Backdrop of Economic Recovery
1 Strong Economic Rebound in the Succeeding Years
Source: World Bank* (Historical), DBCC (Forecasted)
3 Steady Flow of Remittances from OFWs
0
5
10
15
20
25
30
35
40
2009 2010 2011 2012 2013 2014 2015 2016 2017 2018 2019 2020
Values in USD bn*
4 Continuous Growth in the BPO Sector
No. of FTEs ‘000 Values in USD mn
Source: BSP
0
5,000
10,000
15,000
20,000
25,000
30,000
35,000
0
200
400
600
800
1,000
1,200
1,400
1,600
2008 2010 2012 2014 2016 2018 2020 2022F
FTE Revenue
371
1,430
6.9% 6.3% 6.1%
-9.6%
4.0% to 5.0%
7.0% to 9.0%
2017 2018 2019 2020 2021F 2022F
GDP Growth Rate at Constant 2018 Prices (%)
2
0
1
2
3
4
5
6
7
2017 2018 2019 2020 2021F 2022F
5.8%
4.2%
Percentage of GDP
Source: DBCC
19.1
33.2
Ramped up Public Infrastructure Spending
Source: IBPAP

10
Improvement in Vaccination Rate will Allow for Recovery
Sources: Department of Health, OCTA ResearchData as of October 7, 2021
Vaccines Administered Vaccination Rate
ASEAN Fully-Vaccinated Rate
55% of Metro Manila fully vaccinated well-ahead of PH’s 21%. Metro Manila accounts for 31.9% of the country’s GDP
PH Fully-Vaccinated Rate ahead or at par with ASEAN peers with population of at least 50mn
Google Mobility Index - Philippines Retail and Recreation
47mn doses administered. 25mn first dose and 22mn second dose
23%
64%
21%
55%
0%10%20%30%40%50%60%70%80%90%
100%
PH Metro Manila
At least 1 dose
Fully vaccinated
PH 7-day average new cases at 12.5k down from peak of 20.9kPH Covid Reproduction Number at 0.74 down from 1.32 early in Sept.PH ICU Bed Occupancy at 71% down from peak of 79%
-
10.00
20.00
30.00
40.00
50.00
Mar-02-21 May-24-21 Aug-07-21 Oct-04-21
Million
First dose Second dose
7%
11% 20% 21% 26% 27%43%
63% 67%79%
0%
20%
40%
60%
80%
100%
0
50
100
150
200
250
300
Population (mn) Fully-vaccinated rate
-90.0
-80.0
-70.0
-60.0
-50.0
-40.0
-30.0
-20.0
-10.0
0.0
Ma
r-2
02
0
Ap
r-20
20
Ma
y-2
02
0
Jun
-202
0
Jul-
2020
Au
g-2
02
0
Sep-
202
0
Oct
-202
0
No
v-20
20
Dec
-202
0
Jan-
2021
Feb
-202
1
Ma
r-2
02
1
Ap
r-20
21
Ma
y-2
02
1
Jun
-202
1
Jul-
2021
Au
g-2
02
1
Sep-
202
1

11
5.3%4.7% 4.3%
9.1%
15.6%
17.8% 17.6%
3.0%4.0%5.0%6.0%7.0%8.0%9.0%
10.0%11.0%12.0%13.0%14.0%15.0%16.0%17.0%18.0%
2017 2018 2019 2020 2021F 2022F 2023F
Metro Manila Office Market Update
Vacancies to remain elevated until 2023
2Q 2021 Transacted Lease Rates:
▪ Makati CBD Premium: P1,300-P1,600
▪ Makati CBD Grade A: P700-P1,100
▪ BGC: P850-P1,200
▪ Manila Bay: P700-P800
Location end of 2020 end of 2023change in
sq.m.% change
% of total new
supply
Makati CBD 3,355,400 3,557,500 202,100 6% 10%
Makati Fringe 439,200 643,600 204,400 47% 10%
Fort Bonifacio 2,307,100 2,609,600 302,500 13% 15%
Ortigas Center 1,998,200 2,387,300 389,100 19% 19%
Ortigas Fringe 565,300 626,900 61,600 11% 3%
Bay Area 979,500 1,335,900 356,400 36% 18%
Alabang 746,300 871,300 125,000 17% 6%
Quezon City 1,520,000 1,814,100 294,100 19% 14%
Others 395,400 489,400 94,000 24% 5%
Total 12,306,400 14,335,600 2,029,200 16% 100%
Metro Manila Office Supply Forecast, end 2020 and 2023
Office take-up recovering from the effects of the pandemic
2021F – 2023F annual vacancy
average: 17.0%
63K 54K 60K
91K 101K136K
48K
27K
0
50,000
100,000
150,000
200,000
250,000
1H 2020 2H 2020 1H 2021
Are
a in
sq
m.
Office Take-up per Tenant Type
IT-BPM Traditional POGO
Office take-up recovering from the effects of the pandemic Workers expected to return to the office once fully vaccinated
2%11%
31%
25%
31%0 Percent
25 Percent
50 Percent
75 Percent
100 Percent
• In a survey by Colliers International Philippines, 87% of the companies expect
50% to 100% of their workforce to return to office once fully-vaccinated
• 84% of respondents view that an optimal hybrid work scheme involves 50% to
100% on-site workforce

12
0
1,000
2,000
3,000
4,000
5,000
6,000
7,000
8,000
Fort Bonifacio Makati CBD Bay Area OrtigasCenter
No.
of
Unit
s
2021F 2022F 2023F
Fort
Bonifacio, 27%
Makati
CBD, 19%
Bay Area,
24%
Ortigas
Center, 14%
Others,
17%
Metro Manila Residential Market Update
Bay Area to Account for 60% of New Supply from 2021-2023
158,460 unitsLocation
end of 2020 end of 2023change in
units% change
% of total new
supply
Alabang 4,880 5,900 1,020 21% 4%
Araneta Center 4,550 5,150 600 13% 2%
Eastwood City 9,630 9,630 0 0% 0%
Fort Bonifacio 39,100 43,060 3,960 10% 16%
Makati CBD 28,550 29,600 1,050 4% 4%
Bay Area 22,750 37,700 14,950 66% 60%
Ortigas Center 18,730 21,590 2,860 15% 11%
Rockwell Center 5,270 5,830 560 11% 2%
Total 133,460 158,460 25,000 19% 100%
Pandemic effects continue to suppress M.M. Condo Launches and Take-up
2021F – 2023F supply average: 8,333 units
Metro Manila Residential Supply Forecast, end 2020 and 2023
Total Market Share
end of 2023F
35.7 K 35.0 K38.0 K
51.0 K 48.6 K
27.0 K
9.8 K
33.0 K
43.0 K
53.0 K57.0 K
47.3 K
35.0 K
8.5 K
0
10,000
20,000
30,000
40,000
50,000
60,000
2015 2016 2017 2018 2019 2020 1H21
No
. o
f U
nits
Unit Launches (LHS) Unit Take-up (LHS)

1313
4 Company Background
8 Economic Backdrop and Property Market Overview
13 Key Investment Highlights
34 Business Strategies
42 Financial Highlights
50 COVID-19 Response

14
Key Investment Highlights
Grossly Undervalued5
Entering a Hyper-Growth Stage4
Resilient Amid the COVID-19 Pandemic3
An Integrated Master Developer with Competitive Advantages Across Business Lines2
4
4
6
A Strategic and Sizeable Land Bank in Aseana City that is Well Positioned for Future Growth1

15
Key Investment Highlights
Entering a Hyper-Growth Stage4
An Integrated Master Developer with Competitive Advantages Across Business Lines2
A Strategic and Sizeable Land Bank in Aseana City that is Well Positioned for Future Growth1
Grossly Undervalued5
Resilient Amid the COVID-19 Pandemic3

16
Aseana City – Conveniently Located and Anchored by Tourism, Recreational
Developments, and Retail Malls
Aseana City
✓ Located along the shoreline of Manila Baybordering Pasay City and extending east to
Roxas Boulevard within Parañaque City
✓ Located within the estate is the largestAyala Mall – Ayala Mall Manila Bay
Extensive Transport Network
✓ 5 – 10 minutes to Manila Ninoy AquinoInternational Airport (“NAIA”) via NAIA
Expressway
✓ Less than two kilometers to ParañaqueIntegrated Terminal Exchange (PITX), a
transport terminal that links provincialbuses to other inter-city transport systems
✓ Future LRT Line 1 extension stops along
Aseana City
✓ Newly opened transport terminal of Ayala
Malls Manila Bay improves connectivity toother cities
Draws in Close Proximity
A. PAGCOR’s Entertainment City
✓ An entertainment complex clustering high-
end integrated casino resorts, such as Cityof Dreams, Solaire Resort & Casino, Okada,
and the soon-to-rise Westside City Resorts
World
B. SM Group’s Mall of Asia Complex
✓ Houses one of the largest shopping malls inthe world.
Makati CBD (<6km)
BGC(<9km)
OrtigasCBD (<12km)

17
Sizeable Land Holdings in Aseana City
Land Holdings
(569,359 sq.m.)
Unallocated
Land
(273,361 sq.m.)
Land Allocated
for Future Sales
(7,798 sq.m.)
Land Allocated for
Future Leases
(20,103 sq.m.)
Remaining Land Reserves
(301,262 sq.m.)
Roads &
Right of Way
(18,368 sq.m.)
Completed
Properties
(38,420 sq.m.)
Land Leased
(156,301 sq.m.)
Land Used/Allocated
for Development
(268,097 sq.m.)
Land Allocated for
Pipeline Projects
(55,008 sq.m.)

18
Significant Land Value Appreciation
Land secured at low cost relative to current market prices as it was obtained in consideration of our land reclamation services
31.5
273.0300
366
425
350
255
354 348
655
828800
782
858830
2006 2018 2018A 2019 2019A 2020 to2Q21
2018 2019 2020 to2Q21
2018 2019 2020 to2Q21
2018 2019 2020 to2Q21
Ortigas CBD Fort Bonifacio Makati CBD
Source: For Ortigas CBD, Fort Bonifacio, and Makati CBD, Colliers 2Q2021 Property Market Overview
*Aseana City Valuation based on actual transacted values in Aseana and Colliers’ Assessed Values
Valuation per sq.m. (PHP’000)
CAGR (2006 – 2019A) = 22%
Aseana City*
Actual DMW Land Sale for 2,202sqms
Aseana Transacted Values Colliers’ Assessed Values

19
Key Investment Highlights
Entering a Hyper-Growth Stage4
A Strategic and Sizeable Land Bank in Aseana City that is Well Positioned for Future Growth1
An Integrated Master Developer with Competitive Advantages Across Business Lines2
Grossly Undervalued5
Resilient Amid the COVID-19 Pandemic3

20
An Integrated Master Developer with Competitive Advantages across Business
Lines
Land reclamation
Land preparationInfrastructure
and zoning
For sales
For recurring
revenue
Value creation Value extraction
Residential development
Commercial development
Land lease
Maximising returns across the value chain
Purchase of land
Provision of Ancillary Citywide Services
Integrated end-to-end master planning and development
Integrated master developer covering the entire value chain - land creation, infrastructure construction and property
development
Capital recycling for future growth
Our Current Focus
Construction
Land sale

21
Key Investment Highlights
Entering a Hyper-Growth Stage4
A Strategic and Sizeable Land Bank in Aseana City that is Well Positioned for Future Growth1
Resilient Amid the COVID-19 Pandemic3
Grossly Undervalued5
An Integrated Master Developer with Competitive Advantages Across Business Lines2

22
Resilient Amid the COVID Pandemic
1,959 1,960
2019 2020
983 990 974
1H2019 1H2020 1H2021
Recurring income remained stable, matching pre-pandemic level
Recurring/ Leasing Income (Php Million)
1
Maintained Cash Dividends in 20202
1
0.0471 0.0471
2019 2020
Cash Dividends (Php/ Share)
Acquired a property in Legazpi, Makati3
1,700sqms building floor area
770sqms land area

23
Resilient Amid the COVID Pandemic: Robust leasing business (1/3)
155,418158,079 158,079
156,301
2018 2019 2020 6M 2021
Total Leased Land Area (sq.m.)
*Varies on a case-to-case basis
Quality Tenants
Favourable Lease Terms*
Long-Term Leases. Lease Terms range from 10 to 45 years
Built-in Escalation Clause. Escalation rate 5% to 10%
Minimum Guaranteed Rent. With Minimum Guaranteed Rent
Or percentage of sales (for some tenants), whichever is higher
Safeguards In Case of Pre-Termination*
Forfeiture of Improvements in favor of DMW
Forfeiture of Security Deposit in favor of DMW
Forfeiture of Unused Advance Rent in favor of DMW

24
Resilient Amid the COVID Pandemic: Robust leasing activities (2/3)
Total Building Leasable Floor Area (sq.m.) Diversified and Quality Tenant Base*
Building Occupancy Rate (%) Weighted Average Lease Expiry (Years)
89,914 89,914
90,712 90,712
2018 2019 2020 6M 2021
98.0% 98.0%93.0% 90.0%
2018 2019 2020 6M 2021
5.5
5.8 5.8
2019 2020 6M 2021
8%
12%
30%
12%
28%
10% BPOs
Logistics/ Shipping
POGO
Restaurants/ Retail
Traditional
Vacant
*as of 6M2021,

25
Resilient Amid the COVID Pandemic: Robust leasing activities (3/3)
PEZA-accredited office buildings
*Varies on a case-to-case basis
Favourable Lease Terms*
Aseana 1 - PEZA-Accredited
20,189sqms
Gross Leasable Area
Aseana 2 - PEZA-Accredited
14,288sqms
Gross Leasable Area
Aseana 3 - PEZA-Accredited
30,914 sqms
Gross Leasable Area
Built-in Escalation Clause. 5% to 10%
Forfeiture of Security Deposit in favor of DMW in case of
Lease Pre-termination
Favourable Location
97% of Building GLA In Aseana City
3% of Building GLA In Makati and Quezon City
Forfeiture of Unused Advance Rent in favor of DMW in case of
Lease Pre-termination
Other Penalties charged in case of Lease Pre-termination

26
Resilient Amid the COVID Pandemic: Substantial Recurring Earnings
Leasing of
Land Holdings
CUSA(1)
Note:1. Refers to Common Use Service Areas
Page 26
Recurring Revenue Contribution 6M 2021 (%)
Recurring Revenues Account for 78% of Total
38%
40%
0%
21%ResidentialSales
Construction
Land
Building &others
Recurring Operating Income Contribution 6M2021 (%)
Recurring Operating Income Account for 81% of Total
78%
33%
48%
0%
19%ResidentialSales
Construction
Land
Building &others
81%

27
▪ DMW maintains good relationships with
and is well supported by leading local
financial institutions, providing
credibility and reputability.
▪ Php8 billion unutilized credit lines as of
1H2021
▪ Relatively low borrowing rates
Resilient Amid the COVID Pandemic: Prudently Managed Balance Sheet
Notes:1. Net debt is calculated by subtracting cash and cash equivalents from total loans and borrowings
2. Debt to equity ratio is calculated by dividing total loans and borrowings by total equity
Healthy borrowing profile and conservative funding strategy for land sales
Support from Leading Local Financial
Net Debt/(net cash)(1) (PHP mm) Debt to Equity(2) (%) Institutions
▪ DMW maintains strict financial and risk management policies in order to minimize its
borrowings to equity ratio and its financial and operational risks
▪ Remains in a net cash position as of 1H2021
▪ Comfortable balance sheet allows DMW the ability to pounce on opportunities for acquisition,
if and when they present themselves.
3%
6%
13%
2019 2020 1H2021(6,760)
(3,617)
(2,688)
2019 2020 1H 2021

28
Key Investment Highlights
Resilient Amid the COVID-19 Pandemic3
A Strategic and Sizeable Land Bank in Aseana City that is Well Positioned for Future Growth1
Entering a Hyper-Growth Stage4
Grossly Undervalued5
An Integrated Master Developer with Competitive Advantages Across Business Lines2

29
Upcoming Completions to Increase Building Leasing Space Almost Three-Fold
89,914 89,914 90,712
162,351
232,499
2018A 2019A 2020A 2021F 2022F
Total Building Leasable Floor Area (sq.m.)
8912 Asean Ave
58 Jupiter
Parqal
+70,148sqms
+71,639 sqms
30
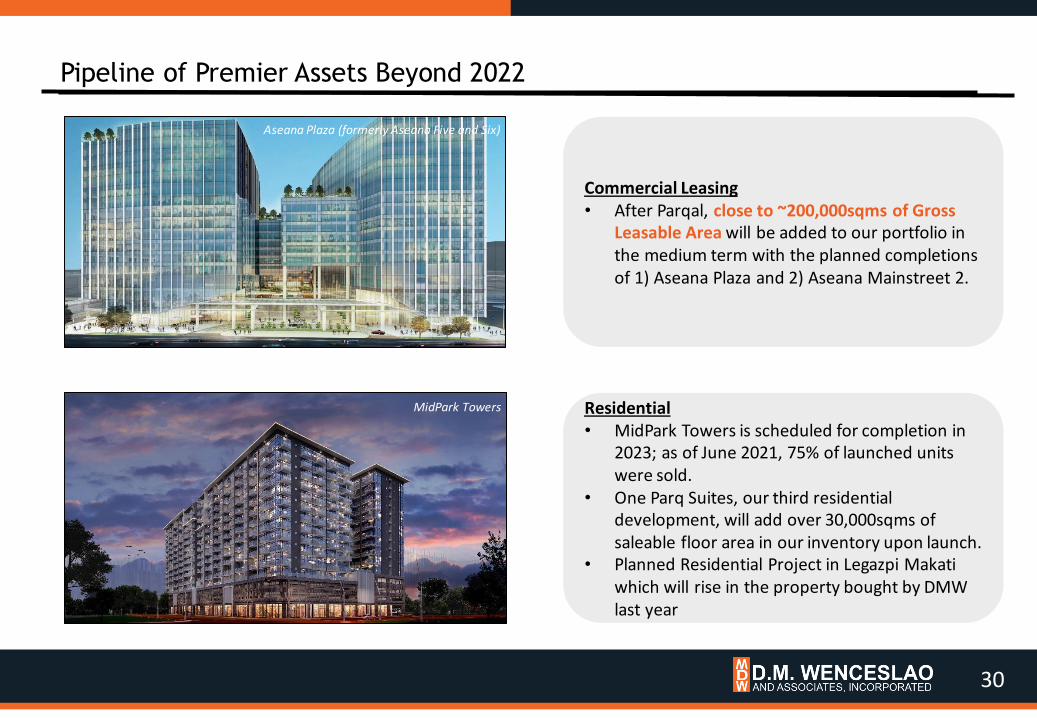
Pipeline of Premier Assets Beyond 2022
Aseana Plaza (formerly Aseana Five and Six)
MidPark Towers
Commercial Leasing• After Parqal, close to ~200,000sqms of Gross
Leasable Area will be added to our portfolio in the medium term with the planned completions of 1) Aseana Plaza and 2) Aseana Mainstreet 2.
Residential• MidPark Towers is scheduled for completion in
2023; as of June 2021, 75% of launched units were sold.
• One Parq Suites, our third residential development, will add over 30,000sqms of saleable floor area in our inventory upon launch.
• Planned Residential Project in Legazpi Makati which will rise in the property bought by DMW last year

31
Key Investment Highlights
Resilient Amid the COVID-19 Pandemic3
A Strategic and Sizeable Land Bank in Aseana City that is Well Positioned for Future Growth1
Grossly Undervalued5
Entering a Hyper-Growth Stage4
An Integrated Master Developer with Competitive Advantages Across Business Lines2

32
Value of properties inside of Aseana City
NotesColliers’ valuation date is at October 30, 20201. Excluding S&R Building2. DMW holds a 60% shareholding interest in Bay Area Holdings, Inc. or BAHI through Fabricom, Inc. 3. As is, where is basis
Land currently
leased156,301
Completed
properties38,420
Pipeline
properties55,008
Remaining
land reserves
301,262
Roads and
right of way18,368
Total: 569,359 sq.m.
Land area (sq.m.)
Owned Land Holdings Completed Properties(1)
Land currently leased
53,612 26%
Completed properties
19,718 10%
Pipeline properties
25,60313%
Remaining
land reserves104,747
51%
Total: PHP203,680 mn
Valuation (PHP mm)
Aseana One
20,189
Aseana Two
14,289
Aseana Three
30,914
Aseana
Square2,137
Aseana
Powerstation Building
4,710
Aseana Town
Center11,946
Pixel
Residences13,106
Total: 97,290 sq.m.
Total leasable/saleable floor area (sq.m.)
Aseana One
2,273
Aseana Two
1,752
Aseana Three
2,327
Aseana
Square2,671
Aseana
Powerstation Building
3,404
Aseana Town
Center5,384
Pixel
Residences1,907
Total: PHP19,718 mn
Valuation (PHP mm)
Pipeline Properties
8912 Asean Ave.
69,284
Parqal
70,148
Aseana Plaza (formerly
Aseana 5 & 6) 155,370
Aseana
Mainstreet 236,856
MidPark
Towers42,095
Parkside
Place 228,329
Total: 402,082 sq.m.
Leasable/saleable floor area (sq.m.)
8912 Asean Ave.
4,148
Parqal 8,444 Aseana Plaza
5,992
Aseana
Mainstreet 22,100
MidPark
Towers3,238
Parkside
Place 21,680
Total: PHP25,603 mn
Valuation (PHP mm)(3)
(2)
(2)
(1)

33
Steep Discount to Asset Value
Notes*Colliers’ valuation date is at October 30, 2020**As of September 2021
Land currently leased53,612
26%
Completed properties
19,718 10%
Pipeline properties
25,60313%
Remaining land reserves
104,747 51%
Valuation* (PHP mm)
(2)
PHP203,680 mnColliers’ Valuation*
PHP23,000 mnCurrent Market Capitalization**
89%Discount to Colliers’ Valuation
Php2,688 mnNet Cash Position (1H2021)

3434
4 Company Background
8 Economic Backdrop and Property Market Overview
13 Key Investment Highlights
34 Business Strategies
42 Financial Highlights
50 COVID-19 Response

35
Business Strategies
4 Enhance our earnings base with focus on high-margin recurring income streams
3 Grow our land bank through a multi-pronged approach
2 Develop a portfolio of high-quality projects that is in tune with market demand
1 Grow Aseana City into a “Next Generation” CBD within Metro Manila

36
Master planned district
for all lifestyles
Balanced locator mixGlobal infrastructure &
service standards
Wholistic development
Regular
review
Detailed
development
plan
Attractive
tenant mix
Promote
continued
investments
GLOBAL COMMUNITY URBAN RECREATION
✓ Update the master plan regularly to
review progressmade
✓ Ensure broad long-term strategies are
appropriately adjusted in view of
macroeconomic developments and
market conditions
✓ Detailed plan will ensure proper
guidance and progress tracking
✓ Current plan capitalises on the
anticipated growth in office, retail,
tourism, outlets in neighboring
Entertainment City and Mall of Asia
developments
✓ Attract a robust mix of quality tenants
and locators
✓ Balanced tenant or locator mix will
cultivate a vibrant next generation
district that supports commercial, retail
and residential purposes
✓ Implement key infrastructure such as
standardized citywide services to
enhance livability
✓ Continually attract top developers such
as Ayala Land to invest in Aseana City
Grow Aseana City into a “Next Generation” CBD within Metro Manila

37
Grow Aseana City into a “Next Generation” CBD within Metro Manila (Cont’d)

38
e
Develop a Portfolio of High-Quality Projects That is In Tune With Market Demand
✓ Diversify tenant base and attract a healthy mix of long-term quality logistics,
traditional, BPO, and gaming-related tenants.
✓ Develop commercial space that is highly flexible in terms of specifications tomeet changing tenant requirements
✓ Refine the integration of our capabilities with our centralized resources
✓ Target higher mid-end consumer market - middle-class working families,
executives, expatriates working at adjacent developments and foreign buyers
✓ Work closely with real estate brokers and consultancies that handle a large number of high-net worth individuals
▪ Targeted Completion:
2021
▪ Total Leasable Floor
Area: 69,284sqms
▪ Targeted Completion:
2022
▪ Total Leasable Floor
Area: 70,148sqms
▪ Targeted Completion:
TBD
▪ Total Leasable Floor
Area: >150,000sqms
Commercial Project Residential Projects
8912 Asean Ave Parqal Aseana Plaza MidPark Towers One Parq Suites
▪ Targeted Completion:
2023
▪ 75% of launched
units sold as of June
2021
▪ 16% POC as of June
2021
▪ Targeted Completion:
TBD

39
Develop a Portfolio of High-Quality Projects That is In Tune With Market Demand

40
Multi-Pronged Approach to Growing Our Land Bank
Strategic acquisitions of land assets or purchase land from WHI with whom DMW has
a ROFR
Pursue strategic and opportunistic acquisition of land and other properties outside
Aseana City
Opportunistically undertake large-scale and complex Government and Public-
Private Partnership projects that involve a land reclamation component

41
Enhance Our Earnings Base With Focus On High-Margin Recurring Income Streams
Land Leasing
Allocate at least 5,000 sq.m. of
land for long-term leasing and
2,000 sq.m. of non-core land for
sale each year
Focus on suitable lessees and
purchasers to complement and
maximize the revenue potential of
our real estate portfolio
Commercial Leasing
Five planned commercial
developments targeting at BPOs,
POGOs, logistics companies and
gaming and tourism-related
companies, demographic groups
that are expected to experience an
increase in demand for commercial
space within the vicinity
Residential Sales
Long term strategy to take over
land sales
Manila Bay area has a price
premium over other business
districts in Metro Manila
Captive Sub-businesses
Provision of gas, transportation and
security services
Other sub-businesses that we may
enter into include centralized gas
supply, standardized road
navigation, commercial advertising
signages, and construction of
skywalks linking buildings to
encourage “walkability”

4242
4 Company Background
8 Economic Backdrop and Property Market Overview
13 Key Investment Highlights
34 Business Strategies
42 Financial Highlights
50 COVID-19 Response

43
P1.2 billion
in total revenues
Stable recurring income
Recurring income from rentals, 78%
Land, 40%
Building, 31%
Other revenues, 7%
Notes:Sum of the parts may not equal 100% due to rounding.
Total revenues, P1.2 billion
Sale of condominium units, 21%
Construction contracts, 0%
PHP 6M 2021 6M 2020 Change (%)
Rentals
Land P493,423,860 P495,820,595 0%
Building 389,076,298 409,877,477 -5%
Other revenues 91,499,141 84,520,714 8%
973,999,299 990,218,786 -2%
Construction contracts 2,203,181 15,643,101 -86%
Sale of condominium units 266,722,512 546,455,576 -51%
Total Revenues 1,242,924,992 1,552,317,463 -20%
Gross profit 999,090,871 1,101,557,378 -9%
Operating expenses - net 161,769,435 153,940,430 5%
Operating profit 837,321,436 947,616,948 -12%
Other income - net 6,809,305 46,408,940 -85%
Profit before tax 844,130,741 994,025,888 -15%
Tax expense (credit) (16,802,226) 253,706,815 -107%
Net profit attributable to
equity holders of the parent P852,821,953 P720,949,407 18%

44
Buildings
our lease agreements generally stipulatefixed annual escalation rates ranging from 3% to 10% for commercial space
Land
our lease with Ayala Land provides for a minimum guaranteed rent or, if higher, an agreed percentage of the income derived from the site
936 980 982 481
77%73% 76%
72%
0%
20%
40%
60%
80%
100%
0
200
400
600
800
1,000
2018 2019 2020 6M 2021
Revenues Segment Gross Margin Revenues
P974.0MWe pay particular attention to recurring income sources to provide
us with higher earnings visibility. We primarily target traditional
companies, including logistics, BPOs, and gaming and tourism-related
businesses.
Buildings
occupancy rate of 90% and weighted average lease expiry of 5.8 years as of June 30, 2021
P493.4MLand
P389.1MBuilding
In focus: Leasing
P91.5MOther revenues
44
Building leasing and other revenues related to leasing

45
119
548
749
267
39% 43%
45%
60%
0%
20%
40%
60%
80%
100%
0
400
800
2018 2019 2020 6M2021
Revenues Segment Gross Margin Revenues
P266.7MWe are complementing the speed of development in the area with
residential offerings in the mid-income and upscale categories,
ranging in size from 36 sq.m. to 108 sq.m.
Revenue contribution
Accounted for 21% of total revenues on the back of accounts that met 20% threshold for revenue recognition, percentage of completion, and ongoing pre-selling activities
Pixel Residences
Fully pre-sold as of June 2017 with total collection of P1.6 billion as of Jun 2021
Payment terms: 20%-80%
MidPark Towers
75% of launched units sold with total collection of P1.6 billion as of Jun 2021.
Ave. collection – 28%
P110.4MPixel Residences
P156.3MMidPark Towers
In focus: Residential
Residential Gross Margin
45
Sales take-up (170 units)
3Q 2016 11%
4Q 2016 32%
1Q 2017 64%
2Q 2017 100%
Residential sales % to
total revenues
2018 6%
2019 16%
2020 27%
6M 2021 21%

46
Superior profitability scorecard consistent with resilient portfolio
1,806 2,819 2,071 999
84%80%
76%80%
2018 2019 2020 6M 2021
Gross Profit Gross Profit Margin
Note:1. EBITDA = operating profit + depreciation and amortization2. Net income / revenues
Gross Profit (PHP mm) Operating Profit (PHP mm)
1,911 2,374 2,131 853
89%
68%79% 69%
2018 2019 2020 6M 2021
Net Profit Net Profit Margin
EBITDA(1) (PHP mm) Net Profit Attributable to Equity Holders of the Parent (2) (PHP mm)
1,372 2,271 1,707 837
64% 65%62%
67%
2018 2019 2020 6M 2021
Operating Profit Operating Profit Margin
1,507
2,420 1,861
912
70% 69% 68%73%
2018 2019 2020 6M 2021
EBITDA EBITDA Margin

47
Financial strength supports growth aspirations
14%
12%
10%
8%
2018 2019 2020 6M 2021
1.61x 1.61x1.47x 1.41x
2018 2019 2020 6M 2021
1.64x 1.56x 1.51x 1.53x
2018 2019 2020 6M 2021
11%
3%
6%
13%
2018 2019 2020 6M 2021
Debt To Equity(1) (%) Return on Equity(2) (%)
Current Ratio(3) (x) Asset to Equity(4) (x)
Notes:
Data as of December 31 of each year and June 30, 20211. Our debt to equity ratio is derived by dividing our total loans and borrowings by total equity. It measures the degree of our financial leverage.2. Our annualized return on equity is derived by dividing net profit by average shareholders’ equity. It measures how profitable we are at generating profit from each unit of shareholder equity. 3. Our current ratio is derived by dividing current assets by current liabilities at the end of a given period. It measures our ability to pay short-term obligations.4. Our asset to equity ratio is derived by dividing total assets by shareholders’ equity. It measures our financial leverage and long-term solvency

48
Progress Report on Use of proceeds
Pixel Residences P283M 8912 Asean Ave. P2.2B Parqal P1.8B MidPark Towers P252M
Total applied offering proceeds as of June 30, 2021
Aseana Plaza P109M

49
Summary: 6M 2021 highlights
• Consolidated revenues amounted to ₱1.24 billion, and net
income attributable to equity holders stood at ₱852.8 million
in 6M 2021.
• Recurring income from rentals of land, building and other
revenues amounted to ₱974.0 million or 78% of our total
consolidated revenues for the period.
• Revenues from the residential segment stood at ₱266.7
million, accounting for 21% of total revenues.
• Cancellations remained minimal in 6M2021,
demonstrating the quality of the buyers of our
residential projects.
• Successful deployment of ₱5.8 billion or 76% of total net
proceeds from the IPO to the development of pipeline
projects.
• Completion of 8912 Asean Ave in 2021 which will add over
69,000 sqms to our total GLA and will boost our recurring
income streams.
• Residential segment will now be driven by revenue bookings
from MidPark Towers as Pixel Residences nears full
completion and turnover:
• Pixel Residences: Nearing full completion and
turnover, with little unrecognized revenues
remaining.
• MidPark Towers: Ongoing pre-selling, 75% of
launched units sold as of June 2021. Currently at 16%
POC, revenue booking from MidPark Towers is
expected to account for bulk of residential revenues
in the remainder of the year.
2021 Outlook6M 2021 Summary

5050
4 Company Background
8 Economic Backdrop and Property Market Overview
13 Key Investment Highlights
34 Business Strategies
42 Financial Highlights
50 COVID-19 Response

51
DMWAI’s Response to the COVID-19 Pandemic
✓ More market-friendly terms such as no escalation
and lower rates were introduced to our smaller
tenants*
✓ Rent discounts and other concessions like rent
deferment and waiving of penalties were provided
to our retail lessees*
*All concessions are done in a case-to-case basis
✓ Monthly virtual presentations and webinars via
Zoom/MS Teams to tap clients wherever they are,
in lieu of open houses and usual marketing events
✓ Bringing our residential projects closer to our
market through hosted tours that warmly
showcase MidPark Towers and Aseana City over in
social media platforms
✓ Preventive measures were taken as early as January 2020
when the news of the virus first came out
✓ Allotted a Php100 million emergency contingency fund for its
employees and tenants
✓ Flexible work arrangements were introduced to employees
✓ Regular disinfection and sanitation of office buildings, physical
distancing in common areas, rapid testing, foot baths, and
temperature checks at entry points
✓ Started our company’s COVID-19 vaccination program “2
Shots Forward”, supporting efforts towards recovery.
✓ Donated 100 sacks of rice and rapid test kits
to the city of Paranaque through the Office of
Mayor Edwin Olivarez
✓ Donated 2,000 sets of Personal Protective
Equipment (PPEs) to the Provincial
Government of Cagayan Valley thru the Office
of Gov. Manuel N. Mamba
✓ Set to donate vaccines to specific LGUs/
communities within the vicinity of our projects
Supporting our Business Partners
through these Trying Times
Expanding Reach to Clients:
Adopting to the New Normal
The Health and Safety of our Employees and
Stakeholders Remain as our Top Priority
COVID-19 Aid: Extending a Helping Hand
to the Community

52
Employee Vaccination Program “2 Shots Forward”
53
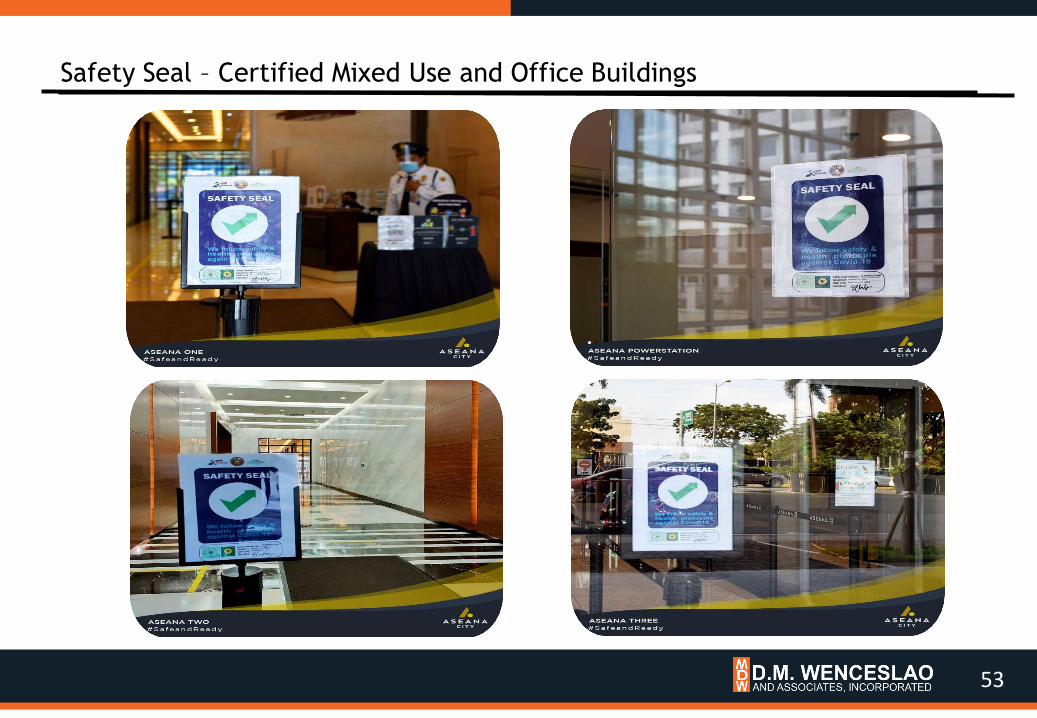
Safety Seal – Certified Mixed Use and Office Buildings

5454
Q&A
www.dmwai.com
www.aseanacity.com
Aseana City, our development project with total land area of 107.5 hectares located along the coastal waters of Manila Bay bordering
the City of Pasay and the City of Parañaque


