
Munich Personal RePEc Archive
Rural Credit Delivery System in
Maharashtra: Some Emerging Issues
Shah, Deepak
Gokhale Institute of Politics and Economics
5 July 2007
Online at https://mpra.ub.uni-muenchen.de/3859/
MPRA Paper No. 3859, posted 06 Jul 2007 UTC

1
Rural Credit Delivery System in Maharashtra: Some Emerging Issues
Deepak Shah*
Background
The entire decade of 1990s was full of discussion on the positive and negative
impacts of financial sector reforms and their implications for the agricultural sector. In the era
of financial sector reforms, sustainability, viability and operational efficiency of RFIs are the
major issues that need to be taken cognisance of in ensuring effective rural credit delivery
system. However, the major problems plaguing the efficiency of rural credit delivery system
are the mounting overdue1 and Non Performing Assets (NPAs)
2 of RFIs. The overdue
problem of different entities of rural credit delivery structure is reported to be an all pervasive
phenomenon that cuts across these different agencies (Puhazhendi and Jayaraman, 1999). As
per the estimates reported by Gulati and Bathla (2002), not only the outstanding loans of
various RFIs operating in India grew significantly but the overdue of these financial
institutions had increased considerably during the period between 1980 and 1998. The RRBs,
in particular, showed maximum increase in their outstanding loans, followed by CBs. The
primary agricultural credit societies (PACS) and LDBs in comparison showed the lowest
increase in their outstanding loans.
Among various states of India, the RFIs of Maharashtra are reported to show the
highest amount of overdues and outstanding loans over the past one decade (Gulati and
Bathla, 2002). Even the proportion of overdues to outstanding loan of RFIs are substantially
high in this state. One can observe several weaknesses insofar as the working of RFIs in
Maharashtra is concerned. One of the earlier studies conducted in cooperative sector of
Maharashtra has clearly shown better financial health for the institutions at the district level as
compared to the primary or grass root level (Shah, 2001). It is not the cooperatives alone but
there are several rural financial institutions that are beset with similar plethora of deficiencies
that impede their efficient functioning. This necessitates a relook at the performance of
various agricultural financial institutions operating in Maharashtra with a view to
recommending, designing and framing appropriate policies to rejuvenate the existing rural
credit delivery in this state.
Focus
The major foci of attention of this paper are on not only to review the rural credit
scenario of Maharashtra but also to examine the banking business, in general, and disparity in
distribution of credit, in particular, in both forward and backward regions/districts of
* Faculty Member, Gokhale Institute of Politics and Economics (Deemed to be a University), Deccan
Gymkhana, Pune 411 004 (Maharashtra)

2
Maharashtra.3 The scope of the study stretches further to the evaluation of issues related to
viability of these agricultural financial institutions operating in these regions/districts of the
state, especially in the era of financial sector reforms.
The entire paper is divided into two sections. While the first section brings into focus
the functioning of various agricultural financial institutions in Maharashtra with an emphasis
on credit cooperatives, commercial banks, regional rural banks (RRBs) and land development
banks (LDBs), the second section is chiefly devoted to the evaluation of credit delivery in
forward and backward regions/districts of Maharashtra, aside from assessing the viability of
credit institutions in these regions of the state.
Section I
Rural Credit Scenario of Maharashtra
In fact, in the state of Maharashtra, the diversification of agriculture over the years
has accentuated the need for the rapid development of rural infrastructure and a larger flow of
credit. Various credit cooperatives, commercial banks and RRBs are by far the major
financial institutions engaged in meeting the capital requirements for diversified activities and
developing the farming/rural sector of the state. Besides, LDBs are also playing a crucial role
in meeting the increasing capital needs of the farmers of this state. Although there has been
multi-agency set-up for rural banking, the major institutional finance to farming community
in Maharashtra comes from commercial banks and credit cooperatives.
Cooperative Bank Finances
Two types of set-up, viz. one short term and the other medium term, constitute the
credit cooperative structure in Maharashtra. A 3-tier system is central to the structure of both
the short term and the medium term credit cooperatives. This 3-tire system consists of a Co-
operative apex bank at the state level, Central Co-operative banks at the district level and of
Primary Agricultural Co-operative Credit Societies (PACS) at the village level. The three tier
set-up is not only meeting the credit requirements of the farmers for seasonal agricultural
operations (crop loans) but also investing on farm assets that do not entail huge capital outlay.
Although there has been substantial increase in the membership of credit cooperatives in the
state of Maharashtra, the trend over the last two decades in terms of cooperative finances is
not very encouraging in this state, especially in more recent times.
The trend over the past two decades show a slower growth in institutional finance
through credit cooperatives during the decade of economic reforms (1991-2000) as against the
decade preceding it (1980-1990). Not only this, the reform period is also seen to be marked
with a slower growth in membership of credit cooperatives in Maharashtra (Table 1). On the
other hand, the outstanding loans of these cooperatives have grown at much faster rate as
compared to their loan advances during both pre-and post economic reform periods.

3
Table 1: Cooperative Bank Finances in Maharashtra; 1980-2000
(Amount in Crore Rupees) Cooperative Banks
No. of Coop. Inst./Soc. No. of Members (‘000’) Loan Advances Outstanding Loansl
Period A
pex
PA
CS
To
tal
Ap
ex
PA
CS
To
tal
Ap
ex
PA
CS
To
tal
Ap
ex
PA
CS
To
tal
TE 1982/83 31 18565 18596 1109 5595 6704 3318 288 3606 1507 431 1938
TE 1990/91 34 19694 19728 1523 7910 9433 9298 929 10227 4811 1521 6332
TE 1999/00 34 20378 20412 1340 10432 11772 22195 2280 24475 15274 3456 18730
CGR (%)
- 1980-90
- 1991-00
- 1980-00
1.33
-
0.37
-0.03NS
0.48
0.65
-0.03NS
0.48
0.65
1.01NS
-1.91
1.65
4.90
3.48
3.35
4.33
2.72
3.15
14.47NS
7.12
8.64
13.64
9.36
12.93
14.08NS
9.74
10.76
23.97NS
13.52
14.57
12.59
9.07
12.92
18.50
12.98
14.64
Source: Computations are based on figures obtained from various issues of ‘Economic Survey of
Maharashtra’
Notes: 1) CGR = Compound Growth Rates
2) All growth rates significant at 1 per cent level of probability
3) NS: Growth rates not significant at 1 per cent level of probability
4) Apex institutions include SCBs and DCCBs
Another interesting feature of credit cooperatives, particularly of PACS in
Maharashtra, is the increasing trend in their share of medium and long term (MT <)
advances and decline in their share of short term (ST) advances (Table 2). The trends in
recovery and outstanding loans of PACS in Maharashtra are also similar to that of their loan
advances, i.e., a declining share in short term recovery and outstanding loans of PACS in the
face of an increasing trend in their share of MT and LT recovery and outstanding loans during
the period between TE 1985 and TE 2000. This is a pointer to the fact that in more recent
times medium and long term loans have become the major foci of farm finance. Nonetheless,
mention may be made here that the PACS in Maharashtra are beset with several deficiencies
in their functioning. The deficiencies are noticed in respect of their law operational efficiency,
high incidence of overdue, low level of recovery, distributional aspect of ST and MT loans,
coverage of SC/ST members, etc. (Shah, 2001).
Table 2: Progress of PACS According to Type of Loan Advances, Recover and Outstanding Loans in Maharashtra (Amount in Crores Rupees)
Loan Advances Recovery Outstanding Loan Period
ST MT LT Total ST MT LT Total ST MT LT Total
TE 1985 280
(81.79)
59
(17.35)
3
(0.86)
342 255
(87.75)
34
(11.85)
1
(0.40)
290 381
(72.23)
140
(26.53)
7
(1.24)
528
TE 1990 594
(72.67)
185
(22.63)
38
(4.71)
817 485
(77.85)
114
(18.32)
24
(3.83)
623 739
(61.97)
388
(32.58)
65
(5.45)
1192
TE 1995 790
(80.51)
162
(16.55)
29
(2.94)
981 656
(82.51)
124
(15.64)
15
(1.85)
795 1074
(59.18)
631
(34.76)
110
(6.06)
1815
TE 2000 1902
(76.05)
543
(21.69)
57
(2.26)
2502 1567
(81.37)
325
(16.90)
33
(1.73)
1925 2122
(60.09)
1219
(34.52)
190
(5.39)
3531
Source: Computations are based on figures obtained from various issues of ‘Co-operative Movement
at a Glance in Maharashtra, Office of the Commissioner for Co-operation & Registrar of Co-
operative Societies, Maharashtra State, Pune
Notes: I) Figures in parentheses are percentages to the total
ii) TE: Triennium Ending; ST: Short Term; MT: Medium Term; LT: Long Term

4
The borrowing members per society of PACS are also reported to have come down,
especially after the late eighties period. Further, despite Maharashtra being accounting for the
bulk of the nation’s total production and acreage under cotton crop, the share of this crop in
total crop loan advances of PACS is also reported to have declined perceptibly, especially in
more recent times (Shah, 2001). Even the statistics reported by Mujumdar (2001) at all-India
level show a decline in borrowing farmers during the period between 1990-91 and 1995-96.
However, this statistics is reported for commercial banks. In fact, the lackadaisical approach
of PACS towards loan advances to SC/ST members and other weaker sections, and also for
cotton crop calls for immediate remedial measures if Maharashtra is to continue to lead the
country in the cooperative development.
Commercial Bank Finances
Despite several targets prescribed by the RBI for Public Sector Banks (PSBs)4, these
banks are reported to have defaulted on majority of these targets (Mujumdar, 2001). This is
evident from the fact that, during the period between 1992 and 1996, the net bank credit of
PSBs to priority sectors at all-India level was well below 40 per cent. Not only this, at all-
India level, the net bank credit of PSBs to agriculture and to weaker sections remained well
below 18 per cent and 10 per cent, respectively, of their total advances all through the period
between 1991 and 2000. This is a reflection of the fact that the two sub-targets of credit to
agriculture and to weaker sections continue to remain unattained even in more recent times.
As for institutional finance to farming community, the commercial banks in
Maharashtra have also not shown encouraging trends. The trend over the past two decades
shows a slower growth in rural institutional finance through commercial banks during the
decade of economic reforms as against the pre-economic reform period (Table 3). The
commercial banks in Maharashtra have not only shown slower growth in their loan advances
and deposits but also decline in their credit-deposit (C-D) ratio during the period of reforms as
against the pre-economic reform period. However, mention may be made here that though the
rural C-D ratio of commercial banks in Maharashtra has come down from 72 per cent during
TE 1982/83 to 65 per cent by the TE 1999/00, it is still well above the minimum prescribed
limit of 60 per cent as stipulated by the RBI.
Table 3: Rural Deposits and Credits of Commercial Banks in Maharashtra
(Amount in Crore Rupees)
Triennium Ending CGR (%) Indicators
1982/83 1992/93 1999/00 1980-90 1991-2000 1980-2000
Rural Deposits 381 1964 5145 19.05 14.40NS
16.28
Rural Credits 274 1457 3346 17.08 12.28NS
14.91
CD Ratio (%) 71.91 74.18 65.03 - - -
Source: Computations are based on figures obtained from various issues of ‘Economic Survey of
Maharashtra’
5
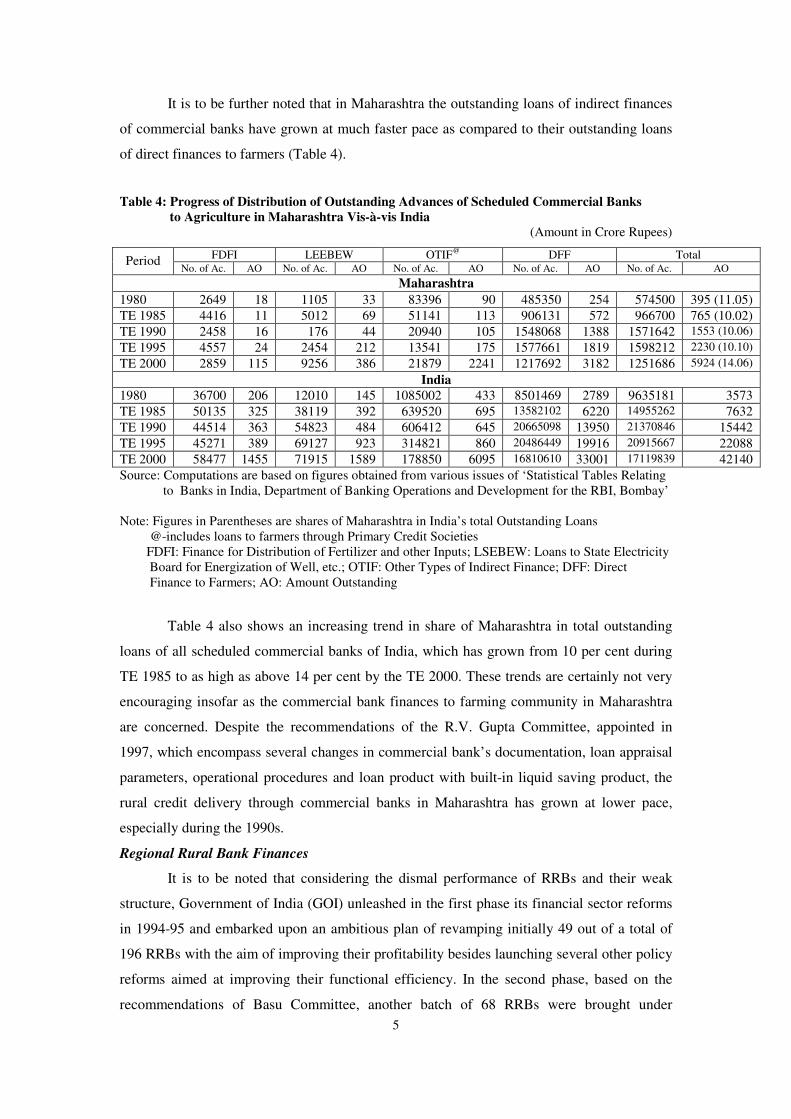
It is to be further noted that in Maharashtra the outstanding loans of indirect finances
of commercial banks have grown at much faster pace as compared to their outstanding loans
of direct finances to farmers (Table 4).
Table 4: Progress of Distribution of Outstanding Advances of Scheduled Commercial Banks
to Agriculture in Maharashtra Vis-à-vis India
(Amount in Crore Rupees)
FDFI LEEBEW OTIF@ DFF Total Period
No. of Ac. AO No. of Ac. AO No. of Ac. AO No. of Ac. AO No. of Ac. AO
Maharashtra
1980 2649 18 1105 33 83396 90 485350 254 574500 395 (11.05)
TE 1985 4416 11 5012 69 51141 113 906131 572 966700 765 (10.02)
TE 1990 2458 16 176 44 20940 105 1548068 1388 1571642 1553 (10.06)
TE 1995 4557 24 2454 212 13541 175 1577661 1819 1598212 2230 (10.10)
TE 2000 2859 115 9256 386 21879 2241 1217692 3182 1251686 5924 (14.06)
India
1980 36700 206 12010 145 1085002 433 8501469 2789 9635181 3573
TE 1985 50135 325 38119 392 639520 695 13582102 6220 14955262 7632
TE 1990 44514 363 54823 484 606412 645 20665098 13950 21370846 15442
TE 1995 45271 389 69127 923 314821 860 20486449 19916 20915667 22088
TE 2000 58477 1455 71915 1589 178850 6095 16810610 33001 17119839 42140
Source: Computations are based on figures obtained from various issues of ‘Statistical Tables Relating
to Banks in India, Department of Banking Operations and Development for the RBI, Bombay’
Note: Figures in Parentheses are shares of Maharashtra in India’s total Outstanding Loans
@-includes loans to farmers through Primary Credit Societies
FDFI: Finance for Distribution of Fertilizer and other Inputs; LSEBEW: Loans to State Electricity
Board for Energization of Well, etc.; OTIF: Other Types of Indirect Finance; DFF: Direct
Finance to Farmers; AO: Amount Outstanding
Table 4 also shows an increasing trend in share of Maharashtra in total outstanding
loans of all scheduled commercial banks of India, which has grown from 10 per cent during
TE 1985 to as high as above 14 per cent by the TE 2000. These trends are certainly not very
encouraging insofar as the commercial bank finances to farming community in Maharashtra
are concerned. Despite the recommendations of the R.V. Gupta Committee, appointed in
1997, which encompass several changes in commercial bank’s documentation, loan appraisal
parameters, operational procedures and loan product with built-in liquid saving product, the
rural credit delivery through commercial banks in Maharashtra has grown at lower pace,
especially during the 1990s.
Regional Rural Bank Finances
It is to be noted that considering the dismal performance of RRBs and their weak
structure, Government of India (GOI) unleashed in the first phase its financial sector reforms
in 1994-95 and embarked upon an ambitious plan of revamping initially 49 out of a total of
196 RRBs with the aim of improving their profitability besides launching several other policy
reforms aimed at improving their functional efficiency. In the second phase, based on the
recommendations of Basu Committee, another batch of 68 RRBs were brought under

6
restructuring during 1995-96. As a result of these revamping efforts, 40 RRBs were reported
to have shown profits (Capoor, 1998). Although various policies relating to restructuring and
revamping of RRBs were introduced in the first and second phase of financial sector reforms,
the policy relating to granting of permission by the RBI to RRBs to invest in non-target
avenues like shares and debentures of corporates, units of mutual funds, bonds of public
sector undertakings, etc. was severely criticized by Mujumdar (2001) as this had paved the
way for a reverse flow of funds from the rural to the urban sector.
Undoubtedly, the major part of resources of RRBs is generated through deposits.
Nonetheless, too much dependence on deposits and lack of attention paid to loan advances is
certainly a disturbing phenomenon. In course of time, the RRBs in India have shown a drastic
fall in their credit-deposit (C-D) ratio. The C-D ratio of RRBs at all-India level has come
dawn from 123 per cent during 1981 to as low as 43 per cent by the TE 2000 (Table 5). The
fall in this ratio is more sharp in the state of Maharashtra, which has come dawn from 148 per
cent during 1981 to 55 per cent by the TE 2000. It is to be noted that in Maharashtra, as on
March 2000, there were 582 branches of RRBs with Marathwada region accounting for
around 50 per cent share in total numerical strength of these bank branches of RRBs. The
decline in C-D ratio of RRBs is mainly due to diversion of substantial portion of their
resources in investments instead of lending in rural areas. It should be recollected here that the
chief objective of setting up of RRBs was the effective coverage of small and marginal
farmers, landless labourers, rural artisans, etc. with a view to enhance their productive
capabilities. The decline in their lending business is a clear cut reflection of deviation of
RRBs from the objectives they were initially formed.
Table 5: Progress of Deposit and Credit of Regional Rural Banks (RRBs) in Maharashtra Vis- à-vis India (Amount in Lakh Rupees)
Maharashtra All-India Period
Deposit Credit CD Ratio (%) Deposit Credit CD Ratio (%)
1981 557 824 147.94 33147 40682 122.73
TE 1985 1724 2034 117.40 97075 107492 110.73
TE 1990 8851 10709 120.99 353554 321839 91.03
TE 1995 22757 17373 76.34 861931 528835 61.35
TE 2000 75492 41562 55.05 2685412 1152160 42.90
Source: Computations are based on figures obtained from various issues of ‘Statistical Tables Relating
to Banks in India, Department of Banking Operations and Development for the RBI, Bombay’.
It has been asserted by Shivamaggi (2000) that the major problem faced by RRBs in
India is the lack of staff motivation and specialization despite local recruitment of their staff.
The poor performance of RRBs greatly owed it to their hurriedly recruited and trained staff
that not only lack exposure in dealing with a large number of small-term/ composite loans but
also in terms their weak knowledge to deal with bank accounts, seek assistance and guidance
at each stage of loan application to its recovery.

7
Land Development Bank Finances
The flow of finances through LDBs encompass activities relating to agricultural
production sub-system (APS), agricultural input distribution sub-system (AIS), agricultural
produce marketing and processing sub-system (AMPS), and also long-term finance to
members of LDBs for the purpose of purchase of tractor and its accessories, minor irrigation,
milch and draught animal purchase, etc. The loans to members of LDBs for long term
purposes are provided against the mortgage of their lands. Although the overall performance
of LDBs in India is satisfactory, they still have to do a lot of catching up to improve the
condition of rural India. The major problem crippling the functioning of LDBs is the
mounting amount of overdues and their outstanding loans, which have grown dramatically.5
In the state of Maharashtra, the loan advances of LDBs have not only declined
sharply during the period of reform but also working capital of these banks fell marginally
during this period (Table 6). The membership of LDBs of Maharashtra has also grown at
slower rate during the period between 1991 and 2000 as against the period between 1981 and
2000. Even the recovery of loans and share capital base of LDBs have weakened during the
reform period. Nonetheless, it is to be noted that the outstanding loans of LDBs in
Maharashtra have grown at slower pace during the period between 1991 and 2000 as against
the period between 1981 and 2000 (Table 6).
Table 6: Progress of Maharashtra State Cooperative Land Development Banks (LDBs) (Amount in lakh Rupees; Membership in thousands)
Period Membership Share
Capital
Owned
Funds
Borrow-
ings
Working
Capital
Loan
Advances
Loans
Recovered
Loans
Outstanding
TE 1985 827 3743 7173 31182 44405 5651 2710 30627
TE 1990 926 4531 11922 48045 66685 8932 3846 49245
TE 1995 1111 7184 14766 68076 107311 13668 6089 82328
TE 2000 1189 9752 54633 109438 144262 4875 8641 99690
CGR (%)
- 1981-00
- 1991-00
2.79*
1.65*
9.34*
7.07*
13.18*
38.61*
9.38*
8.79*
6.07*
-0.27
0.54
-18.53
7.75*
6.83*
9.21*
5.64*
Source: Computations are based on figures obtained from various issues of ‘Co-operative Movement at
a Glance in Maharashtra, Office of the Commissioner for Co-operation & Registrar of Co-
operative Societies, Maharashtra State, Pune
In order to tackle the problem of overdue of LDBs, certain suggestions have been
extended by Kumar and Dixit (1998), which mainly revolve around creation of greater
coordination among ST, MT and LT loans and streamlining the operations of LDBs, checking
the diversion and misuse of LDB’s credit, effective supervision of loan product, strengthening
the share capital base, and mobilizing deposits and debentures through more innovative
deposits and debenture schemes. Another important suggestion in this context is in favour of
launching intensive membership drive with a view to increase the coverage of these long term
financial institutions. Some of the agricultural and rural development banks (ARDBs),
popularly known as LDBs, have already taken initiatives in these directions.

8
Micro Credit Innovations
In the midst of apparent inadequacies of formal financial institutions and their failure
to serve and protect the interest of rural poor despite their phenomenal outreach, an informal
segment comprising of small groups of rural poor began to mobilize capital and savings of
their members and used these resources among their members on a micro scale. These groups
were termed as Self Help Groups (SHGs). The lending procedures of these groups were not
only simple but also effective due to small amount of loans involved in the process. Since the
concept of SHGs was relatively new, NABARD undertook the task of studying the
functioning of SHGs in India as well as in other countries. In this sequel, in 1988-89,
NABARD had made an attempt to conduct a survey of 43 non-government organizations
(NGOs) spread over 11 states in India. Findings of this investigation encouraged NABARD to
launch a pilot project in 1991-92 which involved linkages between banks and SHGs.6 The
SHG-bank linkage programme got a real boost when, in April 1996, RBI had recommended
the banks that lending to the SHGs should be considered as an additional segment under
priority sector lending. Thus, in view of this recommendation, lending to SHGs was
integrated with the mainstream credit operations of the banks.
The SHG Linkage programme received wider acceptability during 1997-98 when 30
commercial banks, 101 Regional Rural Banks, 17 co-operative banks and 265 NGOs spread
over 19 states and two Union Territories had participated in such a linkage programme. The
progress of SHG-Bank Linkage programme has been quite impressive over the past few
years. The information on progress under SHG-Bank Linkage Programme encompassing the
period between 1992-93 and 1999-2000 is provided in Table 7.
Table 7: Progress of SHG-Bank Linkage Programme in India (Amount in Crore Rs.)
Year
No. of
SHGs
Linked
Cumulative
% age of
Women
Groups
No. of
Participating
Banks
No. of
States/Uts
No. of
Districts
Covered
Cumulative
Bank Loan
Cumulative
Refinance
1992-93 255 255 NA NA NA NA 0.29 0.27
1993-94 356 620 NA NA NA NA 0.65 0.46
1994-95 1,502 2,122 NA NA NA NA 2.45 2.29
1995-96 2,635 4,757 NA NA NA NA 6.06 5.66
1996-97 3,841 8,598 76 120 20 NA 11.84 10.65
1997-98 5,719 14,317 78 150 21 221 23.76 21.38
1998-99 18,678 32,995 84 202 24 280 57.07 52.06
1999-
2000
81,780 1,14,775 85 266 24 362 192.98 150.13
Source: Official records of NABARD, Pune.
In the state of Maharashtra, the number of SHGs linked with bank credit have grown
significantly over the past five years. This could be witnessed from Table 8 which clearly
shows the strength of SHGs linked with bank credit to grow from as low as 424 as on March
1997 to as high as 11,148 as on June 2001. Initially, only 11 districts of Maharashtra were

9
covered under the SHG-Bank linkage programme. However, in due course of time, more and
more districts were covered under the folds of this programme. At present, all the 33 districts
of Maharashtra are covered under the SHG-Bank linkage programme. The region that has
shown phenomenal growth in the numerical strength of SHGs linked with bank credit is seen
to be Vidarbha (Table 8). Western Maharashtra and to some extent Marathwada have also
shown significant increases in the numerical strength of SHGs over the past five years.
However, so far as Konkan region is concerned, linking of SHGs with bank credit has been a
more recent phenomenon. Due to initiation of SHG-Bank linkage programme, there have
been perceptible and wholesome changes in the living standards of the members of SHGs,
especially in terms of their ownership of assets, savings and borrowing capacity, income
generation activities and levels of income.
Table 8: Region-wise Number of SHGs Linked with Bank Credit in Maharashtra
Regions March
1997
March
1998
March
1999
March
2000
March
2001
June
2001
Cumulative
Total
Western Maharashtra 183 172 188 687 649 136 2015
Vidarbha 204 226 764 1618 3965 332 7109
Marathwada 37 48 131 588 500 172 1476
Konkan - 2 14 97 395 40 548
Total 424 448 1097 2990 5509 680 11148
Source: Official records of NABARD, Pune.
As per the speech of the Hon’ble Union Minister of Finance, about 1,00,000 SHGs
were targeted to be promoted in India during the year 2000-01 (NABARD Annual Report,
2000-01). In view of this target, the NABARD had set its mission to link a minimum of 5,000
SHGs with bank credit in the state of Maharashtra during the year 2000-01. The NABARD
has also drawn a medium-term strategic plan to ensure linkage of at least 55,000 SHGs with
bank credit by the end of 2004. In order to accelerate the pace of SHG-Bank linkage
programme, the NABARD has also devised district-specific and location-specific strategies in
view of available potential, resources and prevailing constraints. It is expected that with the
increasing involvement of banking system as well as NGOs the micro-credit movement will
get further fillip in the years to come.
Section II
The present study not only evaluates, in general, the functioning of various RFIs in
Maharashtra but also attempts to assess the banking business and viability of these credit
institutions in forward and backward regions of the state. However, insofar as the functioning
RFIs in these two distinct regions is concerned, the confine of the study is only to two
districts of the state. Since the district of Sangli showed the highest composite score on the
scale developed for forward districts, this district was selected for the present investigation as
a forward district. Similarly, the district of Buldana was selected as backward district as it
showed one of the lowest scores on the scale developed for backward districts.

10
Banking Business in Forward and Backward Districts
The composition of banking network in the forward district of Sangli encompasses 15
nationalised banks, four scheduled commercial banks, Maharashtra State Finance Corporation
(M.S.F.C.), Sangli District Central Cooperative Bank (SDCCB), and Maharashtra State
Cooperative Rural Development Bank (MSCARDB). Among these, the SDCCB has the
largest network of rural branches and plays a pivotal role in implementing the District Credit
Plan (DCP) as well as in distributing rural credit. The implementation of DCP and the
performance achieved under it are regularly monitored in the Block Level Bankers Committee
(B.L.B.C.) meetings at the block level as well as in the District Level Consultative Committee
(D.L.C.C.) meetings at the district level. Periodic review of performance achieved under DCP
helps in bringing on surface the strengths and weaknesses of various programmes relating to
socio-economic development. Due to the concerted efforts of the members of D.L.C.C, the
banking business of this district has flourished significantly over time.
As for the backward district of Buldana, the banking network encompasses a group of
four public sector banks, two banks relating to State Bank group, two cooperative banks, two
Gramin banks, and M.S.F.C. However, in general, these banks are broadly classified as
commercial and cooperative banks.
In general, the development of banking business in Sangli and Buldana districts has
been evaluated in terms of growth trends in credit in relation to deposits and also in terms of
targets achieved by various banks under DCP during the period between 1989-90 and 1998-
99, and these estimates for commercial and cooperative banks, are brought out in Table 9.
A critical evaluation of Table 9 shows dwindling of credit-deposit ratio of
commercial banks in the forward district of Sangli , which has fallen even below 60 per cent
in 1997-98. Like commercial banks, the cooperative banks in this district have also shown a
declining C-D ratio during the decade of 1990s. Nonetheless, it is to be noted that this C-D
ratio for cooperative banks remained well above 100 per cent all through the period between
1989-90 and 1997-98. During the given period of time, the SDCCB has shown lower C-D
ratio as compared to cooperative banks in general operating in this district.
The commercial banks operating in backward district of Buldana have also shown a
falling C-D ratio all through the decade of 1990s. The C-D ratios of commercial banks of this
district have fallen from 88 per cent in 1989-90 to 61 per cent by 1998-99. The cooperative
banks operating in this district have also followed a trend similar to commercial banks and
have shown their C-D ratio to fall from as high as 130 per cent in 1992-93 to nearly 100 per
cent by 1998-99. The C-D ratio of BDCCB is seen to be much lower than the overall C-D
ratio of cooperative banks operating in this district. The higher C-D ratios of cooperative
banks are mainly due to their higher amount of loan advances as compared to their deposits.

11
Table 9: Key Indicators of Development of Banking Business in Sangli and Buldana Districts
(C-D ratio in per cent)
Forward District: Sangli Backward District: Buldana
Achievement as % of Target Achievement as % of Target Year C-D
Ratio Agril. & Allied SSI OPS Total
C-D
Ratio Agril. & Allied SSI OPS Total
Commercial Banks
1989-90 67.95 88.22 - - - -
1990-91 71.59 135.52 85.70 173.30 139.67 78.05 - - - -
1991-92 68.65 106.99 178.96 78.28 109.02 75.81 90.46 26.68 85.94 84.66
1992-93 65.70 92.03 197.03 105.43 103.96 75.64 98.45 89.72 71.99 92.78
1993-94 55.47 131.61 102.73 140.63 128.04 65.68 120.52 27.73 95.96 108.28
1994-95 61.23 129.81 166.16 173.98 145.15 63.11 137.39 47.84 175.51 132.74
1995-96 66.51 122.61 71.84 112.44 110.82 59.81 110.64 5.62 165.23 99.73
1996-97 61.20 107.46 66.90 109.61 100.10 63.18 89.14 28.28 59.62 77.74
1997-98 54.21 - - - - 65.48 101.57 39.89 71.83 90.74
1998-99 - - - - - 61.13 102.26 87.18 100.53 100.82
Cooperative Banks @
1989-90 127.20
(85.93)
- - - - 122.98
(100.83)
- - - -
1990-91 169.79
(121.39)
106.75 91.57 109.68 105.47 113.68
(88.90)
- - - -
1991-92 145.33
(145.33)
106.77 65.94 169.10 112.97 130.58
(103.71)
100.93 98.42 151.84 102.18
1992-93 202.56
(155.71)
120.35 193.96 77.54 122.24 118.53
(91.99)
90.78 43.48 14.40 79.63
1993-94 157.86
(119.98)
125.29 130.31 109.99 125.34 113.95
(91.60)
115.27 25.34 2.99 94.73
1994-95 203.42
(169.39)
121.67 205.78 70.25 127.01 104.95
(84.13)
119.58 104.78 22.09 115.10
1995-96 171.99
(143.54)
90.89 104.35 52.58 90.81 100.29
(82.26)
99.57 472.49 84.84 126.69
1996-97 143.07
(123.29)
75.94 85.25 82.86 76.63 92.91
(77.88)
84.30 93.44 15.41 83.35
1997-98 134.04
(106.22)
- - - - 127.47
(109.85)
79.46 33.49 10.60 63.51
1998-99 - - - - - 99.49
(89.14)
85.79 112.28 169.80 106.38
Grand Total
1989-90 84.91 - - - - 99.45 - - - -
1990-91 98.37 114.90 89.33 145.61 117.14 88.99 - - - -
1991-92 89.75 106.83 101.43 137.29 111.78 94.37 96.86 66.20 97.10 94.56
1992-93 103.77 113.04 195.47 99.89 116.38 90.40 93.70 57.22 57.66 84.94
1993-94 86.51 126.59 118.59 132.08 126.05 81.94 117.26 25.98 62.95 100.04
1994-95 105.25 123.30 187.48 149.80 131.86 78.36 127.16 74.14 144.80 123.38
1995-96 103.11 97.26 86.65 100.34 96.49 74.77 103.83 139.19 157.26 113.77
1996-97 90.70 82.27 74.52 104.57 83.54 75.22 86.58 53.82 55.87 80.35
1997-98 79.57 75.03 46.60 71.10 71.96 86.77 88.97 37.17 16.85 73.20
1998-99 - - - - - 77.26 93.17 94.19 147.22 104.17
Source: Figures have been compiled from ‘District Credit Plan (Various Years) Under
Service Area Approach’, Districts: Sangli and Buldana, Maharashtra.
Notes: @-including loan advances of LDBs and Maharashtra State Finance Corporation (MSFC)
1) Figures in parentheses are C-D ratios for SDCCB Ltd and BDCCB Ltd., respectively.
2) For Sangli District: Commercial Banks include State Bank of India (SBI), Bank of Baroda (BOB), Bank
of Maharashtra (BOM), Canara Bank (CB), Central Bank of India (CBI), Corporation Bank (CB), Dena Bank
(DB), Indian Bank (IB), Punjab National Bank (PNB), Punjab and Sind Bank (PSB), Syndicate Bank (SB),
UCO Bank, Union Bank of India (UBI), Vijya Bank (VB), Sangli Bank Ltd. (SB Ltd.), United Western Bank
(UWB), Ratnakar Bank Ltd. (RB Ltd.), Bank of India (BOI). Cooperative Banks include Sangli District
Central Cooperative Bank (SDCCB), Maharashtra State Cooperative Rural Development Bank (MSCARDB),
and Maharashtra State Finance Corporation (MSFC).
3) For Buldana District: Commercial Banks include State Bank of India (SBI), Bank of Baroda (BOB), Bank
of Maharashtra (BOM), Central Bank of India (CBI), Punjab National Bank (PNB), State Bank of Hyderabad
(SBH), Buldana Gramin Bank (BGB), and United Western Bank (UWB). Cooperative Banks include Buldana
District Central Cooperative Bank (BDCCB), Lead Development Banks (LDBs), and Maharashtra State
Finance Corporation (MSFC).

12
It is also clearly evident from Table 9 that, during the period between 1990-91 and
1996-97, the commercial banks operating in Sangli district have not only achieved their
targets of loan advances set for agriculture and allied activities but also for other priority
sectors. Similarly, the cooperative banks operating in this district are also seen to achieve their
targets of loan advances set for agriculture and allied. However, the performance of
commercial banks in terms of achieving their targets of loan advances to various sectors is
much better as compared to cooperative banks operating in this district. Interestingly, neither
the commercial nor the cooperative banks have achieved the targets of loan advances set for
S.S.Is, especially during 1995-96 and 1996-97. As a result, the overall targets of loan
advances achieved by commercial and cooperative banks have fallen close to 100 per cent
during these years. As for the achievement of targets of loan advances under DCP, both
commercial and cooperative banks, in general, are seen to show better performance during the
period between 1990-91 and 1994-95 and thereafter a deterioration in their performance in
this respect is seen.
An analysis drawn from Table 9 also shows better performance of commercial banks
operating in Buldana district as for the achievements of their targets of loan advances to
agriculture and allied activities are concerned. Cooperative banks in this district are seen to
have performed well as far as the achievements of their targets of loan advances to S.S.Is. and
other priority sectors are concerned. However, mention may be made here that the overall
performance of cooperative banks in Buldana district in terms of achieving their targets of
loan advances to various sectors is much better as against the commercial banks. Not only the
cooperative banks have shown better performance in terms of achieving their targets of loan
advances under DCP but also in respect of C-D ratio, which is seen to have been higher than
commercial banks and in accordance with the norms stipulated by the RBI.
It is to be further noted that the loan advances of commercial banks to priority sectors
in Sangli district remained well above 40 per cent of their total loan advances during the
period between 1991-92 and 1996-97 (Table 10). Similarly, during the same period, the direct
advances of commercial banks to agriculture also remained above 18 per cent of their total
loan advances as stipulated by the RBI. Except for the year 1996-97, the advances of
commercial banks to weaker sections also remained above 10 per cent as stipulated by the
RBI. Nonetheless, the disquieting feature of Table 10 is the loan advances of commercial
banks under DRI schemes, which is seen to have remained less than 1 per cent of their total
loan advances all through the period between 1991-92 and 1996-97. On the hand, the
cooperative banks in this district have shown relatively better performance insofar as their
loan advances to priority sectors, direct loan advances to agriculture, and loan advances to
weaker sections are concerned.

13
Table 10: Distribution of Loan Advances to Various Sectors/Purposes in Sangli District (Amount in Lakh Rupees)
Percentage to Total Loan Advances Banks/Years Loan Advances
PS Advances DA Advances WS Advances DRI Advances NPS Advances
Commercial Banks 1991-92 22190.03 55.52 31.29 14.65 0.62 44.48
1992-93 24575.89 51.49 29.06 14.38 0.43 48.51
1993-94 25021.86 53.63 28.21 14.69 0.49 46.37
1994-95 30737.57 48.71 25.07 10.96 0.43 51.29
1995-96 37239.73 46.36 24.18 11.11 0.71 53.64
1996-97 39075.64 46.58 24.03 8.14 0.68 53.42
Cooperative Banks 1991-92 17830.13 44.31 - 1.15 - 55.69
1992-93 29191.94 55.23 44.86 6.29 - 44.77
1993-94 30975.00 60.45 49.67 16.08 - 39.55
1994-95 45793.73 49.37 40.41 15.09 - 50.63
1995-96 51164.57 49.20 41.47 16.58 - 50.80
1996-97 51854.24 53.36 41.09 16.01 - 46.64
Grand Total 1991-92 40020.16 50.52 17.35 8.37 0.35 49.48
1992-93 53767.83 53.52 37.64 9.99 0.20 46.48
1993-94 55996.86 57.40 40.08 15.46 0.22 42.60
1994-95 76531.30 49.11 34.25 13.43 0.17 50.89
1995-96 88404.30 48.00 34.19 14.28 0.30 52.00
1996-97 90929.88 50.44 33.76 12.63 0.29 49.56
Source: As in Table 9.
Notes: 1) PS = Priority Sector; DA = Direct Agriculture; WS = Weaker Sections
DRI = Differential Rate of Interest Schemes; NPS = Non Priority Sector
2) RBI has stipulated minimum levels as follows: (i) Advances to priority sector – 40 % of
total advances, (ii) Advances to agriculture – 18 % of total advances, (iii) Advances to weaker
sections – 10 % of total advances, (iv) Advances under DRI schemes – 1 % per cent of total
advances, and (v) Credit/Deposit ratio – a minimum of 60 %.
The cooperative banks operating in this district have strictly followed the minimum
prescribed limits of the RBI. Table 10 also shows a steady increase in loan advances of
commercial banks to non priority sectors. Contrary to this, the loan advances of cooperative
banks to these sectors have come down in course of time.
Thus, the estimates relating to banking business presented in Tables 9 and 10 reveal
much better performance of cooperative banks during the decade of 1990s. The cooperative
banks have performed well not only in forward district of Sangli but also in Backward district
of Buldana. The credit delivery and recovery performance of cooperative banks are noticed to
be remarkable in the forward district of Sangli. Nonetheless, as for the achievements of
targets of loan advances to various sectors, the commercial banks of Sangli district have
performed better than cooperative banks operating in this district. At the same time, it
deserves mention here that both commercial and cooperative banks have shown rather poor
performance insofar as their achievements of targets of loan advances to S.S.Is are concerned.
This holds good in both the forward district of Sangli and the backward district of Buldana.
Shrinking flow of credit to S.S.Is during the decade of 1990s is certainly a matter of concern.

14
Disparities in Crop Loan Advances
Among various types of loans extended by PACS, short-term crop loan is by far the
most important one as farmers crop activity largely depends on it. In fact, these kinds of loans
are provided to the farmers for the purchase of various inputs like seeds, fertilizers, pesticides,
etc. and also for meeting expenses of labour, irrigation, etc. These loans have direct bearing
on crop production and they are extended on the basis of acreage and cost of cultivation of the
crops grown, subject to the repayment capacity of the farmers. It is, therefore, essential to
evaluate the distribution pattern of these loans in the selected forward and backward districts.
The distribution of crop loans is generally correlated with the gross cropped area or
cropping intensity within a year. The distribution of crop loans is, therefore, evaluated on the
basis of per hectare of gross cropped area across various talukas of the selected districts. The
disparity in distribution of these loans is evaluated with the help of computation of Gini’s
coefficients and coefficient of variation (C.V.) across various talukas of the selected districts
encompassing the period between 1980-81 and 1999-2000. The estimates relating to per
hectare crop loan advances across various talukas, coefficient of variation in the distribution
of these loans over time, and Gini’s coefficients for each year across various talukas are
presented for each of the selected sampled forward and backward districts in Table 11.
Table 11 : Variation in Crop Loan Advances (in Rupees) Per Hectare of GCA Sangli District Buldana District
Year Dist.Avg. Gini Ratio Dist.Av Gini Ratio
1980-81 183.50 0.3988 137.23 0.3115
1981-82 193.26 0.3721 137.23 0.3115
1982-83 268.23 0.3383 134.47 0.3135
1983-84 293.76 0.3079 110.74 0.2290
1984-85 228.31 0.3776 103.20 0.3226
1985-86 226.57 0.3553 112.24 0.2716
1986-87 250.89 0.3266 93.47 0.2708
1987-88 321.39 0.2732 114.31 0.2106
1988-89 368.09 0.2747 118.74 0.1865
1989-90 407.68 0.2477 114.29 0.2825
1990-91 436.23 0.2636 100.94 0.3033
1991-92 545.77 0.2774 124.23 0.2185
1992-93 263.64 0.3759 79.71 0.2797
1993-94 824.02 0.3584 156.38 0.2337
1994-95 1121.60 0.2899 180.95 0.2516
1995-96 1272.49 0.3181 255.40 0.1314
1996-97 1094.58 0.2584 333.61 0.1546
1997-98 1191.09 0.2317 345.92 0.1824
1998-99 1055.62 0.2022 505.04 0.1423
1999-2000 2078.47 0.3054 574.69 0.1587
S.D. 512.78 140.75
Mean 631.26 191.64
C.V. 0.81 0.73
1980/81-1989/90 274.17 0.3087 117.59 0.2517
1990/91-1999/2000 988.35 0.2772 265.69 0.1385
Notes: 1) Computations are based on figures obtained from ‘Socio-Economic Review’ and ‘District
Statistical Abstract’ (Various Years)
2) Computations of district average figures are based on eight talukas of Sangli district (Miraj,
Tasgaon, Khanpur, Atpadi, Jath, Kavathe-Mahakal, Walwa, and Shirola) and thirteen talukas of
Buldana district (Chikhli, Deulgaon, Buldana, Malkapur, Nandura, Motala, Jalgaon Jamod,
Sangrampur, Khamgaon, Shegaon, Mehkar, Sindkhed Raja, and Lonar)

15
The crop loan advances in Sangli district are estimated to have grown from Rs.274.17
per hectare of GCA in the decade 1980s to as high as Rs.988.35 per hectare of GCA in the
decade of 1990s. This means that, in general, during the last two decades there has been four
folds rise in crop loan advances per hectare of GCA in Sangli district. During the given
period, the lowest estimated Gini Concentration ratio is noticed to be in 1998-99 and its
highest value turns out to be in 1980-81. In general, the disparity in distribution of crop loan
advances based on per hectare of GCA is noticed to have reduced from the decade of 1980s to
the decade of 1990s as the estimated Gini ratio in this respect has come down from 0.3087 in
the decade of 1980s to 0.2772 in the decade of 1990s. It could, therefore, be concluded that
the disparity in distribution of crop loan has reduced in Sangli district over time with the
decade of 1990s showing lower disparity in this respect as against the decade of 1980s.
The crop loan advances in Buldana district are estimated to have grown from
Rs.117.59 per hectare of GCA in the decade of 1980s to Rs.265.69 per hectare of GCA in the
decade of 1990s (Table 11), showing thereby around 2-3 folds rise in these loans during the
last two decades. Like Sangli distrcit, the Gini Concentration ratios estimated for each year
show no significant difference in the distribution of crop loans across various talukas of
Buldana district during the given period of time. During the given two decades, the lowest
estimated Gini ratio is noticed in 1995-96 and its highest value turns out to be in 1984-85. In
general, this district has also shown lower disparity in distribution of crop loans across
various talukas during the decade of 1990s as against the decade of 1980s since the estimated
Gini ratio in this respect has come down from 0.2517 in the decade of 1980s to as low as
0.1385 in the decade of 1990s.
Interestingly, the disparity in distribution of crop loans is lower in the backward
district of Buldana as against the forward district of Sangli. At the same time, it is to be noted
that the amount of crop loans per hectare of GCA distributed in this district is also very low.
Not only this, the increase in amount of crop loans advances over time in this district is also
not much and it is estimated to have grown from Rs.117.59 per hectare of GCA in the decade
of 1980s to only Rs.265.69 per hectare of GCA in the decade of 1990s as against a sharp
increase in these figures from Rs.274.17 per hectare of GCA in the decade of 1980s to as high
as Rs.988.35 per hectare of GCA in the forward district of Sangli. There is, therefore, an
ample scope to increase the amount of crop loan advances in the backward district of
Buldana. This will certainly help the farmers not only to increase their crop production but
also in terms of achieving sustained growth of agricultural sector of this district.
Viability of Credit Institutions
The withdrawal of Government regulations has helped many states, especially in
terms of expansion and development of their credit related activities. The state of Maharashtra
16
is no exception to this phenomenon. In this state, there has been considerable growth in the
facilities extended by the three tiers of organisational structure of credit cooperatives,
especially after the early nineties period. Of the three tiers, the district level institution can be
viewed as the most active unit because it is this unit which provides the physical
infrastructure needed for credit, input, training and service facilities. It can be reckoned as the
kingpin of the entire business. However, the question that merits attention is how far the
district level institution will be successful and how best they will be managed under the
relaxed market conditions. Although in the past various research workers have carried out
various studies with varying spectrum of issues, the studies related to economic viability of
district level institution are not very many, especially under the free market environment. It is,
therefore, imperative to study and evaluate the financial health and economic viability of
these district level units under more liberalised regime of market environment and assess what
changes are most discernable as far as their functioning and management are concerned.
The focus of the present study is on assessing viability of only central level credit
institutions operating in both forward district of Sangli and backward district of Buldana.
These central level credit institutions are: Sangli District Central Cooperative Bank (SDCCB)
and Buldana District Central Cooperative Bank (BDCCB). The viability of these credit
institutions is evaluated with the help of estimation of break-even levels of their total loan
advances and deposits, and also through estimation of various financial ratios, particularly for
the period between 1984-85 and 1998-99.
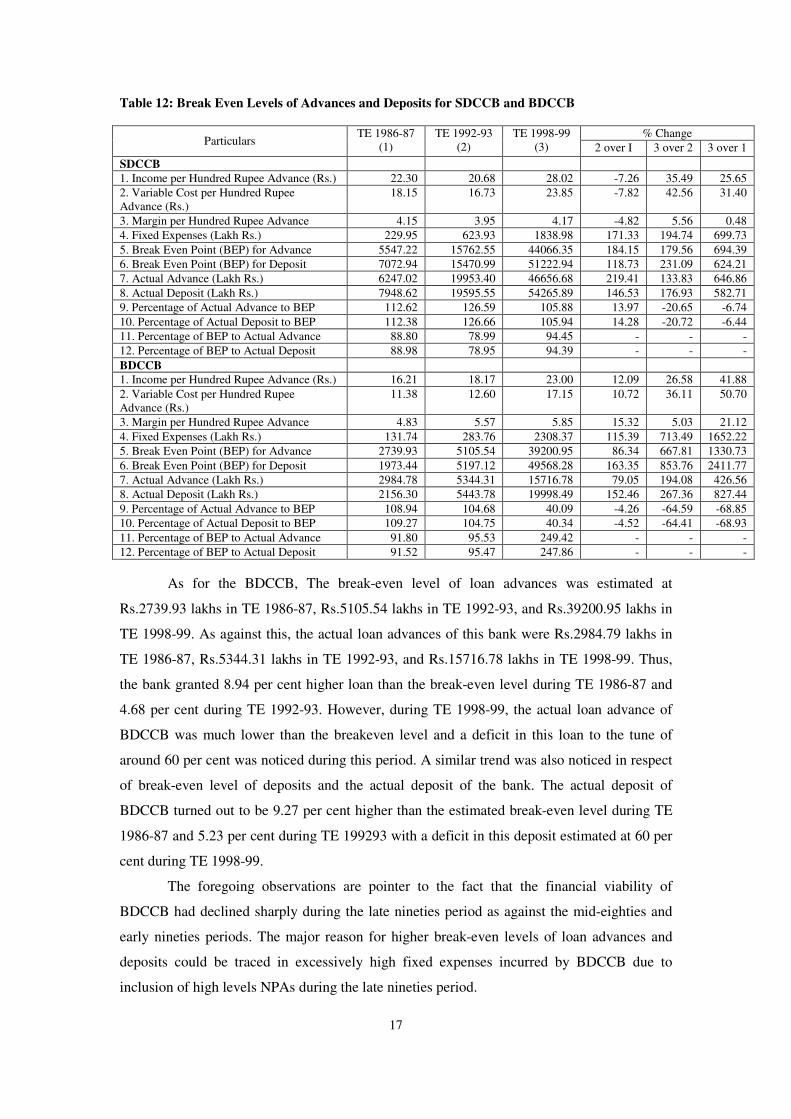
Break-even Analysis of Advances and Deposits
The estimates on the variable cost incurred and income generated in respect of per
hundred rupee of money spent on advances coupled with break-even points of loan advances
and deposits for SDCCB and BDCCB encompassing the period between 1984-85 and 198-99
are provided in Table 12.
The estimates provided in Table 12 show that the SDCCB granted 12.62 per cent
higher loan than the break-even level during TE 1986-87, 26.59 per cent during TE 1992-93,
and 5.88 per cent during TE 1998-99. A similar trend was also noticed in respect of break-
even level of deposits and actual deposit of the bank. The actual deposit of SDCCB turned out
to be 23.38 per cent higher than the estimated break-even level during TE 1986-87, 26.66 per
cent during TE 1992-93 and 5.94 per cent during TE 1998-99. Thus, the financial viability of
SDCCB had declined during TE 1998-99 as against TE 1986-87 and TE 1992-93 consequent
to break-even levels of both advances and deposits becoming very close to actual advances
and deposits during the late nineties as compared to mid-eighties and the early nineties.
17
Table 12: Break Even Levels of Advances and Deposits for SDCCB and BDCCB
% Change Particulars
TE 1986-87
(1)
TE 1992-93
(2)
TE 1998-99
(3) 2 over I 3 over 2 3 over 1
SDCCB
1. Income per Hundred Rupee Advance (Rs.) 22.30 20.68 28.02 -7.26 35.49 25.65
2. Variable Cost per Hundred Rupee
Advance (Rs.)
18.15 16.73 23.85 -7.82 42.56 31.40
3. Margin per Hundred Rupee Advance 4.15 3.95 4.17 -4.82 5.56 0.48
4. Fixed Expenses (Lakh Rs.) 229.95 623.93 1838.98 171.33 194.74 699.73
5. Break Even Point (BEP) for Advance 5547.22 15762.55 44066.35 184.15 179.56 694.39
6. Break Even Point (BEP) for Deposit 7072.94 15470.99 51222.94 118.73 231.09 624.21
7. Actual Advance (Lakh Rs.) 6247.02 19953.40 46656.68 219.41 133.83 646.86
8. Actual Deposit (Lakh Rs.) 7948.62 19595.55 54265.89 146.53 176.93 582.71
9. Percentage of Actual Advance to BEP 112.62 126.59 105.88 13.97 -20.65 -6.74
10. Percentage of Actual Deposit to BEP 112.38 126.66 105.94 14.28 -20.72 -6.44
11. Percentage of BEP to Actual Advance 88.80 78.99 94.45 - - -
12. Percentage of BEP to Actual Deposit 88.98 78.95 94.39 - - -
BDCCB
1. Income per Hundred Rupee Advance (Rs.) 16.21 18.17 23.00 12.09 26.58 41.88
2. Variable Cost per Hundred Rupee
Advance (Rs.)
11.38 12.60 17.15 10.72 36.11 50.70
3. Margin per Hundred Rupee Advance 4.83 5.57 5.85 15.32 5.03 21.12
4. Fixed Expenses (Lakh Rs.) 131.74 283.76 2308.37 115.39 713.49 1652.22
5. Break Even Point (BEP) for Advance 2739.93 5105.54 39200.95 86.34 667.81 1330.73
6. Break Even Point (BEP) for Deposit 1973.44 5197.12 49568.28 163.35 853.76 2411.77
7. Actual Advance (Lakh Rs.) 2984.78 5344.31 15716.78 79.05 194.08 426.56
8. Actual Deposit (Lakh Rs.) 2156.30 5443.78 19998.49 152.46 267.36 827.44
9. Percentage of Actual Advance to BEP 108.94 104.68 40.09 -4.26 -64.59 -68.85
10. Percentage of Actual Deposit to BEP 109.27 104.75 40.34 -4.52 -64.41 -68.93
11. Percentage of BEP to Actual Advance 91.80 95.53 249.42 - - -
12. Percentage of BEP to Actual Deposit 91.52 95.47 247.86 - - -
As for the BDCCB, The break-even level of loan advances was estimated at
Rs.2739.93 lakhs in TE 1986-87, Rs.5105.54 lakhs in TE 1992-93, and Rs.39200.95 lakhs in
TE 1998-99. As against this, the actual loan advances of this bank were Rs.2984.79 lakhs in
TE 1986-87, Rs.5344.31 lakhs in TE 1992-93, and Rs.15716.78 lakhs in TE 1998-99. Thus,
the bank granted 8.94 per cent higher loan than the break-even level during TE 1986-87 and
4.68 per cent during TE 1992-93. However, during TE 1998-99, the actual loan advance of
BDCCB was much lower than the breakeven level and a deficit in this loan to the tune of
around 60 per cent was noticed during this period. A similar trend was also noticed in respect
of break-even level of deposits and the actual deposit of the bank. The actual deposit of
BDCCB turned out to be 9.27 per cent higher than the estimated break-even level during TE
1986-87 and 5.23 per cent during TE 199293 with a deficit in this deposit estimated at 60 per
cent during TE 1998-99.
The foregoing observations are pointer to the fact that the financial viability of
BDCCB had declined sharply during the late nineties period as against the mid-eighties and
early nineties periods. The major reason for higher break-even levels of loan advances and
deposits could be traced in excessively high fixed expenses incurred by BDCCB due to
inclusion of high levels NPAs during the late nineties period.

18
Financial Ratio Analysis
Five different categories of ratios have been estimated with a view to analyse the
operational and functional efficiency of SDCCB and BDCCB and these ratios for the three
time periods under consideration are brought out in Table 13.
A critical evaluation of Table 13 revealed that though the financial health of SDCCB
had improved during the second half as against the former half of the overall period
considered, the more recent period, i.e. the late nineties period, was found to be marked with
declining profitability ratios, fixed ratio, asset turnover ratio, income-expenditure ratio,
equalization and income multiplier, and marginal efficiency of capital of SDCCB. Although
the capitalization ratio of SDCCB gave an indication that the permanent capital of this
financial institution had increased over time, this increase in permanent capital of SDCCB,
however, might not be considered as a sign of improvement in its efficiency since major
portion of SDCCB’s assets were financed by debt and this dependency on debt had
marginally increased during the latter half as against the former half of the overall period.
Further, hardly any improvement in the net worth of SDCCB was observed and in fact the
share of net worth in total liability of SDCCB had rather declined over time.
Table 13: Financial Ratio Analysis for SDCCB and BDCCB
Financial Ratios SDCCB BDCCB
TE
1986-87
TE
1992-93
TE
1998-99
TE
1986-87
TE
1992-93
TE
1998-99
A. Liquidity Ratios
a. Current Ratio 1.40 1.45 1.73 1.13 1.18 1.14
b. Acid Test Ratio 1.06 0.85 1.05 0.98 1.10 1.48
B. Profitability Ratios
a. Rate of Return on Asset (%) 0.27 0.58 0.15 0.24 0.13 -4.37
b. Return on Owner’s Equity 3.74 7.47 2.10 2.67 1.62 -67.77
C. Financial Leverage Ratios
a. Debt-Asset Ratio (%) 92.67 93.28 93.16 91.13 91.81 93.00
b. Capitalization Ratio (%) 87.55 87.83 89.84 0.73 0.81 0.86
c. Fixed Ratio 0.31 0.38 0.31 0.64 0.56 0.55
d. Net Capital Ratio 1.08 1.07 1.08 1.10 1.09 1.08
e. Equity Ratio 0.08 0.07 0.08 0.10 0.09 0.08
f. Equity to Asset Value Ratio 0.07 0.07 0.07 0.09 0.08 0.07
D. Efficiency Ratios
a. Asset Turnover (times) 0.62 0.71 0.66 0.55 0.52 0.55
b. Accounts Receivable Turnover (times) 16.11 10.25 19.87 12.80 8.66 5.71
c. Days Advances Outstanding (days) 22.72 37.44 18.62 28.62 42.85 67.73
E. Income Ratios
a. Income-Expenditure Ratio (%) 101.96 104.27 100.78 102.75 101.37 81.66
b. Gross Ratio (%) 98.09 95.91 99.20 97.35 98.65 131.86
c. Operating Ratio (%) 79.16 77.72 84.03 64.58 64.95 69.00
d. Rate of Capital Turnover 0.14 0.15 0.18 0.09 0.09 0.13
F. Other Diagnostic Tools / Ratios
a. Equalization Multiplier - 49.02 36.01 - 22.45 34.50
b. Income Multiplier - 6.62 4.73 - 8.67 6.99
c. Marginal Efficiency of Capital 0.27 0.58 0.14 0.32 0.16 -4.46
d. Debtors / Creditors Ratio 5.37 3.83 5.95 3.02 3.81 6.29

19
The declining share of net worth was instrumental in causing an increase in debt asset
ratio of SDCCB during the latter period. This apart, the return on owner’s equity had also
drastically fallen during the late nineties period as against the early nineties. Thus, it could be
interpreted that the financial health and economic viability of SDCCB had considerably
declined in more recent times, ignoring increasing trends in several financial ratios. In fact,
the return on owner’s equity is a function of how efficiently a firm manages its assets, the net
profit margin on sales, and the degree of financial leverage. A decline in returns on equity of
SDCCB could, therefore, be considered as a sign of decline in the efficiency of SDCCB in
managing its assets and liabilities, and also income and expenditure pattern, especially in
more recent times.
Insofar as the BDCCB is concerned, the mounting NPAs or overdue or bad debt
during the late nineties period had adversely affected majority of the estimated ratios during
this period. Not only the permanent capital position of BDCCB was noticed to weaken during
the late nineties period but its dependency on debt for its finances had also sharply increased
during this period. The share of net worth in total liability of BDCCB was also noticed to
have sharply declined during the period between mid-eighties and the late nineties. The
declining share of net worth had caused an increase in debt asset ratio of BDCCB during this
period. Added to this, the return on equity of BDCCB had not only drastically fallen but it
became negative during the late nineties period as against the mid-eighties or the early
nineties period. The rate of return on asset and marginal efficiency of capital of BDCCB had
also shown a drastic fall during the period between early- and the late nineties. All these
disquieting trends clearly indicate non-viable functioning of BDCCB during the more recent
times. Further, the negative value of return on equity of BDCCB noticed during the late
nineties period clearly indicates inefficiency of BDCCB in managing its assets and liability,
as also its income and expenditure patterns.
Conclusions
The slower growth in institutional finances through commercial banks, credit
cooperatives, RRBs and LDBs, particularly during the decade of 1991-2000, is mainly due to
adverse environment created by the financial sector reforms. Due to unfavourable policy
framework, the entire rural credit delivery system encompassing rural branches of commercial
banks, cooperative credit institutions and RRBs is reduced to a moribund state. It is to be
noted that high transaction costs and poor repayment performance are the twin root causes of
this moribund state of rural credit delivery system. With a view to revive the agricultural
credit delivery system, there is a need to adopt innovative approaches like linking of Self-
Help Groups (SHGs) and Non-Government Organizations (NGOs) with mainstream financial

20
institutions. Such linkages are reported to have not only reduced transaction costs but also
resulting in better repayment performance.
One of the recent welcome developments in rural credit has been the establishment of
the Rural Infrastructure Development Fund (RIDF) instituted by NABARD with the objective
of advancing loans to state governments and state-owned corporations for hastening ongoing
projects, that is, mainly those relating to medium and minor irrigation, soil conservation,
watershed management, etc. However, the utilization of this fund was reported to be dismal at
only 30 per cent (Mujumdar, 2001). One of the further disquieting features of RFIs in
Maharashtra has been the incidence of high proportion of NPAs to total assets, particularly
with respect to RRBs and SCARDBs, and it was estimated to hover around 36-48 per cent
during the mid-to late nineties.
An analysis encompassing central level credit cooperatives operating in forward and
backward districts of Maharashtra also revealed deterioration in their financial health due to
mounting NPAs or overdues’. It is to be noted that both SDCCB and BDCCB showed a
decline in their financial health and economic viability during the late nineties as against the
early nineties period. Nonetheless, this deterioration in financial health witnessed particularly
during the second half (between TE 1992-93 and TE 1998-99) of the overall period (TE 1986-
87 and TE 1998-99) was found to be more pronounced in the case of BDCCB as not only
various financial ratios estimated for this bank had declined during this period but majority of
them were seen to be beset with negative values, especially during the late nineties period.
The mounting NPAs or overdues’ of BDCCB, noticed during the late nineties period, had
grossly affected the functioning of this bank. They had not only affected various estimated
financial ratios but also break-even levels of loan advances and deposits of this bank. Because
of substantially high NPAs, the fixed expenses of BDCCB had been adversely affected, which
in turn had grossly affected the break-even levels of loan advances and deposits of this bank,
so much so that there had been huge gap between the break-even levels of loan advances and
deposits and the actual loan advances and deposits. The deficit between actual and the break-
even levels were so high (about 60 per cent) that it was well-nigh impossible for BDCCB to
overcome this situation. The mounting NPAs of BDCCB had also affected the profit profile
of this bank during the late nineties period. The proportions of actual advance and deposits to
their break-even levels of SDCCB had also come down during the latter half (between TE
1992-93 and TE 1998-99) as against the former half (between TE 1986-87 and TE 1992-93)
of the overall period considered. Nonetheless, mention may be made here that there was no
deficit between actual and break-even levels of loan advances and deposits of SDCCB during
this period. Thus, while BDCCB had shown gross inefficiency in its functioning during the

21
latter half of the overall period, the SDCCB, on the other hand, showed only a general
deterioration in its financial health during this period.
One of the reasons for such high incidence of NPAs of RFIs has been the familiar
practice of debt forgiveness, which eroded repayment and allowed defaulters to go scot free
with no deterrent reprimand. Political interference in issues of prudent fiscal management has
got a lot to do with this unfortunate scenario. There is, therefore, a need to take more stringent
and cohesive measures for recovery of loans from chronic and heavy defaulters. In brief, in
order to rejuvenate rural credit delivery system, the twin problems facing the system, viz.,
high transaction costs and poor repayment performance, need to be tackled with more fiscal
jurisprudence reserving exemplary punishment for willful defaults, especially by large
farmers. In fact, insofar as the rural credit delivery system is concerned, the focus should be
on strategies that are required for tackling issues such as sustainability and viability,
operational efficiency, recovery performance, small farmer coverage and balanced sectoral
development (Puhazhendhi and Jayaraman, 1999).
Notes
1. Lack of recovery of loan results into overdues. Overdues are defined as loans and
interest thereon not repaid on due dates. The financial health of banking business
heavily depends on recovery of loans. Of the total amount of loan due at different
points of time, some of it is recoverable and some irrecoverable and the latter often
turns into bad debt or defaults (Gulati and Bathla, 2002).
2. As per M. Narasimham (RBI 1991) Committee, the non performing assets (NPAs) are
those loan advances which are marked with non payment of interest or repayment of
principal or both for a period of two quarters or more during the year ending. An
amount is considered as ‘post due’ if it is unpaid for 30 days beyond due date. The
NPAs are broadly classified as sub-standard, doubtful and loss assets.
3. The forward and backward districts were identified through composite index method.
The composite index was computed for each district and the parameters included in
the construction of composite index were cropping intensity, irrigation intensity,
operational holding, number of commercial banks, per capita bank credit to
agriculture, per hectare bank credit to agriculture, outstanding agricultural finance,
number of cooperative banks, membership of PACs, loan advances of PACs, and
outstanding loans of PACs. Based on these indicators, the total composite score of
each district was computed. The districts showing scores above 100 were treated as
forward and districts showing scores below 100 were considered as backward. Thus,
following this procedure the forward and backward districts of Maharashtra were
separated. This procedure helped to develop a scale for ranking all the forward and
backward districts of Maharashtra.
4. In terms of directed credit, the Reserve Bank of India (RBI) has stipulated several
targets for Public Sector Banks (PSBs). These encompass a minimum of: (a) 40 per
cent of net bank credit to priority sectors, (b) 18 per cent of total advances to
agriculture, (c) 10 per cent of total advances to weaker sections, (d) one per cent of
net bank credit under differential rate of interest (DRI) scheme, and (e) maintenance
of a 60 per cent of a credit-deposit ratio. Among these targets, (b) and (c) are the two

22
sub targets of (a), i.e., 18 per cent of net bank credit to agriculture and 10 per cent to
weaker sections with an overall 40 per cent of net bank credit to priority sectors.
5. The overdues of Primary Cooperative Agriculture Rural Development Banks
(PCARDBs) at all-India level is reported to have grown from Rs.196.43 crores in
1987 to Rs.435.20 crores in 1995 (Kumar and Dixit, 1998). Earlier, while reviewing
the report of Agricultural Credit Review Committee, Shivamaggi (1996) had also
cited overdue as the major problem facing the LDBs. This is despite the fact that the
loans extended by LDBs not only help in creating productive assets but also in terms
of generating adequate incremental income to the farmers.
6. The linkage between banks and SHGs is a mechanism for channeling credit to the
poor on a sustained basis. There are numerous potential advantages involved in the
linkages between banks and SHGs with NGOs acting as facilitators or financial
intermediaries. From the banks point of view, the advantages of linkage approach
between banks and SHGs include reduction in transaction cost, mobilization of small
savings, assured and timely repayment of loan leading to faster recycling of funds,
opportunity for expansion of business and coverage of poor clientele, and prospects
of future quality clients. In this process, NGOs not only act as bridge between banks
and the poor and perform their role as financial intermediaries in unbanked and
backward areas but they are also propagators of innovative credit delivery
approaches. The efforts of NGOs develop thrift habit among the poor and provide
them access to large quantity of finance. The efforts of NGOs in linking banks with
SHGs also provide freedom, equality, self-reliance and empowerment among the
members, besides making them available consumption/ production credit at their
door-steps. This in turn helps the members of SHGs to have a window for access to
better technology and upgradation of their skills. The NGOs also help SHGs to have
access to various promotional assistance, besides scaling up of their operations.
References Capoor, Jagdish (1998), Valedictory Address at the National Seminar on ‘Organisational
evelopment Approach to Revamping of Regional Rural Banks’, Proceedings of the
National Seminar, Banking Institute of Rural Development, Lucknow.
Gulati, Ashok and Seema Bathla (2002), ‘Institutional Credit to Indian Agriculture: Defaults
and Policy Options’, Occasional Paper-23, NABARD, Mumbai.
Kumar, Sant and R.S. Dixit (1988), ‘Long-term Credit Requirements of Rural India: Role of
PLDBs’ , in ‘India’s Rural Cooperatives’, Gurasharan Singh Kainth (Ed.), Regency
Publications, New Delhi, pp. 185-192.
Mujumdar, N.A. (2001), ‘The New Architecture of the Rural Credit System’, Professor M.L.
Dantwala Monograph Series Monograph No. 1, Department of Economics,
University of Mumbai, Mumbai, August.
Puhazhendhi, V. and B.Jayaraman (1999), ‘Rural Credit Delivery: Performance and
Challenges Before Banks’, EPW, January 16, pp. 175-182.
Shah, Deepak (2001), ‘How Far Credit Co-operatives are Viable in New Economic
Environment : An Evidence from Maharashtra’, Prajnan, Vol. 30, No. 2, July-
September, pp. 149-174.
Shivamaggi, H.B. (1996), ‘Future Strategy for Development of Co-operatives’, Economic and
Political Weekly, Vol. XXXI, No. 20, pp. 1187-1188.
Shivamaggi, H.B. (2000), ‘Reforms in Rural Banking: Need for Bolder pproach’, Economic
and Political Weekly, Vol. XXXV, No. 20, pp. 1714-1718.

23


