download (202kb) - munich personal repec archive
TRANSCRIPT

MPRAMunich Personal RePEc Archive
A New Framework forOutput-Unemployment Relationship:Okun’s Law Revisited
Mustafa Ismihan
Atilim University
December 2010
Online at https://mpra.ub.uni-muenchen.de/28135/MPRA Paper No. 28135, posted 18. January 2011 20:06 UTC

1
A New Framework for Output-Unemployment Relationship:
Okun’s Law Revisited
Mustafa Ismihan
Department of Economics, Atilim University, Incek-Golbasi, 06836, Ankara, Turkey
(Tel: +90 312 5868604; Fax: +90 312 586 8091; E-mail: [email protected].)
This version: December 2010
Previous version: July 2008

2
Abstract
This paper provides a new and useful framework for developing various models to investigate the output-unemployment relationship. By using this framework, a simple but reasonable theoretical background to Okun’s law is derived. This theoretical background, in turn, facilitates the decomposition of Okun’s law coefficient into several quantifiable and interpretable components that incorporate main insights from Arthur Okun’s original analysis. The empirical decomposition exercise indicates that Okun’s law has an inherent tendency to vary substantially over time, especially, in response to the structural changes in legal, institutional and other related characteristics of labor and goods markets.
Keywords: output-unemployment relationship; Okun’s law
JEL classification: E24, E32, C2

3
1. Introduction
Okun’s law is generally considered as one of the cornerstones of macroeconomics. This is
mainly attributed to its practical use, as a short-cut for the relationship between the change
in unemployment and output growth, both in policy decisions and evaluations (see, for
example, Krugman (2009) for the evaluation of the president Obama’s stimulus package
in the United States). Additionally, it is often treated as one of the crucial components of
macroeconomic models that link output and labor markets (see, e.g., Blinder, 1997).1
Nevertheless, despite its popularity Okun’s law has been criticized heavily on several
grounds. The major criticism is that Okun’s law is purely an empirical regularity, which
lacks a theoretical framework. Even though a number of studies have attempted to provide
theoretical foundations for Okun’s law (Gordon, 1973, 1984; Prachowny, 1993),2 so far
there is no consensus that the existing studies fully capture the nature of Okun’s law. To
put it differently, these studies lack a clear analytical framework with an explicit account
of the transmission channels suggested by Arthur Okun. Therefore, there is still need for
an appropriate theoretical framework that incorporates main insights from Arthur Okun’s
original analysis (Okun, 1962).
The second criticism is related to the reliability of Okun’s law. A number of empirical
studies have shed doubt on the stability of Okun’s relationship in many industrialized
countries including the United States (e.g., Altig, Fitzgerald, and Rupert, 1997; Kaufman,
1988; Lee, 2000; Moosa, 1997; Sögner and Stiassny, 2002).3 Furthermore, several studies
1 Furthermore, Okun’s law also provides an alternative way to estimate and forecast potential output (see,
e.g., US Congressional Budget Office, 2004). 2 Gordon (1984), for instance, provided an analytical framework to Okun’s law based on output identity.
Prachowny (1993), on the other hand, has shown that Okun’s relationship can be considered as a special
case of a production function model. These two studies are widely acknowledged by other researchers;
however, there are also other studies which attempt to provide some analytical framework to Okun’s law
(e.g., Sheehan and Zahn, 1980; Hamada and Kurosaka, 1984; Mairesse, 1984; Knoester, 1986; Sögner and
Stiassny, 2002).
3 A number of more recent studies argued that Okun’s law collapsed in the United States during the recent
economic recovery from the latest financial crisis (e.g., Ball and Koenig, 2009). Gordon (2010, p. 13) went
further and stated that “Okun’s Law is obsolete for the 1986-2009 interval … since there is no longer any
procyclical responsiveness of output per hour”. In contrast, by pointing to the international evidence on the

4
pointed to the role of institutional and related features of the labor market (e.g.
employment practices of firms) and the goods market (e.g. the role of foreign competition)
as potential reasons for the variation in Okun’s coefficient across time and country4 (see,
for example, Kaufman (1988) and Lee (2000) for a review).
Another related issue to the above criticisms is that Okun’s law is often treated as a
behavioral rather than a reduced-form relation and this, in turn, leads to misinterpretation
of the law. To put it differently, while Arthur Okun interpreted his relationship on a
mutatis mutandis basis (Okun, 1962), many researchers and several textbooks have
preferred to interpret it –albeit wrongly– on a ceteris paribus basis (Prachowny, 1993).5
More specifically, Arthur Okun clearly stated that his relationship contains not only the
direct effect of output growth on unemployment but it also incorporates the induced
changes in the supply-side variables; namely, labor force, productivity and hours worked
per worker. In other words, Arthur Okun was referring to a reduced-form relation –that
contains both the direct and indirect effects– in his seminal study. All this raises the
possibility that Okun’s relation is highly sensitive to the structural changes in the economy
–such as those in labor and goods markets. Therefore, significant changes in the structural
relations representing the induced effects may possibly lead to a substantial variation in
Okun’s relation over time. Considering this point and the previously mentioned two
criticisms lead us to the conclusion that there is a need for a more general framework
which can incorporate the role of both demand-side and supply-side factors on
unemployment.
The purpose of this paper is to address these two criticisms6 by providing a new
framework that will allow us to derive various models to explore the relationship between
banking crises, Knotek and Terry (2009) argued that factors related to such crises (e.g. unusually high
uncertainty and credit-constraints faced by firms and households) may lead to a large and persistent increase
in unemployment, which can exceed the prediction based on the plain form of Okun’s law.
4 Knoester (1986), Paldam (1987) and Kaufman (1988) provided the early evidence on cross-country
differences in the Okun’s coefficient.
5 However, it must be noted that there are several textbooks which carefully explain the insights of Arthur
Okun. See, for example, Blanchard (2006).
6 There are also other problems and associated criticisms, particularly, regarding the issues related to the
estimation of coefficients in Okun’s law (e.g., Moosa, 1997). Furthermore, most of the recent research has
drawn attention to the possibility of non-linearity and asymmetry in Okun’s law (see, e.g., Silvapulle,
5
output growth and unemployment. This framework, in turn, enables us to provide a
reasonable theoretical background to Okun’s law and hence allows us to shed light on its
instability.
This work differs from the existing studies in several ways. A novel feature of this paper
is that it presents a new and useful framework for developing various models to explore
the output-unemployment relation. In other words, Okun’s law and its variants are merely
a few possibilities among the pool of possible models. Another distinguishing feature is
that, unlike the existing studies, this work provides a theoretical framework to the original
difference version of the Okun’s law and to its recent popular gap version, by tracing the
transmission channels suggested by Arthur Okun.
The rest of the paper is organized as follows. Section 2 aims at providing the derivation of
the new framework for the output-unemployment relationship by integrating the
unemployment and output identities with a suitable macroeconomic equilibrium condition.
Section 3, in turn, utilizes this framework to provide a reasonable theoretical background
to the difference version of Okun’s law. This section also investigates the sources of
possible instability by decomposing the Okun’s law coefficient for the sample of six
countries7 over the period 1960-2005. Finally, Section 4 concludes the paper.
2. A New Framework
In order to develop a new framework for the output-unemployment relation, this study
initially utilizes the definition of unemployment rate (U): Ut ≡ 1- Lt/Ft, where L is the
number of people employed, F is the number of people in labor force and t represents
time. A change in unemployment rate can be obtained by taking the first difference of this
identity,
Moosa, and Silvapulle (2004) for a review). Nevertheless, these issues are not taken up in this work since
they are beyond the scope of this paper.
7 The sample includes all the members of the G-7 except Germany; namely, the United States, Canada, the
United Kingdom, France, Italy and Japan. It should be noted that Germany is excluded due to the data
related problems arising from the unification of West and East Germany in 1990. This study also uses
annual rather than quarterly data mainly because of the data unavailability and/or consistency problems
associated with the quarterly data, especially for the 1960s.

6
t
t
t
tt
F
L
F
LU −≡∆
−
−
1
1 , (1)
where ∆ is the difference operator.
Substituting the relations Lt = (1+gLt)Lt-1 and Ft = (1+gFt)Ft-1, where gXt represents the
proportionate change in variable X in time t, into Eq. (1) and rearranging terms yield the
following
)1
11(1
t
ttt
gF
gLNU
+
+−≡∆ − , (2)
where N is the employment rate (Nt=Lt/Ft).
The below equation can be obtained by approximating [1-(1+gLt)/(1+gFt)] with [∆ft-∆lt]
)(1 tttt lfNU ∆−∆=∆ − , (3)
where the lower case letters represent logarithms, e.g. x = ln(X), and ∆x is the growth rate
of X.
The relation contained in Eq. (3) is non-linear. However, it can be approximated with the
following linear equation,
)( ttt lfU ∆−∆=∆ ϕ , (4)
where φ is assumed to be equal to the average value of the employment rate over the time
period under consideration.8
8 This assumption seems to be plausible since the employment rate usually moves in the vicinity of its
expected value over time. Nevertheless, in order to provide an approximation for a change in unemployment
rate, several researchers utilized the logarithmic transformation of the unemployment identity in their
analyses, i.e. ∆U=∆f-∆l. Sögner and Stiassny (2002), for example, utilized this approximation to relate the

7
Now, let’s consider the following equation which provides the equilibrium condition in
the goods market,
s
t
d
t YY = , (5)
where Yd and Ys represent the demand for and supply of aggregate output, respectively.
Eq. (5) can be rewritten in growth-form as follows
s
t
d
t yy ∆=∆ . (6)
The following equation decomposes output growth (∆ys) into the growth rates of labor
productivity (∆p), labor force (∆f), average hours worked per worker (∆h), and the
employment rate (∆n).9
t
n
t
s
t nyy ∆+∆=∆ , (7)
where ∆yn represents the natural rate of growth, i.e. ∆yn = ∆p+∆f +∆h.
Substituting Eq. (7) into (6) and rearranging terms yield
n
t
d
tt yyn ∆−∆=∆ . (8)
By combining Eqs. (4) and (8), as well as utilizing the relation ∆n = ∆l-∆f, one obtains a
useful equation that links labor and output markets:
instability in Okun’s law coefficient to the structural changes in labor supply and demand. Appendix A
provides both visual and formal evidence confirming the superiority of a linear approximation in equation
(4) against the logarithmic transformation. 9 Eq. (7) is derived by taking the log-difference of the following identity: Ys
≡P.F.H.N, where P is labor
productivity; P=Ys/(L.H), H is average hours worked per worker, and other variables are as defined earlier.

8
)(n
t
d
tt yyU ∆−∆−=∆ ϕ . (9)
It is obvious from Eq. (9) that the change in unemployment rate is proportional to the
difference between the growth rate of output demand and the natural rate of growth. This
equation also implies that the unemployment rate decreases when output demand rises
faster than the natural rate of growth and vice versa. Thus, the above equation provides a
valid framework for the analysis of output-unemployment relation in the short-run. Eq. (9)
is also consistent with the notion of medium-run (see, Blanchard, 2006). That is, output
demand tends to grow at the natural rate of output over the medium-run and, as a result,
the unemployment rate does not change [Putting ∆yd = ∆yn in Eq. (9) implies that ∆U =
0].
Eq. (9) can also be utilized to analyze the sources of the change in unemployment rate
and, therefore, it can be rewritten as follows:
ttt
d
tt fhpyU ∆+∆+∆+∆−=∆ ϕϕϕϕ . (10)
Ceteris paribus, an increase in growth rate of output demand leads to a fall in the
unemployment rate. In contrast, other things kept constant, a rise in any one of the supply-
side factors (P, H and F) has opposite effects on the unemployment rate. However, there is
a serious problem with the clause “ceteris paribus” or “other things kept constant” since
these supply-side variables are sensitive to the state of the business cycle. In other words,
labor productivity, hours worked per worker and labor force change pari pasu with the
change in output demand. Table 1 provides the correlation of the change in output demand
(∆yd) with rates of growth of labor productivity (∆p), average hours worked (∆h) and
labor force (∆f) for the six countries. As is clear from the correlation coefficients in Table
1, the supply-side variables tend to have pro-cyclical relationships with output demand.
Especially, there is a statistically significant positive association between the growth rates
of labor productivity and output demand for all the six countries in the sample.
<Table 1>

9
Even though the above correlation analysis provides us with useful information on the
strength of linear association between the demand-side and supply-side variables, it does
not present any information about the structural or causal relations between those
variables. However, considering the fact that Eqs. (9) and (10) are derived from the
identities and the macroeconomic equilibrium condition, these equations could be used as
a framework to link output and labor markets. In other words, by formulating various
assumptions about the behavior of both the demand-side and supply-side variables in Eq.
(10) one can develop different models to explain the output-unemployment relation. The
following section aims to develop such a model, which can provide a reasonable
theoretical background to the difference version of Okun’s law.10
3. Okun’s Law: The Difference Version
3.1. Theoretical Framework
The following specification –which is Okun’s first specification (Okun, 1962, p. 99)– is
frequently used to estimate Okun’s relation,
d
tt yU ∆+=∆ 10 αα , (11)
where ∆U is the change in unemployment rate, ∆yd is the growth rate of real GDP, and α1
represents the Okun’s law coefficient (OLC).11
Eq. (11) implies that the change in unemployment rate is solely determined by the growth
rate of output demand. However, as mentioned before, Okun himself carefully explained
the role of the induced effects of labor productivity, average hours worked and labor force
on the output-unemployment relation and he emphasized that Okun’s law coefficient
10 Appendix C extends the analysis by considering the gap version of Okun’s law.
11 The main problem with the Okun’s law is the lack of a common specification. In some specifications (e.g.,
Lee, 2000), the change in unemployment rate appears as an explanatory variable and the growth rate of
output is treated as a dependent variable. Accordingly, the respective slope term is interpreted as OLC.
However, it should be noted that the lack of a common specification is mainly related to the different uses
and interpretations of Okun’s law (see, e.g., Hagemann and Seiter, 1999).

10
contains the combined effect of all variables (Okun, 1962). More specifically, Okun’s
analysis suggests that the supply-side factors –F, P and H– vary endogenously with the
level of output demand and hence with the state of business cycle. According to George L.
Perry, “the beauty of the [Okun’s] Law is its recognition of these endogenous things”
(Perry, 2000, p. 21). Additionally, it should be also noted that Okun’s law was formulated
in the heydays of Keynesian economics; therefore, the focus of this relationship is on
Keynesian unemployment (Knoester, 1986). As a result, while examining Okun’s law, one
should also keep in mind the traditional Keynesian assumption that output supply is
primarily driven by output demand in the short-run. This seems to be the basic idea and
hence the implicit assumption behind Okun’s emphasis on the indirect or induced effects.
Arthur Okun asserted several reasons as to why F, P and H would have pro-cyclical
relationships with the movement of output (Okun, 1962, pp. 102-104).12 In other words,
he suggested a number of transmission channels through which a change in output
demand influences the productivity, hours worked, and labor force over the business
cycle. For instance, as output demand decreases (increases), labor productivity may
decline (rise) due to labor hoarding.13 To put it differently, during downturns, firms tend
to adjust employment less relative to the change in output in order to abstain from the
firing costs (e.g. severance payments) as well as hiring costs (e.g. recruitment and
training) when the state of business cycle begins to change. Arthur Okun also points to
other factors –such as technological, legal and moral factors– as possible causes of labor
hoarding and hence a decline in productivity during recessions (Okun, 1962, pp. 103-
104).14 Similarly, average hours of work may decrease as a result of a fall in demand for
output and vice versa. In part, this is also related to labor hoarding but it may also include
other factors like the change in part-time work. Moreover, during recessions (expansions)
12 Also see Gordon (1973, pp. 137-8).
13 The notion of the pro-cyclical behavior of productivity was also noted by Hultgren (1960) and Oi (1962),
who formally argued that this pro-cyclicality can be due to the quasi-fixed nature of labor.
14 According to Arthur Okun, another possible reason for the pro-cyclical change in labor productivity is
sectoral shifts in employment and output (Okun, 1962, p. 104). Furthermore, Fay and Medoff (1985, p. 653)
found that “[n]ot all of the labor in excess of regular production requirements should be classified as
hoarded, since some of it was performing worthwhile other work. … [Therefore] the form, as well as the
total amount, of hoarding is important, since not all forms of hoarding provide a reserve of redundant labor
for the subsequent recovery.”

11
some unemployed people may stop (start) looking for jobs and this leads to a fall (rise) in
the level of labor force –which is known as the discouraged (encouraged) worker effect.
However, Arthur Okun also noted that there might be an opposite –additional worker–
effect of a recession on labor force: “the loss of a job by the breadwinner of a family
might increase the labor force by leading his wife and teen-age children to seek work”
(Okun, 1962, p. 102). Thus, the net effect of a recession on labor force depends on the
strength of the two opposite effects. Nevertheless, by pointing to the evidence available to
that date, Arthur Okun seems to be convinced that the former effect is stronger than the
latter.
Arthur Okun’s main objective was empirical, so he never attempted to provide formal
representations of the above transmission channels. These channels, however, can be
formulated in terms of behavioral relationships as follows15
d
tt yp ∆+=∆ 11 δγ , (12)
d
tt yh ∆+=∆ 22 δγ , (13)
d
tt yf ∆+=∆ 33 δγ , (14)
where δ1, δ2, δ3 represent the effect of a one percentage point change in output growth on
∆p, ∆h, ∆f, respectively; γ1, γ2, γ3 represent the growth rate of P, H and F, respectively,
independent of the growth rate of output demand.
For the sake of convenience, Eqs. (12)-(14) can be contained in a single equation as
follows
d
t
n
t yy ∆+=∆ δγ , (15)
where 321 γγγγ ++= and 321 δδδδ ++= . It should be noted that γ represents the growth
rate of natural output which is independent of the growth rate of output demand and δ
represents the responsiveness of ∆yn to ∆yd.
15 However, it must be noted that Okun himself attempted to estimate an equation corresponding to the
structural relation as in Eq. (13) (Okun, 1962, p. 103).

12
It is worth emphasizing that the above structural equations reflect the traditional
Keynesian view that variations in output supply are primarily driven by exogenous
changes in aggregate demand in the short-run.16 In other words, ∆yd is treated as
exogenous in this setup.
The simple model developed so far –for the difference version of Okun’s law– contains
two equations; namely, Eqs. (9) and (15).17 While Eq. (9) is a relation that links labor and
output markets, Eq. (15) is a behavioral relationship which represents the above
mentioned transmission channels through which a change in output demand influences the
supply-side variables and hence the output supply. Therefore, combining Eq. (9) with (15)
yields the reduced-form equation for the Okun’s law relation as follows
d
tt yU ∆++=∆ )-( ϕδϕϕγ , (16)
where -φ+φδ is the reduced-form of OLC and φγ corresponds to the intercept term in Eq.
(11).
As is clear from the above equation, OLC contains a number of structural parameters
which represent the previously mentioned features of macroeconomic adjustment process
over the business cycle. More specifically, it is obvious from Eq. (16) that Okun’s
coefficient does not only represent the direct –employment creation– effect (-φ) of the
growth rate of output on unemployment but also contains the indirect effect (φδ) of ∆yd on
∆U. While the former effect is favorable –reduces unemployment– the latter is
unfavorable. Clearly, the magnitude of OLC depends on the relative sizes of the two
opposing effects; namely, the direct and the indirect effects. The size of the indirect effect
is, in turn, determined by the magnitudes of the three effects: the productivity effect (φδ1),
hours worked effect (φδ2) and labor force effect (φδ3).18
16 However, Blanchard and Quah (1989) noted that the response of unemployment to the output growth
substantially differs depending on whether a disturbance is from a demand-side or supply-side.
17 Alternatively, this model is represented by Eq. (10) and Eqs. (12)-(14).
18 Thus, this decomposition analysis formally confirms that the Okun’s relationship represents the combined
effect of a number of variables and, as a result, it should be interpreted on a mutatis mutandis basis.

13
Considering the simple structure of the model (e.g. ∆yd is treated as exogenous), the
structural parameters –δ1, δ2 and δ3– can be estimated by applying ordinary least squares
(OLS) to the stochastic versions of the structural relations. Given that φ is equal to the
average value of employment rate, then OLC can be easily decomposed into the direct
effect and the indirect effect.
To sum up, it is clear from the above analysis that OLC can be decomposed into several
quantifiable and interpretable components. To the extent that these components or effects
vary across countries and over time, this analytical framework may help to investigate the
sources of cross-section variation and possible intertemporal instability through
decomposing the Okun’s law coefficient. The following sub-section, therefore, provides
an empirical application which illustrates the usefulness of this approach.
3.2. A Decomposition Exercise
This sub-section presents an empirical application of the above decomposition of OLC for
the sample of six countries over the period 1961-2005. Table 2 shows the estimates of the
OLC and its decomposition for both the overall period and the two sub-periods (Pre-1980
vs. Post-1980).19 The first column in Table 2 presents the OLS estimates of OLC (α1) as
contained in Eq. (11).20 The second column provides the values for OLC derived from the
decomposition exercise (denoted as α1') as the net effect of direct and indirect effects.
Comparing the estimates in each of the two columns indicates that the estimated and the
derived OLC (α1 and α1', respectively) are identical for overall period in all countries but
only slightly different in some sub-samples in the three countries (the United States,
Canada and the United Kingdom) probably due to the small sample size. This comparison,
in fact, confirms the validity of the above decomposition framework.
19 To shed some light on the instability of OLC, this decomposition exercise is also performed for the two
sub-periods. For the sake of cross-country comparison, 1980 is chosen as the uniform “break” point for all
countries. Nevertheless, it must also be noted that the qualitative nature of the results in this section also
holds for different sub-periods (e.g. Pre-1973 vs. Post-1973).
20 It should be noted that these estimates are not directly comparable with the estimates of the previous
empirical studies mainly because of the differences in model specification (i.e. the lack of a common
specification for the Okun’s law) and the sample period. However, the qualitative nature of empirical results
is broadly in line with previous studies.

14
<Table 2>
A number of remarkable results emerge from this empirical exercise. First, Okun’s law
coefficient varies substantially across countries over the whole sample period. This result
is in line with the literature suggesting that the response of unemployment to output
growth is low (high) in those countries having high (low) job security provisions (e.g.,
Bertola, 1990; Di Tella and MacCulloch, 2005).21 For instance, the lowest response of
unemployment to output growth is found for Japan (-0.03), which is mainly due to the
strong commitment of Japanese firms to job security. In contrast, US firms have weak
commitment to job security as a consequence of the less restrictive nature of the legal,
social and institutional features of the US labor market on hiring and firing. Thus, Okun’s
coefficient is the highest in absolute value for the United States (-0.40) over the period
1961-2005. Canadian and the UK’s labor markets are similar to that of the US and,
therefore, they also have larger OLC in absolute value. Similarly, the values of Okun’s
coefficient for the other European countries –Italy and France– are in between the values
for Japan and the United States since these European countries have more restrictions on
hiring and firing compared to the United States. However, Italy has relatively more
restrictions and therefore has a lower OLC in absolute value among the three European
countries.
As is evident from Table 2, cross-country variations in the Okun’s coefficient are mainly
due to the differences in the indirect effect. To shed more light on these results, the third
and fourth columns in Table 2 present the decomposition of OLC for the six countries. As
can be seen from these two columns while the magnitudes of the direct effect (-φ) are
similar among the six countries, the magnitudes of the indirect effect (φδ) differ
substantially between these countries. In fact, in line with the above observations, the
indirect effect is the highest for Japan and the lowest for the United States and the
magnitudes of the indirect effect for the remaining countries are in between the values for
the United States and Japan. As is clear from the last three columns in Table 2, the
productivity effect seems to be the main source of indirect effect responsible for the cross-
country variation in OLC.
21 Also see Kugler (2004) for a brief review of the related literature.

15
This decomposition exercise also provides some explanation to close to zero OLC for
Japan and Italy, for the overall period. For instance, the productivity effect is the highest
(0.93) for Italy and this is consistent with high job security provisions in Italy. Similarly,
Japan has a very high productivity effect which is mainly due to the employment practices
of Japanese firms (e.g. prevalence of lifetime employment opportunities). Thus, higher
productivity –and indirect– effects of Japan and Italy generate close to zero OLC for these
countries.
Another remarkable result is that there are intertemporal variations in the Okun’s law
coefficient. As is clear from Table 2, these variations are again mainly due to the
differences in the indirect effect.22 More specifically, as is seen from the last three
columns in Table 2, the instability of Okun’s coefficient is primarily arising from the
shifts in the parameters of the relationships between the supply-side variables and output
demand. These relationships, in turn, may be related to the institutional, legal and other
features of the labor market, e.g. employment practices of the firms. For instance, OLC in
absolute value increased for all countries from 1961-1979 to 1980-2005 but the magnitude
of the change is substantial for the European countries (especially for the United Kingdom
and France) and Japan. Most of the firms in these countries probably lowered the level of
job security as a consequence of an increase in global competition as well as deregulation
in labor markets since the early 1980s.23 This can be seen from the considerable fall in the
magnitudes of the productivity effects in the fifth column of Table 2.24 Although this
finding is only suggestive it is broadly in line with those studies that highlight the role of
22 As is seen from Table 2, OLC has remained fairly stable for the United States. However, while the
indirect effect has stayed quite stable, its composition has not remained constant between the two sub-
periods.
23 The early 1980s marks the shift in economic policies toward more liberal policies, such as trade
liberalization, privatization and deregulation, and their international promotion by influential politicians like
Margaret Thatcher in the United Kingdom and Ronald Reagan in the United States. As a consequence of
world-wide applications of such policies and the substantial change in information and communication
technologies, global competition among firms has intensified. These developments, in turn, led to similar
and important structural changes both in goods and labor markets in all the countries in our sample. Of
course, the effects of these changes differ across countries and over time, especially, due to the timing and/or
intensity of the policy-led developments.
24 In some countries, this fall is partially offset by hours effect and/or labor force effect.

16
intertemporal differences in legal, institutional and other related characteristics of labor
markets –as well as goods markets– as potential causes of the instability of Okun’s law
(e.g., Kaufman, 1988; Lee, 2000).
4. Concluding Remarks
This paper makes several contributions to our understanding of output-unemployment
relationship. The first and perhaps the most important one is that this study develops a
new and useful framework from which one can derive various models to investigate the
output-unemployment link. Additionally, by using this framework, this paper also
provides a simple but reasonable theoretical background to the original difference version
of the Okun’s law and to its recent popular gap version.
This theoretical background, in turn, facilitates the decomposition of Okun’s law
coefficient into several quantifiable and interpretable effects that incorporate main insights
from Arthur Okun’s original analysis. More specifically, it is shown that Okun’s
coefficient is a reduced-form coefficient which contains a number of structural parameters
that represent the features of macroeconomic adjustment process regarding the output-
unemployment relation over the business cycle. Furthermore, findings from the empirical
decomposition exercise indicate that the instability of Okun’s coefficient is primarily
resulting from the intertemporal shifts in the parameters of the structural relationships
between the supply-side variables and output demand which are, most likely, related to the
changes in legal, institutional and other related characteristics of labor and goods markets.
Consequently, these structural changes seem to significantly affect the size of the Okun’s
coefficient over time and hence seriously undermine the reliability of Okun’s law.
All these results imply that Okun’s law has an inherent tendency to vary substantially over
time, especially, in response to the structural changes in the economy. Therefore, in order
to understand Okun’s law better, one needs to understand the nature and the factors behind
the Okun’s coefficient. Fortunately, the presence of a reasonable theoretical framework,
such as the one provided in this study, can help researchers to identify the impact of
structural changes on Okun’s law coefficient. This, in turn, will enable them to conduct
better policy analyses and evaluations. Moreover, a detailed analysis of the causes of those

17
structural changes and their propagation through the economy would further improve our
understanding of the evolution of the Okun’s coefficient.
Even though this study attempts to provide a theoretical background to the symmetric and
static versions of the Okun’s law, dynamic and/or asymmetric versions can also be derived
from the suggested framework. Furthermore, by utilizing this framework different models
outside the scope of Okun’s law can be easily developed. These are left for future
research.
Acknowledgements
I would like to thank Nil Demet Gungor, Fatma M. Utku, Erkan Erdil, Elif Dayar and
Mehmet Sezer for useful comments. The usual disclaimers apply.

18
Appendix A. The Validity of Linear Approximation in Eq. (4)
This appendix provides both visual and formal evidence to examine the validity of the
assumption in Eq. (4) –φ is equal to the average value of employment rate– against the
implicit assumption in the logarithmic transformation (φ=1).
Fig. A.1 presents the visual evidence by providing the scatterplots of ∆U against ∆f-∆l for
the six countries over the period 1961-2005. While the solid lines represent the linear
approximation in Eq. (4), the dashed (red) lines represent the logarithmic transformation.
As is clear from Fig. A.1, the former approximation is better than the latter approximation.
<Fig. A.1>
In order to formally justify the validity of linear approximation in Eq. (4), against the
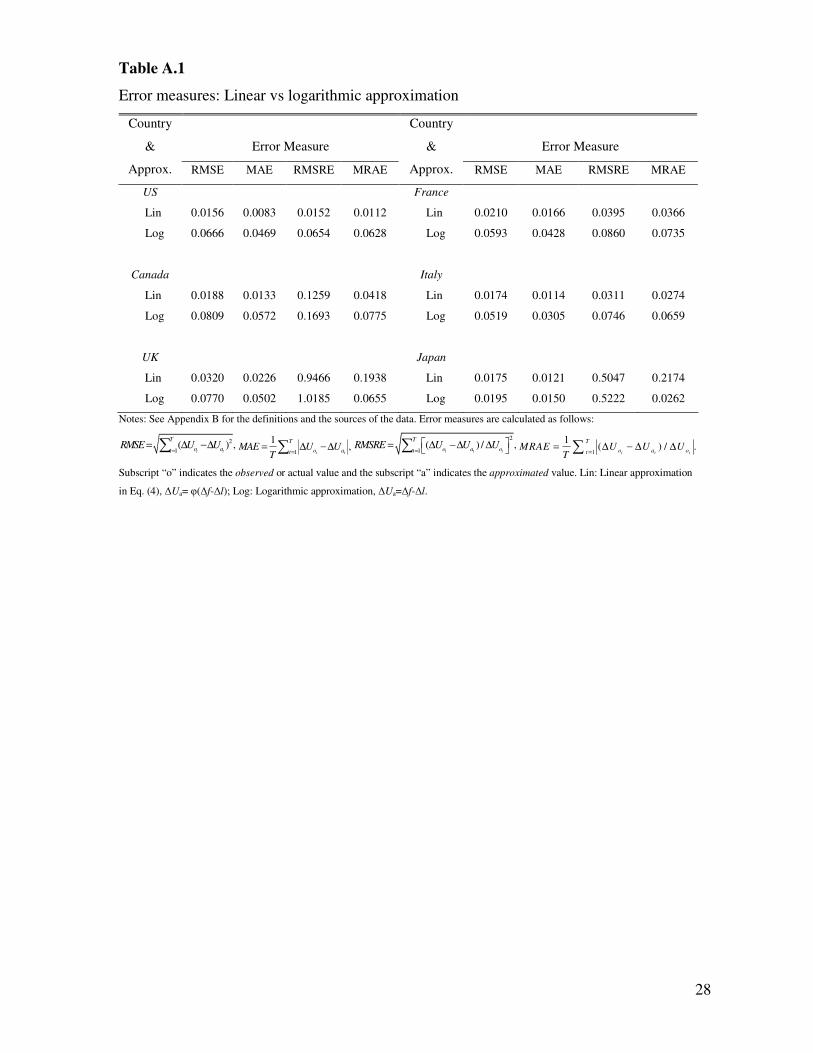
logarithmic approximation of the unemployment identity, Table A.1 presents the values of
four popular error measures; namely, Root Mean Squared Error (RMSE), Mean Absolute
Error (MAE), Mean Relative Absolute Error (MRAE), and Root Mean Squared Relative
Error (RMSRE). According to RMSE, MAE, and RMSRE criteria, for all the six
countries in the sample, linear approximation in Eq. (4) has lower values and hence it is
better than the logarithmic one (note that they are abbreviated as Lin and Log,
respectively, in Table A.1). In the case of MRAE, the former approximation is again
superior against the latter for the four countries but inferior for the other two countries.
As is clear from the formal analysis, linear approximation in Eq. (4) is better than the
logarithmic approximation. This result is in line with the visual evidence.
<Table A.1>

19
Appendix B. Data Definitions and Sources
Definitions
F: Civilian labor force, number of persons (Approximating the US concepts)
L: Employment, number of persons (Approximating the US concepts)
U: Unemployment rate [U=1-L/F]
Y: Total GDP, in millions of 1990 US$ (converted at Geary Khamis PPPs) [Yd=Ys=Y]
H: Annual hours worked per employee
P: Output per hour of work [P=Y/(L.H)]
Note: The lower case letters represent logarithms and the log-difference of each variable gives the growth
rate of that variable. For instance, f=ln(F) and ∆f denotes the growth rate of civilian labor force (F).
Sources
Data on Y and H were taken from Groningen Growth and Development Centre (GGDC)
and the Conference Board (2007) database and data on the remaining variables were taken
from the US Department of Labor, Bureau of Labor Statistics (2007).

20
Appendix C. The Gap Version
This appendix attempts to extend the analysis by providing a theoretical framework for the
currently popular gap version of Okun’s Law (e.g. Weber, 1995; Moosa, 1997). By doing
so, the cyclical (gap) version of the relation contained in Eq. (9) needs to be derived first.
The following can be obtained after rearrangements25
)( ,,,
n
tc
d
tctc yyU ∆−∆−=∆ ϕ , (C.1)
where the subscript “c” indicates the cyclical component of a variable (e.g. Uc = U – U*,
∆xc = ∆x– ∆x*), ∆ycn =∆pc+∆hc+∆fc and φ is a constant parameter as defined before. It
should be noted that Eq. (C.1) can be restated in the level-form as follows
)( ,,,
n
tc
d
tctc yyU −−= ϕ , (C.2)
where xc is the logarithm of the ratio of actual value to trend value of variable X, ycn =
pc+hc+fc and other variables are as defined before.
As in Section 3.1, the following version of Okun’s law is obtained by assuming yc,tn = θ
yc,td,
d
tctc yU ,, ψ= , (C.3)
where ψ is the reduced-form of OLC and ψ = -φ+φθ.
As is clear from Eq. (C.3), OLC contains both the direct (-φ) and the indirect effects (φθ),
and it can be interpreted as in Section 3.1. Table C.1 shows the estimates of the OLC of
the gap version and its decomposition for both the overall period and the two sub-periods
for the six countries.
25 Eq. (9) can be expressed as ),(
*** n
t
d
tt yyU ∆−∆−=∆ ϕ where asterisks indicate the time-varying
“trend” of a variable. If we subtract this equation from Eq. (9), we can obtain Eq. (C.1).

21
<Table C.1>
As is clear from the comparison of Table 2 and Table C.1, the qualitative nature of
empirical results for this version of Okun’s law is broadly in line with the results in
Section 3.2. However, as noted by previous researchers, the magnitude of Okun’s
coefficient seems to be sensitive to the choice of detrending methods (e.g. Moosa, 1997;
Lee, 2000). Therefore, for the sake of comparison, results for other detrending methods
should also be provided. This is beyond the scope of this paper.

22
References
Altig, D., Fitzgerald, T.J., Rupert, P., 1997. Okun’s law revisited: should we worry about
low unemployment? Federal Reserve Bank of Cleveland, Economic Commentary, May
15. http://www.clevelandfed.org/research/commentary/1997/0515.htm (accessed February
27, 2007).
Ball, N., Koenig, E.F., 2009. Recent unemployment increases break the law. Federal
Reserve Bank of Dallas National Economic Update, June 29.
http://dallasfed.org/research/update-us/2009/0904.cfm (accessed December 17, 2009).
Bertola, G., 1990. Job security, employment and wages. European Economic Review
34(4), 851-79.
Blanchard, O.J., 2006. Macroeconomics. 4th ed., Prentice Hall, New Jersey.
Blanchard, O.J., Quah, D., 1989. The dynamic effects of aggregate demand and supply
disturbances. American Economic Review 79(4), 655-73.
Blinder, A.S., 1997. Is there a core of practical macroeconomics that we should all
believe? American Economic Review Proceedings 87(2), 240-43.
Di Tella, R., MacCulloch, R.J., 2005. The consequences of labor market flexibility: panel
evidence based on survey data. European Economic Review 49(5), 1225-59.
Fay, J.A., Medoff, J.L., 1985. Labor and output over the business cycle: some direct
evidence. American Economic Review 75(4), 638-655.
Gordon, R.J., 1973. The welfare cost of higher unemployment. Brookings Papers on
Economic Activity 1, 133-205.
Gordon, R.J., 1984. Unemployment and potential output in the 1980s. Brookings Papers

23
on Economic Activity 2, 537-564.
Gordon, R.J., 2010. Okun’s law and productivity innovations. American Economic
Review Proceedings 100(2), 11-15.
Groningen Growth and Development Centre and the Conference Board, 2007. Total
Economy Database [January 2007]. http://www.ggdc.net (accessed April 17, 2007).
Hagemann, H., Seiter, S., 1999. Okun’s law. In O’Hara, P.A. (ed.), Encyclopedia of
Political Economy, Routledge, London, pp. 819-821.
Hamada, K., Yoshio, K., 1984. The relationship between production and unemployment in
Japan: okun’s law in comparative perspective. European Economic Review 25(1), 71-94.
Hultgren, T., 1960. Changes in labor cost during cycles in production and business. NBER
Occasional Paper 74.
Kaufman, R.T., 1988. An international comparison of Okun’s law. Journal of
Comparative Economics 12(2), 182-203.
Knoester, A., 1986. Okun’s law revisited. Review of World Economics
(Weltwirtschaftliches Archiv) 122(4), 657-66.
Knotek II, E.S., Terry S., 2009. How will unemployment fare following the recession?
Federal Reserve Bank of Kansas Economic Review (Third Quarter), 5-33.
Krugman, P.R., 2009. Stimulus arithmetic (wonkish but important). New York Times,
January 6.
Kugler, A.D., 2004. The effect of job security regulations on labor market flexibility:
evidence from the Colombian labor market reform. NBER Working Paper 10215.
Lee, J., 2000. The robustness of Okun’s law: evidence from OECD countries. Journal of

24
Macroeconomics 22(2), 331-56.
Mairesse, J., 1984. Comment on ‘The relationship between production and unemployment
in Japan: Okun’s law in comparative perspective’ by K. Hamada and Y. Kurosaka.
European Economic Review 25(1), 99-105.
Moosa, I.A., 1997. A cross-country comparison of Okun’s coefficient. Journal of
Comparative Economics 24(3), 335-56.
Oi, W.Y., 1962. Labor as a quasi fixed factor. Journal of Political Economy 70(6), 538-55.
Okun, A.M., 1962. Potential GNP: its measurement and significance. Proceedings of the
Business and Economic Statistics Section of the American Statistical Association, 98-104.
Paldam, M., 1987. How much does one percent of growth change the unemployment rate?
A study of 17 OECD countries, 1948-1985. European Economic Review 31(1-2), 306-13.
Perry, G.L., 2000. Is macroeconomics dead? (opinion) The International Economy
(September/October 2000) 14 (5), 21.
Prachowny, M. F.J. 1993. Okun’s law: theoretical foundations and revised estimates.
Review of Economics and Statistics 75(2), 331-36.
Ravn, M.O., Uhlig, H., 2002. On adjusting the Hodrick-Prescott filter for the frequency of
observations. Review of Economics and Statistics 84(2), 371-375.
Sheehan, R.G., Zahn, F., 1980. The variability of the Okun coefficient. Southern
Economic Journal 47(2), 488-97.
Silvapulle, P., Moosa, I.A., Silvapulle, M.J., 2004. Asymmetry in Okun’s law. Canadian
Journal of Economics 37(2), 353-374.
Sögner, L., Stiassny A., 2002. An analysis on the structural stability of Okun’s law: a

25
cross-country study. Applied Economics 34(14), 1775-1787.
US Congressional Budget Office [CBO], 2004. A summary of alternative methods for
estimating potential GDP. Background Paper, March 2004, CBO, Washington.
US Department of Labor, Bureau of Labor Statistics. 2007. Comparative Civilian Labor
Force Statistics, Ten Countries, 1960-2006 [20 March 2007]. http://www.bls.gov
/fls/flscomparelf.htm (accessed April 17, 2007).
Weber, C.E., 1995. Cyclical output, cyclical unemployment, and Okun’s coefficient: a
new approach. Journal of Applied Econometrics 10(4), 433-45.

26
Table 1
Correlation between the demand-side and supply-side variables, 1961-2005
Correlation of ∆yd with Correlation of ∆yd with
Country ∆p ∆h ∆f Country ∆p ∆h ∆f
US 0.433*** 0.660*** 0.167 France 0.772*** 0.068 0.538***
Canada 0.467*** 0.255** 0.497*** Italy 0.823*** 0.050 -0.206
UK 0.372*** 0.590*** 0.224* Japan 0.938*** 0.435*** 0.574***
Notes: See Appendix B for the definitions and the sources of the data. Three (***), two (**) and one (*) asterisks
denote statistically significant positive correlation at, or below, 1, 5 and 10 percent level, respectively.

27
Table 2
Decomposition of Okun’s law coefficient
OLC Decomposition Sources of Indirect Effect
Country OLS Net Direct Indirect Productivity Hours Worked Labor Force
& Est. Effect Effect Effect Effect Effect Effect
Period α1 α1' -φ φδ φδ1 φδ2 φδ3
US
Overall -0.40*** -0.40 -0.94 0.54 0.22 0.26 0.06
Pre 1980 -0.41*** -0.41 -0.94 0.53 0.23 0.35 -0.04
Post 1980 -0.43*** -0.44 -0.94 0.50 0.19 0.24 0.07
Canada
Overall -0.31*** -0.31 -0.93 0.61 0.28 0.11 0.22
Pre 1980 -0.38*** -0.38 -0.94 0.56 0.61 -0.08 0.04
Post 1980 -0.42*** -0.43 -0.92 0.49 0.11 0.26 0.11
UK
Overall -0.35*** -0.35 -0.94 0.59 0.26 0.25 0.08
Pre 1980 -0.17*** -0.16 -0.96 0.80 0.45 0.33 0.02
Post 1980 -0.48*** -0.48 -0.92 0.44 0.10 0.22 0.11
France
Overall -0.15*** -0.15 -0.93 0.78 0.62 0.03 0.12
Pre 1980 -0.19*** -0.19 -0.97 0.78 0.50 0.18 0.10
Post 1980 -0.47*** -0.47 -0.90 0.43 0.35 0.01 0.08
Italy
Overall -0.06 -0.06 -0.94 0.87 0.93 0.02 -0.07
Pre 1980 -0.07* -0.07 -0.96 0.90 0.81 0.13 -0.04
Post 1980 -0.14 -0.14 -0.92 0.78 0.51 0.17 0.10
Japan
Overall -0.03*** -0.03 -0.97 0.94 0.72 0.10 0.12
Pre 1980 -0.03*** -0.03 -0.98 0.96 0.75 0.11 0.10
Post 1980 -0.12*** -0.12 -0.97 0.85 0.45 0.16 0.24
Notes: Overall Period: 1961-2005, Pre 1980: 1961-1979, Post 1980: 1980-2005. See Appendix B for the definitions and the
sources of the data. α1 is estimated by applying OLS to the stochastic version of Eq. (11). φ=average employment rate for the
respective period. δ1, δ2 and δ3 are estimated by applying OLS to the stochastic versions of Eq. (12), (13) and (14), respectively.
Net effect or the derived OLC, α1', is calculated from the reduced-form coefficient contained in Eq. (16); α1'= -φ+φδ, where
δ = δ1+δ2+δ3. Three (***), two (**) and one (*) asterisks, respectively, denote that the estimated coefficient is statistically
significant at, or below, 1, 5 and 10 percent level [The results are based on Newey-West standard errors].
28
Table A.1
Error measures: Linear vs logarithmic approximation
Error Measure
Error Measure
Country
&
Approx. RMSE MAE RMSRE MRAE
Country
&
Approx. RMSE MAE RMSRE MRAE
US France
Lin 0.0156 0.0083 0.0152 0.0112 Lin 0.0210 0.0166 0.0395 0.0366
Log 0.0666 0.0469 0.0654 0.0628 Log 0.0593 0.0428 0.0860 0.0735
Canada Italy
Lin 0.0188 0.0133 0.1259 0.0418 Lin 0.0174 0.0114 0.0311 0.0274
Log 0.0809 0.0572 0.1693 0.0775 Log 0.0519 0.0305 0.0746 0.0659
UK Japan
Lin 0.0320 0.0226 0.9466 0.1938 Lin 0.0175 0.0121 0.5047 0.2174
Log 0.0770 0.0502 1.0185 0.0655 Log 0.0195 0.0150 0.5222 0.0262
Notes: See Appendix B for the definitions and the sources of the data. Error measures are calculated as follows:
2
1( ) ,
t t
T
o atRMSE U U
== ∆ −∆∑
1
1,
t t
T
o atMAE U U
T == ∆ −∆∑
2
1( ) / ,
t t t
T
o a otRMSRE U U U
= = ∆ −∆ ∆ ∑
1
1( ) / .
t t t
T
o a otMRAE U U U
T == ∆ − ∆ ∆∑
Subscript “o” indicates the observed or actual value and the subscript “a” indicates the approximated value. Lin: Linear approximation
in Eq. (4), ∆Ua= φ(∆f-∆l); Log: Logarithmic approximation, ∆Ua=∆f-∆l.

29
Table C.1
Decomposition of OLC: The gap version
OLC Decomposition Sources of Indirect Effect
Country OLS Net Direct Indirect Productivity Hours Worked Labor Force
& Est. Effect Effect Effect Effect Effect Effect
Period ψ ψ' -φ φθ φθ1 φθ2 φθ3
US
Overall -0.43*** -0.44 -0.94 0.50 0.11 0.29 0.10
Pre 1980 -0.42*** -0.43 -0.95 0.52 0.12 0.29 0.10
Post 1980 -0.45*** -0.46 -0.94 0.48 0.10 0.28 0.10
Canada
Overall -0.45*** -0.46 -0.93 0.46 0.08 0.28 0.11
Pre 1980 -0.37*** -0.39 -0.94 0.55 0.24 0.17 0.14
Post 1980 -0.47*** -0.48 -0.92 0.43 0.03 0.31 0.10
UK
Overall -0.35*** -0.35 -0.94 0.59 0.24 0.26 0.09
Pre 1980 -0.25*** -0.25 -0.96 0.71 0.42 0.27 0.03
Post 1980 -0.48*** -0.46 -0.92 0.46 0.05 0.25 0.16
France
Overall -0.36*** -0.36 -0.93 0.57 0.39 0.06 0.12
Pre 1980 -0.20*** -0.20 -0.97 0.77 0.50 0.10 0.17
Post 1980 -0.50*** -0.51 -0.90 0.39 0.29 0.02 0.08
Italy
Overall -0.12*** -0.12 -0.94 0.82 0.55 0.18 0.08
Pre 1980 -0.07* -0.09 -0.97 0.88 0.63 0.17 0.08
Post 1980 -0.23** -0.21 -0.92 0.71 0.39 0.24 0.08
Japan
Overall -0.06*** -0.10 -0.97 0.88 0.57 0.21 0.10
Pre 1980 -0.03*** -0.08 -0.98 0.90 0.62 0.19 0.09
Post 1980 -0.14*** -0.15 -0.97 0.81 0.44 0.26 0.11
Notes: Overall Period: 1961-2005, Pre 1980: 1961-1979, Post 1980: 1980-2005. See Appendix B for the definitions and the
sources of the data. The trends of the variables are estimated by using Hodrick-Prescott filter with the smoothing parameter, λ,
set to 6.25 on the basis of Ravn and Uhlig’s (2002) frequency rule suggestion. ψ is estimated by applying OLS to the stochastic
version of equation Uc = ψ ycd. φ=average employment rate for the respective period. θ1, θ2 and θ3 are estimated by applying
OLS to the stochastic versions of equations pc = θ1 ycd, hc = θ1 yc
d and fc = θ1 ycd, respectively. Net effect or derived OLC, ψ' , is
calculated from the reduced-form coefficient contained in Eq. (C.3); ψ' = -φ+φθ, where θ = θ1+ θ2+ θ3. Three (***), two (**)
and one (*) asterisks, respectively, denote that the estimated coefficient is statistically significant at, or below, 1, 5 and 10
percent level [The results are based on Newey-West standard errors].

30
-0.030
-0.020
-0.010
0.000
0.010
0.020
0.030
-0.030 -0.020 -0.010 0.000 0.010 0.020 0.030 0.040
∆f-∆l
∆U
a. US
-0.030
-0.020
-0.010
0.000
0.010
0.020
0.030
-0.030 -0.020 -0.010 0.000 0.010 0.020 0.030 0.040
∆f-∆l
∆U
c. UK
-0.015
-0.010
-0.005
0.000
0.005
0.010
0.015
0.020
0.025
0.030
-0.015 -0.010 -0.005 0.000 0.005 0.010 0.015 0.020 0.025 0.030
∆f-∆l
∆U
e. Italy
-0.020
-0.015
-0.010
-0.005
0.000
0.005
0.010
0.015
0.020
0.025
0.030
-0.020 -0.010 0.000 0.010 0.020 0.030 0.040
∆f-∆l
∆U
b. Canada
-0.020
-0.015
-0.010
-0.005
0.000
0.005
0.010
0.015
0.020
-0.020 -0.015 -0.010 -0.005 0.000 0.005 0.010 0.015 0.020
∆f-∆l
∆U
d. France
-0.008
-0.006
-0.004
-0.002
0.000
0.002
0.004
0.006
0.008
0.010
-0.008 -0.006 -0.004 -0.002 0.000 0.002 0.004 0.006 0.008 0.010
∆f-∆l
∆U
f. Japan
Note: See Appendix B for the definitions and the sources of the data.
Fig. A.1 Scatterplots of ∆U against ∆f-∆l, 1961-2005