download (378kb) - munich personal repec archive
TRANSCRIPT

Munich Personal RePEc Archive
Does activity mix and funding strategy
vary across ownership? Evidence from
Indian banks
Ghosh, Saibal
Reserve Bank of India
June 2009
Online at https://mpra.ub.uni-muenchen.de/32070/
MPRA Paper No. 32070, posted 07 Jul 2011 09:07 UTC

1
Does activity mix and funding strategy vary across ownership? Evidence from Indian banks
Saibal Ghosh1
1 I would like to thank, without implicating, two anonymous referees, for the comments on an earlier draft. Needless to state, the views expressed and the approach pursued in the paper reflects solely the author’s personal opinion.
2
Does activity mix and funding strategy vary across ownership? Evidence from Indian banks
Abstract: Using data on Indian banks during 1996‐2007, the paper examines the impact of bank activity and short‐term funding for bank returns and risks. The findings indicate that larger, fast growing financial firms tend to have higher fee income shares. In addition, banks with greater reliance on fee income generating activities exhibit higher profitability. On the contrary, the impact of non‐deposit funding share on bank profitability is weak. In terms of bank riskiness, the evidence is consistent with the conjecture that big, cost efficient and capitalized banks are less risky. As in case of bank profitability, there is limited evidence on any non‐linear relationship between risk and fee incomes as also between risk and non‐deposit funding share. Finally, the analysis supports the fact that foreign and de novo private banks exhibit lower risk as compared to old private banks. JEL classification: G 21, G 28, P 52 Key words: Banking; Return on asset; Z‐score; Fee income; Non‐deposit funding; India 1. Introduction
In tandem with growing liberalization of financial systems worldwide, banks
have increasingly veered towards wholesale funding at the expense of relatively stable
retail deposits. Aggregate bank‐level data for OECD economies indicates that in several
of such countries (Germany, Italy, Portugal, Spain and Switzerland), deposits have
steadily lost ground at the expense of non‐deposit funds (ECB, 2008a; 2008b).
This change in the funding composition was called into question in the wake of
the recent financial meltdown. In particular, such wholesale funding created significant
maturity mismatches with banks devoting limited attention to the consequences of
potential risks of drying up of such funds. As confidence withered and depositors began
withdrawing their funds en masse, banks found it increasingly difficult to meet such
large and sudden withdrawals and took recourse to inter‐bank markets to fund maturity
mismatches. With confidence in financial institutions having eroded, the inter‐bank
market also came to a standstill, leaving banks with no recourse but to seek government
intervention. Across countries and continents, besides conventional (cuts in key policy
rates, liquidity injections, etc) and unconventional (collateral swaps, introduction of
foreign currency swap lines, quantitative easing, etc.) policy measures, governments
3
have heavily intervened in banks, including increasing government ownership, raising
depositor protection limits, injecting capital in troubled banks, to mention a few.
In this article, we examine the implications of bank’s activity mix and funding
strategy for its risk and return, using India as a case study. We represent a bank’s
activity mix by its share of fee income in total income. On the sources side, we
distinguish between deposits and non‐deposit funding sources. The objective is to shed
light on the risk‐return trade‐offs involved in the choice of different activity and funding
strategy employed by the bank.
Extant theories of banking provide conflicting predictions about the bank’s
optimal asset or activity mix. Banks gather information about their clients in the
provision of a financial service which could be utilized at a later date in the provision of
other financial services to the same customers. This information‐intensive nature of bank
assets would suggest that banks combine activities of various kinds in an optimal
manner (Diamond, 1991; Rajan, 1992; Stein, 2002).
On the funding side, a bank’s composition of debt and its ability to fund itself in
wholesale capital markets signals banks creditworthiness that are relevant to potential
bank depositors. Therefore, although banks need to be part‐financed through equity to
provide bankers with appropriate incentives (Diamond, 1984), often banks resort to non‐
deposit funding sources such as subordinated debt which enables the holders of such
debt to credibly monitor the bank (Calomiris, 1999).
Deposit and non‐deposit funding tend to carry different risks. While the volume
and price of wholesale funding tends to adjust quickly in response to bank riskiness,
retail deposits tend to be relatively less price responsive, partly because of the presence
of deposit insurance schemes. Fama (1985) and Rajan (1992) emphasize the advantage of
monitored debt such as bank borrowings in reducing informational and monitoring
costs as compared to arms’ length debt, such as bonds and related debt instruments.
Several studies have, in recent years, explored the issue of banks wholesale
funding and its role in the recent subprime crisis. Ratnovski and Huang (2009) examines
the factors behind the unusual resilience of Canadian banks during the recent global
4
meltdown and finds that they relied less on wholesale funding than their peers in other
advanced countries. Other studies show that banks that relied heavily on wholesale
funds were more affected by the liquidity crunch, experienced a large abnormal decline
in their share prices (Adrian and Shin, 2009). Using quarterly data on US banks during
the subprime crisis, Cornett et al. (2011) finds that banks with lower reliance on
wholesale funds were better able to continue lending. Cross country evidence advanced
by Raddatz (2010) also supports the fact that investment banks relied more on wholesale
funds as compared to commercial banks and therefore, were more prone to deposit‐runs
as compared to the latter. In effect, the evidence strongly suggests that greater use of
wholesale funding exposed banks to new types of liquidity‐related risks.
The paper has a three‐fold purpose. First, we document the trend in the bank’s
activity and funding mix for an extended sample of banks across ownership categories
for the period 1996‐2007. This is interesting since it coincides with the financial sector
reforms period and provides insights as to how banks’ funding and activity mix has
changed over this period. Second, we present empirical evidence on the determinants of
fee and non‐deposit funding shares, by examining how these variables are affected by a
range of bank‐specific, banking industry and macroeconomic factors. And finally, we
assess how bank activity and funding patterns are associated with bank‐level risk and
return variables. We measure bank return by its profitability, defined as net profit to
total asset or, return on asset (RoA). Our measure of bank risk is the Z‐score, defined as
the number of standard deviations that a bank’s return on asset has to decline for the
bank to become insolvent. Being an accounting measure of the “distance to default”, it
has been widely employed in the empirical banking literature in recent times (Laeven
and Levine, 2009; Mercieca et al., 2007; Furlong and Kwan, 2005; De Nicolo, 2000).2
The paper fills a gap in the literature since empirical studies on the implications
of bank’s funding for its risk and return are limited. Several papers have however,
examined the implications of combining various banking activities for bank risk. Stiroh
2Contextually, the RBI utilized the Z‐score measure as part of its assessment of financial soundness of Indian banks (See, RBI, 2009).
5
(2004) finds that Z‐scores are the highest for US banks with a non‐interest income share
close to zero. Laeven and Levine (2009) consider a cross‐country sample of banks from
48 countries to examine how bank risk, measured by the Z‐score and stock return
variability, is affected by bank level corporate governance factors and national banking
regulations. The findings appear to indicate the importance of both these sets of factors
in impacting bank risk. Laeven and Levine (2007) estimate the factors influencing bank
diversification and their charter value. Using data for the period 1998‐2002, their results
provide support for the fact that well‐diversified banks have low charters.
In a recent exercise, RBI (2007) examined the liability structure of banks and
within the liability structure, the ownership and maturity pattern of deposits of
commercial banks, during the entire post‐reform period. The analysis finds (a) an
unchanged share of borrowings in total liabilities of commercial banks during 1991‐2007
and if any, an increase in the share of deposits; (b) a decline in the share of household
sector in banks’ total deposits, at the cost of increase in the share of government sector
(a) a significant shortening of the maturity of term deposits, with a significant rise in the
proportion of deposits with shorter (upto 1 year) maturities. Based on the findings, the
study argues:
In this new environment, thus, banks face the challenge of proper assessment of risks associated with borrowed liquidity vis‐a‐vis stored liquidity inherent in core deposits. Regulators also need to be proactive in dealing with the emergence of any systemic risks arising out of increased recourse to borrowings
The rest of the paper unfolds as follows. Section II provides descriptive evidence
on the funding and liability structure of the banks. The following two sections delineate
the empirical strategy and the results. The final section encapsulates the policy concerns.
II. Funding mix and liability structure: Indian evidence
The time period of the study spans 1996, coinciding with the functioning of de
novo private banks, through 2007, just prior to the onset of the global meltdown. The
sample comprises of 66 banks including all state‐owned, 6 de novo private, 15 old private
6
and 17 foreign banks, accounting, on average, for over 90% of banking assets. The data
for the analysis are extracted from Statistical tables relating to banks in India (STB), a yearly
publication by the Indian central bank that reports bank‐wise balance sheet and profit
and loss numbers. The ownership and related variables for banks are culled out from
Report on trend and progress of banks in India (RTP), a statutory annual publication by the
Indian central bank. Taken together, these two publications account for almost all of the
bank‐level variables employed in the analysis. The macro variables are drawn from the
Handbook of Statistics on Indian economy (HBS), an annual central bank publication that
reports time‐series data on monetary and macro variables.
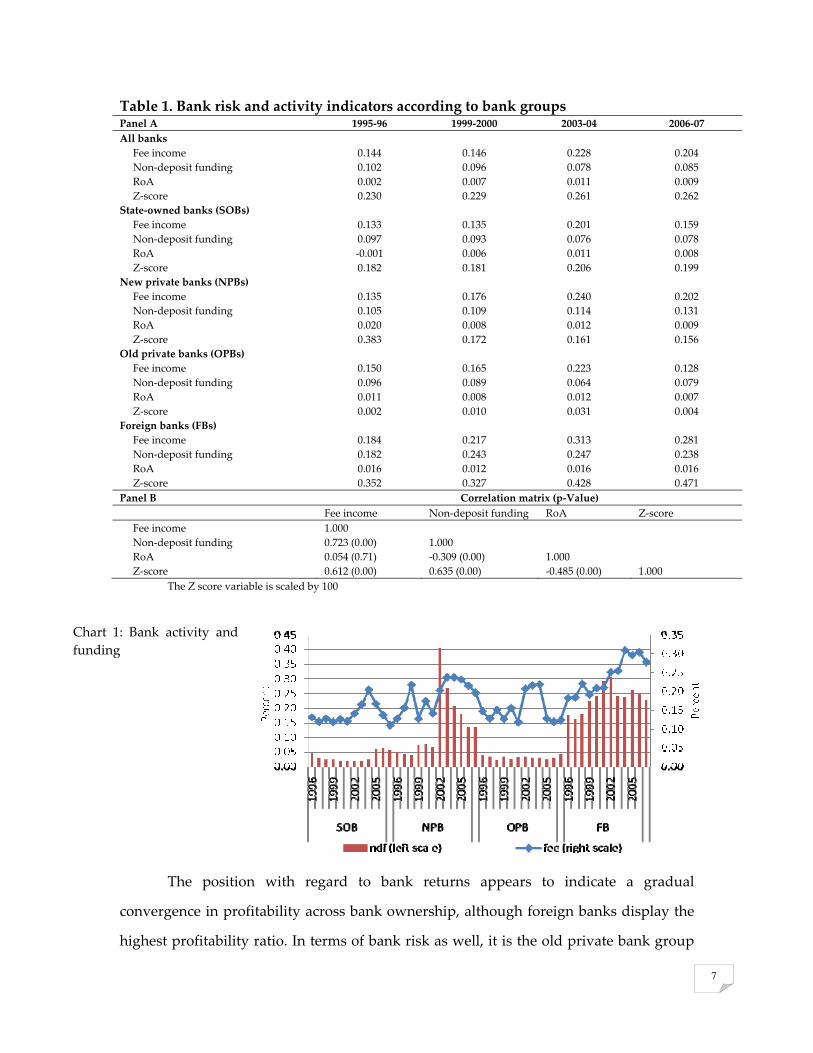
Table 1 enlists the activity mix along with bank risk and returns at four time
points during the sample period. The first year of the sample coincides with the
commencement of operations of de novo private banks, the year 1999‐2000 marks the
process of ‘second generation’ banking reforms, post Narasimham Committee II Report
in 1998, the third period marks the beginning of a high point of global (and Indian)
growth wherein banks in India also made windfall gains on their treasury portfolio
riding on the back of a benign interest rate regime and the final year is just prior to the
onset of the global meltdown (See Chart 1).
We measure activity mix as the ratio of fee income to total income. Across bank
groups, the evidence appears to suggest that state‐owned banks and old private banks
broadly belong to one category, with lower than median fee incomes, whereas new
private banks, from being slow starters, have gradually improved their fee income
component.3 Foreign banks have the highest fee income component, as also the highest
non‐deposit funding, as well, both being in excess of the sample median. State‐owned
and old private banks, in contrast, tend to exhibit the lowest reliance on non‐deposit
funds.
3 The median values for fee income and non‐deposit funding are respectively, 0.146 and 0.048, respectively (See Table 2).
7
Table 1. Bank risk and activity indicators according to bank groups Panel A 1995‐96 1999‐2000 2003‐04 2006‐07All banks Fee income 0.144 0.146 0.228 0.204 Non‐deposit funding 0.102 0.096 0.078 0.085 RoA 0.002 0.007 0.011 0.009 Z‐score 0.230 0.229 0.261 0.262 State‐owned banks (SOBs) Fee income 0.133 0.135 0.201 0.159 Non‐deposit funding 0.097 0.093 0.076 0.078 RoA ‐0.001 0.006 0.011 0.008 Z‐score 0.182 0.181 0.206 0.199 New private banks (NPBs) Fee income 0.135 0.176 0.240 0.202 Non‐deposit funding 0.105 0.109 0.114 0.131 RoA 0.020 0.008 0.012 0.009 Z‐score 0.383 0.172 0.161 0.156 Old private banks (OPBs) Fee income 0.150 0.165 0.223 0.128 Non‐deposit funding 0.096 0.089 0.064 0.079 RoA 0.011 0.008 0.012 0.007 Z‐score 0.002 0.010 0.031 0.004 Foreign banks (FBs) Fee income 0.184 0.217 0.313 0.281 Non‐deposit funding 0.182 0.243 0.247 0.238 RoA 0.016 0.012 0.016 0.016 Z‐score 0.352 0.327 0.428 0.471 Panel B Correlation matrix (p‐Value) Fee income Non‐deposit funding RoA Z‐score Fee income 1.000 Non‐deposit funding 0.723 (0.00) 1.000 RoA 0.054 (0.71) ‐0.309 (0.00) 1.000 Z‐score 0.612 (0.00) 0.635 (0.00) ‐0.485 (0.00) 1.000
The Z score variable is scaled by 100
Chart 1: Bank activity and funding
The position with regard to bank returns appears to indicate a gradual
convergence in profitability across bank ownership, although foreign banks display the
highest profitability ratio. In terms of bank risk as well, it is the old private bank group
8
that appear to be the most vulnerable; state‐owned and new private banks, as a group,
appear to be having similar Z‐scores, the figure for foreign banks being well higher than
that obtaining for these bank groups.
The correlation matrix among these variables is presented in Panel B of bank
return on assets and its income mix. The correlation between bank risk and fee income is
positive and significant, indicating that banks with greater reliance on fee incomes tend
to have lower risk. Fee income and non‐deposit funding have a positive correlation
which is statistically significant as well. Thus, banks which are non‐traditional in having
a relatively high fee income share tend to be non‐traditional in the sense of high non‐
deposit funding share. This is consistent with the analytical framework advanced by
Rajan and Stein (2002) which justifies the co‐existence of lending and deposit‐taking
within the same financial institution. These raw correlations however, do not control for
bank‐specific or business cycle effects.
A number of factors make the banking sector in India an interesting case to study
the interlinkage between bank risk and funding strategy. First, over the 1990s, India has
undergone liberalization of the banking sector with the objective of enhancing efficiency,
productivity and profitability (Government of India, 1991). Second, the banking sector
has witnessed important transformation, driven by the need for creating a market‐
driven, productive and competitive economy in order to support higher investment
levels and accentuate growth (Government of India, 1998). Third, most studies on bank
income mix pertain to developed country markets (Stiroh, 2004; Lins and Servaes, 1999;
Laeven and Levine, 2007). The issue as to the interplay between funding strategy and
bank risk in emerging markets as India where the financial system is pre‐dominantly
bank‐based and government‐owned remains a moot issue. To the best of our
knowledge, this is perhaps the first study for India to systematically explore the
association between funding strategy and bank risk.
The present article augments the empirical literature in several distinct ways.
First, we contribute to the debate as to whether funding mix matters for bank risk and
return. Evidence suggests that short‐term wholesale funding was the prime culprit that
9
helped to sink Northern Rock, a leading mortgage bank in the UK. The bank’s failure in
September 2007 is indelibly associated with images of Britain’s first retail bank run since
the late 1800s. Second, the paper contributes to the debate on bank ownership. Empirical
research appears to suggest that ownership matters for bank performance (Megginson
and Netter, 2001; Megginson, 2005; Bonin et al., 2005; Sapienza, 2004; Dinc, 2005). In the
Indian case, research uncovers a gradual convergence in the performance of state‐owned
versus other bank groups (Das and Ghosh, 2006), although there appears to be wide
divergence in profit efficiency across bank ownership (Das and Ghosh, 2009). Whether
there exists any such variation in funding strategy across bank ownership categories
remains an issue of empirical investigation. Third, by linking bank funding and bank
risk and returns to bank ownership, we also contribute to the ownership‐performance‐
bank risk debate, an aspect hitherto unexplored in the Indian context. Finally, the study
belongs to the broader literature that focuses on the financial intermediation role of
banks. Empirical studies have examined the link between lending and deposit taking
activity of banks. Berlin and Mester (1999) suggest that core deposits, i.e., deposits with
inelastic interest rates, represent an important basis for relationship lending. In the
Indian context, research uncovers that bank‐firm relationship vary significantly by
ownership : while foreign banks are more likely to be associated with listed (and hence,
transparent) manufacturing firms, state‐owned banks typically forge relationships with
small firms having limited credit access (Berger et al., 2008). These papers build on the
theoretical models that propose the co‐existence of lending and deposit‐taking that is
based on information or liquidity shortages (Kashyap et al., 2002; Mester et al., 2005).
III. Empirical strategy
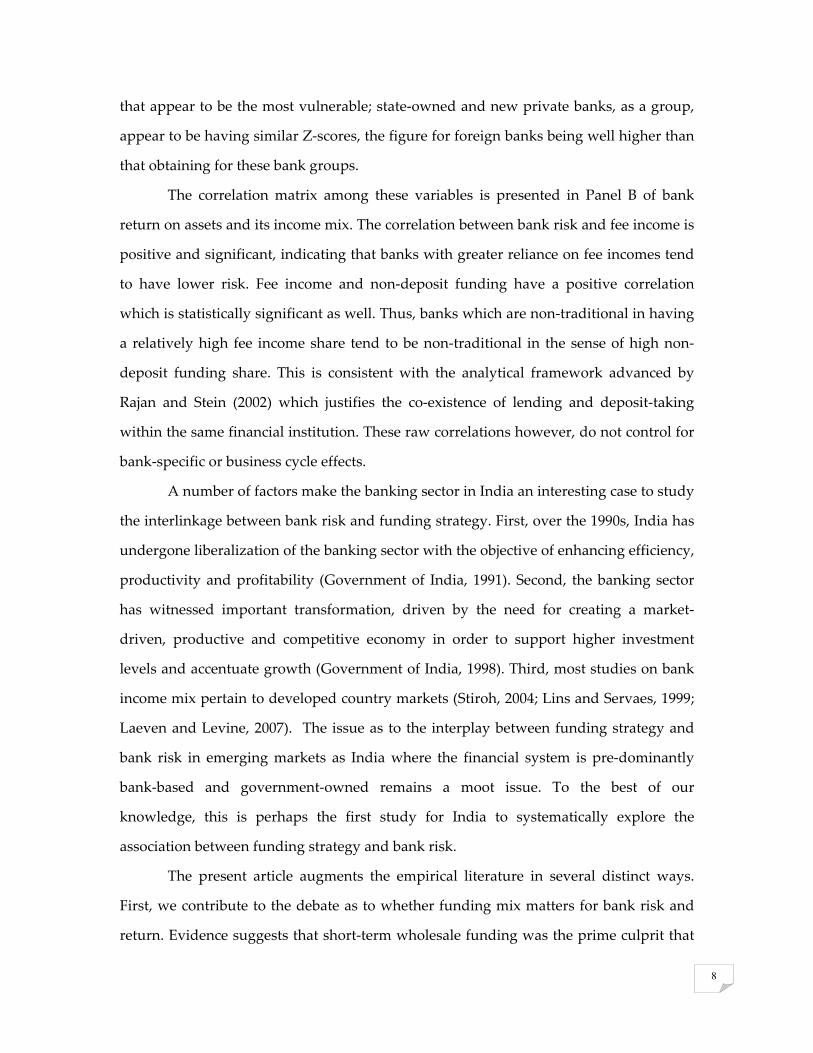
As a starting point, we first conduct univariate tests to examine the differences in
the relevant bank‐level variables across bank ownership. Later in the analysis, we
employ dummy variables to control for ownership.
10
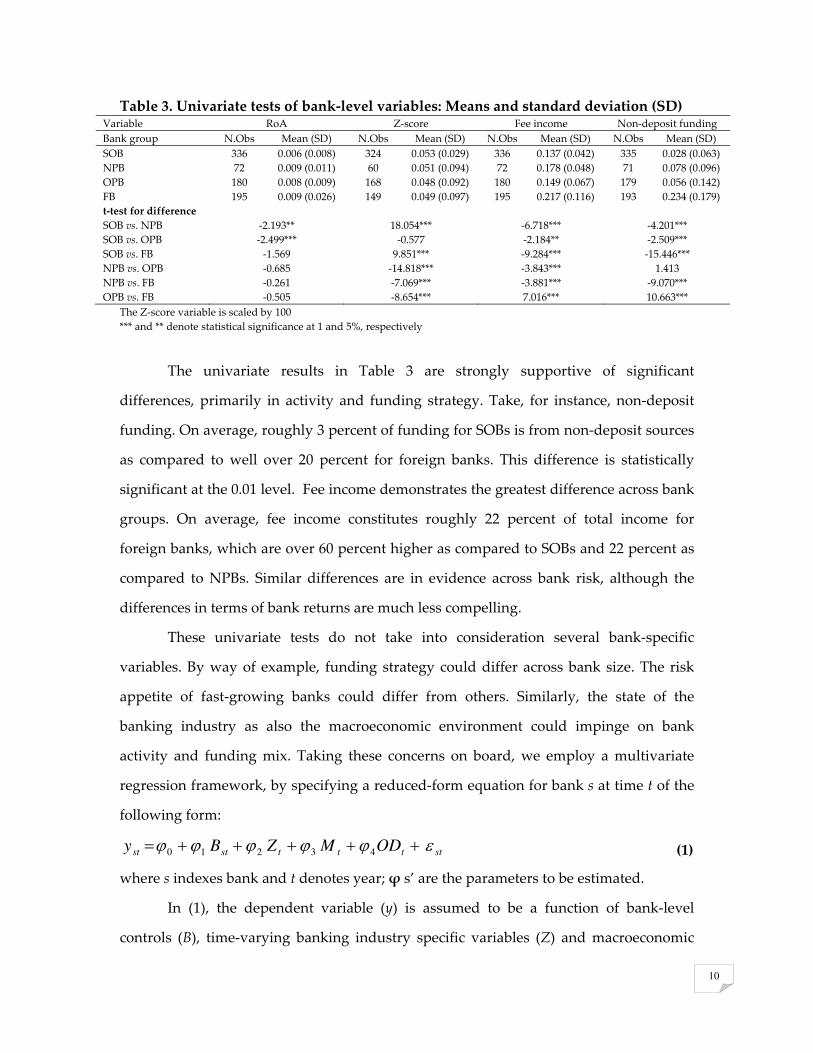
Table 3. Univariate tests of bank‐level variables: Means and standard deviation (SD) Variable RoA Z‐score Fee income Non‐deposit funding Bank group N.Obs Mean (SD) N.Obs Mean (SD) N.Obs Mean (SD) N.Obs Mean (SD) SOB 336 0.006 (0.008) 324 0.053 (0.029) 336 0.137 (0.042) 335 0.028 (0.063) NPB 72 0.009 (0.011) 60 0.051 (0.094) 72 0.178 (0.048) 71 0.078 (0.096) OPB 180 0.008 (0.009) 168 0.048 (0.092) 180 0.149 (0.067) 179 0.056 (0.142) FB 195 0.009 (0.026) 149 0.049 (0.097) 195 0.217 (0.116) 193 0.234 (0.179) t‐test for difference SOB vs. NPB ‐2.193** 18.054*** ‐6.718*** ‐4.201*** SOB vs. OPB ‐2.499*** ‐0.577 ‐2.184** ‐2.509*** SOB vs. FB ‐1.569 9.851*** ‐9.284*** ‐15.446*** NPB vs. OPB ‐0.685 ‐14.818*** ‐3.843*** 1.413 NPB vs. FB ‐0.261 ‐7.069*** ‐3.881*** ‐9.070*** OPB vs. FB ‐0.505 ‐8.654*** 7.016*** 10.663***
The Z‐score variable is scaled by 100 *** and ** denote statistical significance at 1 and 5%, respectively
The univariate results in Table 3 are strongly supportive of significant
differences, primarily in activity and funding strategy. Take, for instance, non‐deposit
funding. On average, roughly 3 percent of funding for SOBs is from non‐deposit sources
as compared to well over 20 percent for foreign banks. This difference is statistically
significant at the 0.01 level. Fee income demonstrates the greatest difference across bank
groups. On average, fee income constitutes roughly 22 percent of total income for
foreign banks, which are over 60 percent higher as compared to SOBs and 22 percent as
compared to NPBs. Similar differences are in evidence across bank risk, although the
differences in terms of bank returns are much less compelling.
These univariate tests do not take into consideration several bank‐specific
variables. By way of example, funding strategy could differ across bank size. The risk
appetite of fast‐growing banks could differ from others. Similarly, the state of the
banking industry as also the macroeconomic environment could impinge on bank
activity and funding mix. Taking these concerns on board, we employ a multivariate
regression framework, by specifying a reduced‐form equation for bank s at time t of the
following form:
sttttstst ODMZBy εϕϕϕϕϕ +++++=43210 (1)
where s indexes bank and t denotes year; ϕ s’ are the parameters to be estimated.
In (1), the dependent variable (y) is assumed to be a function of bank‐level
controls (B), time‐varying banking industry specific variables (Z) and macroeconomic
11
controls (M). The bank‐level controls include the following. First, the log of bank assets
is employed as a proxy for bank size. Second, the equity‐to‐asset ratio is employed to
measure bank capitalization. Third, we construct the bank (real) asset growth variable to
allow for the possibility that fast growing banks could have different funding and
income profiles. Finally, the cost‐to‐income ratio controls for bank‐level efficiency.
At the banking industry level, we control for the asset share of foreign banks and
deposit concentration variables. Higher foreign bank presence could engender higher
competition, leading to lower fee incomes. Alternately, higher competition could lead
certain bank groups to undercut others, leading to unequal distribution of fee incomes
across bank ownership. Finally, we control for the macroeconomic environment by
introducing controls for the real GDP growth and the interest rate. To moderate the
influence of noise in the macroeconomic variables, we employ dummies instead of the
continuous variables. Finally, following from the univariate results, we utilize
ownership dummies (OD), since bank income and funding mix are found to differ
across ownership. Throughout, the reported standard errors take on board the
possibility of serial correlation and heteroskedasticity pertaining to the same bank (i.e.,
bank‐level clustered standard errors).
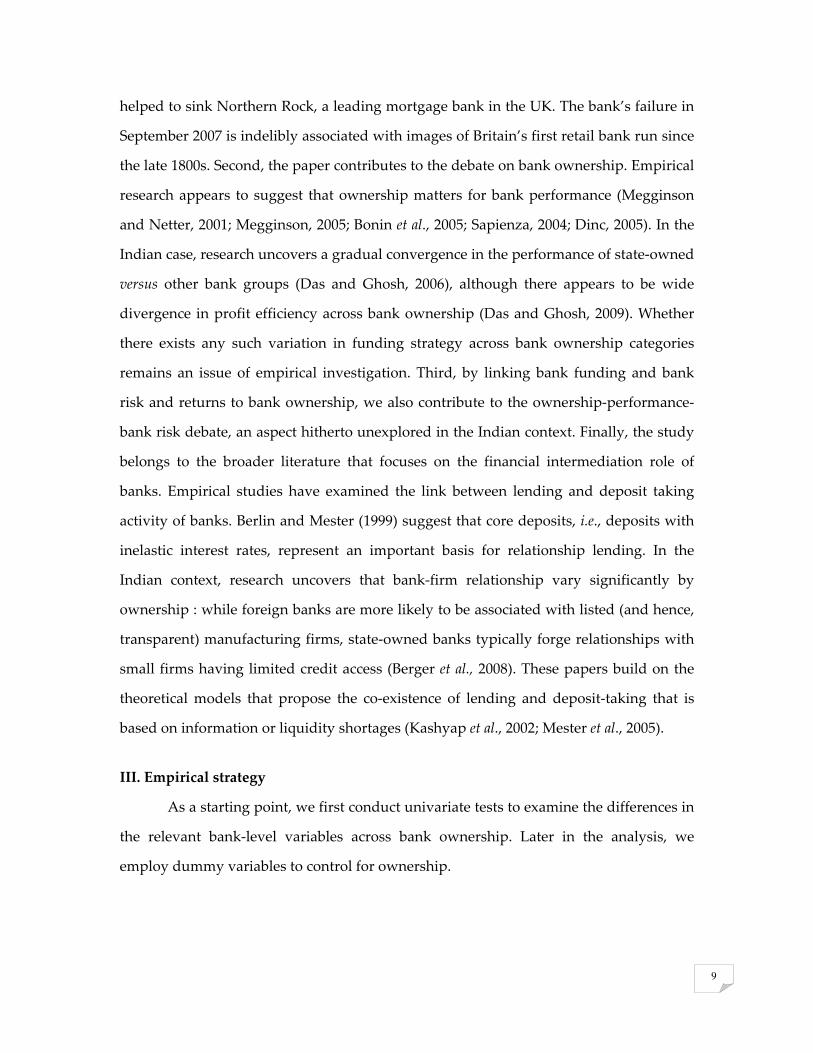
IV. Discussion of the results IV.1 Determinants of interest income shares and funding pattern Table 4 presents the results of regression that relates fee income to a set of bank‐
level variables and macroeconomic controls. Larger, fast growing financial firms tend to
have higher fee income shares. On the whole, controlling for everything else, fee‐
generating activities appear to be associated with greater equity. Fee incomes are higher
in an environment of low interest rates and GDP growth. Across bank ownership, state‐
owned banks rely less on fee incomes, whereas foreign banks tend to exhibit greater
reliance on fee income as compared to old private banks (the omitted category).
In specifications (2)‐(3), we include indicators of the market structure of banking
systems. Specifically, the variable concentration is defined as the deposits of top 5 banks
12
in a given year, while foreign denote the fraction of banking sector assets that are owned
by foreign banks, respectively.
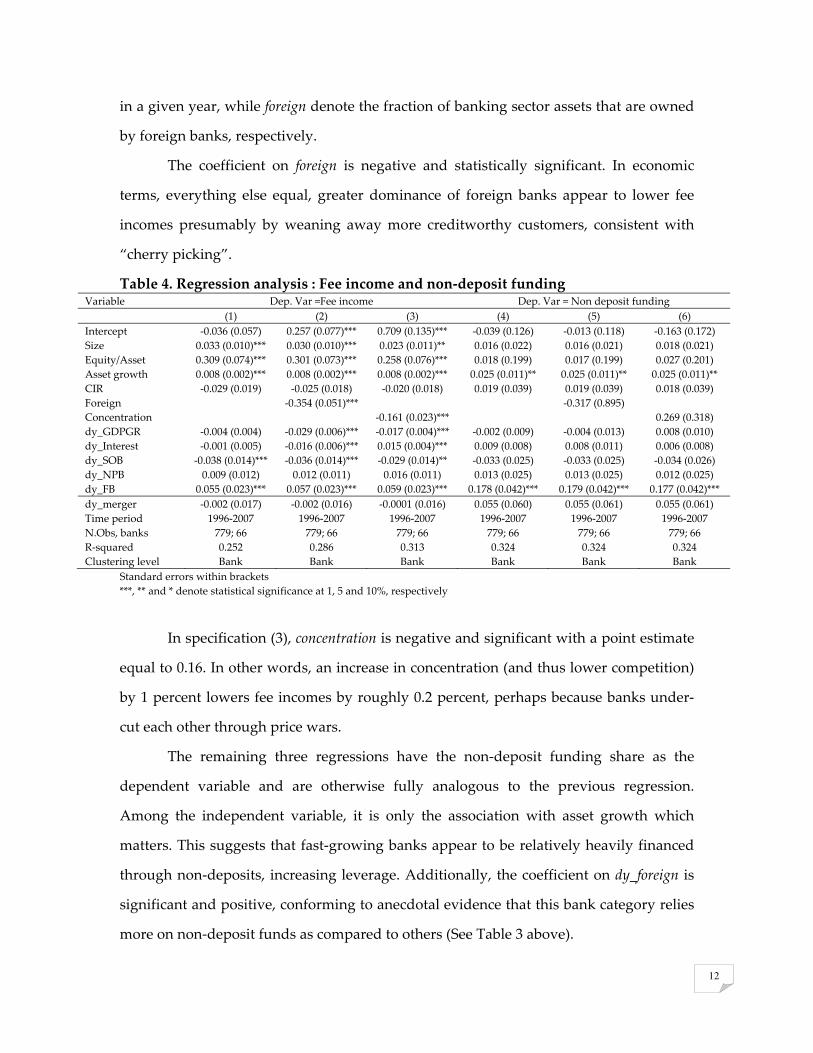
The coefficient on foreign is negative and statistically significant. In economic
terms, everything else equal, greater dominance of foreign banks appear to lower fee
incomes presumably by weaning away more creditworthy customers, consistent with
“cherry picking”.
Table 4. Regression analysis : Fee income and non‐deposit funding Variable Dep. Var =Fee income Dep. Var = Non deposit funding (1) (2) (3) (4) (5) (6) Intercept ‐0.036 (0.057) 0.257 (0.077)*** 0.709 (0.135)*** ‐0.039 (0.126) ‐0.013 (0.118) ‐0.163 (0.172) Size 0.033 (0.010)*** 0.030 (0.010)*** 0.023 (0.011)** 0.016 (0.022) 0.016 (0.021) 0.018 (0.021) Equity/Asset 0.309 (0.074)*** 0.301 (0.073)*** 0.258 (0.076)*** 0.018 (0.199) 0.017 (0.199) 0.027 (0.201) Asset growth 0.008 (0.002)*** 0.008 (0.002)*** 0.008 (0.002)*** 0.025 (0.011)** 0.025 (0.011)** 0.025 (0.011)** CIR ‐0.029 (0.019) ‐0.025 (0.018) ‐0.020 (0.018) 0.019 (0.039) 0.019 (0.039) 0.018 (0.039) Foreign ‐0.354 (0.051)*** ‐0.317 (0.895) Concentration ‐0.161 (0.023)*** 0.269 (0.318) dy_GDPGR ‐0.004 (0.004) ‐0.029 (0.006)*** ‐0.017 (0.004)*** ‐0.002 (0.009) ‐0.004 (0.013) 0.008 (0.010) dy_Interest ‐0.001 (0.005) ‐0.016 (0.006)*** 0.015 (0.004)*** 0.009 (0.008) 0.008 (0.011) 0.006 (0.008) dy_SOB ‐0.038 (0.014)*** ‐0.036 (0.014)*** ‐0.029 (0.014)** ‐0.033 (0.025) ‐0.033 (0.025) ‐0.034 (0.026) dy_NPB 0.009 (0.012) 0.012 (0.011) 0.016 (0.011) 0.013 (0.025) 0.013 (0.025) 0.012 (0.025) dy_FB 0.055 (0.023)*** 0.057 (0.023)*** 0.059 (0.023)*** 0.178 (0.042)*** 0.179 (0.042)*** 0.177 (0.042)*** dy_merger ‐0.002 (0.017) ‐0.002 (0.016) ‐0.0001 (0.016) 0.055 (0.060) 0.055 (0.061) 0.055 (0.061) Time period 1996‐2007 1996‐2007 1996‐2007 1996‐2007 1996‐2007 1996‐2007 N.Obs, banks 779; 66 779; 66 779; 66 779; 66 779; 66 779; 66 R‐squared 0.252 0.286 0.313 0.324 0.324 0.324 Clustering level Bank Bank Bank Bank Bank Bank
Standard errors within brackets ***, ** and * denote statistical significance at 1, 5 and 10%, respectively
In specification (3), concentration is negative and significant with a point estimate
equal to 0.16. In other words, an increase in concentration (and thus lower competition)
by 1 percent lowers fee incomes by roughly 0.2 percent, perhaps because banks under‐
cut each other through price wars.
The remaining three regressions have the non‐deposit funding share as the
dependent variable and are otherwise fully analogous to the previous regression.
Among the independent variable, it is only the association with asset growth which
matters. This suggests that fast‐growing banks appear to be relatively heavily financed
through non‐deposits, increasing leverage. Additionally, the coefficient on dy_foreign is
significant and positive, conforming to anecdotal evidence that this bank category relies
more on non‐deposit funds as compared to others (See Table 3 above).
13
Since all models control for the business cycle and the monetary policy as also for
bank mergers, it seems less likely that these results are driven by macroeconomic or
such related considerations.
IV.2 Evaluation of bank risk and return
Next, we examine the relationship between fee income and non‐deposit funding
shares on the one hand and bank risk and return, on the other. To start with, Table 5
reports the results of regression with return on assets as the dependent variable.
Regression 1 includes fee income share, in addition to a range of bank level and
macroeconomic controls, including controls for bank ownership. The fee income share
obtains a positive coefficient of 0.038 that is statistically significant. This implies that
banks with focus on generating fee income tend to exhibit higher profitability. Besides
the statistical significance, the economic magnitude of the coefficient is important as
well: a one standard deviation rise in fee incomes raised return on asset by 0.2 standard
deviation. Among the controls, size and equity are positive, whereas CIR is negative. All
of these are statistically significant at the 0.05 percent or lower. This would indicate that
big, well‐capitalized and cost efficient banks tend to be more profitable. The ownership
dummies indicate that profitability of all bank groups is higher as compared to old
private banks.
Regression 2 relates RoA to the non‐deposit funding share and other controls, as
earlier. The variable is estimated to have a negative but insignificant impact on bank
profits. The sign and significance of control variables are the same as earlier.
The specification in regression 3 includes both fee income and non‐deposit
funding shares in the regressions. While fee income retains its positive and significant
sign, non‐deposit funding has an observed negative coefficient with a point estimate
equal to ‐0.012; in other words, a 10 percent rise in non‐deposit funding lowers bank
profitability by roughly 0.1 percent. This indicates that notwithstanding the higher
profitability of banks from fee income, greater reliance on non‐deposit funding dampens
profitability. This implies that a change in the funding mix towards relatively costly
14
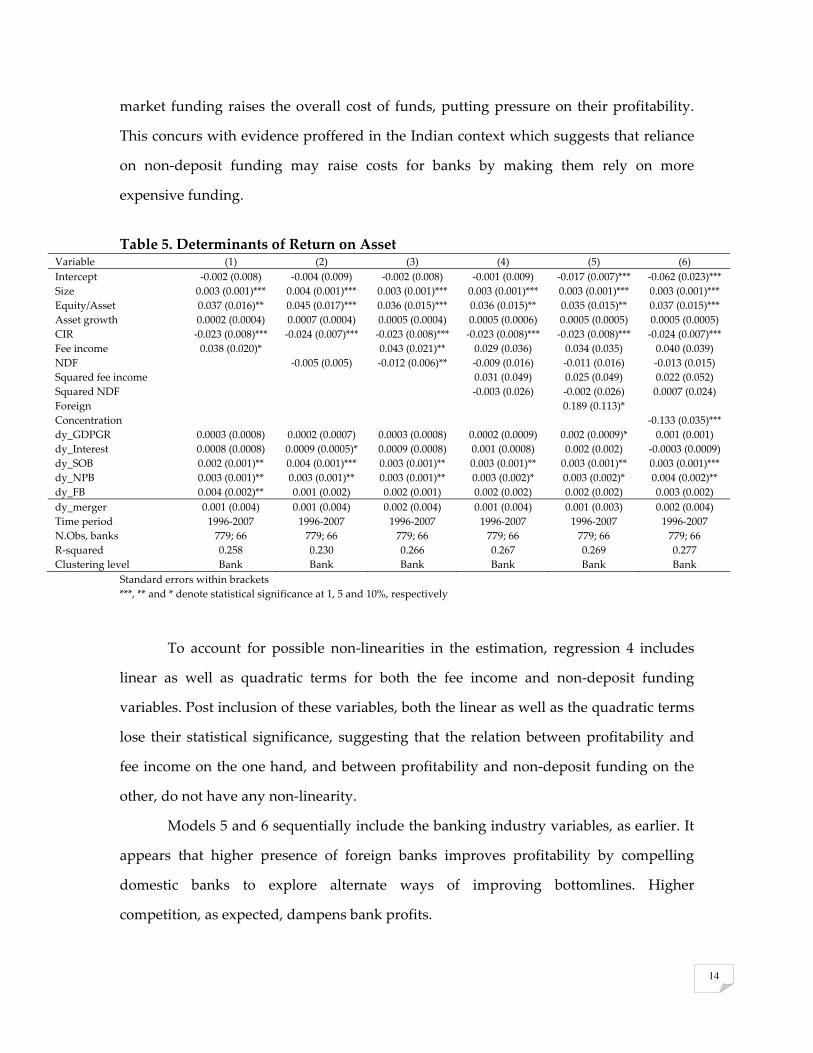
market funding raises the overall cost of funds, putting pressure on their profitability.
This concurs with evidence proffered in the Indian context which suggests that reliance
on non‐deposit funding may raise costs for banks by making them rely on more
expensive funding.
Table 5. Determinants of Return on Asset
Variable (1) (2) (3) (4) (5) (6) Intercept ‐0.002 (0.008) ‐0.004 (0.009) ‐0.002 (0.008) ‐0.001 (0.009) ‐0.017 (0.007)*** ‐0.062 (0.023)*** Size 0.003 (0.001)*** 0.004 (0.001)*** 0.003 (0.001)*** 0.003 (0.001)*** 0.003 (0.001)*** 0.003 (0.001)*** Equity/Asset 0.037 (0.016)** 0.045 (0.017)*** 0.036 (0.015)*** 0.036 (0.015)** 0.035 (0.015)** 0.037 (0.015)*** Asset growth 0.0002 (0.0004) 0.0007 (0.0004) 0.0005 (0.0004) 0.0005 (0.0006) 0.0005 (0.0005) 0.0005 (0.0005) CIR ‐0.023 (0.008)*** ‐0.024 (0.007)*** ‐0.023 (0.008)*** ‐0.023 (0.008)*** ‐0.023 (0.008)*** ‐0.024 (0.007)*** Fee income 0.038 (0.020)* 0.043 (0.021)** 0.029 (0.036) 0.034 (0.035) 0.040 (0.039) NDF ‐0.005 (0.005) ‐0.012 (0.006)** ‐0.009 (0.016) ‐0.011 (0.016) ‐0.013 (0.015) Squared fee income 0.031 (0.049) 0.025 (0.049) 0.022 (0.052) Squared NDF ‐0.003 (0.026) ‐0.002 (0.026) 0.0007 (0.024) Foreign 0.189 (0.113)* Concentration ‐0.133 (0.035)*** dy_GDPGR 0.0003 (0.0008) 0.0002 (0.0007) 0.0003 (0.0008) 0.0002 (0.0009) 0.002 (0.0009)* 0.001 (0.001) dy_Interest 0.0008 (0.0008) 0.0009 (0.0005)* 0.0009 (0.0008) 0.001 (0.0008) 0.002 (0.002) ‐0.0003 (0.0009) dy_SOB 0.002 (0.001)** 0.004 (0.001)*** 0.003 (0.001)** 0.003 (0.001)** 0.003 (0.001)** 0.003 (0.001)*** dy_NPB 0.003 (0.001)** 0.003 (0.001)** 0.003 (0.001)** 0.003 (0.002)* 0.003 (0.002)* 0.004 (0.002)** dy_FB 0.004 (0.002)** 0.001 (0.002) 0.002 (0.001) 0.002 (0.002) 0.002 (0.002) 0.003 (0.002) dy_merger 0.001 (0.004) 0.001 (0.004) 0.002 (0.004) 0.001 (0.004) 0.001 (0.003) 0.002 (0.004) Time period 1996‐2007 1996‐2007 1996‐2007 1996‐2007 1996‐2007 1996‐2007 N.Obs, banks 779; 66 779; 66 779; 66 779; 66 779; 66 779; 66 R‐squared 0.258 0.230 0.266 0.267 0.269 0.277 Clustering level Bank Bank Bank Bank Bank Bank
Standard errors within brackets ***, ** and * denote statistical significance at 1, 5 and 10%, respectively
To account for possible non‐linearities in the estimation, regression 4 includes
linear as well as quadratic terms for both the fee income and non‐deposit funding
variables. Post inclusion of these variables, both the linear as well as the quadratic terms
lose their statistical significance, suggesting that the relation between profitability and
fee income on the one hand, and between profitability and non‐deposit funding on the
other, do not have any non‐linearity.
Models 5 and 6 sequentially include the banking industry variables, as earlier. It
appears that higher presence of foreign banks improves profitability by compelling
domestic banks to explore alternate ways of improving bottomlines. Higher
competition, as expected, dampens bank profits.
15
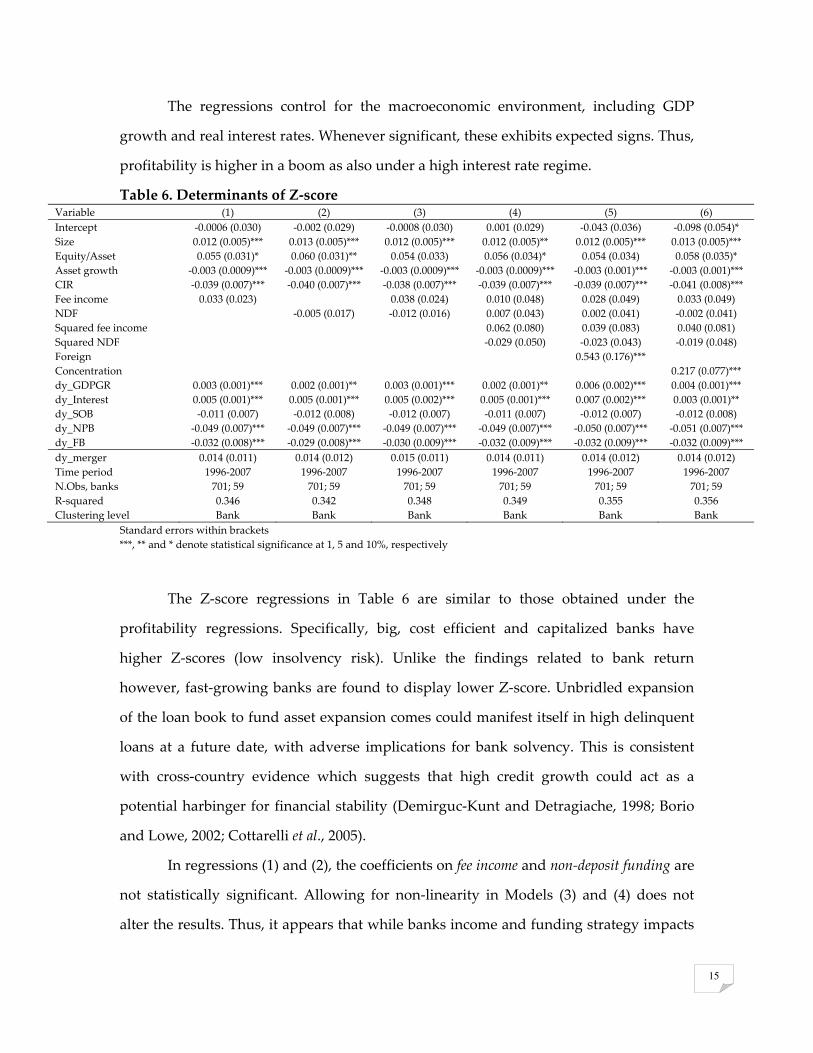
The regressions control for the macroeconomic environment, including GDP
growth and real interest rates. Whenever significant, these exhibits expected signs. Thus,
profitability is higher in a boom as also under a high interest rate regime.
Table 6. Determinants of Z‐score Variable (1) (2) (3) (4) (5) (6) Intercept ‐0.0006 (0.030) ‐0.002 (0.029) ‐0.0008 (0.030) 0.001 (0.029) ‐0.043 (0.036) ‐0.098 (0.054)* Size 0.012 (0.005)*** 0.013 (0.005)*** 0.012 (0.005)*** 0.012 (0.005)** 0.012 (0.005)*** 0.013 (0.005)*** Equity/Asset 0.055 (0.031)* 0.060 (0.031)** 0.054 (0.033) 0.056 (0.034)* 0.054 (0.034) 0.058 (0.035)* Asset growth ‐0.003 (0.0009)*** ‐0.003 (0.0009)*** ‐0.003 (0.0009)*** ‐0.003 (0.0009)*** ‐0.003 (0.001)*** ‐0.003 (0.001)*** CIR ‐0.039 (0.007)*** ‐0.040 (0.007)*** ‐0.038 (0.007)*** ‐0.039 (0.007)*** ‐0.039 (0.007)*** ‐0.041 (0.008)*** Fee income 0.033 (0.023) 0.038 (0.024) 0.010 (0.048) 0.028 (0.049) 0.033 (0.049) NDF ‐0.005 (0.017) ‐0.012 (0.016) 0.007 (0.043) 0.002 (0.041) ‐0.002 (0.041) Squared fee income 0.062 (0.080) 0.039 (0.083) 0.040 (0.081) Squared NDF ‐0.029 (0.050) ‐0.023 (0.043) ‐0.019 (0.048) Foreign 0.543 (0.176)*** Concentration 0.217 (0.077)*** dy_GDPGR 0.003 (0.001)*** 0.002 (0.001)** 0.003 (0.001)*** 0.002 (0.001)** 0.006 (0.002)*** 0.004 (0.001)*** dy_Interest 0.005 (0.001)*** 0.005 (0.001)*** 0.005 (0.002)*** 0.005 (0.001)*** 0.007 (0.002)*** 0.003 (0.001)** dy_SOB ‐0.011 (0.007) ‐0.012 (0.008) ‐0.012 (0.007) ‐0.011 (0.007) ‐0.012 (0.007) ‐0.012 (0.008) dy_NPB ‐0.049 (0.007)*** ‐0.049 (0.007)*** ‐0.049 (0.007)*** ‐0.049 (0.007)*** ‐0.050 (0.007)*** ‐0.051 (0.007)*** dy_FB ‐0.032 (0.008)*** ‐0.029 (0.008)*** ‐0.030 (0.009)*** ‐0.032 (0.009)*** ‐0.032 (0.009)*** ‐0.032 (0.009)*** dy_merger 0.014 (0.011) 0.014 (0.012) 0.015 (0.011) 0.014 (0.011) 0.014 (0.012) 0.014 (0.012) Time period 1996‐2007 1996‐2007 1996‐2007 1996‐2007 1996‐2007 1996‐2007 N.Obs, banks 701; 59 701; 59 701; 59 701; 59 701; 59 701; 59 R‐squared 0.346 0.342 0.348 0.349 0.355 0.356 Clustering level Bank Bank Bank Bank Bank Bank
Standard errors within brackets ***, ** and * denote statistical significance at 1, 5 and 10%, respectively
The Z‐score regressions in Table 6 are similar to those obtained under the
profitability regressions. Specifically, big, cost efficient and capitalized banks have
higher Z‐scores (low insolvency risk). Unlike the findings related to bank return
however, fast‐growing banks are found to display lower Z‐score. Unbridled expansion
of the loan book to fund asset expansion comes could manifest itself in high delinquent
loans at a future date, with adverse implications for bank solvency. This is consistent
with cross‐country evidence which suggests that high credit growth could act as a
potential harbinger for financial stability (Demirguc‐Kunt and Detragiache, 1998; Borio
and Lowe, 2002; Cottarelli et al., 2005).
In regressions (1) and (2), the coefficients on fee income and non‐deposit funding are
not statistically significant. Allowing for non‐linearity in Models (3) and (4) does not
alter the results. Thus, it appears that while banks income and funding strategy impacts
16
its return, its influence on bank risk is limited. Examining bank risk by ownership, the
results indicate that risk varies across ownership. More specifically, foreign and de novo
private banks appear to exhibit lower risk.
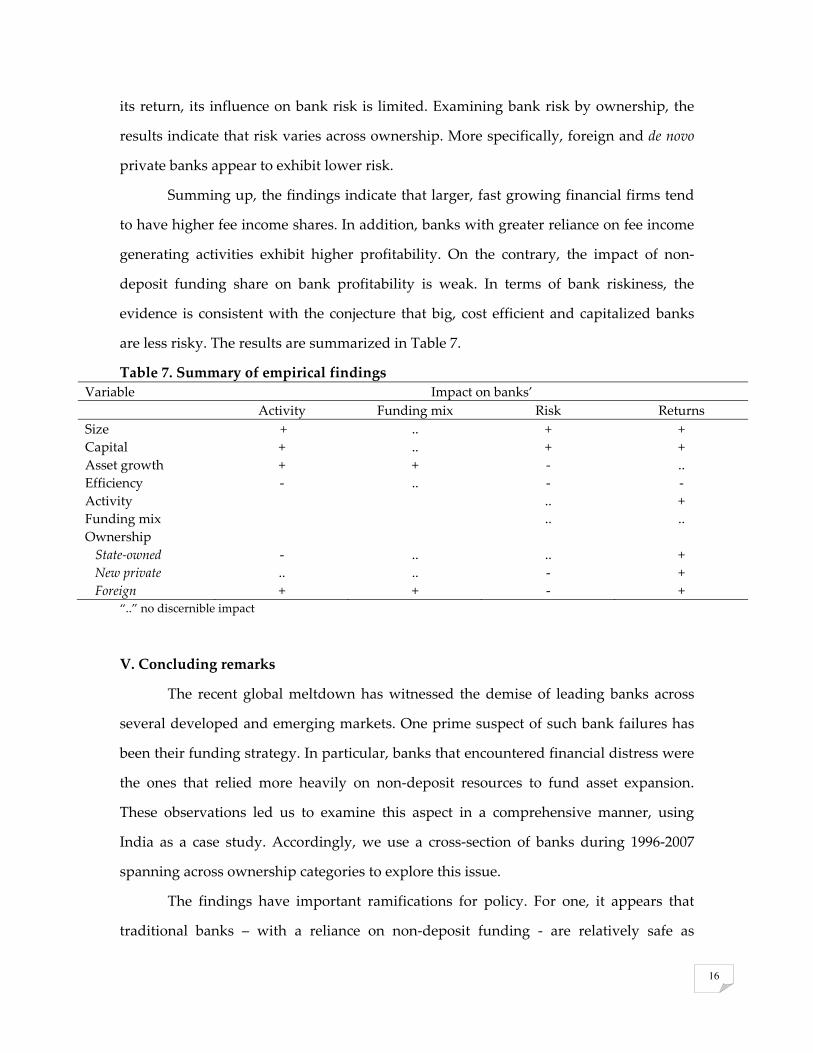
Summing up, the findings indicate that larger, fast growing financial firms tend
to have higher fee income shares. In addition, banks with greater reliance on fee income
generating activities exhibit higher profitability. On the contrary, the impact of non‐
deposit funding share on bank profitability is weak. In terms of bank riskiness, the
evidence is consistent with the conjecture that big, cost efficient and capitalized banks
are less risky. The results are summarized in Table 7.
Table 7. Summary of empirical findings Variable Impact on banks’ Activity Funding mix Risk Returns Size + .. + + Capital + .. + + Asset growth + + ‐ .. Efficiency ‐ .. ‐ ‐ Activity .. + Funding mix .. .. Ownership State‐owned ‐ .. .. + New private .. .. ‐ + Foreign + + ‐ +
“..” no discernible impact
V. Concluding remarks
The recent global meltdown has witnessed the demise of leading banks across
several developed and emerging markets. One prime suspect of such bank failures has
been their funding strategy. In particular, banks that encountered financial distress were
the ones that relied more heavily on non‐deposit resources to fund asset expansion.
These observations led us to examine this aspect in a comprehensive manner, using
India as a case study. Accordingly, we use a cross‐section of banks during 1996‐2007
spanning across ownership categories to explore this issue.
The findings have important ramifications for policy. For one, it appears that
traditional banks – with a reliance on non‐deposit funding ‐ are relatively safe as
17
compared to those with have a high proportion of market resources in their funding
strategy. Therefore, in conjunction with other monetary and prudential ratios, the banks’
funding mix can also provide important signals to policy makers regarding their health
and viability. Second, uncontrolled expansion of the loan book in the quest for garnering
market share could be a recipe for future problems. Across countries, over‐stretched
financial systems and “search for yields” has been found to lead to riskier banking
systems, leading commentators to seek for imposition of “speed limits” (Honohan,
1997), either on their loan book or on segments that appear in danger of over‐extension.
Third, while the literature provides ample evidence that ownership matters for bank
profitability, there is little by way of research to suggest whether ownership affects for
bank income mix and funding strategy or for that matter, for bank risk. Judged thus, the
evidence proffered in the paper provides insights of the importance of ownership for
bank funding strategy. Bank groups which show signs of greater reliance on market
funding mixes could be potential candidates for close scrutiny. Finally, the analysis
emphasizes the role of prudent liquidity management for a sound bank balance sheet.
At the macro level, theoretical research has veered around towards making an explicit
distinction between funding liquidity – ability to meet cash obligations when due – and
market liquidity – ability of financial investors to literally liquidate a non‐cash asset. These
two liquidity risks are mutually reinforcing: shocks to funding liquidity can lead to asset
sales and depress asset prices, with dire consequences for market liquidity. The loop is
established when lower market liquidity leads to higher margin calls (margins are
typically higher in an illiquid market), which increases funding liquidity risk as outflows
rise. A downward spiral begins as a new round of asset sales is triggered off so that
banks can remain liquid, leading to liquidity spirals (Brunnermeier and Pedersen, 2009).4
In essence, the results are a pointer to the fact that there are limits as to how far can
4 For example, holding a liquid instrument may be of little value in an emergency situation if suddenly, no trading partner willing to buy the supposedly liquid asset at a reasonable price can be found in the market.
18
banks veer away from traditional banking models, especially if they are to conduct their
business in a safe, sound and cost‐efficient manner.
References
Adrian, T. and H. S. Shin (2009). Money, liquidity and monetary policy. American Economic Review 99, 600‐05.
Basel Committee on Banking Supervision (2008). Principles for Sound Liquidity Risk Management and Supervision. BIS: Basel.
Berger, A.N., L. F. Klapper, M. Soledad Martinez Peria and R. Zaidi (2008). Bank ownership type and banking relationships. Journal of Financial Intermediation 17, 37‐62.
Berlin, M., and L. Mester (1999). Deposits and relationship lending. Review of Financial Studies 12, 579‐607.
Bonin, J.P., I. Hasan and P. Watchel (2005). Privatization matters: Bank efficiency in transition economies. Journal of Banking and Finance 29, 2155‐78.
Borio, C., and P. Lowe (2002). Asset prices, financial and monetary stability: Exploring the nexus. BIS Working Paper No.114. BIS: Basel.
Boubakri, N., J. Cosset, K. Fischer and O. Guedhami (2005). Privatization and bank performance in developing countries. Journal of Banking and Finance 29, 2015‐41.
Breuer, L., G. Gasha and J. Peschiera (2009). Credit growth: Anatomy and policy responses. In Peru: Selected Issues. IMF: Washington DC.
Brunnermier, M., and L. Pedersen (2009). Market liquidity and funding liquidity. Review of Financial Studies 22, 2201‐38.
Calomiris, C. (1999). Building an incentive‐compatible safety net. Journal of Banking and Finance 23, 1499‐1519.
Chairlone, S., and S. Ghosh (2009). India. In P. Bongini, S.Chairlone, G.Ferri (Eds.) Emerging Banking Systems. Palgrave McMillan, UK.
Cornett, M., J. McNutt, P. Strahan and H. Tehranian (2011). Liquidity risk management and credit supply in the financial crisis. Journal of Financial Economics 101, 297‐312.
Cottarelli, C., G. Dell’Ariccia and L. Vladkova‐Hollar (2005). Early birds, late risers and sleeping beauties: Bank credit growth to private sector in Central and Eastern Europe and in the Balkans. Journal of Banking and Finance 29, 83‐104.
Das, A., and S. Ghosh (2006). Financial deregulation and efficiency: An empirical analysis of Indian banks during the post reform period. Review of Financial Economics 15, 193‐221.
Das, A., and S. Ghosh (2009). Financial deregulation and profit efficiency: A nonparametric analysis of Indian banks. Journal of Economics and Business 61, 509‐28.
19
De Nicolo, G. (2000). Size, charter value and risk in banking: An international perspective. IFC Discussion Paper No.689. Board of Governors of the Federal Reserve: Washington DC.
Demirguc Kunt, A and E. Detragiache (1998). Financial liberalization and financial fragility. In G. Caprio, P. Honohan and J.E.Stiglitz (Eds.) Financial Liberalization: How far, how fast? Cambridge University Press.
Demirguc‐Kunt, A., and L. Serven (2009). Are all the sacred cows dead? Implications of the financial crisis for macro and financial policies. World Bank Policy Research Working Paper No. 4807. World Bank: Washington DC.
Diamond, D. (1991). Monitoring and reputation: The choice between bank loans and directly placed debt. Journal of Political Economy 88, 689‐721.
Dinc, I.S. (2005). Politicians and banks: Political influences on government‐owned banks in emerging markets. Journal of Financial Economics 77, 453‐79.
European Central Bank (2008a). EU banking structures 2008. ECB: Frankfurt. European Central Bank (2008b). Financial Stability Review (December). ECB: Frankfurt. Fama, E.F. (1985). What’s different about banks? Journal of Monetary Economics 15, 29‐39. Flannery, M.J. (2005). No pain, no gain: Effecting market discipline via reverse
convertible debentures. In H.S. Scott (Ed.) Capital Adequacy beyond Basel: Banking Securities and Insurance. Oxford: Oxford University Press.
Furlong, F., and S.Kwan (2005). Market‐to‐book, charter value and bank risk‐taking: A recent perspective. Paper presented at the Basel Committee Research Task Force Conference. Vienna, April 2005.
Goodhart, C. A.E., and A.Persaud (20080. How to avoid the next crash? Financial Times (January 30).
Goodhart, C.A.E. (2009). The regulatory response to the financial crisis. Journal of Financial Stability (forthcoming).
Griffith‐Jones, S. and A. Persaud (2008). The Procyclical Impact of Basel II on Emerging Markets and its Political Economy. New York: Oxford University Press.
Honohan, P (1997). Banking system failures in developing and transition countries: Diagnosis and predictions. BIS Working Paper No.39, BIS: Basel.
Laeven, L. and R. Levine (2007). Is there a diversification discount in financial conglomerates? Journal of Financial Economics 85, 331‐67.
Laeven, L., and R. Levine (2009). Bank governance, regulation and bank risk‐taking. Journal of Financial Economics (forthcoming).
Lins, K., and H. Servaes (1999). International evidence on the value of corporate diversification. Journal of Finance 54, 2215‐40.
Megginson, W., and J. Netter (2001). From state to market: A survey of empirical studies on privatization. Journal of Economic Literature 39, 321–89.
Megginson, W.L. (2005). The economics of bank privatization. Journal of Banking and Finance 29, 1931‐80.
Mercieca, S., K.Schaeck and S.Wolfe (2007). Small European banks: Benefits from diversification? Journal of Banking and Finance 31, 1975‐98.
20
Mester, L., L. Nakamura and M. Renault (2005). Checking accounts and bank monitoring. Working Paper No.14, Federal Reserve Bank of Philadephia.
Poveda, R. (2000). Reform of the system of insolvency provisions. Address delivered at the APD in Madrid (January). Available at <www. bse.es>
Raddatz, C. (2010). When the rivers run dry: Liquidity and the use of wholesale funds in the transmission of the US subprime crisis. World Bank Policy Research Working Paper No. 5203. The World Bank: Washington DC.
Rajan, R.G. (1992). Insiders and outsiders: The choice between informed and arms‐length debt. Journal of Finance 47, 1367‐1400.
Rajan, R.G. (2009a). Cycle‐proof regulation. The Economist (April 8). The Economist: London.
Rajan, R.G. (2009b). The credit crisis and cycle free regulation. Homer Jones Lecture delivered at the Federal Reserve Bank of St.Louis (April 15). Available at <www.chicago. facultybooth.edu/raghuram.rajan>
Ratnovski, L and R. Huang (2009). Why are Canadian banks more resilient? IMF Working Paper No. 152. IMF: Washington DC.
Reserve Bank of India (2008). Handbook of Statistics on the Indian Economy. RBI: Mumbai. Reserve Bank of India (2009). India’s Financial Sector: An Assessment (Report of the
Advisory Panel on Financial Stability Assessment and Stress Testing). RBI: Mumbai.
Reserve Bank of India. Report on Currency and Finance 2006‐07. RBI: Mumbai. Reserve Bank of India. Report on Trend and Progress of Banking in India (various years).
RBI: Mumbai. Reserve Bank of India. Statistical Tables relating to Banks in India (various years). RBI:
Mumbai. Sapienza, P. (2004). The effects of government ownership on bank lending. Journal of
Financial Economics 72, 357‐84. Stein, J. C. (2002). Information production and capital allocation: Decentralized versus
hierarchial firms. Journal of Finance 57, 1891‐1921. Stiroh, K. (2004). Diversification in banking: Is non‐interest income the answer? Journal of
Money, Credit and Banking 36, 853‐82. World Bank (2002). Bank Loan Classification and Provisioning Practices in Selected Developed
and Emerging Countries. The World Bank: Washington DC.