download (192kb) - munich personal repec archive
TRANSCRIPT
Munich Personal RePEc Archive
Family control and expropriation at
not-for-profit organizations: evidence
from korean private universities
Bae, Kee-Hong and Kim, Seung-Bo and Kim, Woochan
1 March 2012
Online at https://mpra.ub.uni-muenchen.de/44029/
MPRA Paper No. 44029, posted 28 Jan 2013 17:44 UTC

1
Family Control and Expropriation at Not-for-Profit Organizations:
Evidence from Korean Private Universities
Abstract
Manuscript Type: Empirical
Research Question/Issue: We study an agency problem in private universities—the conflict
between controlling families and other stakeholders. We investigate whether universities over
which controlling families have disproportionately significant power relative to the amount of
funds they contribute, that is, universities with high expropriation risk, are associated with lower
outside donations and poor quality.
Research Findings/Insights: Using a sample of Korean private universities, we find that
measures of family control in excess of monetary contributions are negatively related to the level
of outside donation and measures of university quality. We also find that universities at which
the controlling family exerts disproportionate control are more likely to face disputes between
the controlling family and other stakeholders. Finally, we show that our results are not driven by
reverse causality.
Theoretical/Academic Implications: While the existing literature on not-for-profit
organizations focuses on the conflict between professional managers and other stakeholders, we
study the conflict between controlling families and other stakeholders. We investigate a situation
in which the controlling family expropriates other stakeholders, a topic missing from the existing
not-for-profit literature.
Practitioner/Policy Implications: This study offers insights to policymakers interested in
creating private universities in an emerging market setting. The relevance of our results is not
2
limited to Korea. According to Altbach (2005), family control of private universities is prevalent
in a number of countries, including Mexico, Thailand, Taiwan, Japan, Korea, the Philippines,
Argentina, India, and China.
Keywords: Corporate Governance, Non-profits, Expropriation, Donations, Private
University
3
INTRODUCTION
Family control of corporations is prevalent around the world. La Porta, Lopez-de-Silanes, and
Shleifer (1999) show that even large corporations around the world are typically controlled by
families. Family control is not necessarily a bad institutional model per se. In fact, in developed
economies, family firms, particularly when founders serve as CEO or chairman of the board,
tend to be associated with better performance and higher valuation (Anderson and Reeb, 2003a,
2003b; Anderson, Mansi, and Reeb, 2003; Andres, 2008; Maury, 2006; Villalonga and Amit,
2006, 2008). However, in developing economies, family control is associated with poor firm
performance. Using a sample of Korean firms, Bae, Kang, and Kim (2002), Joh (2003), and
Baek, Kang, and Park (2004) show that family-controlled Korean business groups perform
poorly. Bertrand, Mehta, and Mullainathan (2002) find similar evidence using Indian business
groups.
The main reason for the negative relationship between family ownership and firm
performance in emerging markets is that families have controlling power over firms despite
holding a relatively small portion of their cash flow rights through pyramidal ownership
structures and cross-holdings among firms. That is, there is a significant disparity between
control rights and cash flow rights, which creates strong incentives for controlling families to
expropriate firm resources. Burkart, Panunzi, and Shleifer (2003) and Morck, Wolfenzon, and
Yeung (2005) develop theoretical arguments suggesting that in a weak institutional environment,
a family can control a firm without making a commensurate capital investment, creating large
divergence between control rights and cash flow rights. Thus, in a country with a weak
4
institutional environment, family control is expected to be associated with high expropriation and
poor firm performance, as evidenced in the previous literature.
In this paper, we investigate whether family control without a commensurate capital
investment is associated with poor organizational performance in non-profit organizations. Given
the evidence of expropriation in for-profit firms in emerging markets and given the weak
institutional environment in these markets, it is plausible to expect negative effects of family
control of non-profit organizations. Specifically, using a sample of private, non-profit
universities in Korea, we test the hypothesis that universities over which founding families have
disproportionately large power relative to the amount of funds they contribute, that is,
universities with high expropriation risk, are associated with poor university performance as
reflected in donations received.1 The more controlling power the founding family has over
universities in excess of their contributions, the more incentive it has to expropriate university
resources to its benefit at the expense of other stakeholders. The increase in expropriation risk
thus discourages future donors, leading to fewer donations, as potential donors see that the risk
of their donations being wasted increases with more control by founding families.
Note that we do not measure the extent of actual expropriation by controlling families.
Rather, we measure the extent of expropriation risk perceived by outside donors and examine
how this expropriation risk affects outside donations. To measure expropriation risk, we create a
Disparity Index, which is intended to capture the risk of expropriation by founding families. We
find that the donation level is negatively and significantly related to the Disparity Index.
While we use outside donation as our main university performance variable because it can
be easily measured and its interpretation is homogeneous across different universities, we also
find that universities with a higher Disparity Index have poor quality in various dimensions.
5
They tend to have lower per student funding and Scholastic Aptitude Test (SAT) scores and
engage in less faculty research, but have a higher ratio of part-time lecturers to full-time faculty.
They are also more likely to experience a campus dispute between the founding family and other
stakeholders of the university.
The relevance of our results is not limited to Korea. Altbach (2005) noted that family-
dominated universities are prevalent in a number of countries, including Mexico, Thailand,
Taiwan, Japan, South Korea, the Philippines, Argentina, India, and China. Altbach (2005) also
noted that family universities are often established with the idea of making money or wielding
influence, and typically have very strong and centralized administrative control, where
administrative offices are in the hands of family members.
This paper proceeds as follows. Section I discusses the related literature. Section II describes
the characteristics of private universities in Korea, and Section III develops the hypotheses.
Section IV describes the data and construction of our main variables. Section V presents the
empirical results. Section VI summarizes and concludes the paper.
RELATED LITERATURE
Our paper is related to several strands in the literature: (1) family control and organizational
performance, (2) risk of expropriation by family owners, and (3) non-profit organizational
governance and performance.
Family Control and Organizational Performance
6
This paper is closely related to the growing literature on family firms. In this review, we
limit our discussion to empirical papers that link family control to performance. For a more
extensive review of family firms, see Bennedsen, Pérez-González, and Wolfenzon (2010).
Studies of the United States and Western European countries tend to document the
superior performance of family firms. For example, Anderson and Reeb (2003a) report that
family firms perform better than non-family firms using S&P 500 firms. 2 Using Western
European firms, Maury (2006) finds that active family control is associated with higher
profitability than found in non-family firms. Andres (2008) ffinds similar evidence using
German data.
Further investigation of family firms shows that not all family firms show superior
performance. Using Fortune 500 firms, Villalonga and Amit (2006) report that family ownership
creates value only when the founder serves as CEO of the family firm or as chairman with a
hired CEO.3 In contrast, firm value is destroyed when descendants serve as CEOs. Pérez-
González (2006) also finds that firms with family succession underperform relative to firms that
promote unrelated CEOs.4 This finding is consistent with recent evidence on founder-director
firms. Li and Srinivasan (in press) showed that pay-for-performance and turnover sensitivity to
performance are both higher in founder-director firms than in non-founder firms. The level of
corporate transparency also appears to be important to the relationship between family control
and performance. Anderson, Duru, and Reeb (2009) showed that both founder and heir firms are
significantly more opaque than diffuse shareholder firms and that the positive relationship
between family control and performance exists only in highly transparent firms.
Risk of Expropriation by Family Owners
7
Unlike the U.S. evidence, in which certain subsets of family firms perform better than non-
family firms, studies in other parts of the world find evidence that family firms tend to perform
poorly in general. Using a sample of Korean firms, Bae et al. (2002), Joh (2003), and Baek et al.
(2004) show that family-controlled Korean business groups perform poorly. Bertrand et al.
(2002) find similar evidence using Indian business groups.5 Using Taiwanese firms, Wong,
Chang, and Chen (2010) show that family control is significantly and negatively associated with
abnormal returns of corporate venturing announcements. Studying Thai firms, Bertrand,
Johnson, Smaphantharak, and Schoar (2008) show that greater involvement by sons in family
firms is associated with lower firm-level performance.
Why do family firms perform poorly in emerging markets? The main reason is that many
family firms in emerging economies have ownership structures that benefit controlling families
at the expense of minority investors. It is well documented empirically that, in emerging
economies, a key agency problem exists between the controlling family and minority
shareholders (Claessens, Djankov, and Lang, 2000; Khanna and Yafeh, 2007). Burkart et al.
(2003) and Morck et al. (2005) develop theoretical arguments that in a weak institutional
environment a family can control a firm without making a commensurate capital investment,
creating much divergence between control rights and cash flow rights, which in turn creates
expropriation incentives for controlling families. When a firm has significant disparity between
control rights and cash flow rights in its ownership structure, outside investors demand a higher
risk premium for holding such a firm, or completely shy away from it, as they perceive increased
risk of expropriation. Thus, high disparity between control rights and cash flow rights is
associated with low firm valuation.
8
Johnson, La Porta, Lopez-de-Silanes, and Shleifer (2000) coin the term “tunneling” to
describe the actual expropriation activities by controlling families and provide many examples of
tunneling around the world. Bae et al. (2002), Bae et al. (2012), Joh (2003), Baek et al. (2004),
Baek, Kang, and Lee (2006), Bertrand et al. (2002), Cheung, Rau, and Stouraitis (2004), and
Atanasov (2005) provides evidence of tunneling using data from Korea, India, Hong Kong, and
Bulgaria. One common theme of these papers is that the control-ownership disparity is a good
proxy for the risk of expropriation by controlling shareholders and that the disparity measure
well captures the extent of actual expropriation, so that high control-ownership disparity is
associated with poor firm performance and valuation.
Family control of business groups in emerging economies can also have an economy-wide
impact. Morck et al. (2005) argue that controlling owners of pyramids can have greatly amplified
political influence relative to their actual wealth, and this influence can distort public policy
regarding property rights protection, capital markets, and other institutions. They denote this
phenomenon as economic entrenchment. Johnson and Mitton (2003) show an example of
economic entrenchment using politically connected Malaysian firms during the Asian crisis.
Morck, Yavuz, and Yeung (2011) show evidence of economic entrenchment in the banking
sector. They show that tycoon or family control of banks correlates with slower economic and
productivity growth, greater financial instability, and worse income inequality.
In sum, the previous literature on family firms shows that family firms in a weak
institutional environment tend to perform poorly due to their inherent agency problems.
University Governance and Quality
9
This paper is related to the literature on the governance of non-profit organizations. Fama
and Jensen’s (1983) study is perhaps the first to examine non-profit organizations in the
principal-agent framework. Since then, the literature has grown, but so far it is limited to studies
of conflict between outside donors and managers of non-profit organizations, such as non-profit
hospitals, focusing mostly on the issues of management compensation (Ballou and Weisbrod,
2003; Brickley and Van Horn, 2002; Core, Guay, and Verdi, 2006; Cornell, 2004; Eldenburg et
al., 2003; Fisman and Hubbard, 2005; Roomkin and Weisbrod, 1999).
Only a few studies have examined the governance of universities. McCormick and Meiners
(1988) study the degree of faculty participation in university decision making and its impact on
university quality. They define university quality by faculty research and graduate teaching.
They measure faculty research using the number of research publications and graduate teaching
using publications by former graduate students. They also use the average scholastic aptitude test
(SAT) scores of the incoming freshmen class as a measure of overall university quality. They
concluded that faculty perform poorly when they are assigned managerial responsibilities.
Faculty successful at research and teaching do not participate much in the actual management of
their universities, and those who do administer do not publish as much or teach as well. Brown
(2001) refines the study of McCormick and Meiners (1988) and finds that the relationship
between faculty participation in university decision making and university quality varies by
decision type. He finds positive association between the two in decisions concerning faculty
appointments and tenure.
Volkwein and Malik (1997) investigate whether varying degrees of regulation and autonomy
exert influence on measures of university quality. They measured university quality using
variables reflecting faculty and student quality constructed from the national survey of doctoral
10
program quality by the National Research Council, from data assembled by Graham and
Diamond (1996), and from student and campus data reported in Barren’s and U.S. News. They
fail to find any significant association between governance and university quality. Their state-
level measures of campus regulation and flexibility are not significant predictors of either faculty
quality or undergraduate quality.
Aghion, Dewatripont, Hoxby, Mas-Colell, and Sapir (2010) test the hypothesis that
universities are more productive when they are both more autonomous and face more
competition. Using survey data, they constructed indices of university autonomy and competition
for both Europe and the United States and showed that there are strong positive correlations
between these indices and measures of university quality. To obtain causal evidence, they also
showed that an exogenous increase in a university’s expenditure generates more output,
measured by either patents or publications, if the university is more autonomous and faces more
competition. The main measure of university quality used by Aghion et al. (2010) is the
university ranking compiled by Shanghai Jiao Tong University in its Academic Ranking of
World Universities (2008). The ranking is based on six indices that capture the research
capabilities of faculty and graduates.
University Donations
Last, this paper is related to studies on university donations. Most of the studies on
university donations focus on uncovering the factors that attract alumni donations. These studies
address intercollegiate sports programs (Grimes and Chressanthis, 1994), business cycle
(Okunade, Wunnava, and Walsh, 1994), number of class reunions (Willemain, Goyal, and
Vendeven, 1994), participation in fraternities or sororities, proportion of full-time students
11
(Harrison, Mitchell, and Peterson, 1995), volunteer experience during college, residence in states
with alumni chapters, varsity sports experience during college, existence of relatives attending
college (Wunnava and Lauze, 2001), income level, degree of satisfaction with undergraduate
experience, receipt of need-based aid during college (Clotfelter, 2003), state rules on charitable
tax deductions, gender, undergraduate major, occupational sector (Holmes, 2009), and legacy
admissions policy (Meer and Rosen, 2010).
To the best of our knowledge, no study has yet examined the relationship between
university governance and outside donations. However, it is worth mentioning Payne (2001),
who examines the effect of federal research funding on private donations at research universities.
He reports a positive association between federal government funding and private donations in
research universities. Because the government pays the cost of information gathering, and
thereby provides peer-review services for research proposals when granting research funding, the
government’s grant awards may provide a signal of research quality or other information that is
less noisy than that available to private donors. While private and public donations are positively
correlated for research universities, they are negatively correlated for non-research institutions.
Cheslock and Gianneschi (2008) confirmed Payne’s (2001) findings.
HYPOTHESES
As discussed in the literature section, it is well documented empirically that, in emerging
economies, a key agency problem exists between the controlling family and minority
shareholders. The agency problem in family-controlled business groups is likely to be even more
serious. The ownership structure of family business groups allows controlling families to control
firms within business groups without actually having much equity stake in them, creating much
12
divergence between control rights and cash flow rights, which in turn creates expropriation
incentives for the controlling family. In other words, when controlling families exercise
controlling power over firms in excess of their cash flow rights (when the disparity between
control rights and cash flow rights increases), the expropriation incentive to transfer resources of
the firm to the controlling families at the expense of minority investors increases.6
In many respects, family-controlled private universities in emerging economies appear
similar to business groups. First, they have a complex ownership structure. For example, the
founding family establishes a school foundation, which in turn establishes a university. Through
the school foundation, the founding family also sets up other educational entities, including high
schools or elementary schools; runs non-educational businesses; and even invests in for-profit
firms. The non-educational and for-profit companies are established for the purpose of
generating revenues that can be transferred later to the educational entities. In a sense, the
university foundation can have a position similar to a holding company in a pyramidal business
group.
Second, school foundations, like business groups, are under the control of founding families.
This controlling power is often handed down to the founder’s heir, a practice that we also
observe in many of the controlling families of business groups.
Third, the founding families have full control over the school foundations without having
commensurate capital investments in the form of monetary contributions. The controlling
families of school foundations are similar to those of business groups, which put up only a small
portion of the equity stake, but have full control over the firms within the business group, which
creates the incentive to expropriate. In such circumstances, they are likely to have both the
incentive and the discretionary power to expropriate resources from other stakeholders within the
13
university to maximize their own welfare. For instance, from the perspective of a self-interested
founder who runs a not-for-profit university as well as for-profit firms, the stable stream of cash
flow the university generates (e.g., tuition revenue) is the first, most natural candidate for
expropriation when a for-profit firm in which the founder has a large equity stake is in financial
distress.
Figure 1 illustrates these three similarities. The founder contributes to the private school
foundation and typically sits on the foundation board as a chair (link in Figure 1). The
foundation then runs a number of educational entities (link ). To generate revenue, the
foundation may run a number of non-educational businesses (link ). Instead of running the
business directly, it might also hold equity stakes in for-profit firms (link ). The founding
family might also have direct equity stakes in these for-profit firms or those not directly related
to the foundation (link ). The dotted line in Figure 1 indicates a business-unit relationship, and
the solid line indicates equity holdings.
Insert Figure 1 about here
Given that expropriation incentive for controlling families is inherent in the organizational
structure of private universities, we examine whether the expropriation risk within private
universities is associated with a lower level of outside donations and/or poor university quality.
Outside Donations
We expect that the increase in expropriation risk will discourage future donors, leading to
fewer donations, as potential donors see the risk of their donations being wasted increase. The
14
question here is how one can capture expropriation risk. Borrowing from the corporate
governance literature, we expect that expropriation risk is an increasing function of family
control and a decreasing function of the founding family’s contribution to the school foundation
(Claessens et al., 2000; Claessens, Djankov, Fan, and Lang, 2002; La Porta, Lopez-de-Silanes,
and Shleifer, 2002; Lemmon and Lins, 2003; Mitton, 2002). Family control increases the power
to expropriate, while family contribution increases the incentive to expropriate.
As for family contribution, however, one may come up with an opposite prediction. That is,
if family contributions are sufficient enough to ensure the provision of educational services, the
university has less incentive to mobilize donations, suggesting a negative link between
contributions and donations. Thus, testing the relationship between family contributions and
outside donations would actually be a test of two competing predictions.
Nevertheless, we have the following two closely related hypotheses.
Hypothesis 1a: Non-profit universities more heavily controlled by founding families attract
fewer outside donations, ceteris paribus.
Hypothesis 1b: Non-profit universities where founding families make greater contributions
attract more outside donations, ceteris paribus.
Combining the two hypotheses leads to
Hypothesis 1c: Non-profit universities more heavily controlled by founding families without
commensurate contribution attract fewer outside donations, ceteris paribus.
University Quality
15
In addition to outside donations, we also examine whether expropriation risk affects university
quality. Following the studies on university quality in the United States, we examine faculty
research volume on a per faculty member basis, and student quality based on factors such as
incoming student SAT scores (Aghion et al., 2010; Brown, 2001; McCormick and Meiners,
1988; Volkwein and Malik, 1997). We supplement these with three other quality measures: per
student spending, ratio of part-time lecturers to full-time faculty, and campus dispute.
To the extent that the amount of actual expropriation by controlling families is positively
related to the degree of expropriation risk (Johnson et al., 2000), we expect that universities with
greater expropriation risk will spend less on students, hire more part-time lecturers than full-time
faculty, and provide less support for research. These universities are more likely to experience
campus disputes between founding family and other stakeholders. For all these reasons, they
attract students of poorer quality (lower SAT scores). Thus, we hypothesize as follows:
Hypothesis 2a: Nonprofit universities more heavily controlled by founding families have
lower overall university quality, ceteris paribus.
Hypothesis 2b: Nonprofit universities where founding families make greater contributions
have higher overall university quality, ceteris paribus.
Combining the two hypotheses leads to
Hypothesis 2c: Universities more heavily controlled by founding families without
commensurate contribution have lower university quality, ceteris paribus.
16
DATA AND VARIABLE CONSTRUCTION
Korean Private Universities
To test our hypotheses, we use a sample of four-year private universities in Korea. There
are a number of reasons for this. First, Korean private universities have an organizational
structure close to those discussed in our hypotheses. They are established by foundations that
resemble holding companies in pyramidal business groups. These foundations not only run
universities, but also own business units and have equity holdings in many subsidiaries.
Second, the founding families have almost complete control over the foundation boards,
which in turn control all educational and non-educational entities. According to the Private
School Law (hereafter, the Law) that prevailed during our sample period, a foundation board
elects its own board members. The usual practice is to give the founder the exclusive right to
nominate directors, and to let the founder himself serve as a board chairman. No other
stakeholders representing students, faculty, staff, or even alumni can influence the composition
of the foundation board. The foundation board also has the exclusive right to dismiss directors.
Further, it is normal practice for immediate family members or relatives to serve as board
members. If the founder passes away, his or her heir normally assumes the position of board
chairman.
Furthermore, the Law requires that university presidents be appointed either by the
foundation board or by the founder himself, and the typical foundation charter requires that the
university president be appointed by the chairman of the board. The typical charter also allows a
member of the board—usually one of the founder’s immediate family members—to be appointed
17
university president. Moreover, members of the founding family often work as staff members at
the school foundation or assume managerial positions at the university.
According to a recent survey conducted by National Assemblyman Hoon Seol, 75 out of 83
universities have immediate family and/or relatives of the founder working as either board
members or administrative personnel. Figure 2 shows the details of the survey results.7 Pie chart
A of Figure 2 shows that in the 75 universities surveyed, 247 people are related to the founding
families. Of those 247, 115 (46.6 percent) serve as board members, 29 (11.7 percent) as either
president or dean, 59 (23.9 percent) as professors, and 44 (17.8 percent) as administrative staff.
Pie chart B of Figure 2 shows these individuals’ relationships to the founder. Out of 226 people
identified as having a relationship with the founder, 30 (13.3 percent) are the founder’s spouse,
99 (43.8 percent) are offspring, 12 (5.3 percent) are siblings, and 85 (37.6 percent) are other
relations. The statistics show that immediate family members account for more than 60 percent
of those who are related to the founder.
Insert Figure 2 about here
Third, examples of misbehavior by founding families are abundant, ranging from outright
theft to more subtle transactions that circumvent the law. For example, the founder may own a
for-profit construction company, which he then uses to build school facilities, paying greatly
inflated construction fees. Other examples include taking bribes upon the appointment of new
faculty, misappropriation of tuition for personal use, overcompensating board members and/or
related administrative staff, and the personal use of university properties such as a house or
vehicles. According to the results of the National Assembly inspection in 2004, losses incurred
18
from 45 private universities and colleges due to improper management amounted to 300 billion
won (300 million dollars) during the period 1999–2004. Such improper behavior often creates
campus disputes between the founding family and other stakeholders of the university, including
faculty and students. During the period 1997–2000, 44 universities were engulfed in some form
of dispute (Lee, Park, and Kim, 2004).
Data and Variable Construction
Our sample period spans three years: 2001–2003. We exclude public universities, as they are
governed by the government and our interest in this study is the impact of family ownership on
the extent of expropriation. We also exclude universities that had existed for less than 10 years as
of 2001. We impose this restriction because the degree of family control over universities may be
different for young universities compared to more established universities. The results we report
are not sensitive to the choice of this 10-year restriction. We examined the sample with no
restriction and with a five-year restriction. The results did not change. The 10-year restriction
gives a three-year panel with a sample of 259 university-year observations (93 unique
universities).
We obtain annual Donation data from the Korea Foundation for the Promotion of Private
Schools, which is a non-profit organization that provides loans to private universities. The annual
Donation is scaled by the number of students enrolled in the university to control for the impact
of university size on donation, since larger universities are likely to attract more donations.
Notice that unlike in the United States, donation by students at the time of admission is not
allowed in Korea. It is illegal to admit students for donation. Notice also that Donation does not
19
include donations made by founding families, only those donation made by unrelated outside
donors.
Our measure of family control is the number of the founder’s Relatives who work on the
foundation’s staff or have assumed managerial positions in the university. We obtain this
variable from a report issued in 2001 by the Millennium Democratic Party. As a measure of
family contributions to the university, we use annual monetary contributions made by the school
foundation to the university (hereafter, Foundation Contributions). These are contributions from
the family that established the private school foundation. We also constructed a single variable
intended to capture expropriation incentives for controlling families. First, we scaled Relatives
and Foundation Contribution to range from zero to one. Then we subtract the scaled Foundation
Contribution from the scaled Relatives. The variable ranges from a minimum of -1 to a
maximum of 1, with a higher score implying more expropriation incentives. We call this the
Disparity Index.
Our Disparity Index is similar in idea to the control-ownership disparity measure in the
corporate governance literature (Claessens et al., 2002; John, 2003; La Porta et al., 2002;
Lemmon and Lins, 2003; Mitton, 2002). A shareholder’s control-ownership disparity in a firm is
typically defined as the shareholder’s control rights minus the shareholder’s cash flow rights.
Control rights capture the percentage of voting rights over which a shareholder has influence and
cash flow rights capture the percentage of earnings or dividends over which a shareholder has
claim. A firm with a greater degree of control-ownership disparity for the controlling shareholder
is considered to have a greater degree of expropriation risk. The reason is that the controlling
shareholder has greater power (high control rights) and greater incentive (low cash flow rights)
to expropriate the resources of the firm. Our Disparity Index is a measure that adapts the control-
20
ownership disparity measure to a not-for-profit setting. Relatives captures the controlling
family’s power to expropriate, while Foundation Contribution captures the controlling family’s
incentive not to expropriate.
Our main hypothesis is that family control without contribution induces greater
expropriation incentive that leads to lower donations. One main concern in testing this
hypothesis is that family control could be a proxy for university reputation. If this were the case,
then the negative relation between family control and donation would be a reflection of omitted
variables. That is, universities with more family control are those with poor reputations, so these
universities attract few donations. To control for university reputation, we use the number of
years since its establishment. Universities with a long history and tradition tend to have better
reputations and presumably attract more donations (History).
We also use information on whether or not the university has a religious mission (Religion).
We assume that universities with such a mission have a better reputation, and thus attract more
donations. We gather information on the location of the university to determine whether it is in
the metropolitan area (Metro). We regard location as an important determinant of donations. We
obtain these variables from each university’s annual report.
As proxies for university quality, we use Per Student Spending, ratio of Part-time Lecturers,
Faculty Research, SAT scores, and incidents of Campus Disputes. Per Student Spending is from
the Korea Foundation for the Promotion of Private Schools. Information on the ratio of Part-
Time Lecturers comes from the Office of National Assemblyman Hoon Seol. We measure
Faculty Research using the yearly number of journal articles listed in the National Citation
Report published per full-time faculty member. We obtain the number of journal articles from
the Ministry of Science and Technology. The SAT scores are from Jinhaksa, a private company
21
that produces publications on college entrance examinations. McCormick and Meiners (1988)
also use faculty research and SAT scores as measures of university quality.
Our final measure of university quality is whether the university has experienced any
disputes between the founding family and other stakeholders. Faculty and students often
challenge the founding family on the use of university resources, and these challenges often lead
to Campus Disputes. We obtained the information on Campus Disputes through news article
searches and reports issued by the Ministry of Education. We used the Korean Integrated News
Database System (KINDS) to identify all articles on campus disputes. In this search, we used all
10 nation-wide newspapers and five local newspapers, representing five major provinces. From
this initial set, we excluded disputes that take place regularly every spring (for example, disputes
over tuition increases), and those that do not involve the school foundation. From this final set,
we obtained the list of universities and the years in which disputes were featured in the
newspaper. We combined this list with another list of universities whose foundation boards were
replaced by Ministry-appointed temporary directors. Typically, if a campus dispute reaches a
stage where it cannot be resolved among the concerned parties, the Ministry steps in and replaces
the foundation board members. Using these two sources, we created a dummy variable that takes
the value of one if the university experienced a Campus Dispute or the foundation board
members were replaced by the Ministry of Education, and zero otherwise.
In Table 1, we provide a detailed description of each variable used in the paper. We assume
that the family control is time-invariant and measured the number of relatives as of 2001. We
treat the campus dispute dummy as if the university experienced a dispute lasting the whole
sample period. This treatment is reasonable given that problems existed some years before and
even after the first press appearance of the dispute.
22
Insert Table 1 about here
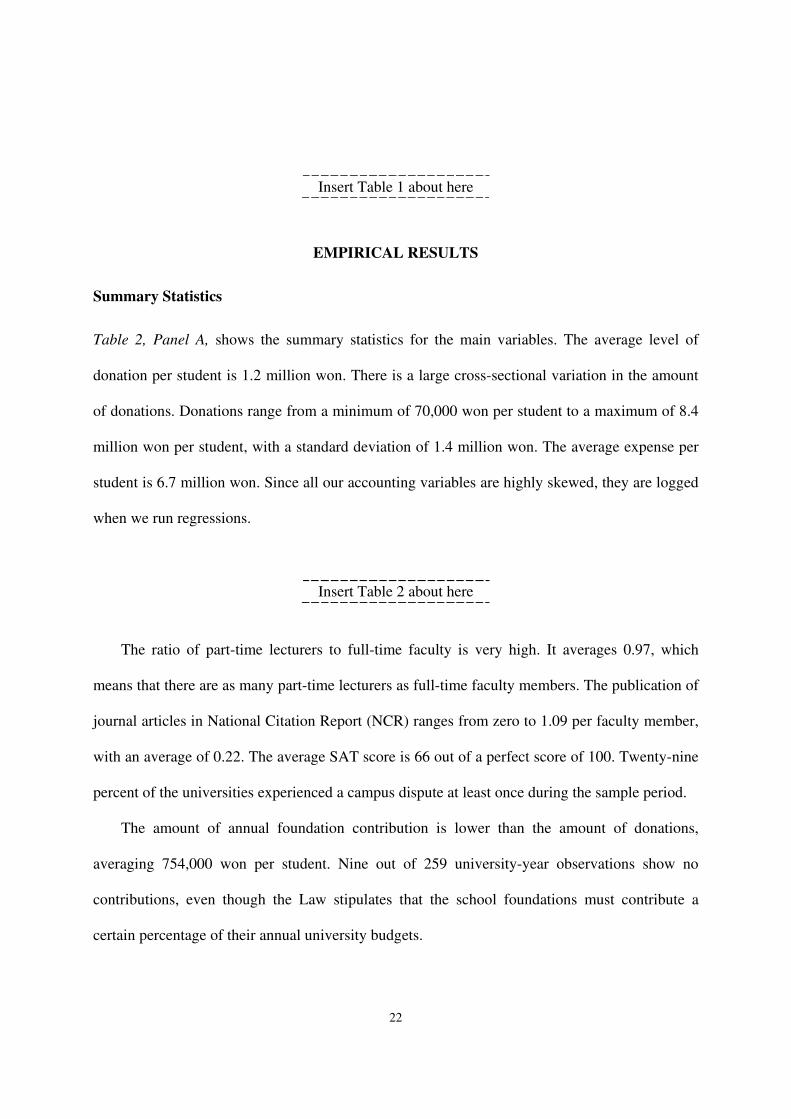
EMPIRICAL RESULTS
Summary Statistics
Table 2, Panel A, shows the summary statistics for the main variables. The average level of
donation per student is 1.2 million won. There is a large cross-sectional variation in the amount
of donations. Donations range from a minimum of 70,000 won per student to a maximum of 8.4
million won per student, with a standard deviation of 1.4 million won. The average expense per
student is 6.7 million won. Since all our accounting variables are highly skewed, they are logged
when we run regressions.
Insert Table 2 about here
The ratio of part-time lecturers to full-time faculty is very high. It averages 0.97, which
means that there are as many part-time lecturers as full-time faculty members. The publication of
journal articles in National Citation Report (NCR) ranges from zero to 1.09 per faculty member,
with an average of 0.22. The average SAT score is 66 out of a perfect score of 100. Twenty-nine
percent of the universities experienced a campus dispute at least once during the sample period.
The amount of annual foundation contribution is lower than the amount of donations,
averaging 754,000 won per student. Nine out of 259 university-year observations show no
contributions, even though the Law stipulates that the school foundations must contribute a
certain percentage of their annual university budgets.

23
The number of relatives in university managements ranges between zero and four. It is
surprising that the number is so small. The reason is that this variable includes only the number
of relatives who have managerial positions at the university. It does not include relatives on the
foundation board or relatives without a managerial position at the university. We focus only on
the relatives in a managerial position because these people are the ones actually making
important decisions involving the university budget. The average age of the universities is
around 34 years. About one third of the universities in the sample have a religious mission. More
than half are in the Seoul metropolitan area.
Table 2, Panel B shows the correlations between the variables. Per student donations, per-
student spending, faculty research, and SAT scores are all negatively (positively) and
significantly related to the variables that are proxies for family control (family contributions). In
contrast, the ratio of part-time lecturers to full-time faculty is positively (negatively) related to
measures of family control (family contributions). Most of the correlation coefficients are
significantly different from zero. Campus disputes are not related to most of the family control
variables, with the exception of family contributions, to which they are negatively related.
Impact on Donations
Since we used panel data, the t-values of the ordinary least squares (OLS) coefficients can be
biased. This bias arises because the residuals for each university are likely to be correlated over
the years (temporal correlation), and the residuals might be correlated across universities within a
single year (spatial correlation).
One way to address this problem is to run a regression model with university fixed effects
and year dummies. However, the data structure does not allow this. We measure all the main
24
variables of interest as time-invariant, with the exception of foundation contributions. Thus,
these measures are completely captured by university fixed effects. As an alternative, we use
university random effects with year dummies.
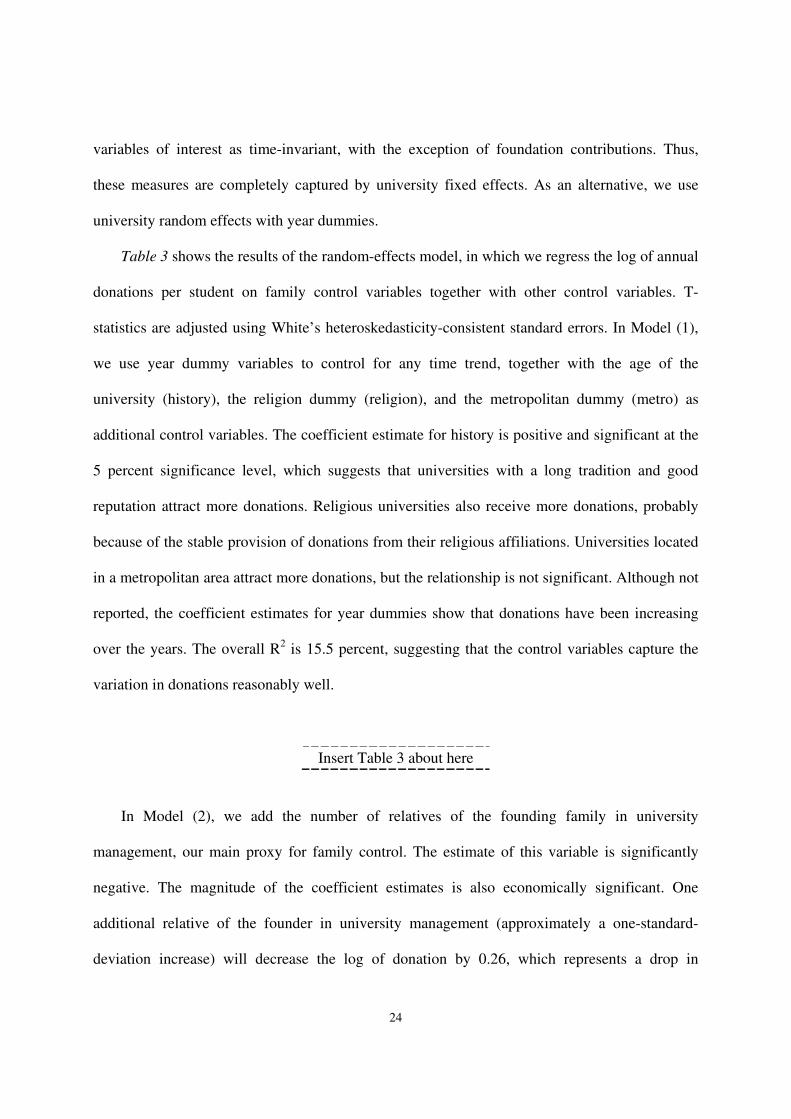
Table 3 shows the results of the random-effects model, in which we regress the log of annual
donations per student on family control variables together with other control variables. T-
statistics are adjusted using White’s heteroskedasticity-consistent standard errors. In Model (1),
we use year dummy variables to control for any time trend, together with the age of the
university (history), the religion dummy (religion), and the metropolitan dummy (metro) as
additional control variables. The coefficient estimate for history is positive and significant at the
5 percent significance level, which suggests that universities with a long tradition and good
reputation attract more donations. Religious universities also receive more donations, probably
because of the stable provision of donations from their religious affiliations. Universities located
in a metropolitan area attract more donations, but the relationship is not significant. Although not
reported, the coefficient estimates for year dummies show that donations have been increasing
over the years. The overall R2 is 15.5 percent, suggesting that the control variables capture the
variation in donations reasonably well.
Insert Table 3 about here
In Model (2), we add the number of relatives of the founding family in university
management, our main proxy for family control. The estimate of this variable is significantly
negative. The magnitude of the coefficient estimates is also economically significant. One
additional relative of the founder in university management (approximately a one-standard-
deviation increase) will decrease the log of donation by 0.26, which represents a drop in
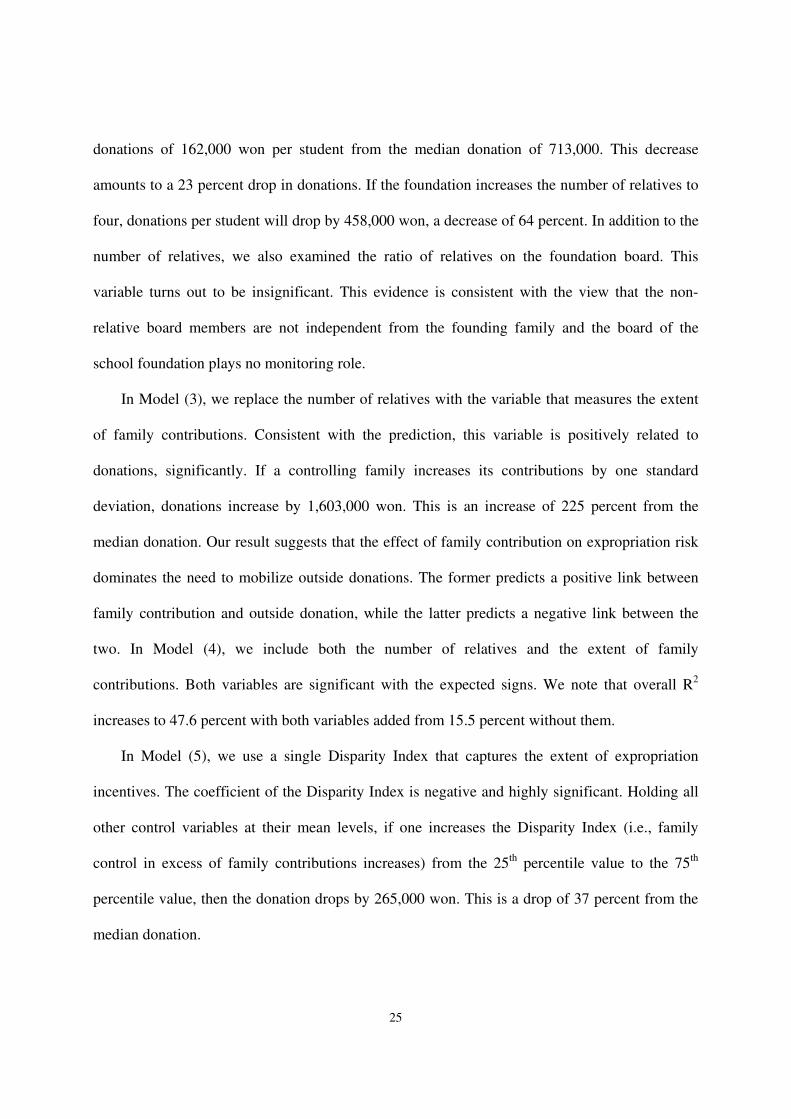
25
donations of 162,000 won per student from the median donation of 713,000. This decrease
amounts to a 23 percent drop in donations. If the foundation increases the number of relatives to
four, donations per student will drop by 458,000 won, a decrease of 64 percent. In addition to the
number of relatives, we also examined the ratio of relatives on the foundation board. This
variable turns out to be insignificant. This evidence is consistent with the view that the non-
relative board members are not independent from the founding family and the board of the
school foundation plays no monitoring role.
In Model (3), we replace the number of relatives with the variable that measures the extent
of family contributions. Consistent with the prediction, this variable is positively related to
donations, significantly. If a controlling family increases its contributions by one standard
deviation, donations increase by 1,603,000 won. This is an increase of 225 percent from the
median donation. Our result suggests that the effect of family contribution on expropriation risk
dominates the need to mobilize outside donations. The former predicts a positive link between
family contribution and outside donation, while the latter predicts a negative link between the
two. In Model (4), we include both the number of relatives and the extent of family
contributions. Both variables are significant with the expected signs. We note that overall R2
increases to 47.6 percent with both variables added from 15.5 percent without them.
In Model (5), we use a single Disparity Index that captures the extent of expropriation
incentives. The coefficient of the Disparity Index is negative and highly significant. Holding all
other control variables at their mean levels, if one increases the Disparity Index (i.e., family
control in excess of family contributions increases) from the 25th
percentile value to the 75th
percentile value, then the donation drops by 265,000 won. This is a drop of 37 percent from the
median donation.
26
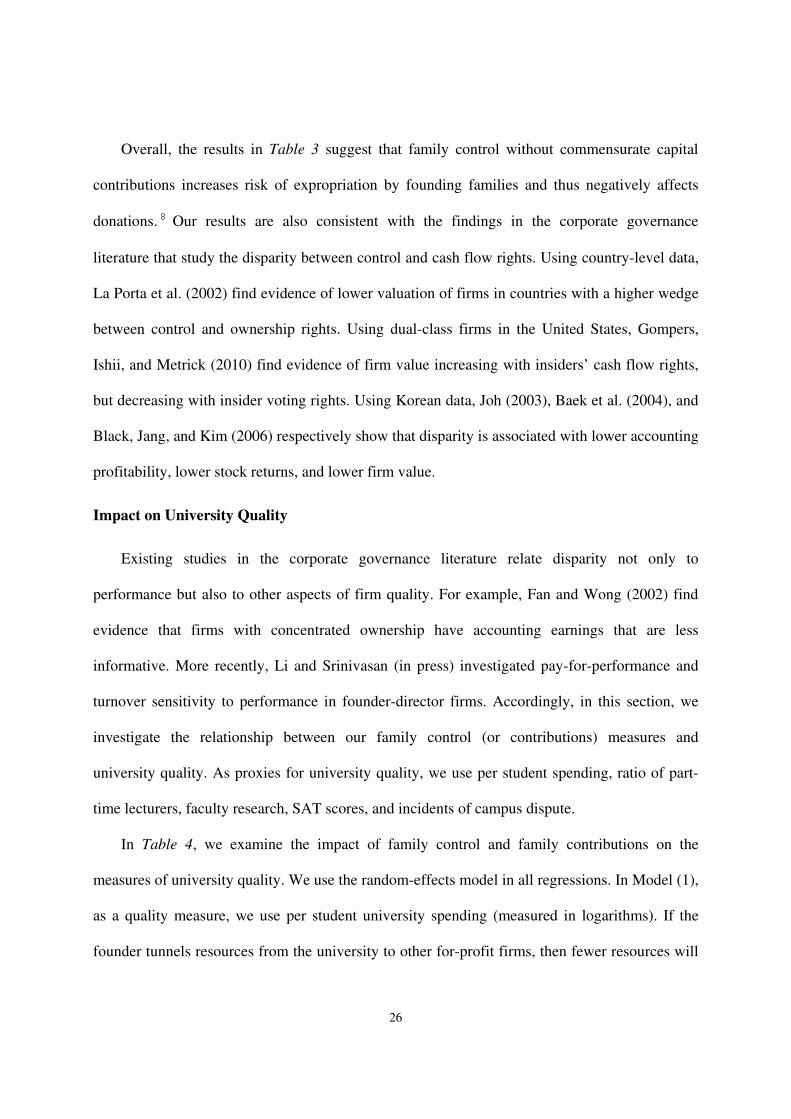
Overall, the results in Table 3 suggest that family control without commensurate capital
contributions increases risk of expropriation by founding families and thus negatively affects
donations. 8 Our results are also consistent with the findings in the corporate governance
literature that study the disparity between control and cash flow rights. Using country-level data,
La Porta et al. (2002) find evidence of lower valuation of firms in countries with a higher wedge
between control and ownership rights. Using dual-class firms in the United States, Gompers,
Ishii, and Metrick (2010) find evidence of firm value increasing with insiders’ cash flow rights,
but decreasing with insider voting rights. Using Korean data, Joh (2003), Baek et al. (2004), and
Black, Jang, and Kim (2006) respectively show that disparity is associated with lower accounting
profitability, lower stock returns, and lower firm value.
Impact on University Quality
Existing studies in the corporate governance literature relate disparity not only to
performance but also to other aspects of firm quality. For example, Fan and Wong (2002) find
evidence that firms with concentrated ownership have accounting earnings that are less
informative. More recently, Li and Srinivasan (in press) investigated pay-for-performance and
turnover sensitivity to performance in founder-director firms. Accordingly, in this section, we
investigate the relationship between our family control (or contributions) measures and
university quality. As proxies for university quality, we use per student spending, ratio of part-
time lecturers, faculty research, SAT scores, and incidents of campus dispute.
In Table 4, we examine the impact of family control and family contributions on the
measures of university quality. We use the random-effects model in all regressions. In Model (1),
as a quality measure, we use per student university spending (measured in logarithms). If the
founder tunnels resources from the university to other for-profit firms, then fewer resources will
27
be available to be spent on the university. The results show that a university with more relatives
in school management spends less per student. In contrast, universities that have more
foundation contributions spend more per student.
Insert Table 4 about here
In Model (2), we use the fraction of part-time lecturers as an alternative quality measure.
Our reasoning is that universities that suffer more from expropriation tend to hire less full-time
faculty and instead hire more part-time lecturers, who are less expensive and have little voice on
university matters. The estimation result indicates that universities with more foundation
contributions tend to have a lower fraction of part-time lecturers.
In Model (3), we use faculty research as the dependent variable. The results show that faculty
members of universities with more relatives in school management have less research output. In
Model (4), we replace faculty research with SAT scores. The results indicate that universities
with more relatives in school management attract fewer high-quality students.
In Model (5), we use a university quality composite index constructed from four of our
university quality measures (per student spending, part-time lecturers, faculty research, and SAT
scores). We first normalize each quality measure to range from 0 to 1. Then, we compute their
sum and multiply by 25, so that the index takes a value between 0 and 100. The regression result
shows that universities with more foundation contributions or those with less relatives in school
management have higher university quality.
In Model (6), we use campus dispute as the dependent variable. Since campus dispute is a
binary variable, we run a probit model. The results show that universities with fewer foundation
contributions tend to experience more campus disputes. We note that universities with a long
28
history tend to have a higher probability of dispute. This could be partly due to selection bias.
Since we rely on newspaper articles to identify universities with disputes, it is possible that the
measure is biased toward well-known universities with longer histories and traditions. Campus
disputes in relatively new and unknown universities are not likely to attract interest from the
general public, and thus are less likely to be covered by newspapers.
Robustness Checks
Table 5 presents the results of a number of robustness checks. In Models (1)–(3), we run year-
by-year OLS tests. We find that the coefficient estimates of the number of relatives and
foundation contributions are all significant and have the expected signs. The control variables are
mostly not significant, with the exception of the metropolitan dummy, which is positively related
to the log of donation.
Insert Table 5 about here
In Models (4) and (5), we partition the sample into non-religious and religious universities,
because the governance characteristics of the two groups of universities might be different. For
both religious and non-religious universities, we find that all variables related to family control
and family contributions are significant and have the expected signs.
Model (6) is the same as Model (4) in Table 5, except that we replace the metropolitan
dummy with the SAT score, which may better capture the reputation of universities in Korea.
Comparing the two models shows that the coefficient estimates of the main variables of interest
change very little.
29
As discussed previously, the family control variables are time-invariant, which is the reason
we use the random-effects model instead of the fixed-effects model. In an unreported test, we
estimated the fixed-effects model, in which we regressed the log of donation on foundation
contribution, history, SAT score, and the year dummies. The coefficient estimate on the
foundation contribution is 0.06 with a t-statistic of 1.98. Overall, the results indicate that the
impact of family control and family contributions on donation is robust to the choice of time
periods, estimation method, and subsamples.
We control for the size of university by scaling each control variable used in the regression
with the number of students enrolled. To see if university size per se has any additional
explanatory power, in an unreported regression we separately controlled for the number of
enrolled students (in natural logarithm) using Model (6) in Table 5. The coefficient estimate is
negative and significant with a t-stat of -3.80. The coefficient estimate and the t-stat of our
Disparity Index remain unchanged.
We also examine the effect of political links for the founding family and its effect on
donations (results not reported). Politically linked founding families may be in a position to use
political power to avoid compliance, prosecution, etc., so that the extent of expropriation is more
serious. We obtain information on political links from two sources. The first is the list of
individuals who contributed political donations to National Assemblymen during 2004–2010.
Unfortunately, this information is not available before 2004. The list is compiled by the National
Election Commission. From this list, we identify universities whose president or foundation
chairman made political donations. The second source comes from an article published by the
local newspaper Oh My News (June 14, 2011). The article lists all the National Assemblymen of
the Grand National Party—the current incumbent party—that have family ties with the founders
30
of school foundations. Using these two sources of information, we construct a dummy variable
that takes a value of one if the university president (or foundation chairman) contributed political
donations or its founding family members include a National Assemblyman. When we include
this dummy in Model (5) of Table 5, we find that the coefficient estimate is insignificant. This
result, however, should be interpreted with caution, as our variable for political ties is likely not
comprehensive.
Exploring the Direction of Causality
Thus far, we have assumed that our expropriation measure, the Disparity Index (family control in
excess of family contributions), is exogenously determined. A major challenge in studying the
relationship between this variable and donations is the possibility of reverse causality. It could be
that large donors attach strings to their donations and force the receiving university to be subject
to less family control and more family contributions, so that donation can cause a change in our
Disparity Index. For example, a large donation could impose a condition that requires the school
foundation to contribute a matching fund to the university.
A standard way to address the issue of reverse causality is to find an instrumental variable
for the Disparity Index and run a two-stage least squares (2SLS) test. However, we do not follow
this route, because we were not able to find a good instrumental variable with high correlation
with the Disparity Index but not the donation. Instead, we show that donations do not cause
change in the Disparity Index and take this as indirect evidence that the Disparity Index does
cause change in donation.
We use the metropolitan dummy as an instrumental variable for donations and the Disparity
Index and run 2SLS tests. In the first stage, we regress donation on the metropolitan, history,
31
religion, and year dummies. In the second stage, we use the fitted values of donation obtained
from the first stage as a variable to explain the Disparity Index, along with other control
variables. If the coefficient of the fitted donation values is statistically insignificant, it shows that
an exogenously determined donation does not cause change in the Disparity Index. We take this
result as evidence against reverse causality.
The metropolitan dummy satisfies all the conditions of a good instrumental variable. First, it
is exogenous. It is hard to imagine that a university would change its location because of
donations. Second, the metropolitan dummy is highly correlated with annual donations. The
correlation between the two variables is 0.27 and significant at the 1 percent level. Third, it is not
correlated with the Disparity Index. The correlation between the two is 0.04 with a p-value of
0.56.
Table 6 shows the 2SLS results. In Model (1), we run the first-stage regression, regressing
the log of donation on the metropolitan dummy and other control variables. The coefficient
estimate on the metropolitan dummy is highly significant.
Insert Table 6 about here
In Model (2), we run the second-stage regression of the Disparity Index on the fitted values of
log of donations from Model (1) with the history, religion, and year dummies as controls. The
coefficient estimate on the fitted values of the log of donations is insignificant (a t-value of -
1.41), which suggests that exogenously determined donations do not cause the change in the
Disparity Index.
While not reported, we also conducted similar tests for the university quality variables to see
whether university quality causes change in the Disparity Index. On a priori grounds, it is
32
difficult to see why university quality affects the Disparity Index. For instance, why would a
university with strong faculty research or high SAT scores discourage family control by
founding families but encourage more family contributions? Consistent with the prediction, we
found that per student spending, the ratio of part-time lecturers to full-time faculty, faculty
research, and SAT scores do not cause change in the Disparity Index.
In sum, while we cannot completely dismiss the possibility of reverse causality, we conclude
that the correlation between expropriation risk and donations (and university quality) exists, not
because the latter causes the former, but because the former affects the latter.
CONCLUSION
In this paper, we examine the agency problems of Korean private universities. In many Korean
private universities, founding families have almost total discretionary power over management,
while they often do not make commensurate monetary contributions to the universities.
Furthermore, there are few mechanisms for monitoring their misbehavior. We argue that such a
structure creates strong incentives for founding families to expropriate university resources for
their own benefit, at the expense of students, faculty, and other stakeholders of the university.
The empirical results and anecdotal evidence appear consistent with the following scenario.
Universities controlled by founding families who have control power in excess of their initial
donation level are associated with high expropriation risk, and a higher probability of
expropriation discourages donations. Good researchers stay away from these universities, leading
to poor faculty research. As a result of expropriation, per student spending is low and more part-
time lecturers are hired, leading to poor educational services. In the most extreme circumstances,
campus disputes take place.
33
Our study, however, is limited in a number of ways. First, our sample covers only three
years, and some of our key variables are time-invariant, making it impossible to run university
fixed-effects regressions. Second, we do not have information on which for-profit firms the
founding families have equity stakes in. With such information, one could construct an
expropriation measure much more refined than the one used in this paper. Third, our study is a
single-country study that can be influenced by country specifics. Future research could benefit
from a multi-country study.
Despite its limitations, our study contributes to the existing literature by investigating a
topic missing from the literature. While the existing literature on not-for-profit organizations
focuses on the conflict between professional managers and other stakeholders, we study the
conflict between a controlling family and other stakeholders.
Given the prevalence of family control over for-profit firms in emerging economies, we
suspect that the relevance of our results is not limited to Korea, and that other emerging
economies are likely to suffer from similar agency problems in school governance. It would be
interesting to document the extent of agency problems in not-for-profit organizations from other
emerging economies. More importantly, our study provides important implications to
policymakers who regulate private universities in emerging economies.
ENDNOTES
1 According to the rankings in IMD’s World Competitiveness Yearbook (2003), Korea ranks low in many
areas related to the quality of legal institutions: justice (45th
), ethical practices (53rd
), manager’s credibility
(52nd
), corporate boards (58th
), and shareholder value (54th
). This low ranking is in stark contrast to
Korea’s rankings in economic performance: GDP (11th), real GDP growth (4th), and unemployment rate
(7th).
34
2 In a related paper, Anderson, Mansi, and Reeb (2003) show that family ownership is related to a lower
cost of debt financing. Anderson and Reeb (2003b) find that family firms experience less diversification
than non-family firms. Anderson, Reeb, and Zhao (in press), however, reported that family firms
experience a substantially higher volume of abnormal sales prior to negative earnings shocks than non-
family firms, suggesting extensive informed trading.
3 Using U.S. data, Villalonga and Amit (2010) show that the founders and their families are more likely to
retain control when doing so gives the firm a competitive advantage, thereby benefiting all shareholders.
4 Using data from Denmark, Bennedsen, Nielsen, Pérez-González, and Wolfenzon (2007) findd that
family successions have a large negative causal impact on firm performance. They used the gender of a
departing CEO’s firstborn child as instrumental variable for family succession.
5 Using data from seven East Asian economies, Fan and Wong (2002) find evidence that firms with
concentrated ownership have accounting earnings that are less informative. Shyu and Lee (2009) studied
the link between control-ownership disparity and debt maturity using Taiwanese family firms. On the
other hand, Chen and Nowland (2010) show that the higher levels of monitoring are not always in the best
interests of minority shareholders in family-owned companies.
6 Numerous studies have documented the evidence that the disparity between control and cash flow rights
by controlling families is associated with greater expropriation risk and thus poor firm performance
(Atanasov, 2005; Bae, Kang, and Kim, 2002; Bae et al., 2012; Baek, Kang, and Lee, 2006; Baek, Kang,
and Park, 2004; Bertrand, Mehta, and Mullainathan, 2002; Cheung, Rau, and Stouraitis, 2004; Claessens,
Djankov, and Lang, 2000; Claessens et al., 2002; Joh, 2003; La Porta et al., 2002; Lemmon and Lins,
2003, Mitton, 2002).
7 We thank National Assemblyman Hoon Seol for providing this statistic.
8 One way to measure the incentive for controlling families to expropriate university resources is to
examine whether the controlling family has equity stakes in for-profit businesses. Unfortunately, this
information is not available for most universities. Instead, we generate a dummy that takes the value of
one if the foundation operates a hospital and zero otherwise. For many Korean private universities,
hospital operation is the largest source of revenues. When we include this dummy in regression (5) of
Table 3, the coefficient estimate of the hospital dummy is positive and significant. The magnitude and
significance of the Disparity Index remain intact.
35
REFERENCES
Aghion, P., Dewatripont, M., Hoxby, C., Mas-Colell, A., & Sapir, A. 2010. The governance and
performance of universities: Evidence from Europe and the US, Economic Policy, January:
7–59.
Altbach, P. 2005. Universities: Family style, International Higher Education, 39: 10–12.
Anderson, R. C., & Reeb, D. M. 2003a. Founding-family ownership and firm performance:
Evidence from the S&P 500, The Journal of Finance, 58: 1301–1327.
Anderson, R. C., & Reeb, D. M. 2003b. Founding-family ownership, corporate diversification,
and firm leverage, Journal of Law and Economics, 46: 653–684.
Anderson, R. C., Duru, A., & Reeb, D. M. 2009. Founders, heirs, and corporate opacity in the
United States, Journal of Financial Economics, 92: 205–222.
Anderson, R. C., Mansi, S. A., & Reeb, D. M. 2003. Founding family ownership and the agency
cost of debt, Journal of Financial Economics, 68: 263–285.
Anderson, R. C., Reeb, D. M., & Zhao, W. in press. Family controlled firms and informed
trading: Evidence from short sales, The Journal of Finance, forthcoming.
Andres, C. 2008. Large shareholders and firm performance—An empirical examination of
founding-family ownership, Journal of Corporate Finance, 14: 431–445.
Atanasov, V. 2005. How much value can blockholders tunnel? Evidence from the Bulgarian
mass privatization auctions, Journal of Financial Economics, 76: 191–234.
Bae, K. H., Kang, J. K., & Kim, J. M. 2002. Tunneling or value added: Evidence from mergers
by Korean business groups, The Journal of Finance, 57: 2695–2740.
36
Bae, K. H., Baek, J. S., Kang, J. K., & Liu, W.-L. 2012. Do controlling shareholders’
expropriation incentives imply a link between corporate governance and firm value? Theory
and evidence, Journal of Financial Economics, forthcoming.
Baek, J. S., Kang, J. K., & Lee, I. M. 2006. Business groups and tunneling: Evidence from
private securities offerings by Korean chaebols, The Journal of Finance, 61: 2415–2449.
Baek, J. S., Kang, J. K., & Park, K. S. 2004. Corporate governance and firm value: Evidence
from the Korean financial crisis, Journal of Financial Economics, 71: 265–313.
Ballou, J., & Weisbrod, B. 2003. Managerial rewards and the behavior of for-profit,
governmental, and non-profit organizations: Evidence from the hospital industry, Journal of
Public Economics, 87: 1895–1920
Bennedsen, M., Pérez-González F., & Wolfenzon, D. 2010. The governance of family firms, in:
H. K. Baker & R. C. Anderson (Eds.), Corporate governance: 371-390. Hoboken, NJ: John
Wiley & Sons, Inc.
Bennedsen, M., Nielsen K. M., Pérez-González F., & Wolfenzon, D. 2007. Inside the family
firm: The role of families in succession decisions and performance, Quarterly Journal of
Economics, 122: 647–691
Bertrand, M., Mehta, P., & Mullainathan, S. 2002. Ferreting out tunneling: An application to
Indian business groups, Quarterly Journal of Economics, 117: 121–148.
Bertrand, M., Johnson, S., Samphantharak, K., & Schoar, A. Mixing family with business: A
study of Thai business groups and the families behind them, Journal of Financial
Economics, 88: 466–498.
37
Black, B. S., Jang, H., & Kim, W. 2006. Does corporate governance predict firms’ market
values? Evidence from Korea, Journal of Law, Economics, and Organization, 22: 366–
413.
Brown, W. 2001. Faculty participation in university governance and the effects on university
performance, Journal of Economic Behavior & Organization, 44: 129–143.
Brickley, J., & Van Horn, L. 2002. Managerial incentives in non-profit organizations: Evidence
from hospitals, Journal of Law and Economics, 45: 227–249.
Burkart, M., Panunzi, F., & Shleifer A. 2003. Family firms, The Journal of Finance, 58: 2167–
2202
Cheung, S. Y., Rau, P. R., & Stouraitis, A. 2006. Tunneling, propping and expropriation:
Evidence from connected party transactions in Hong Kong, Journal of Financial
Economics, 82: 343–386.
Claessens, S., Djankov, S., & Lang, L. H. 2000. The separation of ownership and control in East
Asian corporations, Journal of Financial Economics, 58: 81–112.
Claessens, S., Djankov, S., Fan J. P., & Lang, L. H. 2002. Disentangling the incentive and
entrenchment effects of large shareholders, The Journal of Finance, 62: 2741–2771.
Chen, E.-T., & Nowland, J. 2010. Optimal board monitoring in family-owned companies:
Evidence from Asia, Corporate Governance: An International Review, 18: 3–17.
Cheslock, J. J., & Gianneschi, M. 2008. Replacing state appropriations with alternative revenue
sources: The case of voluntary support, Journal of Higher Education, 79: 208-229.
Clotfelter, C. T. 2003. Alumni giving to elite private colleges and universities, Economics of
Education Review, 22: 109–120.
38
Core, J., Guay, W., & Verdi, R. 2006. Agency problems of excess endowment holdings in not-
for-profit firms, Journal of Accounting and Economics, 41: 307–333.
Cornell, B. 2004. Compensation and recruiting: Private universities versus private corporations,
Journal of Corporate Finance, 10: 37–52.
Fama, E., & Jensen, M. 1983. Agency problems and residual claims, Journal of Law and
Economics, 26(2): 327–349.
Fan, J., & Wong, T. 2002. Corporate ownership structure and the informativeness of accounting
earnings in East Asia, Journal of Accounting and Economics, 33: 401–425.
Fisman, R., & Hubbard, G. 2005. Precautionary savings and the governance of non-profit
organizations, Journal of Public Economics, 89: 2231–2243.
Gompers, P., Ishii, J., & Metrick, A. 2010. Extreme governance: An analysis of dual-class firms
in the United States, Review of Financial Studies, 23: 1051–1088.
Graham, H. D., & Diamond, N. 1996. The rise of American research universities: Elites and
challengers in the postwar era. Baltimore: Johns Hopkins University Press.
Grimes, P. W., & Chressanthis, G. A. 1994. Alumni contributions to academics—The role of
intercollegiate sports and NCAA sanctions, American Journal of Economics and
Sociology, 53: 27–40.
Harrison, W. B., Mitchell, S. K., & Peterson, S. P. 1995. Alumni donations and colleges’
development expenditures—Does spending matter?, American Journal of Economics and
Sociology, 54: 397–412.
Holmes, J. 2009. Prestige, charitable deductions and other determinants of alumni giving:
Evidence from a highly selective liberal arts college, Economics of Education Review, 28:
18–28.
39
Joh, S. W. 2003. Corporate governance and firm profitability: Evidence from Korea before the
economic crisis, Journal of Financial Economics, 68: 287–322.
Johnson, S., & Mitton, T. 2003. Cronyism and capital controls: Evidence from Malaysia,
Journal of Financial Economics, 67: 351–382.
Johnson, S., La Porta, R., Lopez-De-Silanes, F., & Shleifer, A. 2000. Tunneling. American
Economic Review, 90: 22–27.
Khanna, T., & Yafeh, Y. 2007. Business groups in emerging markets: Paragons or parasites?
Journal of Economic Literature, 45: 331–372.
La Porta, R., Lopez-De-Silanes, F., & Shleifer, A. 1999. Corporate ownership around the world,
The Journal of Finance, 54: 471–517.
La Porta, R., Lopez-De-Silanes, F., & Shleifer, A. 2002. Investor protection and corporate
valuation, The Journal of Finance, 57: 1147–1170.
Lee, J. H., Park, J. S., & Kim, S. B. 2004. Governance of private universities, in: Park, S and
Lee, J.H. (Eds.), Autonomy and accountability of university reform: The second phase,
Seoul: KDI and KRIVET Press.
Lemmon, M., & Lins, K. V. 2003. Ownership structure, corporate governance, and firm value:
Evidence from the East Asian financial crisis, The Journal of Finance, 63: 1445–68.
Li, F. & Srinivasa, S. in press. Corporate governance when founders are directors, Journal of
Financial Economics, forthcoming.
Maury, B. 2006. Family ownership and firm performance: Empirical evidence from Western
European corporations, Journal of Corporate Finance, 12: 321–341.
McCormick, R., & Meiners, R. 1988. University governance: A property rights perspective,
Journal of Law and Economics, 31(2): 423–442.
40
Meer, J., & Rosen, H. S. 2010. Family bonding with universities, Research in Higher
Education, 51: 641–658.
Mitton, T. 2002. A cross-firm analysis of the impact of corporate governance on the East Asian
financial crisis, Journal of Financial Economics, 64: 215–41.
Morck, R., Wolfenzon, D., & Yeung, B. 2005. Corporate governance, economic entrenchment,
and growth, Journal of Economic Literature, 43: 655–720.
Morck, R., Yavuz, M. D., & Yeung, B. 2011. Banking system control, capital allocation, and
economy performance, Journal of Financial Economics, 100: 264–283.
Okunade, A. A., Wunnava, P. V., & Walsh, R. 1994. Charitable giving of alumni—Micro-data
evidence from a large public university, American Journal of Economics and Sociology,
53: 73–84.
Payne, A. A. 2001. Measuring the effect of federal research funding on private donations at
research universities: Is federal research funding more than a substitute for private
donations?, International Tax and Public Finance, 8: 731–751.
Pérez-González, F. 2006. Inherited control and firm performance, American Economic Review,
96: 1559–1588.
Roomkin, M., & Weisbrod, B. 1999. Managerial compensation and incentives in for-profit and
non-profit hospitals, Journal of Law, Economics, & Organization, 15: 750–781.
Shanghai Jiao Tong University. 2008. Academic ranking of world universities, 2006 edition.
Shanghai: Institute of Higher Education, Shanghai Jiao Tong University.
Shyu, Y.-W., & Lee, C. I. 2009. Excess control rights and debt maturity structure in family-
controlled firms, Corporate Governance: An International Review, 17: 611–628.
41
Villalonga, B., & Amit, R. 2006. How do family ownership, control, and management affect firm
value?, Journal of Financial Economics, 80: 385–417.
Villalonga, B., & Amit, R. 2010. Family control of firms and industries, Financial
Management, 39: 863–904.
Volkwein, J. F., & Malik, S. M. 1997. State regulation and administrative flexibility at public
universities, Research in Higher Education, 38: 17–42.
Willemain, T. R., Goyal, A., & Vandeven, M. 1994. Alumni giving—The influences of reunion,
class, and year, Research in Higher Education, 35: 609–629.
Wong, Y.-J., Chang, S. C., & Chen, L.-Y. 2010. Does a family-controlled firm perform better in
corporate venturing?, Corporate Governance: An International Review, 18: 175–192.
Wunnava, P. V., & Lauze, M. A. 2001. Alumni giving at a small liberal arts college: Evidence
from consistent and occasional donors, Economics of Education Review, 20: 533–543.

42
TABLE 1
Description of Variables
Variable
Definition
Donation and university quality variables Donation Annual donation per student (in thousand won). Donation does not include foundation
contributions. We obtain this information from the Korea Foundation for the Promotion of Private Schools, a non-profit organization, the business of which is to provide loans to private universities.
Per Student Spending
Annual university expenditure per student (in thousand won). We obtain this information from the Korea Foundation for the Promotion of Private Schools.
Part-Time Lecturers Ratio of part-time lecturers to full-time faculty members. We obtain this information from the Ministry of Education.
Faculty Research Yearly number of articles published per full-time faculty member in the journals listed in the National Citation Report. We obtain this information from the Ministry of Science and Technology.
SAT Average test score of admitted students on a government-administered college entrance examination. We obtain this information from Jinhaksa, a private company that produces publications on college entrance examinations.
Quality Index University quality index based on per student spending, part-time lecturers, faculty research, and SAT. Quality Index = [(ln(per student expense)/11.12) + (full-time faculty/8.26) + (faculty research/1.09) + (SAT/98.01)] × 25. Full-time faculty is the ratio of full-time faculty members to part-time lecturers. ln(per student expense), full-time faculty, faculty research, and SAT are scaled by their respective maximum values. We multiply by 25 so that the index takes a value between 0 and 100. A higher index value indicates higher university quality.
Campus Dispute A dummy variable equal to one if the university experiences a dispute between the founding family and other stakeholders during the sample period, and zero otherwise. We obtain this information from the Korean Integrated News Database System (KINDS).
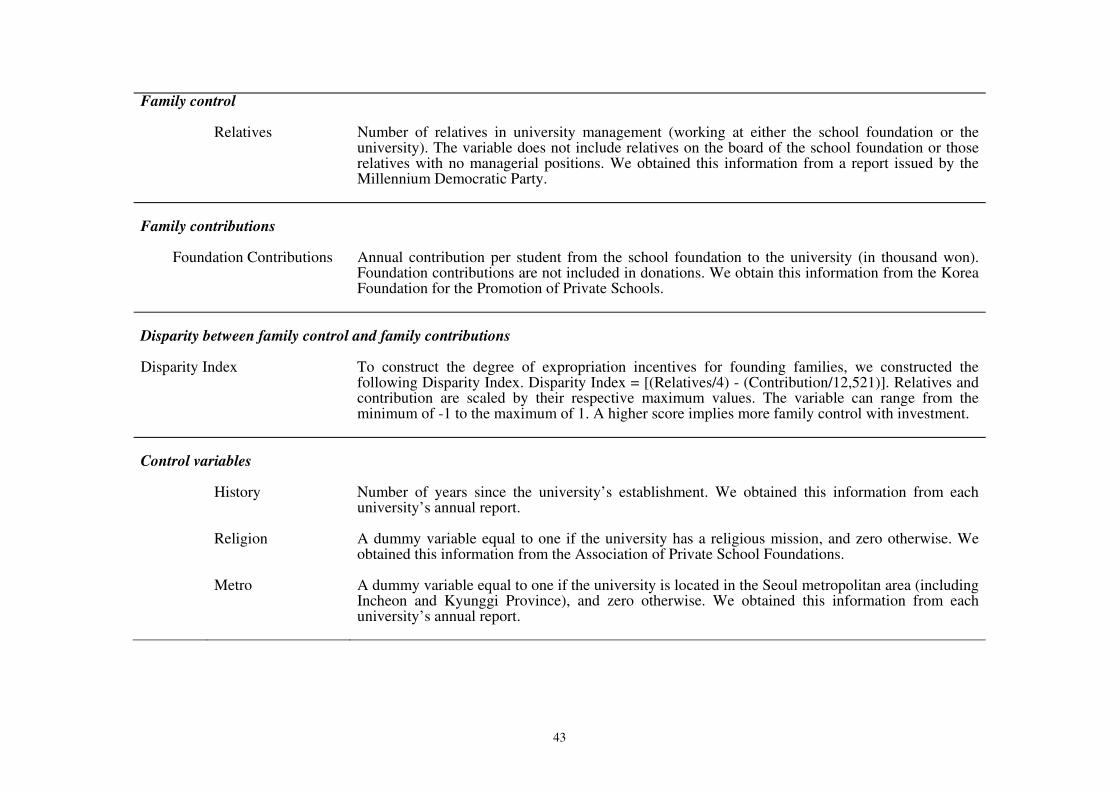
43
Family control Relatives Number of relatives in university management (working at either the school foundation or the
university). The variable does not include relatives on the board of the school foundation or those relatives with no managerial positions. We obtained this information from a report issued by the Millennium Democratic Party.
Family contributions Foundation Contributions Annual contribution per student from the school foundation to the university (in thousand won).
Foundation contributions are not included in donations. We obtain this information from the Korea Foundation for the Promotion of Private Schools.
Disparity between family control and family contributions Disparity Index To construct the degree of expropriation incentives for founding families, we constructed the
following Disparity Index. Disparity Index = [(Relatives/4) - (Contribution/12,521)]. Relatives and contribution are scaled by their respective maximum values. The variable can range from the minimum of -1 to the maximum of 1. A higher score implies more family control with investment.
Control variables History Number of years since the university’s establishment. We obtained this information from each
university’s annual report.
Religion A dummy variable equal to one if the university has a religious mission, and zero otherwise. We obtained this information from the Association of Private School Foundations.
Metro A dummy variable equal to one if the university is located in the Seoul metropolitan area (including Incheon and Kyunggi Province), and zero otherwise. We obtained this information from each university’s annual report.

44
TABLE 2
Summary Statistics and Correlations
Panel A: Summary statistics
Variable No. of Obs.
Mean Std. Dev.
Minimum25
th
percentileMedian
75th
percentileMaximum
Donation
Donation (in thousand won) 259 1,221 1,429 70 374 713 1,267 8,403
University quality variables Per Student Spending (in thousand won)
259 6,742 4,721 2,833 4,764 5,674 7,381 67,588
Part-Time Lecturers 177 0.97 0.42 0.12 0.68 0.91 1.25 2.28
Faculty Research 253 0.22 0.25 0.00 0.06 0.15 0.26 1.09
SAT (0–100) 259 65.60 19.56 18.14 50.04 66.12 82.03 98.01
Quality Index 177 45.72 10.86 29.38 38.88 42.46 50.15 78.76
Campus Dispute (0 or 1) 259 0.29 0.46 0.00 0.00 0.00 1.00 1.00
Family control variables
Relatives 259 0.77 1.03 0.00 0.00 0.00 1.00 4.00
Family contributions Foundation Contribution (in thousand won)
259 754 1,438 0 54 211 647 12,521
Disparity Index 259 0.32 0.25 -0.57 0.14 0.35 0.50 0.85
Control variables
History (in years) 259 34.46 16.90 10.00 16.00 35.00 51.00 60.00
Religion (0 or 1) 259 0.32 0.46 0.00 0.00 0.00 1.00 1.00
Metro (0 or 1) 259 0.52 0.50 0.00 0.00 1.00 1.00 1.00
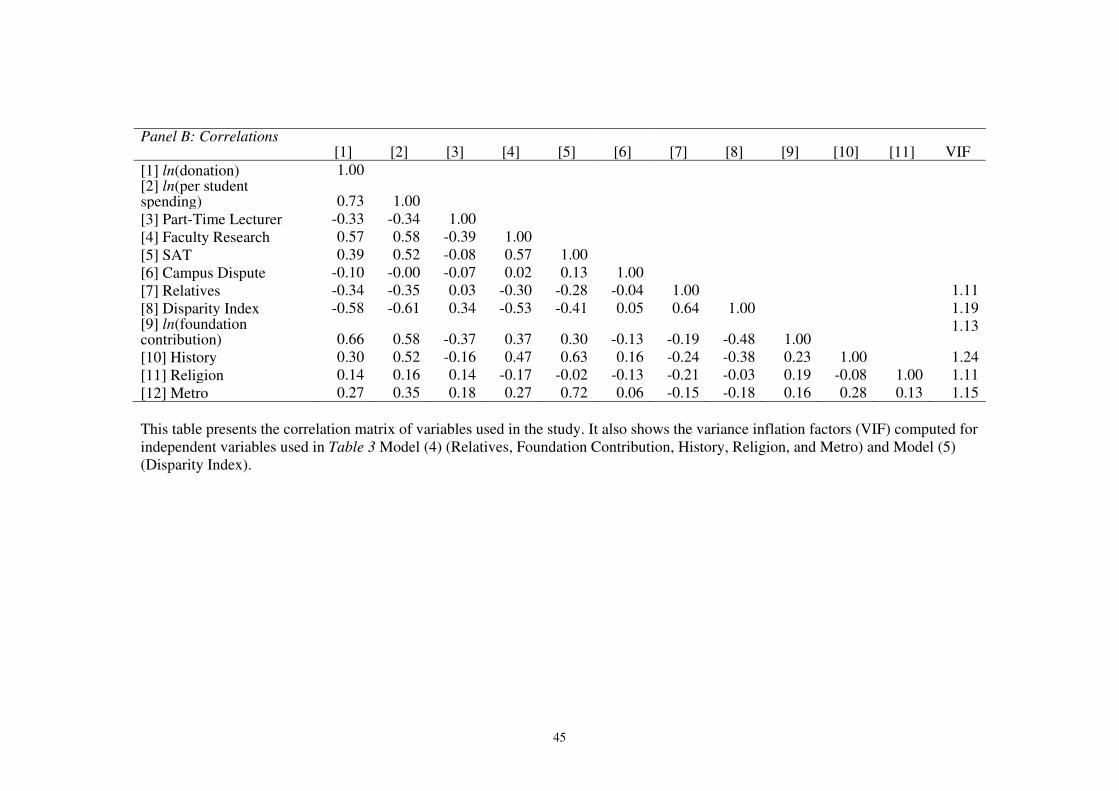
45
Panel B: Correlations [1] [2] [3] [4] [5] [6] [7] [8] [9] [10] [11] VIF
[1] ln(donation) 1.00 [2] ln(per student spending) 0.73 1.00
[3] Part-Time Lecturer -0.33 -0.34 1.00
[4] Faculty Research 0.57 0.58 -0.39 1.00
[5] SAT 0.39 0.52 -0.08 0.57 1.00
[6] Campus Dispute -0.10 -0.00 -0.07 0.02 0.13 1.00
[7] Relatives -0.34 -0.35 0.03 -0.30 -0.28 -0.04 1.00 1.11
[8] Disparity Index -0.58 -0.61 0.34 -0.53 -0.41 0.05 0.64 1.00 1.19[9] ln(foundation contribution) 0.66 0.58 -0.37 0.37 0.30 -0.13 -0.19 -0.48 1.00
1.13
[10] History 0.30 0.52 -0.16 0.47 0.63 0.16 -0.24 -0.38 0.23 1.00 1.24
[11] Religion 0.14 0.16 0.14 -0.17 -0.02 -0.13 -0.21 -0.03 0.19 -0.08 1.00 1.11
[12] Metro 0.27 0.35 0.18 0.27 0.72 0.06 -0.15 -0.18 0.16 0.28 0.13 1.15
This table presents the correlation matrix of variables used in the study. It also shows the variance inflation factors (VIF) computed for
independent variables used in Table 3 Model (4) (Relatives, Foundation Contribution, History, Religion, and Metro) and Model (5)
(Disparity Index).
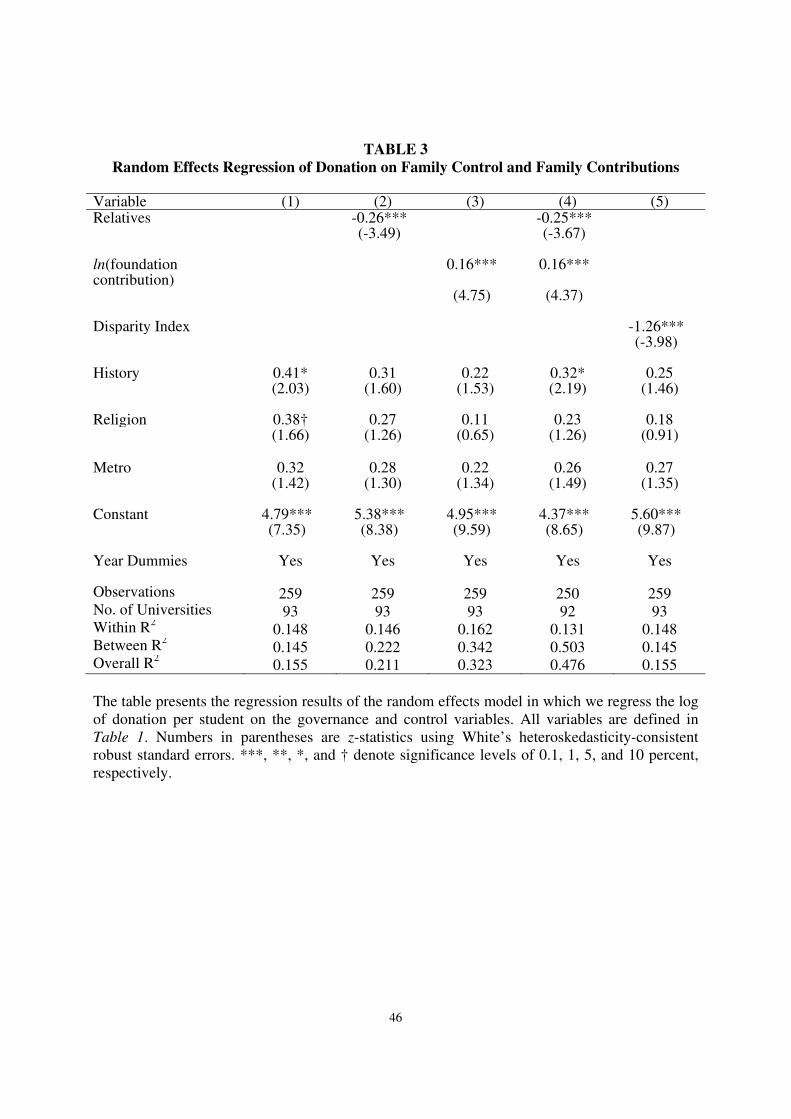
46
TABLE 3
Random Effects Regression of Donation on Family Control and Family Contributions
Variable (1) (2) (3) (4) (5)Relatives -0.26*** -0.25***
(-3.49) (-3.67)
ln(foundation contribution)
0.16*** 0.16***
(4.75) (4.37)
Disparity Index -1.26***
(-3.98)
History 0.41* 0.31 0.22 0.32* 0.25
(2.03) (1.60) (1.53) (2.19) (1.46)
Religion 0.38† 0.27 0.11 0.23 0.18
(1.66) (1.26) (0.65) (1.26) (0.91)
Metro 0.32 0.28 0.22 0.26 0.27
(1.42) (1.30) (1.34) (1.49) (1.35)
Constant 4.79*** 5.38*** 4.95*** 4.37*** 5.60***
(7.35) (8.38) (9.59) (8.65) (9.87)
Year Dummies
Yes Yes Yes Yes Yes
Observations 259 259 259 250 259 No. of Universities 93 93 93 92 93 Within R
2 0.148 0.146 0.162 0.131 0.148
Between R2
0.145 0.222 0.342 0.503 0.145 Overall R
2 0.155 0.211 0.323 0.476 0.155
The table presents the regression results of the random effects model in which we regress the log
of donation per student on the governance and control variables. All variables are defined in
Table 1. Numbers in parentheses are z-statistics using White’s heteroskedasticity-consistent
robust standard errors. ***, **, *, and † denote significance levels of 0.1, 1, 5, and 10 percent,
respectively.
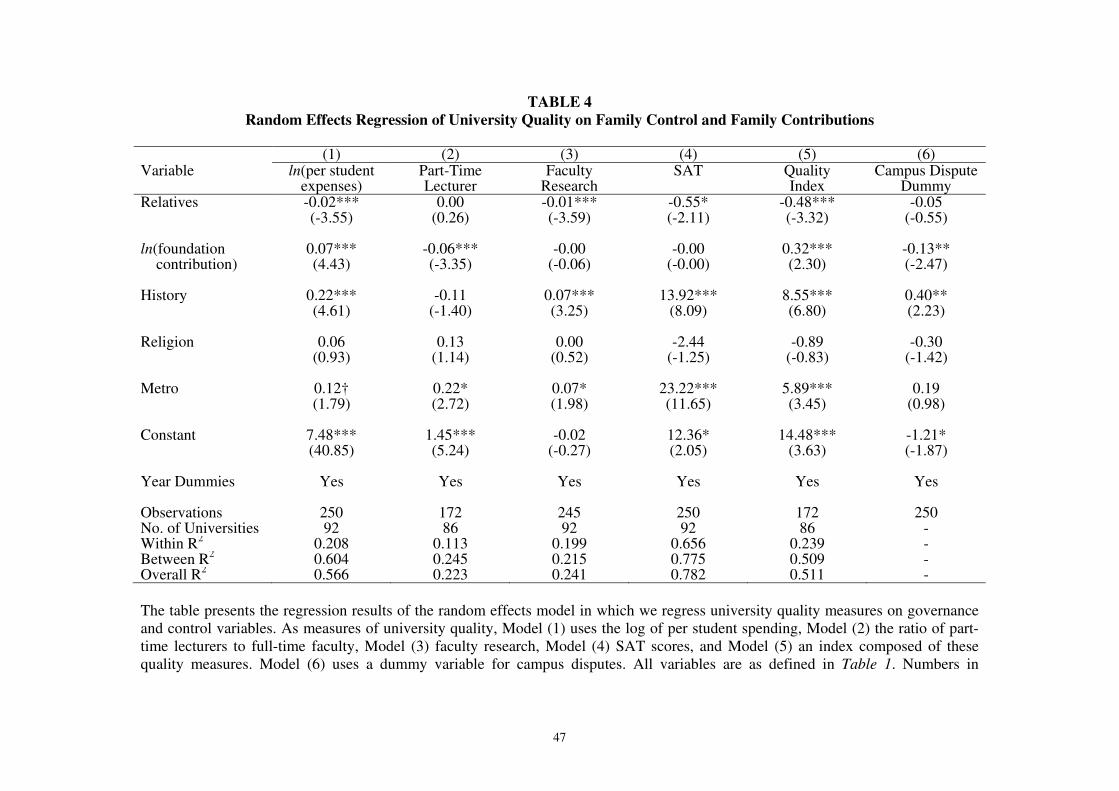
47
TABLE 4
Random Effects Regression of University Quality on Family Control and Family Contributions
(1) (2) (3) (4) (5) (6)Variable ln(per student
expenses)Part-Time Lecturer
Faculty Research
SAT QualityIndex
Campus DisputeDummy
Relatives -0.02*** 0.00 -0.01*** -0.55* -0.48*** -0.05
(-3.55) (0.26) (-3.59) (-2.11) (-3.32) (-0.55)
ln(foundation 0.07*** -0.06*** -0.00 -0.00 0.32*** -0.13** contribution)
(4.43) (-3.35) (-0.06) (-0.00) (2.30) (-2.47)
History 0.22*** -0.11 0.07*** 13.92*** 8.55*** 0.40**
(4.61) (-1.40) (3.25) (8.09) (6.80) (2.23)
Religion 0.06 0.13 0.00 -2.44 -0.89 -0.30
(0.93) (1.14) (0.52) (-1.25) (-0.83) (-1.42)
Metro 0.12† 0.22* 0.07* 23.22*** 5.89*** 0.19
(1.79) (2.72) (1.98) (11.65) (3.45) (0.98)
Constant 7.48*** 1.45*** -0.02 12.36* 14.48*** -1.21*
(40.85) (5.24) (-0.27) (2.05) (3.63) (-1.87)
Year Dummies
Yes Yes Yes Yes Yes Yes
Observations 250 172 245 250 172 250No. of Universities 92 86 92 92 86 -Within R
20.208 0.113 0.199 0.656 0.239 -
Between R2
0.604 0.245 0.215 0.775 0.509 -Overall R
20.566 0.223 0.241 0.782 0.511 -
The table presents the regression results of the random effects model in which we regress university quality measures on governance
and control variables. As measures of university quality, Model (1) uses the log of per student spending, Model (2) the ratio of part-
time lecturers to full-time faculty, Model (3) faculty research, Model (4) SAT scores, and Model (5) an index composed of these
quality measures. Model (6) uses a dummy variable for campus disputes. All variables are as defined in Table 1. Numbers in
48
parentheses are z-statistics using White’s heteroskedasticity-consistent robust standard errors. ***, **, *, and † denote significance
levels of 0.1, 1, 5, and 10 percent, respectively.
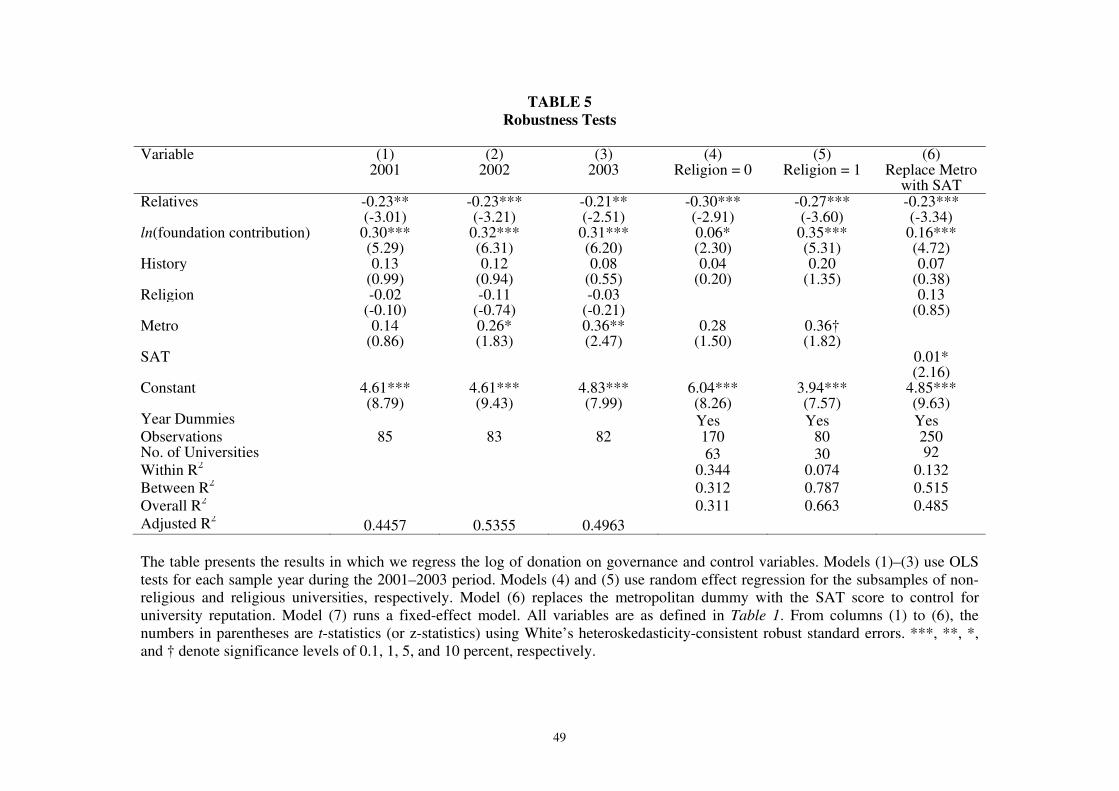
49
TABLE 5
Robustness Tests
Variable (1)
2001 (2)
2002 (3)
2003 (4)
Religion = 0 (5)
Religion = 1 (6)
Replace Metro with SAT
Relatives -0.23** -0.23*** -0.21** -0.30*** -0.27*** -0.23*** (-3.01) (-3.21) (-2.51) (-2.91) (-3.60) (-3.34)ln(foundation contribution) 0.30*** 0.32*** 0.31*** 0.06* 0.35*** 0.16*** (5.29) (6.31) (6.20) (2.30) (5.31) (4.72)History 0.13 0.12 0.08 0.04 0.20 0.07 (0.99) (0.94) (0.55) (0.20) (1.35) (0.38)Religion -0.02 -0.11 -0.03 0.13 (-0.10) (-0.74) (-0.21) (0.85)Metro 0.14 0.26* 0.36** 0.28 0.36† (0.86) (1.83) (2.47) (1.50) (1.82)SAT 0.01* (2.16)Constant 4.61*** 4.61*** 4.83*** 6.04*** 3.94*** 4.85*** (8.79) (9.43) (7.99) (8.26) (7.57) (9.63)Year Dummies Yes Yes Yes Observations 85 83 82 170 80 250No. of Universities 63 30 92
Within R2
0.344 0.074 0.132
Between R2
0.312 0.787 0.515
Overall R2
0.311 0.663 0.485
Adjusted R2
0.4457 0.5355 0.4963
The table presents the results in which we regress the log of donation on governance and control variables. Models (1)–(3) use OLS
tests for each sample year during the 2001–2003 period. Models (4) and (5) use random effect regression for the subsamples of non-
religious and religious universities, respectively. Model (6) replaces the metropolitan dummy with the SAT score to control for
university reputation. Model (7) runs a fixed-effect model. All variables are as defined in Table 1. From columns (1) to (6), the
numbers in parentheses are t-statistics (or z-statistics) using White’s heteroskedasticity-consistent robust standard errors. ***, **, *,
and † denote significance levels of 0.1, 1, 5, and 10 percent, respectively.

50
TABLE 6
Test of Reverse Causality
(1) (2) 1
stStage 2
nd Stage
ln(donation) Disparity Index ln(donation) -0.11 (-1.14) History 0.44*** -0.09 (4.37) (-1.53) Religion 0.29* -0.15*** (2.26) (3.56) Metro 0.34** (3.03) Year Dummies Yes Yes Observations 259 259 Adjusted R
2 0.141 -
This table presents the test results of reverse causality. We estimate the first-stage regression of
2SLS, regressing the log of donation on the metropolitan dummy (the instrumental variable),
control variables, and year dummies, which are exogenously determined. The metropolitan
dummy takes the value of one if the university is located in the metropolitan area, and zero
otherwise. In the second-stage regression of 2SLS, we regress the Disparity Index on the fitted
values of donation, exogenously determined by the metropolitan dummy, control variables, and
year dummies. All variables are as defined in Table 1. Numbers in parentheses are t- or z-
statistics using White’s heteroskedasticity-consistent robust standard errors. ***, **, *, and †
denote significance levels of 0.1, 1, 5, and 10 percent, respectively.
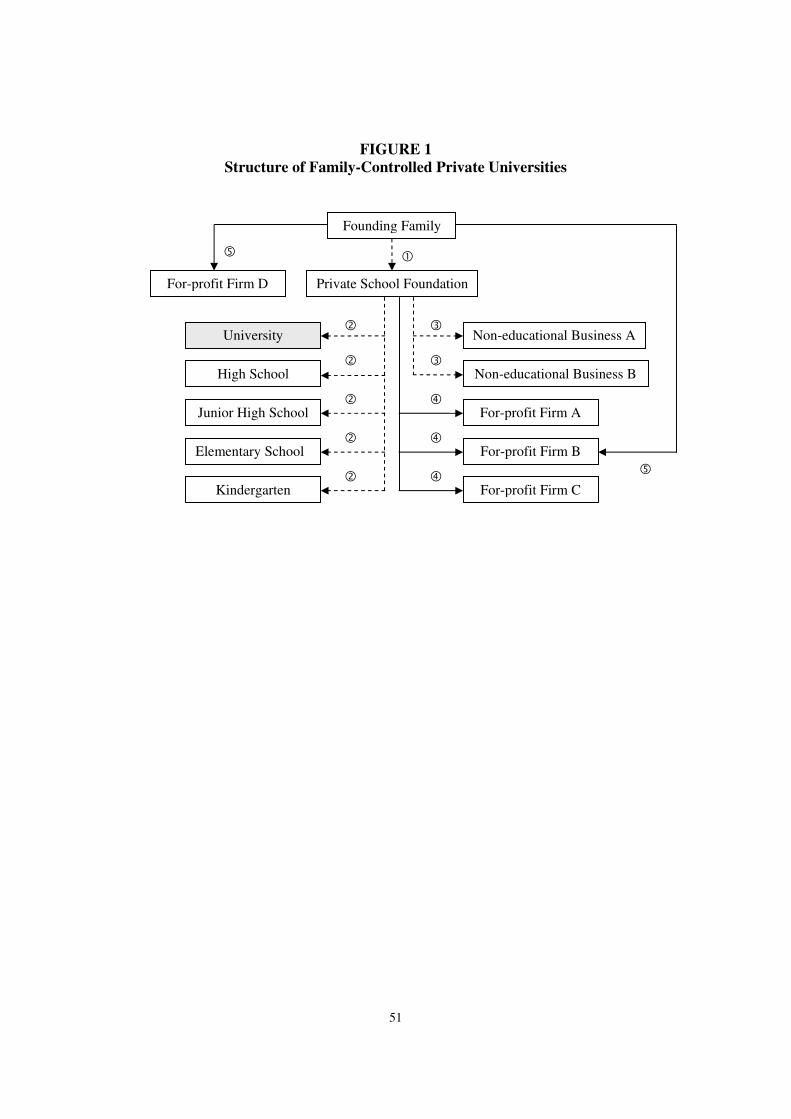
51
FIGURE 1
Structure of Family-Controlled Private Universities
Founding Family
Private School Foundation
University
High School
Junior High School
Elementary School
Kindergarten
Non-educational Business A
Non-educational Business B
For-profit Firm A
For-profit Firm B
For-profit Firm C
For-profit Firm D
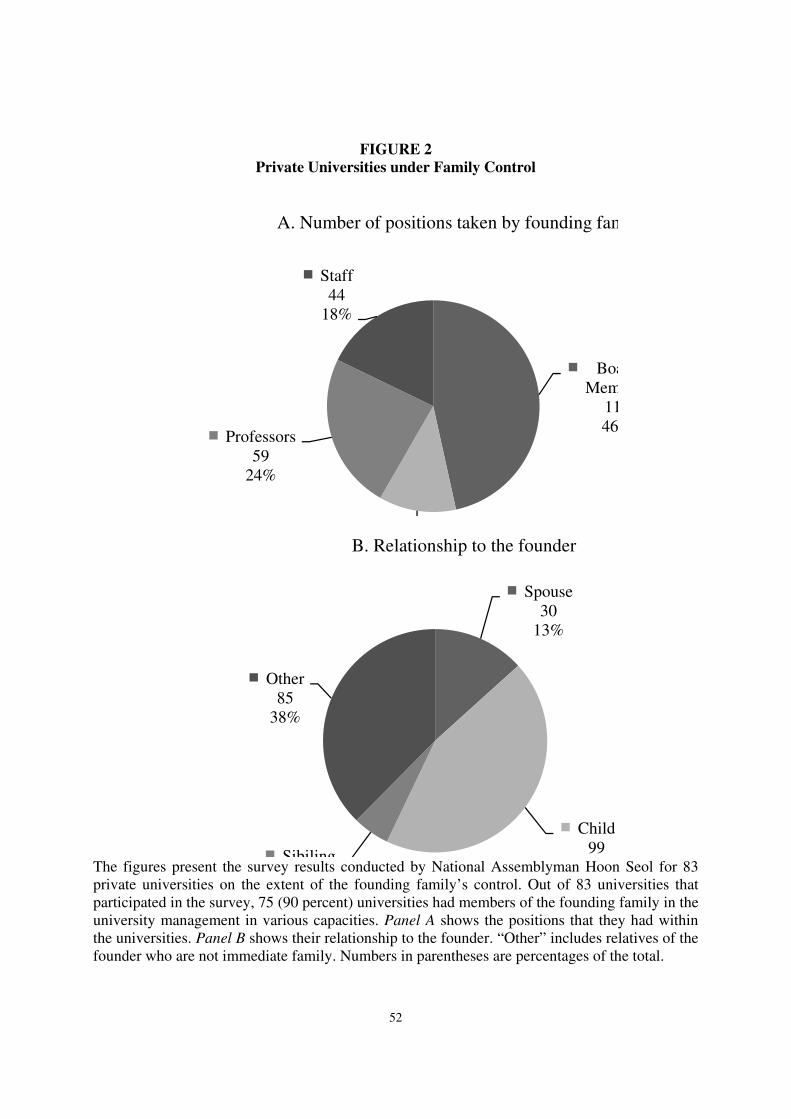
52
FIGURE 2
Private Universities under Family Control
Boa
Mem
11
46Professors
59
24%
Staff
44
18%
A. Number of positions taken by founding fam
Spouse
30
13%
Child
99Sibiling
Other
85
38%
B. Relationship to the founder
The figures present the survey results conducted by National Assemblyman Hoon Seol for 83
private universities on the extent of the founding family’s control. Out of 83 universities that
participated in the survey, 75 (90 percent) universities had members of the founding family in the
university management in various capacities. Panel A shows the positions that they had within
the universities. Panel B shows their relationship to the founder. “Other” includes relatives of the
founder who are not immediate family. Numbers in parentheses are percentages of the total.