
Health and Safety Executive
Health and Safety Executive
The current picture
Tony Mitchell
Safety section

Agricultural Transport – Key figures 2001-2006
• 74 Transport fatals (14 so far 2007-08)
• 32% of all ag fatals
• 597 reported accidents–74 fatal–284 major–239 3-day

Agricultural Transport – Key figures 2001-2005
Employees Self-employed Public Total
All Workplaces (HSE/LA)
172 42 35 249
Agriculture 26 31 7 64
Proportion (Fatals) 15% 74% 20% 26%
Proportion (all Riddor) 2.5%

Transport fatals – actuals (13/11/07)
15
8
10
16
17
5
14
0
2
4
6
8
10
12
14
16
18
2001-02 2002-03 2003-04 2004-05 2005-06 2006-07 2007-08p
year
nu
mb
er

Fatal accidents – current vs mean
0.00
0.50
1.00
1.50
2.00
2.50
3.00
3.50
Apr May Jun Jul Aug Sep Oct Nov Dec Jan Feb Mar
2001-07 mean
2007-08p

Other work in progress

Time of year - kind
Accident kind by month
0
5
10
15
20
25
30
35
40
Apr May Jun Jul Aug Sep Oct Nov Dec Jan Feb Mar
2001-06 fall
2001-06 material
2001-06 collapse
2001-06 SB

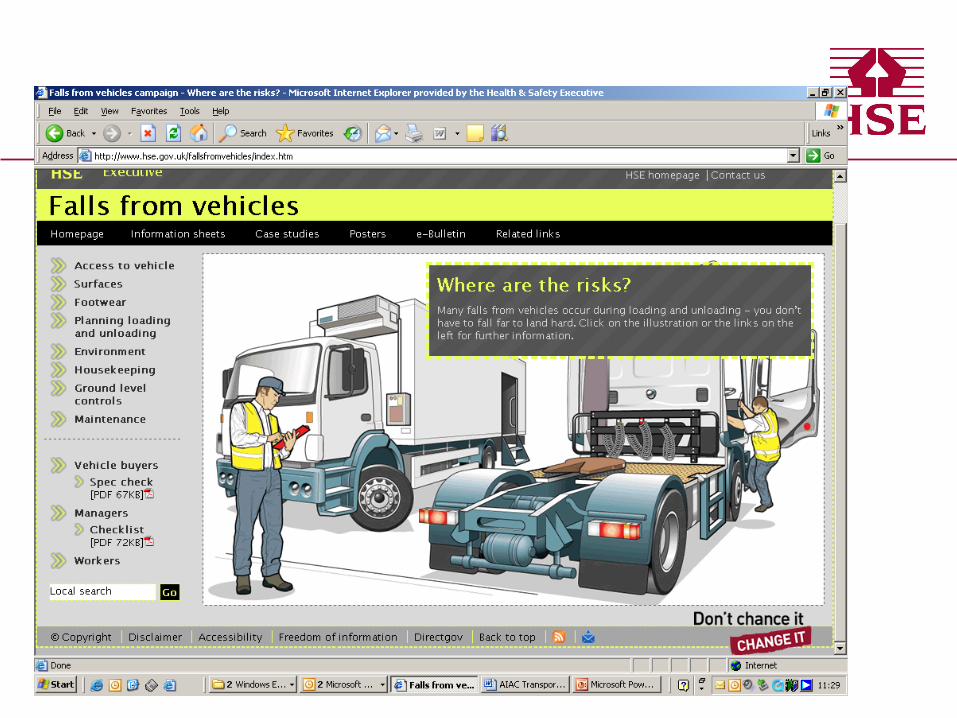
Current campaign – falls from vehicles
There are three key areas that cause most incidents in agriculture:
1. Carrying passengers in unsafe positions
2. Falls from vehicles during loading and unloading or maintenance – plan work and use suitable access equipment.
3. Slips/trips mounting tractors or mobile machines – you don’t have to fall far to fall hard!


